Embed Size (px)
Citation preview

RESEARCH ARTICLE Open Access
RNA-Seq improves annotation of protein-codinggenes in the cucumber genomeZhen Li1†, Zhonghua Zhang2†, Pengcheng Yan1, Sanwen Huang2, Zhangjun Fei3 and Kui Lin1*
Abstract
Background: As more and more genomes are sequenced, genome annotation becomes increasingly important inbridging the gap between sequence and biology. Gene prediction, which is at the center of genome annotation,usually integrates various resources to compute consensus gene structures. However, many newly sequencedgenomes have limited resources for gene predictions. In an effort to create high-quality gene models of thecucumber genome (Cucumis sativus var. sativus), based on the EVidenceModeler gene prediction pipeline, weincorporated the massively parallel complementary DNA sequencing (RNA-Seq) reads of 10 cucumber tissues intoEVidenceModeler. We applied the new pipeline to the reassembled cucumber genome and included a comparisonbetween our predicted protein-coding gene sets and a published set.
Results: The reassembled cucumber genome, annotated with RNA-Seq reads from 10 tissues, has 23, 248 identifiedprotein-coding genes. Compared with the published prediction in 2009, approximately 8, 700 genes revealstructural modifications and 5, 285 genes only appear in the reassembled cucumber genome. All the relatedresults, including genome sequence and annotations, are available at http://cmb.bnu.edu.cn/Cucumis_sativus_v20/.
Conclusions: We conclude that RNA-Seq greatly improves the accuracy of prediction of protein-coding genes inthe reassembled cucumber genome. The comparison between the two gene sets also suggests that it is feasibleto use RNA-Seq reads to annotate newly sequenced or less-studied genomes.
BackgroundAs new sequencing technologies develop, thousands ofeukaryotic genomes across all kingdoms of life will besequenced during the next decade [1,2], and this trendwill spark an improvement in our knowledge of evolu-tionary biology and functional genomics. Genome anno-tation is a stepping stone to bridge the gap betweengenomic sequences and the biology of organisms [3]. Itcan be stated that the quality of genome annotationsrepresents the value of genome sequences.Gene prediction, within the process of genome annota-
tion, is a complex endeavor. In eukaryotic species, it isusually carried out by integrating multiple sources of evi-dence [4], such as complementary DNA (cDNA), proteinsin closely related species, and de novo predictions [5].Representing the integral sequences of messenger RNAs
(mRNAs), full-length cDNAs (FL-cDNAs) are recognizedas the gold-standards for discovering and annotating genestructures in eukaryotic genomes [5,6]. Additionally, evenincomplete cDNAs, i.e. expressed sequence tags (ESTs),provide more accurate evidence than other sources.Nevertheless, until recently, the sequencing of cDNA wasa laborious and capital-intensive task.Thanks to the massively parallel cDNA sequencing
(RNA-Seq) technologies [7], scientists can obtain cDNAfragments from transcriptomes with reasonably completecoverage in a reduced time scale and at a lower cost [8].With its informative content, RNA-Seq is expected torevolutionize the prediction of genes [9]. RNA-Seq hasbeen used to improve the genome annotations, including:(i) correcting predicted gene structures [10]; (ii) detectingnew alternative splicing isoforms [11]; and (iii) discover-ing new genes and new transcripts [12,13]. However,most of these applications focused on species with well-annotated genomes, such as human, mouse, yeast, Arabi-dopsis thaliana, and rice. Among these studies, Trapnell,Williams and Pertea et al. and Guttman, Garver and
* Correspondence: [email protected]† Contributed equally1College of Life Sciences, Beijing Normal University, 19 Xinjiekouwai Street,Beijing, 100875, ChinaFull list of author information is available at the end of the article
Li et al. BMC Genomics 2011, 12:540http://www.biomedcentral.com/1471-2164/12/540
© 2011 Li et al; licensee BioMed Central Ltd. This is an Open Access article distributed under the terms of the Creative CommonsAttribution License (http://creativecommons.org/licenses/by/2.0), which permits unrestricted use, distribution, and reproduction inany medium, provided the original work is properly cited.

Levin et al. correctly reconstructed full-length transcriptsfor most known expressed genes in specific mouse tissues[12,13]; nevertheless, their procedures still need to betested in other eukaryotic genomes, because of variedgenome characteristics [8]. For less-studied genomes,Denoeud, Aury and Da Silva et al. used the short RNA-Seq reads to build thousands of gene models for thegrape genome [14]; however, fewer genes were predictedthan in the public annotation [15].Although far from perfect, the considerable potential
demonstrated in these studies for the applicability ofRNA-Seq in gene predictions encourages us to update theoriginal gene prediction of the cucumber genome (Cucu-mis sativus var. sativus line 9930), which was annotatedand published in 2009 [16]. Therefore, based on EVidence-Modeler (EVM) [17], we built a genome annotation pipe-line in which we incorporated analyses of Solexa/IlluminaRNA-Seq reads. In an attempt to provide a high-qualitygene set for the scientific community and for furtherstudy, we reassembled and reannotated the cucumber gen-ome. We subsequently compared the two versions of thegene predictions to evaluate any improvements broughtabout by RNA-Seq. The comparison presented here sup-ports the hypothesis that RNA-Seq has a positive impacton gene prediction of the cucumber genome.
Results and DiscussionGenome reassemblyUsing the improved SOAPdenovo program [18] (Release1.04), we reassembled the cucumber genome by integrat-ing additional large insert paired-end Illumina GA readsfrom Cucumis sativus var. sativus (7.4-fold genome cov-erage, 5 Kb insert size) and from Cucumis. sativus var.hardwickii (3.8-fold, 5 Kb insert size; 3.2-fold, 10 Kbinsert size; see Additional file 1, Table S1 for details). Thefinal assembly (assemVer 2.0) spans 197 Mb and contains12, 845 scaffolds (see Additional file 1, Table S2 fordetails). This is approximately 46 Mb less than the pre-vious assembly (assemVer 1.0) and this difference mostlyrepresents redundant repetitive sequences and contami-nating sequences. The N50 and N90 contig sizes ofassemVer 2.0 are 37.9 Kb and 8.9 Kb, respectively, and90% of the assembly falls into 153 scaffolds larger than281 Kb. Compared to assemVer 1.0, assemVer 2.0 ismore contiguous, thus facilitating genome annotation.
Reconstructing transcripts from RNA-Seq by de novoassembly and ‘align-then-assemble’ approachesWe obtained about 220 million Solexa/Illumina RNA-Seqreads from poly(A) RNAs extracted from 10 cucumbertissues (Table 1).Two different approaches, de novo assembly and ‘align-
then-assemble’ [8], were used to reconstruct transcriptsfrom these RNA-Seq reads. The de novo assembly was
carried out by Inchworm, a de novo assembler of RNA-Seq in Trinity [19], which reconstructed 802, 216 de novocontigs from the 10 tissues (Table 1). We appliedCD-HIT [20] to remove some de novo contigs, such asassembled artifacts with low-coverage or redundanciesfrom different tissues. Finally, 258, 876 de novo contigsassembled by RNA-Seq reads remained for gene predic-tion. In the ‘align-then-assemble’ approach, we mappedand generated spliced alignments of the RNA-Seq readsfrom each tissue to the reassembled cucumber genomeusing Bowtie [21] and TopHat [22] (Table 1; Additionalfile 1, Table S3 for mapping details of reads). Cufflinks[13] was then used to reconstruct 220, 590 transcriptsbelonging to 59, 481 transcriptional units from the align-ments of 10 tissues. However, a complete open readingframe (ORF) could be found in only 9, 964 (4.5%) tran-scripts reconstructed by Cufflinks using getorf inEMBOSS [23].
Reannotation of the cucumber genomeThe reassembled cucumber genome (assemVer 2.0) con-tains 23, 248 protein-coding genes with 25, 600 tran-scripts (Table 2), 621 tRNAs, 20 rRNA, 157 snRNAs, 201snoRNAs, 1, 025 miRNAs (Additional file 1, Table S4)and 217, 826 transposable elements (Additional file 1,Table S5). This version of the annotation is labeledas annotVer 2.0 (available at http://cmb.bnu.edu.cn/Cucumis_sativus_v20/).Compared with the published annotation of the
cucumber genome (labeled as annotVer 1.0, Table 2),annotVer 2.0 contains 3, 434 fewer protein-codinggenes, mostly because of the reduced size of the reas-sembly and the removal of some contaminating bacterialsegments implied by about 2, 000 bacterial genes inannotVer 1.0. Consistent with the reduction of genenumber in annotVer 2.0, there is an increase in thenumber of multi-exon genes, which indicates animprovement of the protein-coding prediction to someextent, because the prediction of single-exon genes isstill unreliable in eukaryotic genomes.Two other improvements resulting from the incorpora-
tion of RNA-Seq are the prediction of untranslated regions(UTRs) and alternative splicing isoforms. Of the 23, 248protein-coding genes in annotVer 2.0, 18, 690 genes haveUTRs and 1, 935 genes appear to have alternative splicingisoforms. In general, incorporating RNA-Seq reads offersoverwhelming evidence for the prediction of these two fea-tures. The prediction of UTRs was uncertain before theappearance of RNA-Seq, because of the incompleteness ofESTs and the difficulty of collecting bona fide FL-cDNAs.Furthermore, because they are not well conserved acrossspecies, comparative predictive techniques are not suitedto UTR detection. However, the use of high-throughputRNA-Seq from the same species naturally removes both of
Li et al. BMC Genomics 2011, 12:540http://www.biomedcentral.com/1471-2164/12/540
Page 2 of 11
these difficulties. Similarly, RNA-Seq provides evidencepointing to the potential for alternative splicing, though itis still quite difficult to determine full-length isoformsfrom these short reads. With the help of de novo
assemblies and PASA assemblies [24], 2, 352 full-lengthisoforms of 1, 935 genes were identified. RNA-Seq pro-vides an opportunity to comprehensively study alternativesplicing events in cucumber, as in other species.
Table 1 Number of de novo assemblies and “align-then-assembled” transcripts
Tissues # RNA-Seq reads # De novo assembled transcripts Mapped reads # “Align-then-assembled” transcripts
Ovary 19, 247, 768 86, 994 17, 656, 392 (91.7%) 52, 530
Fertilized ovary 18, 466, 067 81, 650 17, 047, 763 (92.3%) 50, 987
Unfertilized ovary 19, 111, 746 84, 628 17, 394, 685 (91.0%) 52, 003
Root 18, 732, 466 86, 572 17, 162, 238 (91.6%) 52, 167
Stem 24, 535, 215 71, 977 22, 789, 659 (92.9%) 45, 710
Leaf 26, 400, 675 79, 344 24, 405, 569 (92.4%) 49, 351
Male flower 26, 050, 858 83, 957 24, 531, 662 (94.2%) 51, 630
Female flower 23, 818, 868 85, 345 21, 886, 487 (91.9%) 51, 701
Tendril 22, 472, 146 71, 489 20, 585, 234 (91.6%) 44, 658
Base part of tendril 21, 653, 855 70, 260 19, 556, 866 (90.3%) 44, 995
Table 2 Summary statistics and annotation comparison of cucumber genome
Genome assemVer 1.0 assemVer 2.0 assemVer 2.0
Size (bp) 243, 568, 484 197, 271, 687 197, 271, 687
GC Content 31.50% 31.86% 31.86%
Genes annotVer 1.0 annotVer 1.0 (mapped) annotVer 2.0
Number of Genes 26, 682 20, 923 23, 248
Number of Genes on Plus Strand 13, 331 10, 488 11, 656
Number of Genes on Minus Strand 13, 351 10, 435 11, 592
Mean Gene Length (bp) 2, 685 2, 966 3, 213
Gene density (Kb/gene) 9.1 9.4 8.5
Number of Transcripts 26, 682 20, 923 25, 600
Percent of Transcripts with Introns 69.37% 74.36% 81.55%
Mean Transcript Length (bp) 2, 685 2, 966 3, 314
Mean CDS Length 1, 046 1, 095 1, 134
Percent Coding 11.49% 11.64% 14.75%
Exons annotVer 1.0 annotVer 1.0 (mapped) annotVer 2.0
Number 117, 116 100, 721 136, 008
Mean Number per Transcript 4.39 4.81 5.31
GC Content 44.96% 43.73% 42.03%
Mean Length (bp) 239 228 270
Total Length (bp) 27, 991, 662 22, 988, 520 36, 686, 879
Introns annotVer 1.0 annotVer 1.0 (mapped) annotVer 2.0
Number 90434 79, 798 110, 408
Mean Number per Transcript 3.39 3.81 4.31
GC Content 32.18% 32.37% 32.44%
Mean Length (bp) 483 490 436
Total Length (bp) 43, 647, 564 39, 074, 873 48, 152, 435
UTRs annotVer 1.0 annotVer 1.0 (mapped) annotVer 2.0
Number of Genes Having UTRs NA NA 18, 690
Mean UTR Length (bp) NA NA 234
Number of 5’ UTRs NA NA 15, 703
Mean 5’ UTR Length (bp) NA NA 175
Number of 3’ UTRs NA NA 16, 737
Mean 3’ UTR Length (bp) NA NA 289.08
Li et al. BMC Genomics 2011, 12:540http://www.biomedcentral.com/1471-2164/12/540
Page 3 of 11

Evidence Support for multi-exon genesFor the 18, 580 multi-exon genes in annotVer 2.0, weinspected different sources of evidence for them, and theresults suggested that most of the multi-exon genes weresupported by reliable evidence, such as transcript evidenceor protein evidence [5]. In fact, there are three sources ofevidence in our pipeline: transcript evidence from RNA-Seq or ESTs, proteins from related species, and predictionsfrom de novo predictors (see Methods), which actually pro-vided introns in the final gene structures [17]. We did notinclude the predictions of Augustus [25] and Geneid [26]in this analysis because the two predictors had used RNA-Seq information and homologous proteins, respectively.Our analysis shows that most of the multi-exon genes
are supported by reliable evidence, such as transcripts orproteins. In Figure 1.A, 16, 270 (87.5%) multi-exon genesare supported either by transcript evidence or proteinevidence, while 12, 049 (64.8%) genes are supported byall three kinds of evidence. To check which evidence hasa more positive effect on the gene prediction, we tracedthe sources of evidence for full-length supported genes,because full-length-supports, for single gene prediction,ensure the accuracy of the gene structural prediction.Herein, a gene that is supported by one type of evidenceis termed as full-length supported gene if all of the gene’sintrons are fully supported by the evidence. As expected,transcript evidence from RNA-Seq or ESTs supportedmore full-length genes than the other two kinds of evi-dence for multi-exon genes in annotVer 2.0 (Figure 1.B).In fact, 13, 342 (71.8%) multi-exon genes are full-lengthsupported genes when supported by transcript evidence,while 10, 528 (56.7%) genes and 7, 447 (40.1%) genes arefully supported by de novo predictions and protein evi-dence, respectively.De novo predictions are also necessary for gene predic-
tions. Although RNA-Seq has a high coverage, de novopredictions actually support more multi-exon genes thando transcripts (Figure 1.A), because of the large number ofgenes generated by the three de novo predictors, for exam-ple, GeneMark.hmm-ES predicted more than 40, 000genes. Furthermore, about one tenth of the multi-exongenes (2, 003/10.8%) are supported only by de novo predic-tions, which indicates that de novo predictions are indis-pensable to the completeness of the final gene sets.As transcript evidence plays a considerable role in the
multi-exon gene prediction, we examined the contribu-tions of RNA-Seq to the final gene set, especially whencompared with ESTs. Figure 1.C shows that most of theESTs are covered by RNA-Seq and none of the multi-exon genes are supported only by ESTs. Despite the factthat one gene in Figure 1.D is full-length supported byone EST, we maintain that RNA-Seq could replace ESTsin the process of protein-coding gene prediction.
Evidential support for multi-exon genes suggests thatRNA-Seq has an innate capability for high coverage inprotein-coding gene predictions. Transcript evidence istaken as the most valuable evidence in protein-codinggene prediction, as it often identifies exact intronic bound-aries [6]. RNA-Seq, among all the transcript evidence thataffects gene prediction, is the one that could increase thenumber of genes supported by transcript evidence andimprove the structural predictions. RNA-Seq could also beused in place of ESTs as the major transcript evidence,which liberates scientists from time-consuming work intraditional cDNA sequencing projects. Although RNA-Seqstill could not replace the role of FL-cDNA in gene discov-ery, sophisticated methods of transcript reconstructionthrough RNA-Seq in the near future may help us toreconstruct more full-length transcripts.
Improvements of protein-coding gene predictionThe prediction of protein-coding genes has many differentfeatures in annotVer 2.0, such as longer transcripts andcoding sequences (CDS), more and longer exons, andmore and shorter introns (Table 2). To analyze the genestructural differences between annotVer 1.0 and annotVer2.0, we mapped the CDSs of annotVer 1.0 to the genome,assemVer 2.0, by spaln [27]. Of 23, 216 CDSs having a hit,20, 923 CDSs matched complete gene structures with startand stop codons. Some of the 20, 923 CDSs mapped tothe same gene loci in assemVer 2.0, indicating that someredundancies in the original assembly have been removedin assemVer 2.0 (see Additional file 1, Figure S1 for exam-ple). The comparison of gene predictions is illustrated inFigure 2, in which 18, 328 genes in annotVer 1.0 fall into17, 963 gene loci in annotVer 2.0. The structures of 9, 589genes in annotVer 1.0 are consistent with the structures of9, 338 genes in annotVer 2.0. The different number ofconsistent gene structure in the two versions results frommapping of two or more genes at one locus, as mentionedabove. Figure 2 also illustrates 2, 595 genes in annotVer1.0 and 5, 285 genes in annotVer 2.0 that are located indifferent loci in the reassembled cucumber genome. Tofurther compare the difference of the two gene sets, weperformed four analyses, which all suggest that annotVer2.0 is better than annotVer 1.0.The first analysis concerned merged or split gene struc-
tures, which map to the same locus but with differentgene numbers in the two versions (Additional file 1, FigureS2). We found that 1, 666 genes in annotVer 1.0 mergedinto 799 genes in annotVer 2.0, and 750 genes in annotVer1.0 split into 1, 589 genes in annotVer 2.0. To discriminatebetween true and false positive merged/split events, wesearched each group of genes in one locus against UniProtplant proteins using BLASTP [28]. Each group of geneshas one merged gene in one version and several split
Li et al. BMC Genomics 2011, 12:540http://www.biomedcentral.com/1471-2164/12/540
Page 4 of 11

genes in the other. The number and consistency of hits forthe split members decided whether a merged/split event isoptimal (see Methods). Figure 3.A illustrates that the num-ber of optimal merged/split events in annotVer 2.0 isgreater than in annotVer 1.0.The second analysis focused on genes at the same locus
but with different structures (see Additional file 1, FigureS3 for example). There are 5, 824 pairs of genes, each ofwhich was composed of an annotVer 1.0 and annotVer2.0 gene that only map to each other, but are structurallydifferent. We then launched a Pfam domain search byInterProScan [29] and performed the global pairwise
alignments by stretcher in EMBOSS [23] on each pair(see Methods). The search of InterProScan found 1, 817different kinds of Pfam domains in 4, 297 (73.8%) genesin annotVer 1.0, whereas, 1, 861 different Pfam domainswere found in 4, 399 (75.5%) genes in annotVer 2.0. Inthe same way, when identity, similarity, score, and gapsin alignments are compared, global pairwise alignmentsalso suggests that genes in annotVer 2.0 are more opti-mal than genes in annotVer 1.0 (Figure 3.B).In the third analysis, the presence of non-overlapped
locus protein-coding genes implies specific genes in differ-ent predicted gene sets. To measure the reliability of
Figure 1 Venn diagram for sources of evidence for multi-exon gene prediction. The different colors indicate various sources of evidence,and the numbers are the number of gene models supported by each kinds of evidence. A. Evidence support for predicted genes; B. Evidencesupport for full-length supported genes; C. Comparison of contributions of RNA-Seq and ESTs to genes; D. Comparison of contributions of RNA-Seq and ESTs to full-length supported genes.
Li et al. BMC Genomics 2011, 12:540http://www.biomedcentral.com/1471-2164/12/540
Page 5 of 11

Figure 2 Venn diagram for protein-coding gene structural changes. Venn diagram showing the comparative analysis of gene structures(regardless of UTRs). The number in the overlapped region represents the number of genes with the same structures; the two numbers in thecircles with the solid lines are the number of genes with the same loci but different structures; the two numbers in the dashed circles are thenumber of specific genes predicted by annotVer 1.0 and annotVer 2.0 respectively.
Figure 3 Structural prediction improvement in annotVer 2.0. Comparisons of merged/split events and global alignments between geneswith different structures in annotVer 1.0 and annotVer 2.0. A. Blue bars, genes falsely merged/split in annotVer 2.0; red bars, genes optimallymerged/split in annotVer 2.0. B. Blue bars indicate genes predicted in annotVer 1.0 and annotVer 2.0 giving exactly the same result; red barsindicate genes in annotVer 1.0 that have better statistics than their counterparts in annotVer 2.0; and green bars indicate genes in annotVer 2.0that have better statistics compared with their counterparts with different structures in annotVer 1.0.
Li et al. BMC Genomics 2011, 12:540http://www.biomedcentral.com/1471-2164/12/540
Page 6 of 11
version specific genes in the two sets, we compared thepercentages of BLASTP hits to UniProt plant proteins andmulti-exon genes between annotVer 1.0 and annotVer 2.0.The BLASTP results indicated that the prediction ofannotVer 2.0 produces more genes and a higher percen-tage of hits (3, 134, 59.3%) to UniProt than annotVer 1.0(684, 26.4%). Meanwhile, the specific genes in annotVer2.0 contain a significantly higher percentage of multi-exontranscripts (4, 385, 77.8%) than those in annotVer 1.0 (1,216, 46.9%).Finally, a small dataset of 33 WRKY genes and 35
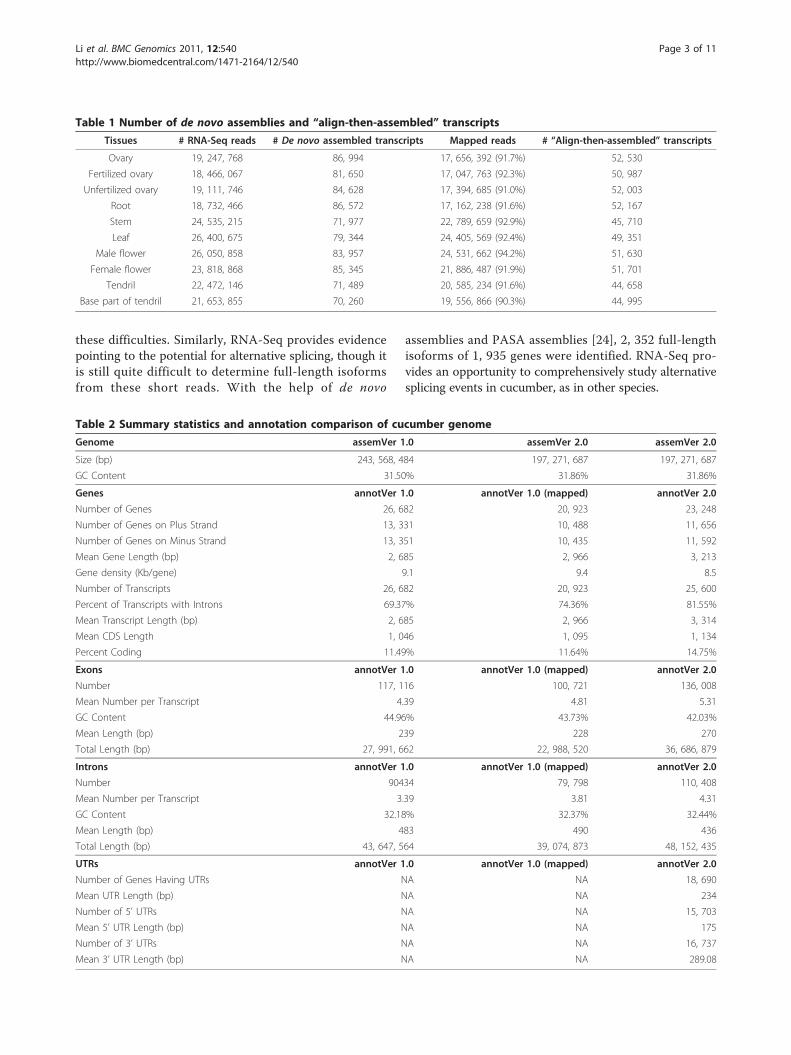
WRKY gene assemblies generated in an experimentalstudy [30] gave us an opportunity to directly compare theaccuracy of the two gene predictions. We aligned the 33WRKY genes and 35 assemblies to the newly assembledgenome of cucumber using spaln [27] and mapped out
32 loci, where WRKY9 and WRKY10 aligned to the samelocus due to the change in assembly. The prediction inannotVer 1.0 missed 2 loci of WRKY genes and predictedonly 22 WRKY genes with the same structures as theexperimental data. By contrast, annotVer 2.0 only missed1 WRKY gene and 26 of them had structures consistentwith the experimental data. Even though five WRKY genestructures in annotVer 2.0 are different from the experi-mental data, one of them, which is supported by proteinevidence, shows a better structure than the experimentaldata (Figure 4). In this example, the experimental data isconsistent with annotVer 1.0, but the transcripts recon-structed by RNA-Seq, ESTs and homologous proteins allindicate an extra exon at the 5’ end, whereas a single-exon gene is predicted by annotVer 1.0. Although thefirst exon boundary is different in the two isoforms, they
Figure 4 An example of WRKY gene prediction. An example of WRKY gene prediction with and without RNA-Seq reads. Green tracks are theWRKY genes predicted in annotVer 2.0. Yellow tracks are the WRKY genes predicted in annotVer 1.0. The purple track is the GeneWise alignmentof proteins and the red track is shown for the transcripts generated by PASA from de novo contigs. The orange track shows the transcriptsreconstructed by ‘align-then-assemble’ approach implemented by Cufflinks and the dark red track illustrates de novo contigs and ESTs ofcucumber aligned by spaln. The blue track is the FL-cDNA of the cucumber WRKY assembly and gene aligned by spaln, and the two pink tracksare proteins and ESTs aligned by spaln.
Li et al. BMC Genomics 2011, 12:540http://www.biomedcentral.com/1471-2164/12/540
Page 7 of 11
are supported either by GeneWise or transcript evidence.Thus in this case, two genes in annotVer 1.0 are mergedinto one gene with two isoforms when predicted inannotVer 2.0.In all four analyses, annotVer 2.0 shows a better perfor-
mance than annotVer 1.0. Although the processes of gen-eration of the two gene sets are different (Glean forannotVer 1.0 [16]), they are comparable, because the prin-ciples of evidence combination are nearly the same. Infact, annotVer 2.0 used less protein evidence and homologEST evidence than did annotVer 1.0 [16]; however, usingRNA-Seq compensates for this minor deficiency and actu-ally obtains a better gene set. Thus, adopting the RNA-Seqtechnique proved to be vital to the quality of protein-cod-ing gene prediction in the reassembled cucumber genome.
ConclusionsA genome project requires continual refinement, evenafter the publication of its genome sequence. Some pro-blems, such as bacterial DNA contamination duringgenome sequencing and redundancy of repetitive DNAsequences, were found in the first assembly of thecucumber genome; therefore, we reassembled thecucumber genome. After RNA-Seq evidence of tran-scription was generated, we improved the prediction ofprotein-coding genes in the reassembled cucumber gen-ome, based upon the RNA-Seq reads. In the new assem-bly, about 8, 700 protein-coding gene structures aremodified and about 5, 200 genes are newly predicted.Based upon the comparison of the gene sets of the twoversions, we conclude that the considerable improve-ment in protein-coding gene prediction is largely due tothe use of the RNA-Seq technique. We also suggestthat, for newly sequenced or less-studied eukaryoticgenomes, RNA-Seq is a good choice for providing evi-dence for prediction of protein-coding genes, as itreduces the necessity for EST sequencing and increasesthe utility of each round of genome annotation.
MethodsGenome reassemblyTo link more contigs, we sequenced additional long insertsized (5 kb) paired-end Illumina GAII reads of Cucumissativus var. sativus, representing approximately 7.4-foldgenome coverage.We first assembled paired-end short reads with short
insert sizes (insert size < 1 kb) into contigs. To increasethe assembly accuracy, only high quality reads were con-sidered. These contigs were further linked into scaffoldsby paired-end relationships (300-550 bp insert size), mate-pair reads (2-10 kb), fosmid ends (~40 kb), and BAC ends(~100 kb). We then filled gaps in all the reads generatedby both Illumina GAII and Sanger methods.
During the process of linking contigs to scaffolds,paired-end reads with long insert sizes (approximately3.8-fold genome coverage, 5 Kb insert size; approxi-mately 3.2-fold, 10 Kb insert size) from wild cucumber(Cucumis sativus var. hardwickii) were also used.
RNA-Seq experimentCucumis sativus var. sativus line 9930 was used in allexperiments. A total of 10 tissues were collected: root,stem, leaf, male flower, female flower, ovary, expandedovary under fertilization (7 days after flowering),expanded ovary not fertilized (7 days after flowering),base part of tendril, and tendril. In accordance with themanufacturer’s instructions, total RNA was isolated withTRIzol (Invitrogen, Carlsbad, CA, USA) from each sam-ple. Samples were treated with RNase-free DNase I for30 minutes at 37°C (New England BioLabs, Ipswich, MA,USA) to remove residual DNA. The OligoTex mRNAmini kit (QIAGEN, Hilden, Germany) was used to isolatepoly(A) mRNA from the total RNA samples. The firstcDNA strand was synthesized using random hexamerprimers and reverse transcriptase (Invitrogen). The sec-ond strand cDNA was synthesized using RNase H (Invi-trogen) and DNA polymerase I (New England BioLabs).The sequencing library was constructed following themanufacturer’s instructions (Illumina, San Diego, CA,USA). Fragments of approximately 200 bp were excisedand enriched by 18 cycles of PCR. The fragments wereloaded onto flow cell channels at a concentration of 2pM to generate paired-end reads with lengths of 75 bp.The Illumina GA processing pipeline v0.2.2.6 was usedfor image analysis and base calling. The data is obtainablewith the accession number SRA046916 in the SequenceRead Archive (SRA) at NCBI.
Reconstructing transcriptsDe novo assembly was carried out by Inchworm [19],which utilizes the Kmer graph method to assemble Illu-mina RNA-Seq reads. Although it prefers strand-specificRNA-Seq reads, Inchworm can also deal with the non-strand-specific RNA-Seq reads generated from theRNA-Seq experiments. Low-coverage artifacts or redun-dancies from different tissues were removed by CD-HIT[20], with an identity threshold of 95%.In the ‘align-then-assemble’ approach, we firstly mapped
the RNA-Seq reads from each tissue to the reassembledcucumber genome using Bowtie [21] and the splicedaligner TopHat [22]. Cufflinks [13] assembled the resultsof TopHat into transcript assemblies, followed by the inte-gration of transcript assemblies from different tissues.Transcripts that were shorter than 150 bp were deemed asfalse positives and removed before gene prediction. Weused getorf in EMBOSS [23] to find ORFs in the
Li et al. BMC Genomics 2011, 12:540http://www.biomedcentral.com/1471-2164/12/540
Page 8 of 11
transcripts. Only ORFs with start and stop codons wereregarded as complete ORFs.
Genome reannotationRepeatMasker masked the repeat elements in the newlyassembled genome using a custom library. The customlibrary included: (i) Repbase [31]; (ii) TIGR plant repeatdatabase [32]; and (iii) a cucumber de novo transposableelement library built in-house. Three types of de novo soft-ware, PILER-DF [33], RepeatScout [34], and LTR_Finder[35] were used to predict species-specific transposable ele-ment sequences in the cucumber genome. PILER-DF andRepeatScout were used for the repeat sequences incucumber assembly. Based on the cucumber assembly,full-length LTR retrotransposons were identified usingLTR_Finder. We filtered repeat elements belonging torRNA, satellites, and organellar sequences by BLASTN.Elements belonging to high-copy number genes were fil-tered by BLASTX searching of UniProt-SwissProt (release2010_07). After removing redundant repeat elements byall-versus-all BLASTN and manual curation, the de novoTE library for cucumber was obtained.We used spaln [27] and PASA [24] to align 90, 307
cucumber ESTs sequenced by Guo, Zheng and Joung et al[36], 260 cucumber FL-cDNAs downloaded from NCBI,and transcripts reconstructed by Inchworm [19]. Theresult of ‘align-then-assemble’ procedure was also directlyused as transcript evidence. PASA strictly aligns EST orcDNA sequences to the genome and assembles the alignedsequences into transcripts called ‘PASA assemblies’. ORFsare found from these PASA assemblies as a training set.We selected genes with complete structures and removedsome redundant genes with 70% identity at the amino acidlevel by CD-HIT [20].Five de novo gene predictors were used on the masked
genome. GlimerHMM [37], SNAP [38], and Augustus[25] were trained with the training set generated byPASA; Geneid [26] used the parameter of Cucumis spp.;and GeneMark.hmm-ES [39] only used unmasked geno-mic data and was self-trained.The dataset used for protein homology alignment
included: (i) UniProt-SwissProt plant proteins (release2010_07); (ii) Arabidopsis thaliana proteins (TAIR9,Augustus 2009 release); and (iii) Oryza sativa proteins(TIGR Release 5.0, January 2007 release). We used spaln[40], TBLASTN [28] and BLAT [41] to search for nucleo-tide homology in the cucumber genome. Scipio [42] madeuse of the BLAT result to identify intron-exon boundaries.Proteins with the highest score in TBLASTN were pro-cessed by BLAST2GENE [43] to predict gene structuresby GeneWise [44].EVM, which is an effective automated annotation com-
biner [17], computed the gene structures for the reas-sembled genome of cucumber as a weighted consensus
of all available evidence obtained above. The gene modelsgenerated by EVM were updated by PASA with ESTs andde novo assembled transcripts. This process modifiedexons or gene models, added UTRs, and found alterna-tively spliced isoforms. Finally, we removed genes encod-ing proteins with less than 50 amino acids andincomplete genes without start and stop codons. Genemodels and the different evidence were visualized byGBrowse [45].Three non-coding RNA gene predictors were used
independently to identify different types of non-codingRNA genes in the cucumber genome. tRNA-SE [46] wasused to identify tRNA genes. Snoscan [47] was used toidentify C/D-box small nucleolar RNAs. INFERNAL[48] searches against the Rfam [49] database identifiedmiRNAs, small nuclear RNAs, and H/ACA-box smallnucleolar RNAs.
Comparing gene structural predictionIn annotVer 1.0, 26, 882 CDSs were aligned to the reas-sembled cucumber genome by spaln [27] and genestructures that have less than 50 amino acids or withoutstart and/or stop codons were removed.During the comparison, only the coding regions were
considered, because the UTRs had more changes betweenthe two versions. Genes with at least one base pair over-lapping the coding region were assumed to occupy thesame gene locus. If genes occupying the same gene locushad different structures in all alternative spliced isoforms,they were viewed as genes with different structures. Wefiltered genes with alternative spliced isoforms to simplifyfurther analyses.When genes mapped to the same locus but with differ-
ent numbers in the two gene sets (i.e. genes that weremerged/split into one or more genes in the other version),we grouped each locus as a group. We then used BLASTP[28] to search each group against UniProt plant proteins(release 2010_07). A group was treated as false positivewhen no hits were found in UniProt. If a merged gene inannotVer 2.0 and more than two of its counterparts inannotVer 1.0 had the same best hit, the merged event wasregarded to be optimal. On the other hand, if the splitgenes in annotVer 2.0 had more than one best hit, the splitstructures were considered to be better than the mergedstructure in annotVer 1.0. In exceptional cases, where onlyone of the split genes has a best hit, we were confused asto which was better, because there are two conditions wehave to consider. If the best hit was longer than the alignedsplit gene without connection to other split ones, themerged gene would not seem to be better than the splitones. On the other hand, if the best hit was as long as thealigned split gene without other hits to the remaining splitones, then the split genes would also not seem to be betterthan the merged one.
Li et al. BMC Genomics 2011, 12:540http://www.biomedcentral.com/1471-2164/12/540
Page 9 of 11

If different structural genes in the two versions weremapped to the same locus, methods developed by Lorenzi,Puiu and Miller et al. [50] were modified and used todescribe the structural changes. First, we searched thePfam domain for each pair of genes with different struc-tures by InterProScan [29]. Then, we used the proteins ofeach pair to search UniProt plant proteins (release2010_07). The proteins in the pairs with the same best hitwere aligned to the matching proteins in UniProt bystretcher in EMBOSS [23]. Gene structures with higheridentity, similarity, score, and fewer gaps were consideredas better structures.
Comparing non-overlapped locus protein-coding genesComparison of non-overlapped locus protein-codinggenes in the two versions was carried out by BLASTP[28] searches against UniProt plant proteins (release2010_07), with an E value threshold of 10-5. The percen-tage of multi-exon genes was also used as an index toevaluate the gene set for the inaccuracy of single-exongene prediction.
Validation by experimental study of WRKY gene familyA dataset of 33 cucumber WRKY genes and 35 assembledWRKY gene cDNAs generated in a previous experimentalstudy [30] were aligned to the reassembled cucumber gen-ome by spaln [27], followed by manual checking of the dif-ferences between the alignment results and genepredictions in annotVer 1.0 and annotVer 2.0.
Additional material
Additional file 1: Supplemental Tables and Figures. Table S1.Summary of the additional sequencing data from Cucumis sativus var.hardwickii and domestic Cucumis sativus var. sativus to reassembled thegenome of Cucumis sativus var. sativus. Table S2. Statistics of cucumbergenome ressembly. Table S3. Mapping RNA-seq reads onto thereassembled cucumber genome. Table S4. Prediction of non-codingRNAs in the two annotations. Table S5. Prediction and classification oftransposable elements in the two annotations. Figure S1. Genes inannotVer 1.0 mapped to the same locus of the reassembly of cucumbergenome. Figure S2. Two genes in annotVer 1.0 merged into one gene inannotVer 2.0. Figure S3. Genes in annotVer 1.0 and annotVer 2.0 mappedto the same locus but with different structures.
AcknowledgementsWe thank three anonymous reviewers for their invaluable comments andsuggestions. This work was supported by the Chinese Ministry of Agriculture(the 948 program) to SH, the Ministry of Science and Technology(2010AA10A108) to SH, the National Natural Science Foundation of China(30972011) to ZZ, and the Beijing Municipal Commission of Education(YB20101002702) to ZL, PY, and KL.
Author details1College of Life Sciences, Beijing Normal University, 19 Xinjiekouwai Street,Beijing, 100875, China. 2Key Laboratory of Horticultural Crops GeneticImprovement of Ministry of Agriculture, Sino-Dutch Joint Lab of HorticulturalGenomics Technology, Institute of Vegetables and Flowers, Chinese
Academy of Agricultural Sciences, 12 Zhongguancunnan Street, Beijing,100081, China. 3Boyce Thompson Institute and USDA Robert W. HolleyCenter for Agriculture and Health, Cornell University, Tower Road Ithaca,New York, 14853-1801, USA.
Authors’ contributionsZL was responsible for the development and construction of the annotationpipeline and the drafting of the manuscript, while ZZ participated in thereassembly of the cucumber genome and the drafting of the manuscript. PYparticipated in the RNA-Seq analyses. SH and ZF provided essentialsuggestions for this work. KL designed and coordinated the work andhelped to draft the manuscript. All authors read and approved the finalmanuscript.
Received: 10 March 2011 Accepted: 2 November 2011Published: 2 November 2011
References1. Tang H, Bowers JE, Wang X, Paterson AH: Angiosperm genome
comparisons reveal early polyploidy in the monocot lineage. Proceedingsof the National Academy of Sciences of the United States of America 2010,107:472-477.
2. Scientists GKCo: Genome 10 K: A Proposal to Obtain Whole-GenomeSequence for 10000 Vertebrate Species. Journal of Heredity 2009,100:659-674.
3. Stein L: Genome annotation from sequence to biology. Nat Rev Genet2001, 2:493-505.
4. Haas BJ, Wortman JR, Ronning CM, Hannick LI, Smith RK, Maiti R, Chan AP,Yu C, Farzad M, Wu D, et al: Complete reannotation of the Arabidopsisgenome: methods, tools, protocols and the final release. BMC Biology2005, 3:7.
5. Brent MR: Steady progress and recent breakthroughs in the accuracy ofautomated genome annotation. Nat Rev Genet 2008, 9:62-73.
6. Haas B, Volfovsky N, Town C, Troukhan M, Alexandrov N, Feldmann K,Flavell R, White O, Salzberg S: Full-length messenger RNA sequencesgreatly improve genome annotation. Genome Biology 2002, 3:research0029.0021-research0029.0012.
7. Morin RD, Bainbridge M, Fejes A, Hirst M, Krzywinski M, Pugh TJ,McDonald H, Varhol R, Jones SJM, Marra MA: Profiling the HeLa S3transcriptome using randomly primed cDNA and massively parallelshort-read sequencing. BioTechniques 2008, 45:81-94.
8. Haas BJ, Zody MC: Advancing RNA-Seq analysis. Nat Biotechnol 2010,28:421-423.
9. Wang Z, Gerstein M, Snyder M: RNA-Seq: a revolutionary tool fortranscriptomics. Nat Rev Genet 2009, 10:57-63.
10. Larsen PE, Trivedi G, Sreedasyam A, Lu V, Podila GK, Collart FR: Using deepRNA sequencing for the structural annotation of the Laccaria bicolormycorrhizal transcriptome. PLoS ONE 2010, 5:e9780.
11. Filichkin SA, Priest HD, Givan SA, Shen R, Bryant DW, Fox SE, Wong WK,Mockler TC: Genome-wide mapping of alternative splicing in Arabidopsisthaliana. Genome Research 2009, 21:45-58.
12. Guttman M, Garber M, Levin JZ, Donaghey J, Robinson J, Adiconis X, Fan L,Koziol MJ, Gnirke A, Nusbaum C, et al: Ab initio reconstruction of celltype-specific transcriptomes in mouse reveals the conserved multi-exonic structure of lincRNAs. Nat Biotechnol 2010, 28:503-510.
13. Trapnell C, Williams BA, Pertea G, Mortazavi A, Kwan G, van Baren MJ,Salzberg SL, Wold BJ, Pachter L: Transcript assembly and quantification byRNA-Seq reveals unannotated transcripts and isoform switching duringcell differentiation. Nat Biotechnol 2010, 28:511-515.
14. Denoeud F, Aury J-M, Da Silva C, Noel B, Rogier O, Delledonne M,Morgante M, Valle G, Wincker P, Scarpelli C, et al: Annotating genomeswith massive-scale RNA sequencing. Genome Biology 2008, 9:R175.
15. Jaillon O, Aury J-M, Noel B, Policriti A, Clepet C, Casagrande A, Choisne N,Aubourg S, Vitulo N, Jubin C, et al: The grapevine genome sequencesuggests ancestral hexaploidization in major angiosperm phyla. Nature2007, 449:463-467.
16. Huang S, Li R, Zhang Z, Li L, Gu X, Fan W, Lucas WJ, Wang X, Xie B, Ni P,et al: The genome of the cucumber, Cucumis sativus L. Nature Genetics2009, 41:1275-1281.
17. Haas BJ, Salzberg SL, Zhu W, Pertea M, Allen JE, Orvis J, White O, Buell CR,Wortman JR: Automated eukaryotic gene structure annotation using
Li et al. BMC Genomics 2011, 12:540http://www.biomedcentral.com/1471-2164/12/540
Page 10 of 11

EVidenceModeler and the Program to Assemble Spliced Alignments.Genome Biology 2008, 9:R7.
18. Li R, Li Y, Kristiansen K, Wang J: SOAP: short oligonucleotide alignmentprogram. Bioinformatics 2008, 24:713-714.
19. Grabherr MG, Haas BJ, Yassour M, Levin JZ, Thompson DA, Amit I,Adiconis X, Fan L, Raychowdhury R, Zeng Q, et al: Full-lengthtranscriptome assembly from RNA-Seq data without a referencegenome. Nat Biotechnol 2011, 29:644-652.
20. Li W, Godzik A: Cd-hit: a fast program for clustering and comparing largesets of protein or nucleotide sequences. Bioinformatics 2006,22:1658-1659.
21. Langmead B, Trapnell C, Pop M, Salzberg S: Ultrafast and memory-efficientalignment of short DNA sequences to the human genome. GenomeBiology 2009, 10:R25.
22. Trapnell C, Pachter L, Salzberg SL: TopHat: discovering splice junctionswith RNA-Seq. Bioinformatics 2009, 25:1105-1111.
23. Rice P, Longden I, Bleasby A: EMBOSS: The European Molecular BiologyOpen Software Suite. Trends in Genetics 2000, 16:276-277.
24. Haas BJ, Delcher AL, Mount SM, Wortman JR, Smith RK, Hannick LI, Maiti R,Ronning CM, Rusch DB, Town CD, et al: Improving the Arabidopsisgenome annotation using maximal transcript alignment assemblies.Nucleic Acids Research 2003, 31:5654-5666.
25. Stanke M, Diekhans M, Baertsch R, Haussler D: Using native andsyntenically mapped cDNA alignments to improve de novo genefinding. Bioinformatics 2008, 24:637-644.
26. Parra G, Blanco E, Guigó R: GeneID in Drosophila. Genome Research 2000,10:511-515.
27. Gotoh O: A space-efficient and accurate method for mapping andaligning cDNA sequences onto genomic sequence. Nucleic Acids Research2008, 36:2630-2638.
28. Altschul SF, Gish W, Miller W, Myers EW, Lipman DJ: Basic local alignmentsearch tool. Journal of molecular biology 1990, 215:403-410.
29. Hunter S, Apweiler R, Attwood TK, Bairoch A, Bateman A, Binns D, Bork P,Das U, Daugherty L, Duquenne L, et al: InterPro: the integrative proteinsignature database. Nucl Acids Res 2009, 37:D211-215.
30. Ling J, Jiang W, Zhang Y, Yu H, Mao Z, Gu X, Huang S, Xie B: Genome-wide analysis of WRKY gene family in Cucumis sativus. BMC genomics2011, 12:471.
31. Jurka J, Kapitonov VV, Pavlicek A, Klonowski P, Kohany O, Walichiewicz J:Repbase Update, a database of eukaryotic repetitive elements.Cytogenetic and genome research 2005, 110:462-467.
32. Ouyang S, Buell CR: The TIGR Plant Repeat Databases: a collectiveresource for the identification of repetitive sequences in plants. NucleicAcids Research 2004, 32:D360-D363.
33. Edgar RC, Myers EW: PILER: identification and classification of genomicrepeats. Bioinformatics 2005, 21:i152-i158.
34. Price AL, Jones NC, Pevzner PA: De novo identification of repeat familiesin large genomes. Bioinformatics 2005, 21:i351-i358.
35. Xu Z, Wang H: LTR_FINDER: an efficient tool for the prediction of full-length LTR retrotransposons. Nucleic Acids Research 2007, 35:W265-W268.
36. Guo S, Zheng Y, Joung J-G, Liu S, Zhang Z, Crasta O, Sobral B, Xu Y,Huang S, Fei Z: Transcriptome sequencing and comparative analysis ofcucumber flowers with different sex types. BMC genomics 2010, 11:384.
37. Majoros WH, Pertea M, Salzberg SL: TigrScan and GlimmerHMM: two opensource ab initio eukaryotic gene-finders. Bioinformatics 2004,20:2878-2879.
38. Korf I: Gene finding in novel genomes. BMC Bioinformatics 2004, 5:59.39. Ter-Hovhannisyan V, Lomsadze A, Chernoff YO, Borodovsky M: Gene
prediction in novel fungal genomes using an ab initio algorithm withunsupervised training. Genome Research 2008, 18:1979-1990.
40. Gotoh O: Direct mapping and alignment of protein sequences ontogenomic sequence. Bioinformatics 2008, 24:2438-2444.
41. Kent WJ: BLAT–the BLAST-like alignment tool. Genome Research 2002,12:656-664.
42. Keller O, Odronitz F, Stanke M, Kollmar M, Waack S: Scipio: Using proteinsequences to determine the precise exon/intron structures of genes andtheir orthologs in closely related species. BMC Bioinformatics 2008, 9:278.
43. Suyama M, Torrents D, Bork P: BLAST2GENE: a comprehensive conversionof BLAST output into independent genes and gene fragments.Bioinformatics 2004, 20:1968-1970.
44. Birney E, Clamp M, Durbin R: GeneWise and Genomewise. GenomeResearch 2004, 14:988-995.
45. Stein LD, Mungall C, Shu S, Caudy M, Mangone M, Day A, Nickerson E,Stajich JE, Harris TW, Arva A, Lewis S: The Generic Genome Browser: ABuilding Block for a Model Organism System Database. Genome Research2002, 12:1599-1610.
46. Lowe TM, Eddy SR: tRNAscan-SE: a program for improved detection oftransfer RNA genes in genomic sequence. Nucleic Acids Research 1997,25:955-964.
47. Lowe TM, Eddy SR: A computational screen for methylation guidesnoRNAs in yeast. Science 1999, 283:1168-1171.
48. Nawrocki EP, Kolbe DL, Eddy SR: Infernal 1.0: inference of RNAalignments. Bioinformatics 2009, 25:1335-1337.
49. Griffiths-Jones S, Moxon S, Marshall M, Khanna A, Eddy SR, Bateman A:Rfam: annotating non-coding RNAs in complete genomes. Nucleic AcidsResearch 2005, 33:D121-D124.
50. Lorenzi HA, Puiu D, Miller JR, Brinkac LM, Amedeo P, Hall N, Caler EV: Newassembly, reannotation and analysis of the Entamoeba histolyticagenome reveal new genomic features and protein content information.PLoS Negl Trop Dis 2010, 4:e716.
doi:10.1186/1471-2164-12-540Cite this article as: Li et al.: RNA-Seq improves annotation of protein-coding genes in the cucumber genome. BMC Genomics 2011 12:540.
Submit your next manuscript to BioMed Centraland take full advantage of:
• Convenient online submission
• Thorough peer review
• No space constraints or color figure charges
• Immediate publication on acceptance
• Inclusion in PubMed, CAS, Scopus and Google Scholar
• Research which is freely available for redistribution
Submit your manuscript at www.biomedcentral.com/submit
Li et al. BMC Genomics 2011, 12:540http://www.biomedcentral.com/1471-2164/12/540
Page 11 of 11