Embed Size (px)
Citation preview
Research ArticleOptimization of Bending Process Parameters for Seamless TubesUsing Taguchi Method and Finite Element Method
Jui-Chang Lin1 and Kingsun Lee2
1Department of Mechanical Design Engineering National Formosa University Yunlin 632 Taiwan2Department of Mechanical Engineering Chienkuo Technology University Changhua 500 Taiwan
Correspondence should be addressed to Kingsun Lee kingsunctuedutw
Received 29 September 2014 Accepted 15 April 2015
Academic Editor Hiroshi Noguchi
Copyright copy 2015 J-C Lin and K LeeThis is an open access article distributed under the Creative Commons Attribution Licensewhich permits unrestricted use distribution and reproduction in any medium provided the original work is properly cited
The three-dimensional tube (or pipe) is manufactured by CNC tube bending machine The key techniques are determined by tubediameter wall thicknessmaterial and bending radiusThe obtained technique through experience and the trial and errormethod isunreliable Finite element method (FEM) simulation for the tube bending process before production can avoid wasting manpowerand raw materials The computer-aided engineering (CAE) software ABAQUS 612 is applied to simulate bending characteristicsand to explore the maximum stress and strain conditions The Taguchi method is used to find the optimal parameters of bendingThe confirmation experiment is performed according to optimal parameters Results indicate that the strain error between CAEsimulation and bending experiments is within 639
1 Introduction
In the mechanical manufacturing industry tube bendingis very commonly used in processing and its products arewidely applied in major industries such as power plantsaviation petrochemical industry and the boiler industry
Thebending process for thinwall tubes is often a technicalissue The basic parameters of the copper elbow bendingprocess include the bending moment the type and degreeof deformation of cross section and change of the wallthickness The axial upsetting force on the above mentionedparameters was applied to improve problems associated withthe changes of wall thickness [1]
Tubes subjected to a point load result in local ovalforming which influences tube strength Oval forming andthe flattening effect of tubes experienced during bendingwas first researched by Brazier and therefore was called theBrazier effect [2] An increase in internal pressure togetherwith a point load condition results in a change to sectionalproperties of the tube thus leading to bending of the tube andultimately structural failure
Shaw and Kyriakides [3 4] experimentally tested theresponse and stability of elastoplastic pipes under com-bined bending and external pressure They designed a smalllightweight instrument which can be used to measure thechange in the diameter of the tube at a point in the planeof bending The same instrument is used to experimentallymeasure the ovalization of inelastic tubes under cyclic bend-ingThey demonstrated that reverse bending and subsequentrepeated cyclic bending cause a gradual growth of the ovaliza-tion of the tubersquos cross section They further extended theirexperimental program to investigate the stability of thin-walled tubes under cyclic bendingThe results indicated thatunder curvature-symmetric loading the tube progressivelyovalizes to a critical value at which point it buckles
Vollertsen et al [5] gave a systematic overview about theexisting processes for the bending of extrusions in both smalland large scale production Some of the important featuresof working accuracy in bending extrusions were reviewedThis included the accuracy of the curvature and deviationsin the cross section Methods of open- and closed-loopcontrol based on process modeling for increased accuracy
Hindawi Publishing CorporationAdvances in Materials Science and EngineeringVolume 2015 Article ID 730640 8 pageshttpdxdoiorg1011552015730640
2 Advances in Materials Science and Engineering
were shown aswell as practicalmethods to avoid cross sectiondeformation
For pipe bends subjected to out-of-plane bending theaddition of torsional effects makes it more complex toestimate the plastic collapsemomentThe collapsemoment isreached first at a section around the middle of the bend partMourad and Younan [6 7] performed an analysis to evaluatethe behavior of a pipe bend subjected to out-of-plane bendingand internal pressure They showed that the loaded end ofthe bend was the most severely strained cross section andfound that considerable plastic deformation occurred beforeinstability was reached especially in the presence of appliedpressure
Cross section ovalization is one of the flaws in thethin-walled tube NC bending process A unique qualityestimator of the cross section geometry of bent tubes hasbeen developed which is able to synthetically represent themain functional and aesthetical properties of tubes Thedeformation occurring in the cross section of the tube hasbeen studied through a set of FEM simulations run withan explicit code with shell elements The model has beenvalidated by comparing the experimental and numericalresults of specific cases in terms of geometry of the crosssection in a 90∘ bend A proposed indicator is able to reliablyestimate the difficulty of a bending process with respect to atendency towards ovalization and collapse of the cross section[8]
Much research using FEM and experiments has beencarried out on the thin-walled tube bending processesThe stress and strain distribution tube wall thinning crosssection ovalization and other defects in the NC bendinghave been studied [9] The finite element method (FEM)is a useful tool for optimizing the process layout in metalforming Numerical simulation helps designers to estimatemetal formability and improve process layout
In this study the computer-aided engineering (CAE)software ABAQUS applied finite element method (FEM) tosimulate bending characteristics and to explore the maxi-mum stress and strain conditions The Taguchi method wasused to find the optimal parameters of bending formingTheconfirmation experiment using strain gauge was performedaccording to optimal parametersThe results indicate that theCAE precisely simulated the bending experiment
2 Elastoplastic Analysis
If an elastoplastic deformable body is in dynamic equilibriumstate the following force balance equation (1) and boundaryconditions (2) are established for every material point whichis covered in Ω of the body
120588119894= 120590119895119894119895
+ 120588119887119894
in Ω (1)
119905119894= minusℎ119894119895(119906119895minus 119892119895) + 119891119895
on Γ = Γ119906+ Γ119865+ Γ119888 (2)
ℎ119894119895=
119870120575 (119870 997888rarr infin) on Γ119906
0 on Γ119865
(3)
where 120588 = material density 119906119894= displacement vector 120590
119894119895=
Cauchy stress tensor 119887119894= body force vector 119905
119894= drag force
vector on the body surface 119870 = spring constant 119892119894= known
displacement vector on the displacement boundary Γ119906 119891119894=
known load vector on the load boundary Γ119865 and Γ
119888= mixed
boundary the sum of Γ119906and Γ119865
Principle of virtual work finite element and numericalintegration are applied to derive the following nonlineardifferential equation
[119872] + [119862] + [119870] 119906 = 119875 (4)
where [119872] = total mass matrix [119862] = total damping matrix[119870] = total stiffness matrix and 119875 = total load vectors
3 Design of Experiments
TheTaguchi method was created by Genichi Taguchi in 1949It is an engineering methodology for obtaining the relation-ship between products and the manufacturing process
The Taguchi method is an important tool for robustdesign combining experimental design theory and the con-cept of quality loss function It offers a simple and systematicapproach to optimize performance design quality and cost[10ndash12]
Taguchirsquos approach is based on statistical design of exper-iments which fulfills the requirements to solve engineer-ing problems and enhance process optimization Taguchisuggests analyzing variation using an appropriately chosensignal-to-noise ratio (119878119873) These 119878119873 ratios are derivedfrom the quadratic loss function The Taguchi analysis ofthe 119878119873 ratio involves three kinds of quality characteris-tic including the-nominal-the-better the-smaller-the-betterand the-larger-the-better To obtain optimal bending per-formance the-smaller-the-better quality characteristic forminimizing maximum stress and strain must be taken It canbe expressed as
119878
119873= minus10 log(1
119899
119899
sum
119894=1
119910119894
2
) (5)
where 119910119894is the observed data Regardless of category 119899 is
the number of experiments in a trial A greater 119878119873 ratiocorresponds to a better performanceThe level of a factorwiththe highest signal-to-noise ratio is the optimum level [13]
In this study the finite element analysis combined withTaguchi methods L
18(21times 37) orthogonal array was used to
simulate the bending process of three-dimensional seamlesspipe Table 1 represents experimental factors and their levelsTable 2 is the orthogonal array CAE software ABAQUS wasapplied to simulate bending according to orthogonal arrayThe optimal bending process parameters were obtained via119878119873 ratio analysis Finally the confirmation experiment wasperformed to verify the consistency between the simulationand the actual bending process
In practical three-dimensional bending process CNCtube bending process was illustrated in Figures 1 and 2 119884-axis was the feed direction of the tube 119861-axis was the rotationdirection of the tube along its axis and 119862-axis was bending
Advances in Materials Science and Engineering 3
Table 1 Control factors and levels
Factors Levels1 2 3
A Feed axis 119884 strokes 1 2 135mm 140mm mdashB Feed axis 119884 stroke 3 110mm 115mm 120mmC Rotation axis 119861 stroke 1 minus245∘ minus250∘ minus255∘
D Rotation axis 119861 stroke 2 minus225∘ minus230 minus235∘
E Rotation axis 119861 stroke 3 minus75∘ minus80∘ minus85∘
F Bending axis 119862 stroke 1 455∘ 46∘ 465∘
G Bending axis 119862 stroke 2 465∘ 47∘ 475∘
H Bending axis 119862 stroke 3 48∘ 485∘ 49∘
Table 2 Orthogonal array L18 (21
times 37)
Sets number A B C D E F G H1 1 1 1 1 1 1 1 12 1 1 2 2 2 2 2 23 1 1 3 3 3 3 3 34 1 2 1 1 2 2 3 35 1 2 2 2 3 3 1 16 1 2 3 3 1 1 2 27 1 3 1 2 1 3 2 38 1 3 2 3 2 1 3 19 1 3 3 1 3 2 1 210 2 1 1 3 3 2 2 111 2 1 2 1 1 3 3 212 2 1 3 2 2 1 1 313 2 2 1 2 3 1 3 214 2 2 2 3 1 2 1 315 2 2 3 1 2 3 2 116 2 3 1 3 2 3 1 217 2 3 2 1 3 1 2 318 2 3 3 2 1 2 3 1
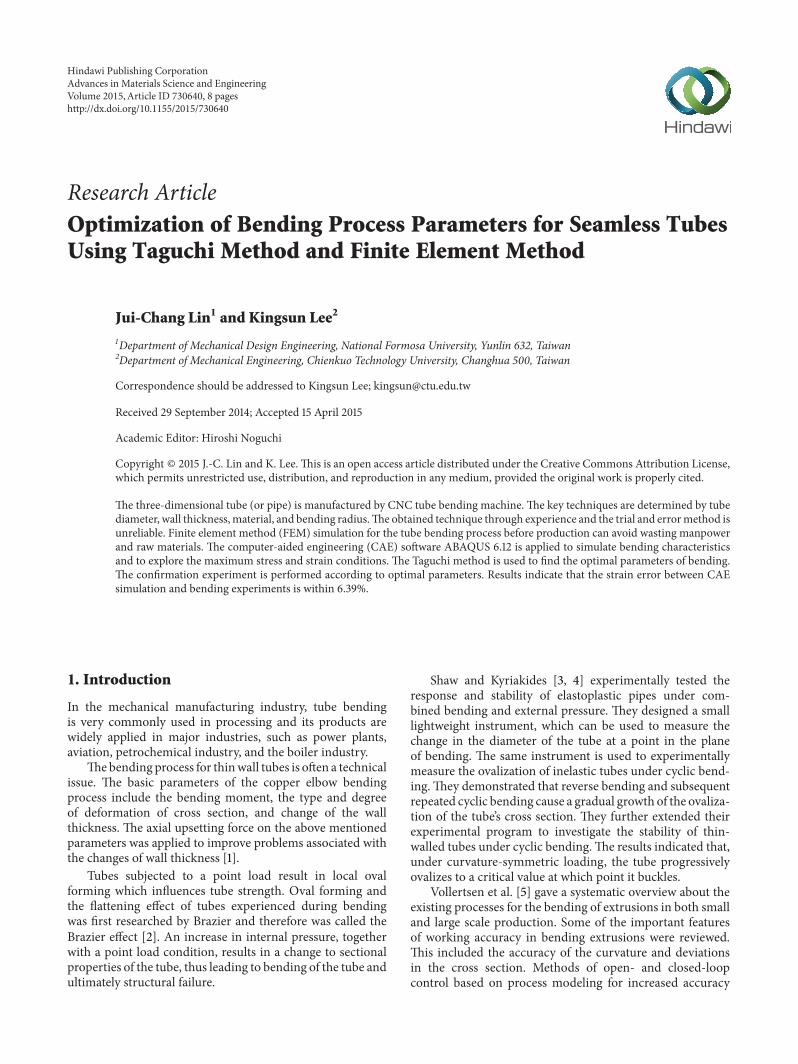
direction of the tube which was bent by wiper die Threeform blocks were fixed and axis of seamless tube were fixedIn accordance with the design parameters of the Taguchimethod wiper die was rotated along bending axis of the tubewhile tube rotated and fed itself to complete119884 119861 and119862 threestrokes
The material used in this experiment was the seam-less SUS-304 stainless steel tube with corrosion resistancehigh strength electrical conductivity and good mechanicalproperties (Table 3) its maximum stress was 626MPa andmaximum strain was 042 This experimental tube had alength of 800mm an inner diameter of 34mm and a wallthickness of 15mm
4 Results and Discussions
The maximum stresses and strains were obtained byABAQUS simulation analysis Eighteen data sets are listed in
FixedFixed
B
Y
C
Figure 1 Three control factors
Formblock
Wiperdie
Tube
Fixture
Figure 2 Tube bending configuration
Table 3 Mechanical properties of typical 304 stainless steel
Density (kgmm3) 0789Poissonrsquos ratio 033Youngrsquos modulus (Gpa) 190Yield strength (Mpa) 296Ultimate strength (Mpa) 626Ultimate strain 042
Table 4 Set numbers 2 and 12 in Table 4 show that maximumstresses were very close to the tensile strength of materialSUS-304 (626MPa) Set numbers 13 and 18 of plastic strainalso exceeded the maximum strain (042) Thus these foursets of bending pipe will be broken
The experimental results were then transformed into asignal-to-noise (119878119873) ratio Taguchi recommends the use ofthe 119878119873 ratio to measure quality characteristics A greater119878119873 ratio corresponds to improved quality In this studythe-lower-the-better quality characteristic (5) was used tocalculate the 119878119873 ratio for maximum stress and strain andthe results are listed in Table 5
Table 6 represents the 119878119873 ratio at each level of allcontrol factors for strain The effect of the control factor wasdetermined by its level of difference values A larger controlfactor level difference resulted in a greater effect on strain inthe bending process Figure 3 shows the 119878119873 response graphfor strain
4 Advances in Materials Science and Engineering
Table 4 Stress and strain of FEM simulation
Sets number A B C D E F G H Maximum stress(MPa)
Maximum strain(mmmm)
1 1 1 1 1 1 1 1 1 4337 029782 1 1 2 2 2 2 2 2 6122 040753 1 1 3 3 3 3 3 3 4593 036074 1 2 1 1 2 2 3 3 4796 031085 1 2 2 2 3 3 1 1 4935 031836 1 2 3 3 1 1 2 2 5490 036887 1 3 1 2 1 3 2 3 4444 030568 1 3 2 3 2 1 3 1 5880 032389 1 3 3 1 3 2 1 2 4755 0409110 2 1 1 3 3 2 2 1 4523 0411411 2 1 2 1 1 3 3 2 4655 0299612 2 1 3 2 2 1 1 3 6251 0376813 2 2 1 2 3 1 3 2 5087 0494114 2 2 2 3 1 2 1 3 4914 0325315 2 2 3 1 2 3 2 1 4632 0303116 2 3 1 3 2 3 1 2 4576 0302117 2 3 2 1 3 1 2 3 4712 0299518 2 3 3 2 1 2 3 1 5856 04460
Table 5 119878119873 ratios of maximum stress and strain
Sets number A B C D E F G H Maximum stress Maximum strain1 1 1 1 1 1 1 1 1 minus52744 105222 1 1 2 2 2 2 2 2 minus55738 77973 1 1 3 3 3 3 3 3 minus53242 88574 1 2 1 1 2 2 3 3 minus53618 101505 1 2 2 2 3 3 1 1 minus53866 99436 1 2 3 3 1 1 2 2 minus54791 86647 1 3 1 2 1 3 2 3 minus52955 102978 1 3 2 3 2 1 3 1 minus55388 97949 1 3 3 1 3 2 1 2 minus53543 776310 2 1 1 3 3 2 2 1 minus53109 771511 2 1 2 1 1 3 3 2 minus53358 1046912 2 1 3 2 2 1 1 3 minus55919 847813 2 2 1 2 3 1 3 2 minus54129 612414 2 2 2 3 1 2 1 3 minus53829 975415 2 2 3 1 2 3 2 1 minus53315 1036816 2 3 1 3 2 3 1 2 minus53210 1039717 2 3 2 1 3 1 2 3 minus53464 1047218 2 3 3 2 1 2 3 1 minus55352 7013
Table 7 expresses the quality characteristic (strain) whichwas obtained from actual experiment The factor responsetable (Table 8) and graph (Figure 4) of the quality characteris-tic can be made according to the experimental data Tables 6and 8 indicated that factor D was the second most effective
factor for strain and the most effective factor for qualitycharacteristic because it had the highest level differenceamong all control factors
The optimal combination of bending parameters forminimizing strain was A1B3C2D1E2F3G1H3 The optimal
Advances in Materials Science and Engineering 5
Table 6 Response table for 119878119873 ration of strain
Level A B C D E F G H1 931 8973 9201 9957 9453 9009 9476 92262 8977 9167 9705 8275 9498 8366 9219 85363 mdash 929 8524 9197 8479 10055 8735 9668Effect 0333 0317 1181 1682 1019 169 0742 1132Rank 7 8 3 2 5 1 6 4
21
96
90
84
2 31
96
90
84
2 31
96
90
84
2 31
96
90
84
2 31
96
90
84
2 31
96
90
84
Signal-to-noise smaller is better
2 31
96
90
84
Signal-to-noise smaller is better
2 31
96
90
84
A B
C D
E F
G H
SN
ratio
s
SN
ratio
s
SN
ratio
s
SN
ratio
s
SN
ratio
s
SN
ratio
s
SN
ratio
s
SN
ratio
s
Figure 3 Response diagram of strain
combination of bending parameters for quality characteris-tics was A2B3C2D1E2F3G1H3 The level of factor A (feedstroke) was the only difference and A2 was selected for thesake of productivity The optimum parameters were listed inTable 9
The optimal parameters were reused through CAE analy-sis to obtain themaximum stress of 5035MPa andmaximumplastic strain of 0327 A comparison was made between thesetwo values and the average values of 18 sets of data (Table 4)The results indicated that the maximum stress of 5035Mpa
6 Advances in Materials Science and Engineering
Table 7 Strain of actual experiment
Sets number 1199101 1199102 1199103 1199104 1199105 1199106 119910 (AVG)1 01765 02384 02782 02974 02978 02978 026442 01799 02507 02938 03084 03093 04075 029163 01836 02506 02999 03159 03978 03607 030144 01802 02404 02839 03062 03083 03108 027165 0184 02468 02861 03051 03055 03183 027436 01832 02407 02891 0367 03686 03688 030297 01781 02421 02855 03045 03056 03056 027028 01787 02435 02825 03214 03219 03238 027869 01812 02475 029 03077 03091 04091 0290810 0175 02413 02792 02978 02984 04114 0283911 01795 0235 02763 02975 02982 02996 0264412 01774 02401 02712 02912 02917 03768 0274713 01734 02414 02787 03388 0339 04941 0310914 01803 02443 02849 03229 03243 03253 0280315 01815 02387 02761 03007 03011 03031 0266916 01799 02448 02839 03003 03005 03021 0268617 01767 0238 02776 02974 02974 02995 0264418 01801 02419 02816 0295 02959 0446 02901
Table 8 Response table for actual experiment of strain
Level A B C D E F G H1 02829 028 02783 02704 02787 02827 02755 027632 02782 02845 02756 02853 02753 02847 028 028823 02771 02878 0286 02876 02743 02862 02771Effect 00046 00074 00122 00156 00123 00104 00107 00118Rank 8 7 3 1 2 6 5 4
was very close to the average stress of 5031Mpa obtainedfrom the Taguchi method of 18 sets of data and maximumstrain of 0327 was lower than the average strain of 0353obtained from the Taguchi method of 18 sets of data and itcan be made sure that the Taguchi method selected optimalparameters are correct
A confirmation test was done after the optimal combi-nation of process parameters was determined The measurepoint of strain obtained by finite element analysis is near thebending radius of the tube the strain value is 01342 as shownin Figure 5 At the same position the strain obtained by actualtube bending experiments using strain gauges is 01428 Theresults indicate that the error between confirmation test andactual experiment is 639 (Table 10)
The completed workpiece using optimal parameters isshown in Figure 6 The surface around the curved corner
of the optimum workpiece is obviously smoother than theoriginal workpiece
5 Conclusion
The CNC bending parameters were selected as Taguchiexperimental factors rather than bending radius This isbecause the actual bending process had to consider operationconvenience The results show that the selected optimumparameters can actually apply to bending operation withoutfurther conversionThe experimental results may be summa-rized as follows
(1) According to response diagram factor D (rotationaxis119861 stroke 2) is themost effective process factorThelevel of this factor should be smaller to avoid productfailure
Advances in Materials Science and Engineering 7
A B
C D
E F
G H
21
Stra
ins
029
028
027
321
Stra
ins
029
028
027
321
Stra
ins
029
028
027
321
Stra
ins
029
028
027
321
Stra
ins
029
028
027
321
Stra
ins
029
028
027
321
Stra
ins
029
028
027
321
Stra
ins
029
028
027
Figure 4 Response diagram of quality characteristics
Table 9 Optimal bending parameters
Feeding axis 119884 Rotation axis 119861 Bending axis 119862Stroke 1 140mm minus250∘ 465∘
Stroke 2 140mm minus225∘ 465∘
Stroke 3 120mm minus80∘ 49∘
Table 10 Comparison between experiment and simulation
Strain (mmmm)Simulation 01342Actual experiment 01428
Error = 639
(2) The optimal bending parameters for minimizingmaximum strain are A2 B3 C2 D1 E2 F3 G1 andH3They are as follows feed strokes 1 and 2 = 140mmfeed stroke 3 = 120mm rotation stroke 1 = minus250∘rotation stroke 2 = minus225∘ rotation stroke 3 = minus80∘bending stroke 1= 465∘ bending stroke 2 = 465∘ andbending stroke 3 = 49∘
(3) The optimal parameters were utilized to execute aconfirmation experiment the results of which indi-cate that the strain error between experiment andFEM simulation is 639
8 Advances in Materials Science and Engineering
Measure point
Figure 5 Measure point of FEM analysis
Optimum workpiece
Original workpiece
Figure 6 Comparison of workpiece
Conflict of Interests
The authors declare that there is no conflict of interestsregarding the publication of this paper
References
[1] F Stachowicz ldquoBending with upsetting of copper tube elbowsrdquoJournal of Materials Processing Technology vol 100 no 1 pp236ndash240 2000
[2] L G Brazier ldquoOn the flexure of thin cylindrical shells and otherlsquoThinrsquo sectionsrdquo Proceedings of the Royal Society of London Avol 116 pp 104ndash114 1927
[3] P K Shaw and S Kyriakides ldquoInelastic analysis of thin-walledtubes under cyclic bendingrdquo International Journal of Solids andStructures vol 21 no 11 pp 1073ndash1100 1985
[4] S Kyriakides and P K Shaw ldquoInelastic buckling of tubes undercyclic bendingrdquo Journal of Pressure Vessel Technology vol 109no 2 pp 169ndash178 1987
[5] F Vollertsen A Sprenger J Kraus and H Arnet ldquoExtrusionchannel and profile bending a reviewrdquo Journal of MaterialsProcessing Technology vol 87 no 1ndash3 pp 1ndash27 1999
[6] H M Mourad and M Y A Younan ldquoThe effect of modelingparameters on the predicted limit loads for pipe bends subjected
to out-of-plane moment loading and internal pressurerdquo Trans-actions of the ASME Journal of Pressure Vessel Technology vol122 no 4 pp 450ndash456 2000
[7] HMMourad andM Y A Younan ldquoNonlinear analysis of pipebends subjected to out-of-plane moment loading and internalpressurerdquo Journal of Pressure Vessel Technology vol 123 no 2pp 253ndash258 2001
[8] A Mentella and M Strano ldquoRotary draw bending of smalldiameter copper tubes predicting the quality of the cross-sectionrdquo Proceedings of the Institution of Mechanical EngineersPart B Journal of Engineering Manufacture vol 226 no 2 pp267ndash278 2012
[9] F Paulsen and T Welo ldquoApplication of numerical simulation inthe bending of aluminium-alloy profilesrdquo Journal of MaterialsProcessing Technology vol 58 no 2-3 pp 274ndash285 1996
[10] E Bagci and S Aykut ldquoA study of Taguchi optimizationmethodfor identifying optimum surface roughness in CNC facemillingof cobalt-based alloy (stellite 6)rdquo The International Journal ofAdvanced Manufacturing Technology vol 29 no 9-10 pp 940ndash947 2006
[11] N Alagumurthi K Palaniradja and V Soundararajan ldquoOpti-mization of grinding process through Design of Experiment(DOE)mdasha comparative studyrdquo Materials and ManufacturingProcesses vol 21 no 1 pp 19ndash21 2006
[12] M S PhadkeQuality EngineeringUsing Robust Design PrenticeHall Englewood Cliffs NJ USA 1989
[13] H H Lee Taguchi Method Quality Characteristics Concept andPractices GaoLi Books Taipei Taiwan 2005
Submit your manuscripts athttpwwwhindawicom
ScientificaHindawi Publishing Corporationhttpwwwhindawicom Volume 2014
CorrosionInternational Journal of
Hindawi Publishing Corporationhttpwwwhindawicom Volume 2014
Polymer ScienceInternational Journal of
Hindawi Publishing Corporationhttpwwwhindawicom Volume 2014
Hindawi Publishing Corporationhttpwwwhindawicom Volume 2014
CeramicsJournal of
Hindawi Publishing Corporationhttpwwwhindawicom Volume 2014
CompositesJournal of
NanoparticlesJournal of
Hindawi Publishing Corporationhttpwwwhindawicom Volume 2014
Hindawi Publishing Corporationhttpwwwhindawicom Volume 2014
International Journal of
Biomaterials
Hindawi Publishing Corporationhttpwwwhindawicom Volume 2014
NanoscienceJournal of
TextilesHindawi Publishing Corporation httpwwwhindawicom Volume 2014
Journal of
NanotechnologyHindawi Publishing Corporationhttpwwwhindawicom Volume 2014
Journal of
CrystallographyJournal of
Hindawi Publishing Corporationhttpwwwhindawicom Volume 2014
The Scientific World JournalHindawi Publishing Corporation httpwwwhindawicom Volume 2014
Hindawi Publishing Corporationhttpwwwhindawicom Volume 2014
CoatingsJournal of
Advances in
Materials Science and EngineeringHindawi Publishing Corporationhttpwwwhindawicom Volume 2014
Smart Materials Research
Hindawi Publishing Corporationhttpwwwhindawicom Volume 2014
Hindawi Publishing Corporationhttpwwwhindawicom Volume 2014
MetallurgyJournal of
Hindawi Publishing Corporationhttpwwwhindawicom Volume 2014
BioMed Research International
MaterialsJournal of
Hindawi Publishing Corporationhttpwwwhindawicom Volume 2014
Nano
materials
Hindawi Publishing Corporationhttpwwwhindawicom Volume 2014
Journal ofNanomaterials

2 Advances in Materials Science and Engineering
were shown aswell as practicalmethods to avoid cross sectiondeformation
For pipe bends subjected to out-of-plane bending theaddition of torsional effects makes it more complex toestimate the plastic collapsemomentThe collapsemoment isreached first at a section around the middle of the bend partMourad and Younan [6 7] performed an analysis to evaluatethe behavior of a pipe bend subjected to out-of-plane bendingand internal pressure They showed that the loaded end ofthe bend was the most severely strained cross section andfound that considerable plastic deformation occurred beforeinstability was reached especially in the presence of appliedpressure
Cross section ovalization is one of the flaws in thethin-walled tube NC bending process A unique qualityestimator of the cross section geometry of bent tubes hasbeen developed which is able to synthetically represent themain functional and aesthetical properties of tubes Thedeformation occurring in the cross section of the tube hasbeen studied through a set of FEM simulations run withan explicit code with shell elements The model has beenvalidated by comparing the experimental and numericalresults of specific cases in terms of geometry of the crosssection in a 90∘ bend A proposed indicator is able to reliablyestimate the difficulty of a bending process with respect to atendency towards ovalization and collapse of the cross section[8]
Much research using FEM and experiments has beencarried out on the thin-walled tube bending processesThe stress and strain distribution tube wall thinning crosssection ovalization and other defects in the NC bendinghave been studied [9] The finite element method (FEM)is a useful tool for optimizing the process layout in metalforming Numerical simulation helps designers to estimatemetal formability and improve process layout
In this study the computer-aided engineering (CAE)software ABAQUS applied finite element method (FEM) tosimulate bending characteristics and to explore the maxi-mum stress and strain conditions The Taguchi method wasused to find the optimal parameters of bending formingTheconfirmation experiment using strain gauge was performedaccording to optimal parametersThe results indicate that theCAE precisely simulated the bending experiment
2 Elastoplastic Analysis
If an elastoplastic deformable body is in dynamic equilibriumstate the following force balance equation (1) and boundaryconditions (2) are established for every material point whichis covered in Ω of the body
120588119894= 120590119895119894119895
+ 120588119887119894
in Ω (1)
119905119894= minusℎ119894119895(119906119895minus 119892119895) + 119891119895
on Γ = Γ119906+ Γ119865+ Γ119888 (2)
ℎ119894119895=
119870120575 (119870 997888rarr infin) on Γ119906
0 on Γ119865
(3)
where 120588 = material density 119906119894= displacement vector 120590
119894119895=
Cauchy stress tensor 119887119894= body force vector 119905
119894= drag force
vector on the body surface 119870 = spring constant 119892119894= known
displacement vector on the displacement boundary Γ119906 119891119894=
known load vector on the load boundary Γ119865 and Γ
119888= mixed
boundary the sum of Γ119906and Γ119865
Principle of virtual work finite element and numericalintegration are applied to derive the following nonlineardifferential equation
[119872] + [119862] + [119870] 119906 = 119875 (4)
where [119872] = total mass matrix [119862] = total damping matrix[119870] = total stiffness matrix and 119875 = total load vectors
3 Design of Experiments
TheTaguchi method was created by Genichi Taguchi in 1949It is an engineering methodology for obtaining the relation-ship between products and the manufacturing process
The Taguchi method is an important tool for robustdesign combining experimental design theory and the con-cept of quality loss function It offers a simple and systematicapproach to optimize performance design quality and cost[10ndash12]
Taguchirsquos approach is based on statistical design of exper-iments which fulfills the requirements to solve engineer-ing problems and enhance process optimization Taguchisuggests analyzing variation using an appropriately chosensignal-to-noise ratio (119878119873) These 119878119873 ratios are derivedfrom the quadratic loss function The Taguchi analysis ofthe 119878119873 ratio involves three kinds of quality characteris-tic including the-nominal-the-better the-smaller-the-betterand the-larger-the-better To obtain optimal bending per-formance the-smaller-the-better quality characteristic forminimizing maximum stress and strain must be taken It canbe expressed as
119878
119873= minus10 log(1
119899
119899
sum
119894=1
119910119894
2
) (5)
where 119910119894is the observed data Regardless of category 119899 is
the number of experiments in a trial A greater 119878119873 ratiocorresponds to a better performanceThe level of a factorwiththe highest signal-to-noise ratio is the optimum level [13]
In this study the finite element analysis combined withTaguchi methods L
18(21times 37) orthogonal array was used to
simulate the bending process of three-dimensional seamlesspipe Table 1 represents experimental factors and their levelsTable 2 is the orthogonal array CAE software ABAQUS wasapplied to simulate bending according to orthogonal arrayThe optimal bending process parameters were obtained via119878119873 ratio analysis Finally the confirmation experiment wasperformed to verify the consistency between the simulationand the actual bending process
In practical three-dimensional bending process CNCtube bending process was illustrated in Figures 1 and 2 119884-axis was the feed direction of the tube 119861-axis was the rotationdirection of the tube along its axis and 119862-axis was bending
Advances in Materials Science and Engineering 3
Table 1 Control factors and levels
Factors Levels1 2 3
A Feed axis 119884 strokes 1 2 135mm 140mm mdashB Feed axis 119884 stroke 3 110mm 115mm 120mmC Rotation axis 119861 stroke 1 minus245∘ minus250∘ minus255∘
D Rotation axis 119861 stroke 2 minus225∘ minus230 minus235∘
E Rotation axis 119861 stroke 3 minus75∘ minus80∘ minus85∘
F Bending axis 119862 stroke 1 455∘ 46∘ 465∘
G Bending axis 119862 stroke 2 465∘ 47∘ 475∘
H Bending axis 119862 stroke 3 48∘ 485∘ 49∘
Table 2 Orthogonal array L18 (21
times 37)
Sets number A B C D E F G H1 1 1 1 1 1 1 1 12 1 1 2 2 2 2 2 23 1 1 3 3 3 3 3 34 1 2 1 1 2 2 3 35 1 2 2 2 3 3 1 16 1 2 3 3 1 1 2 27 1 3 1 2 1 3 2 38 1 3 2 3 2 1 3 19 1 3 3 1 3 2 1 210 2 1 1 3 3 2 2 111 2 1 2 1 1 3 3 212 2 1 3 2 2 1 1 313 2 2 1 2 3 1 3 214 2 2 2 3 1 2 1 315 2 2 3 1 2 3 2 116 2 3 1 3 2 3 1 217 2 3 2 1 3 1 2 318 2 3 3 2 1 2 3 1
direction of the tube which was bent by wiper die Threeform blocks were fixed and axis of seamless tube were fixedIn accordance with the design parameters of the Taguchimethod wiper die was rotated along bending axis of the tubewhile tube rotated and fed itself to complete119884 119861 and119862 threestrokes
The material used in this experiment was the seam-less SUS-304 stainless steel tube with corrosion resistancehigh strength electrical conductivity and good mechanicalproperties (Table 3) its maximum stress was 626MPa andmaximum strain was 042 This experimental tube had alength of 800mm an inner diameter of 34mm and a wallthickness of 15mm
4 Results and Discussions
The maximum stresses and strains were obtained byABAQUS simulation analysis Eighteen data sets are listed in
FixedFixed
B
Y
C
Figure 1 Three control factors
Formblock
Wiperdie
Tube
Fixture
Figure 2 Tube bending configuration
Table 3 Mechanical properties of typical 304 stainless steel
Density (kgmm3) 0789Poissonrsquos ratio 033Youngrsquos modulus (Gpa) 190Yield strength (Mpa) 296Ultimate strength (Mpa) 626Ultimate strain 042
Table 4 Set numbers 2 and 12 in Table 4 show that maximumstresses were very close to the tensile strength of materialSUS-304 (626MPa) Set numbers 13 and 18 of plastic strainalso exceeded the maximum strain (042) Thus these foursets of bending pipe will be broken
The experimental results were then transformed into asignal-to-noise (119878119873) ratio Taguchi recommends the use ofthe 119878119873 ratio to measure quality characteristics A greater119878119873 ratio corresponds to improved quality In this studythe-lower-the-better quality characteristic (5) was used tocalculate the 119878119873 ratio for maximum stress and strain andthe results are listed in Table 5
Table 6 represents the 119878119873 ratio at each level of allcontrol factors for strain The effect of the control factor wasdetermined by its level of difference values A larger controlfactor level difference resulted in a greater effect on strain inthe bending process Figure 3 shows the 119878119873 response graphfor strain
4 Advances in Materials Science and Engineering
Table 4 Stress and strain of FEM simulation
Sets number A B C D E F G H Maximum stress(MPa)
Maximum strain(mmmm)
1 1 1 1 1 1 1 1 1 4337 029782 1 1 2 2 2 2 2 2 6122 040753 1 1 3 3 3 3 3 3 4593 036074 1 2 1 1 2 2 3 3 4796 031085 1 2 2 2 3 3 1 1 4935 031836 1 2 3 3 1 1 2 2 5490 036887 1 3 1 2 1 3 2 3 4444 030568 1 3 2 3 2 1 3 1 5880 032389 1 3 3 1 3 2 1 2 4755 0409110 2 1 1 3 3 2 2 1 4523 0411411 2 1 2 1 1 3 3 2 4655 0299612 2 1 3 2 2 1 1 3 6251 0376813 2 2 1 2 3 1 3 2 5087 0494114 2 2 2 3 1 2 1 3 4914 0325315 2 2 3 1 2 3 2 1 4632 0303116 2 3 1 3 2 3 1 2 4576 0302117 2 3 2 1 3 1 2 3 4712 0299518 2 3 3 2 1 2 3 1 5856 04460
Table 5 119878119873 ratios of maximum stress and strain
Sets number A B C D E F G H Maximum stress Maximum strain1 1 1 1 1 1 1 1 1 minus52744 105222 1 1 2 2 2 2 2 2 minus55738 77973 1 1 3 3 3 3 3 3 minus53242 88574 1 2 1 1 2 2 3 3 minus53618 101505 1 2 2 2 3 3 1 1 minus53866 99436 1 2 3 3 1 1 2 2 minus54791 86647 1 3 1 2 1 3 2 3 minus52955 102978 1 3 2 3 2 1 3 1 minus55388 97949 1 3 3 1 3 2 1 2 minus53543 776310 2 1 1 3 3 2 2 1 minus53109 771511 2 1 2 1 1 3 3 2 minus53358 1046912 2 1 3 2 2 1 1 3 minus55919 847813 2 2 1 2 3 1 3 2 minus54129 612414 2 2 2 3 1 2 1 3 minus53829 975415 2 2 3 1 2 3 2 1 minus53315 1036816 2 3 1 3 2 3 1 2 minus53210 1039717 2 3 2 1 3 1 2 3 minus53464 1047218 2 3 3 2 1 2 3 1 minus55352 7013
Table 7 expresses the quality characteristic (strain) whichwas obtained from actual experiment The factor responsetable (Table 8) and graph (Figure 4) of the quality characteris-tic can be made according to the experimental data Tables 6and 8 indicated that factor D was the second most effective
factor for strain and the most effective factor for qualitycharacteristic because it had the highest level differenceamong all control factors
The optimal combination of bending parameters forminimizing strain was A1B3C2D1E2F3G1H3 The optimal
Advances in Materials Science and Engineering 5
Table 6 Response table for 119878119873 ration of strain
Level A B C D E F G H1 931 8973 9201 9957 9453 9009 9476 92262 8977 9167 9705 8275 9498 8366 9219 85363 mdash 929 8524 9197 8479 10055 8735 9668Effect 0333 0317 1181 1682 1019 169 0742 1132Rank 7 8 3 2 5 1 6 4
21
96
90
84
2 31
96
90
84
2 31
96
90
84
2 31
96
90
84
2 31
96
90
84
2 31
96
90
84
Signal-to-noise smaller is better
2 31
96
90
84
Signal-to-noise smaller is better
2 31
96
90
84
A B
C D
E F
G H
SN
ratio
s
SN
ratio
s
SN
ratio
s
SN
ratio
s
SN
ratio
s
SN
ratio
s
SN
ratio
s
SN
ratio
s
Figure 3 Response diagram of strain
combination of bending parameters for quality characteris-tics was A2B3C2D1E2F3G1H3 The level of factor A (feedstroke) was the only difference and A2 was selected for thesake of productivity The optimum parameters were listed inTable 9
The optimal parameters were reused through CAE analy-sis to obtain themaximum stress of 5035MPa andmaximumplastic strain of 0327 A comparison was made between thesetwo values and the average values of 18 sets of data (Table 4)The results indicated that the maximum stress of 5035Mpa
6 Advances in Materials Science and Engineering
Table 7 Strain of actual experiment
Sets number 1199101 1199102 1199103 1199104 1199105 1199106 119910 (AVG)1 01765 02384 02782 02974 02978 02978 026442 01799 02507 02938 03084 03093 04075 029163 01836 02506 02999 03159 03978 03607 030144 01802 02404 02839 03062 03083 03108 027165 0184 02468 02861 03051 03055 03183 027436 01832 02407 02891 0367 03686 03688 030297 01781 02421 02855 03045 03056 03056 027028 01787 02435 02825 03214 03219 03238 027869 01812 02475 029 03077 03091 04091 0290810 0175 02413 02792 02978 02984 04114 0283911 01795 0235 02763 02975 02982 02996 0264412 01774 02401 02712 02912 02917 03768 0274713 01734 02414 02787 03388 0339 04941 0310914 01803 02443 02849 03229 03243 03253 0280315 01815 02387 02761 03007 03011 03031 0266916 01799 02448 02839 03003 03005 03021 0268617 01767 0238 02776 02974 02974 02995 0264418 01801 02419 02816 0295 02959 0446 02901
Table 8 Response table for actual experiment of strain
Level A B C D E F G H1 02829 028 02783 02704 02787 02827 02755 027632 02782 02845 02756 02853 02753 02847 028 028823 02771 02878 0286 02876 02743 02862 02771Effect 00046 00074 00122 00156 00123 00104 00107 00118Rank 8 7 3 1 2 6 5 4
was very close to the average stress of 5031Mpa obtainedfrom the Taguchi method of 18 sets of data and maximumstrain of 0327 was lower than the average strain of 0353obtained from the Taguchi method of 18 sets of data and itcan be made sure that the Taguchi method selected optimalparameters are correct
A confirmation test was done after the optimal combi-nation of process parameters was determined The measurepoint of strain obtained by finite element analysis is near thebending radius of the tube the strain value is 01342 as shownin Figure 5 At the same position the strain obtained by actualtube bending experiments using strain gauges is 01428 Theresults indicate that the error between confirmation test andactual experiment is 639 (Table 10)
The completed workpiece using optimal parameters isshown in Figure 6 The surface around the curved corner
of the optimum workpiece is obviously smoother than theoriginal workpiece
5 Conclusion
The CNC bending parameters were selected as Taguchiexperimental factors rather than bending radius This isbecause the actual bending process had to consider operationconvenience The results show that the selected optimumparameters can actually apply to bending operation withoutfurther conversionThe experimental results may be summa-rized as follows
(1) According to response diagram factor D (rotationaxis119861 stroke 2) is themost effective process factorThelevel of this factor should be smaller to avoid productfailure
Advances in Materials Science and Engineering 7
A B
C D
E F
G H
21
Stra
ins
029
028
027
321
Stra
ins
029
028
027
321
Stra
ins
029
028
027
321
Stra
ins
029
028
027
321
Stra
ins
029
028
027
321
Stra
ins
029
028
027
321
Stra
ins
029
028
027
321
Stra
ins
029
028
027
Figure 4 Response diagram of quality characteristics
Table 9 Optimal bending parameters
Feeding axis 119884 Rotation axis 119861 Bending axis 119862Stroke 1 140mm minus250∘ 465∘
Stroke 2 140mm minus225∘ 465∘
Stroke 3 120mm minus80∘ 49∘
Table 10 Comparison between experiment and simulation
Strain (mmmm)Simulation 01342Actual experiment 01428
Error = 639
(2) The optimal bending parameters for minimizingmaximum strain are A2 B3 C2 D1 E2 F3 G1 andH3They are as follows feed strokes 1 and 2 = 140mmfeed stroke 3 = 120mm rotation stroke 1 = minus250∘rotation stroke 2 = minus225∘ rotation stroke 3 = minus80∘bending stroke 1= 465∘ bending stroke 2 = 465∘ andbending stroke 3 = 49∘
(3) The optimal parameters were utilized to execute aconfirmation experiment the results of which indi-cate that the strain error between experiment andFEM simulation is 639
8 Advances in Materials Science and Engineering
Measure point
Figure 5 Measure point of FEM analysis
Optimum workpiece
Original workpiece
Figure 6 Comparison of workpiece
Conflict of Interests
The authors declare that there is no conflict of interestsregarding the publication of this paper
References
[1] F Stachowicz ldquoBending with upsetting of copper tube elbowsrdquoJournal of Materials Processing Technology vol 100 no 1 pp236ndash240 2000
[2] L G Brazier ldquoOn the flexure of thin cylindrical shells and otherlsquoThinrsquo sectionsrdquo Proceedings of the Royal Society of London Avol 116 pp 104ndash114 1927
[3] P K Shaw and S Kyriakides ldquoInelastic analysis of thin-walledtubes under cyclic bendingrdquo International Journal of Solids andStructures vol 21 no 11 pp 1073ndash1100 1985
[4] S Kyriakides and P K Shaw ldquoInelastic buckling of tubes undercyclic bendingrdquo Journal of Pressure Vessel Technology vol 109no 2 pp 169ndash178 1987
[5] F Vollertsen A Sprenger J Kraus and H Arnet ldquoExtrusionchannel and profile bending a reviewrdquo Journal of MaterialsProcessing Technology vol 87 no 1ndash3 pp 1ndash27 1999
[6] H M Mourad and M Y A Younan ldquoThe effect of modelingparameters on the predicted limit loads for pipe bends subjected
to out-of-plane moment loading and internal pressurerdquo Trans-actions of the ASME Journal of Pressure Vessel Technology vol122 no 4 pp 450ndash456 2000
[7] HMMourad andM Y A Younan ldquoNonlinear analysis of pipebends subjected to out-of-plane moment loading and internalpressurerdquo Journal of Pressure Vessel Technology vol 123 no 2pp 253ndash258 2001
[8] A Mentella and M Strano ldquoRotary draw bending of smalldiameter copper tubes predicting the quality of the cross-sectionrdquo Proceedings of the Institution of Mechanical EngineersPart B Journal of Engineering Manufacture vol 226 no 2 pp267ndash278 2012
[9] F Paulsen and T Welo ldquoApplication of numerical simulation inthe bending of aluminium-alloy profilesrdquo Journal of MaterialsProcessing Technology vol 58 no 2-3 pp 274ndash285 1996
[10] E Bagci and S Aykut ldquoA study of Taguchi optimizationmethodfor identifying optimum surface roughness in CNC facemillingof cobalt-based alloy (stellite 6)rdquo The International Journal ofAdvanced Manufacturing Technology vol 29 no 9-10 pp 940ndash947 2006
[11] N Alagumurthi K Palaniradja and V Soundararajan ldquoOpti-mization of grinding process through Design of Experiment(DOE)mdasha comparative studyrdquo Materials and ManufacturingProcesses vol 21 no 1 pp 19ndash21 2006
[12] M S PhadkeQuality EngineeringUsing Robust Design PrenticeHall Englewood Cliffs NJ USA 1989
[13] H H Lee Taguchi Method Quality Characteristics Concept andPractices GaoLi Books Taipei Taiwan 2005
Submit your manuscripts athttpwwwhindawicom
ScientificaHindawi Publishing Corporationhttpwwwhindawicom Volume 2014
CorrosionInternational Journal of
Hindawi Publishing Corporationhttpwwwhindawicom Volume 2014
Polymer ScienceInternational Journal of
Hindawi Publishing Corporationhttpwwwhindawicom Volume 2014
Hindawi Publishing Corporationhttpwwwhindawicom Volume 2014
CeramicsJournal of
Hindawi Publishing Corporationhttpwwwhindawicom Volume 2014
CompositesJournal of
NanoparticlesJournal of
Hindawi Publishing Corporationhttpwwwhindawicom Volume 2014
Hindawi Publishing Corporationhttpwwwhindawicom Volume 2014
International Journal of
Biomaterials
Hindawi Publishing Corporationhttpwwwhindawicom Volume 2014
NanoscienceJournal of
TextilesHindawi Publishing Corporation httpwwwhindawicom Volume 2014
Journal of
NanotechnologyHindawi Publishing Corporationhttpwwwhindawicom Volume 2014
Journal of
CrystallographyJournal of
Hindawi Publishing Corporationhttpwwwhindawicom Volume 2014
The Scientific World JournalHindawi Publishing Corporation httpwwwhindawicom Volume 2014
Hindawi Publishing Corporationhttpwwwhindawicom Volume 2014
CoatingsJournal of
Advances in
Materials Science and EngineeringHindawi Publishing Corporationhttpwwwhindawicom Volume 2014
Smart Materials Research
Hindawi Publishing Corporationhttpwwwhindawicom Volume 2014
Hindawi Publishing Corporationhttpwwwhindawicom Volume 2014
MetallurgyJournal of
Hindawi Publishing Corporationhttpwwwhindawicom Volume 2014
BioMed Research International
MaterialsJournal of
Hindawi Publishing Corporationhttpwwwhindawicom Volume 2014
Nano
materials
Hindawi Publishing Corporationhttpwwwhindawicom Volume 2014
Journal ofNanomaterials