Embed Size (px)
Citation preview

Research for TRAN Committee - Charging infrastructure for electric road vehicles
Policy Department for Structural and Cohesion Policies
Directorate General for Internal Policies of the Union PE 617.470 - June 2018 EN
STUDY Requested by the TRAN committee

Abstract This study analyses the various challenges of the deployment of charging infrastructure within the EU. This includes existing technologies and standardisation issues, metering systems and pricing schemes, business and financing models, the impact of the charging infrastructure on the dissemination of Plug-in Electric Vehicles (PEVs), and the appropriateness of current technologies, business models, and public policies.
Research for TRAN Committee - Charging infrastructure for electric road vehicles
This document was requested by the European Parliament's Committee on Transport and Tourism. AUTHORS
Ecofys, a Navigant company: Matthias Spöttle, Korinna Jörling, Matthias Schimmel, Maarten Staats Navigant Research: Logan Grizzel, Lisa Jerram, William Drier, John Gartner Research manager: Marc Thomas, Christina Ratcliff Project and publication assistance: Adrienn Borka Policy Department for Structural and Cohesion Policies, European Parliament LINGUISTIC VERSIONS
Original: EN ABOUT THE PUBLISHER
To contact the Policy Department or to subscribe to updates on our work for TRAN Committee please write to: [email protected] Manuscript completed in June 2018 © European Union, 2018 Print ISBN 978-92-846-2854-4 doi:10.2861/013597 QA-01-18-453-EN-C PDF ISBN 978-92-846-2855-1 doi:10.2861/62486 QA-01-18-453-EN-N This document is available on the internet in summary with option to download the full text at: http://bit.ly/2JBVvHq This document is available on the internet at: http://www.europarl.europa.eu/thinktank/en/document.html?reference=IPOL_STU(2018)617470 Further information on research for TRAN by the Policy Department is available at: https://research4committees.blog/tran/ Follow us on Twitter: @PolicyTRAN Please use the following reference to cite this study: Spöttle, M., Jörling, K., Schimmel, M., Staats, M., Grizzel L., Jerram, L., Drier, W., Gartner, J. (2018), Research for TRAN Committee – Charging infrastructure for electric road vehicles, European Parliament, Policy Department for Structural and Cohesion Policies, Brussels Please use the following reference for in-text citations: Spöttle et al. (2018) DISCLAIMER
The opinions expressed in this document are the sole responsibility of the author and do not necessarily represent the official position of the European Parliament. Reproduction and translation for non-commercial purposes are authorised, provided the source is acknowledged and the publisher is given prior notice and sent a copy.

Charging infrastructure for electric road vehicles _________________________________________________________________________
3
CONTENTS LIST OF ABBREVIATIONS 5
LIST OF TABLES 9
LIST OF FIGURES 10
EXECUTIVE SUMMARY 11
1 INTRODUCTION 15
1.1 The background to the topic 15
1.2 Objective 17
1.3 Scope 17
1.4 How to read this study 18
2 CURRENT STATE OF PLAY 19
2.1 Technical state of play 19
2.2 Types of charging stations 20
2.3 Standardisation of physical plugs in electric vehicles 28
2.4 Payment systems and communication protocols 30
2.5 Charging behaviour 32
2.6 State of play in Europe 33
2.7 Front-runners on electromobility outside of Europe: China and USA 44
3 IMPACT OF CHARGING INFRASTRUCTURE ON THE DISSEMINATION OF PEVS 47
3.1 Relationship between charging infrastructure and PEV adoption and use 48
3.2 Impact of demand-oriented and coverage-oriented approaches to PEV adoption and use 53
3.3 Type, location, and quantity of charging infrastructure required 54
4 BUSINESS CASE ANALYSIS 59
4.1 Issues and considerations 61
4.2 Business models reviewed 61
4.3 Scoring 74
5 CONCLUSIONS AND POLICY RECOMMENDATIONS 79
5.1 Summary of findings 79
5.2 Policy recommendations 81
REFERENCES 83
ANNEX A: Country fact sheets 93

Policy Department for Structural and Cohesion Policies _________________________________________________________________
4
Charging infrastructure for electric road vehicles _________________________________________________________________________
5
LIST OF ABBREVIATIONS
A Ampere
AC Alternating Current (charging)
ACEA European Automobile Manufacturers Association
ADAC Allgemeiner Deutscher Automobil-Club (Eng. General German Automobile Club)
ADEME Agence de l'Environnement et de la Maîtrise de l'Énergie (Eng. French Environment and Energy Management Agency)
AFID Alternative Fuels Infrastructure Directive
ANWB Algemene Nederlandse Wielrijdersbond (Eng. The Royal Dutch Touring Club)
BAFA Bundesamt für Wirtschaft und Ausfuhrkontrolle (Eng. German Federal Office for Economic Affaris and Export Control)
BM Business Model
BMVI Bundesministerium für Verkehr und digitale Infrastruktur (Eng. German Federal Ministry of Transport and Digital Infrastructure)
BDEW Bundesverband der Energie- und Wasserwirtschaft (Eng. German Federal Association of the Energy and Water Industries)
BEV Battery Electric Vehicle
C2ES Centre for Climate and Energy Solutions
cc Cubic Centimetre
CCS Combined Charging System
CEF Connecting Europe Facility
CNG Compressed Natural Gas
CNY Chinese Yuan
CO2 Carbon Dioxide
CSP China Southern Power
DC Direct Current (charging)
Policy Department for Structural and Cohesion Policies _________________________________________________________________
6
DIN Deutsche Industrie Norm (Eng. German Industry Standard)
DKE Deutsche Kommission Elektrotechnik, Elektronik und Informationstechnik (Eng. German Commission for Electrical Engineering, Electronics, and Information Technology)
DKK Danish krone
DOE Department of Energy (United States)
e-bike Electric Bicycle
EAFO European Alternative Fuels Observatory
EDF Électricité de France
EPA Environmental Protection Agency (United States)
EU European Union
EUR Euro
EV Electric Vehicle, covers Fuel Cell Electric Vehicle, Plug-in Hybrid Electric Vehicles and Battery Electric Vehicles
EVHS Electric Vehicle Homecharge Scheme
EVSE Electric Vehicle Supply Equipment
FCEV Fuel Cell Electric Vehicle
GHG Greenhouse Gas
GBP Great Britain Pound/Pound Stirling
HRK Croatian Kuna
HOV High Occupancy Vehicle
ICE Internal Combustion Engine
ICCT International Council on Clean Transportation
IEA International Energy Agency
IEC International Electrotechnical Commission
IT Information Technology
JEVS Japan Electric Vehicle Standard
km Kilometre
Charging infrastructure for electric road vehicles _________________________________________________________________________
7
kW Kilowatt
kWh Kilowatt-hour
LNG Liquified Natural Gas
MWh Megawatt-hour
M1 Vehicles used for the carriage of passengers, with no more than eight seats in addition to the driver seat
M2 Vehicles used for the carriage of passengers, consisting of more than eight seats in addition to the driver's seat, and having a maximum mass not exceeding 5 tonnes
M3 Vehicles used for the carriage of passengers, consisting of more than eight seats in addition to the driver's seat, and having a maximum mass exceeding 5 tonnes
N1 Light duty commercial vehicles up to 3.5 tonnes
NDRC National Development and Reform Commission
OCHP Open Clearing House Protocol
OCPP Open Charge Point Protocol
OEM Original Equipment Manufacturer
OLEV Office for Low Emission Vehicles
ORCS On-street Residential Chargepoint Scheme
pedelec Pedal electric cycle
PEV Plug-in Electric Vehicle, not including Fuel Cell Electric Vehicles
PHEV Plug-in Hybrid Electric Vehicle
RFID Radio-Frequency Identification
SAE Society of Automotive Engineers
SEK Swedish Krona
SUV Sports Utility Vehicle
TEN-E Trans-European Networks for Energy
TEN-T Trans-European Transport Network
TOU Time-Of-Use
Policy Department for Structural and Cohesion Policies _________________________________________________________________
8
TRAN European Parliament Committee on Transport and Tourism
TU Technical University
USA United States of America
USD United States Dollar
UK United Kingdom
V Volt
VAT Value-Added Tax
VDE Verband der Elektrotechnik, Elektronik und Informationstechnik (Eng. German Association of Electrical Engineering, Electronics, and Information Technology)
W Watt
WCS Workplace Charging Scheme
ZEV Zero Emissions Vehicle
Charging infrastructure for electric road vehicles _________________________________________________________________________
9
LIST OF TABLES
Table 1 Policy recommendations 13
Table 2 Overview of charging modes and types 20
Table 3 Currently available charging points 24
Table 4 Type and geographical distribution of the most common AC charging connectors 29
Table 5 Type and geographical distribution of the most common DC charging connectors 29
Table 6 Comparison of EU Member State incentives for EVs and charging infrastructure (please also see the country fact sheets in Annex A) 36
Table 7 Comparison of key electromobility parameters for front-runners in 2017 37
Table 8 Business Model (BM) summary 63
Table 9 Business model scorecard 75
Table 10 Potential challenges and solutions 76
Table 11 Policy recommendations for PEV charging infrastructure 81
Policy Department for Structural and Cohesion Policies _________________________________________________________________
10
LIST OF FIGURES Figure 1 Number of PEVs (M1) and publicly accessible charging points in Europe (EU28 and Norway) (2017) 11
Figure 2 Evolution of total PEV stock an PEV market share in the EU28 16
Figure 3 Evolution of charging infrastructure in the EU28 17
Figure 4 PEV fleet in EU28 by vehicle category 18
Figure 5 Publicly accessible charging points in the EU28 23
Figure 6 Number of PEVs (M1) and publicly accessible charging points in Europe (EU28 and Norway) (2017) 35
Figure 7 Five front-runner countries in Europe 37
Figure 8 Historic development of number of PEVs per charging point 49
Figure 9 Relation of PEV per charging point and market share in 2017 50
Figure 10 Relation of charging point density per million inhabitants and market share in 2016 51
Figure 11 Decision tree for charging location 54
Figure 12 Number of PEVs per charging point 57
Figure 13 Business model elements 60

Charging infrastructure for electric road vehicles _________________________________________________________________________
11
EXECUTIVE SUMMARY
Background Electromobility is currently seen as the most promising technology to curb Carbon Dioxide (CO2) emissions in individual transport. Electromobility refers to the use of Electric Vehicles (EVs), which are defined as vehicles that use one or more electric motors for propulsion. Its proliferation is a key element in the efforts to reach European Union (EU) Greenhouse Gas (GHG) reduction targets and the goals set in the Paris Agreement1 to keep global temperature increases below 2 degrees Celsius. Additional advantages of electromobility include increased energy efficiency in transportation and reduction of smog and noise. However, the development of electromobility in the EU has been rather slow, with the exceptions of a few front-runner Member States. When compared to the total stock of passenger cars, the total share of Plug-in Electric Vehicles (PEVs) was only around 0.3% in 2017 in the EU. The deployment of charging infrastructure is essential to facilitate the development of electromobility, and more specifically the uptake of PEVs. The availability of charging infrastructure has been steadily increasing, similarly to the total stock of PEVs, in the EU. Figure 1 below provides a 2017 snapshot of the status of electromobility in Europe (EU28 and Norway) by providing an overview of the PEV stock, market share of new registrations, and publicly available charging points per EU Member State and Norway. Figure 1: Number of PEVs (M12) and publicly accessible charging points in Europe
(EU28 and Norway) (2017)
Source: Authors’ own calculations based on EAFO (2018)3, BDEW (2017a)4, and Commission (2017b)5 data.
1 The Paris Agreement sets out a global action plan to tackle climate change by keeping global warming to well
below 2 degrees Celsius above pre-industrial levels and to pursue efforts to limit the temperature increase even further to 1.5 degrees Celsius.
2 Passenger cars, with no more than eight seats in addition to the driver seat. 3 European Alternative Fuels Observatory (2018). 4 Bundesverband der Energie- und Wasserwirtschaft (2017a). 5 European Commission (2017b).
Sweden49,387 (1.0%) 4,733
Norway209,122 (7.7%) 10,350
Denmark10,393 (0.4%) 2,582
United Kingdom137,680 (0.4%) 14,256
Ireland2,687 (0.1%) 1,009
The Netherlands119,332 (1.4%) 32,875
Germany124,191 (0.3%) 10,878
Belgium31,984 (0.6%) 1,765
Luxemburg2,183 (0.6%) 337
Austria14,854 (0.3%) 4,088
France123,639 (0.4%) 16,311
Portugal8,260 (0.2%) 1,545
Spain17,063 (<0.1%) 4,974
Italy13,530 (<0.1%) 2,741
Malta153 (<0.1%) 97
Finland5,910 (0.2%) 947
Estonia1,237 (0.2%) 384
Latvia369 (<0.1%) 73
Lithuania212 (<0.1%) 102
Poland976 (<0.1%) 552
Czech Republic1,721 (<0.1%) 684
Slovakia568 (<0.1%) 443
Slovenia1,085 (0.1%) 495
Hungary567 (<0.1%) 272
Croatia436 (<0.1%) 436
Romania669 (<0.1%) 114
Bulgaria118 (<0.1%) 94
Greece341 (<0.1%) 38
Cyprus171 (<0.1%) 36
Number of public ly accessible charging points
PEV (M1) fleet (share PEV of total car s tock)
EU 28669,716 (0.3%) 102,861
Policy Department for Structural and Cohesion Policies _________________________________________________________________
12
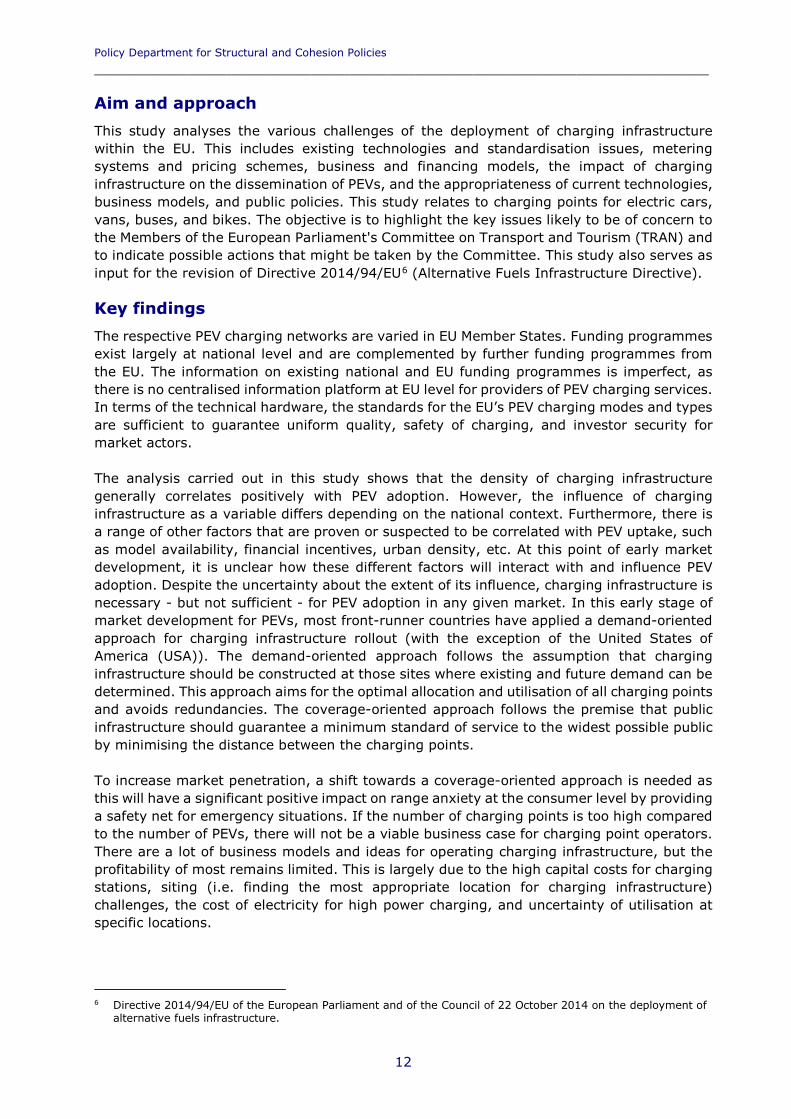
Aim and approach This study analyses the various challenges of the deployment of charging infrastructure within the EU. This includes existing technologies and standardisation issues, metering systems and pricing schemes, business and financing models, the impact of charging infrastructure on the dissemination of PEVs, and the appropriateness of current technologies, business models, and public policies. This study relates to charging points for electric cars, vans, buses, and bikes. The objective is to highlight the key issues likely to be of concern to the Members of the European Parliament's Committee on Transport and Tourism (TRAN) and to indicate possible actions that might be taken by the Committee. This study also serves as input for the revision of Directive 2014/94/EU6 (Alternative Fuels Infrastructure Directive).
Key findings The respective PEV charging networks are varied in EU Member States. Funding programmes exist largely at national level and are complemented by further funding programmes from the EU. The information on existing national and EU funding programmes is imperfect, as there is no centralised information platform at EU level for providers of PEV charging services. In terms of the technical hardware, the standards for the EU’s PEV charging modes and types are sufficient to guarantee uniform quality, safety of charging, and investor security for market actors. The analysis carried out in this study shows that the density of charging infrastructure generally correlates positively with PEV adoption. However, the influence of charging infrastructure as a variable differs depending on the national context. Furthermore, there is a range of other factors that are proven or suspected to be correlated with PEV uptake, such as model availability, financial incentives, urban density, etc. At this point of early market development, it is unclear how these different factors will interact with and influence PEV adoption. Despite the uncertainty about the extent of its influence, charging infrastructure is necessary - but not sufficient - for PEV adoption in any given market. In this early stage of market development for PEVs, most front-runner countries have applied a demand-oriented approach for charging infrastructure rollout (with the exception of the United States of America (USA)). The demand-oriented approach follows the assumption that charging infrastructure should be constructed at those sites where existing and future demand can be determined. This approach aims for the optimal allocation and utilisation of all charging points and avoids redundancies. The coverage-oriented approach follows the premise that public infrastructure should guarantee a minimum standard of service to the widest possible public by minimising the distance between the charging points. To increase market penetration, a shift towards a coverage-oriented approach is needed as this will have a significant positive impact on range anxiety at the consumer level by providing a safety net for emergency situations. If the number of charging points is too high compared to the number of PEVs, there will not be a viable business case for charging point operators. There are a lot of business models and ideas for operating charging infrastructure, but the profitability of most remains limited. This is largely due to the high capital costs for charging stations, siting (i.e. finding the most appropriate location for charging infrastructure) challenges, the cost of electricity for high power charging, and uncertainty of utilisation at specific locations.
6 Directive 2014/94/EU of the European Parliament and of the Council of 22 October 2014 on the deployment of
alternative fuels infrastructure.
Charging infrastructure for electric road vehicles _________________________________________________________________________
13
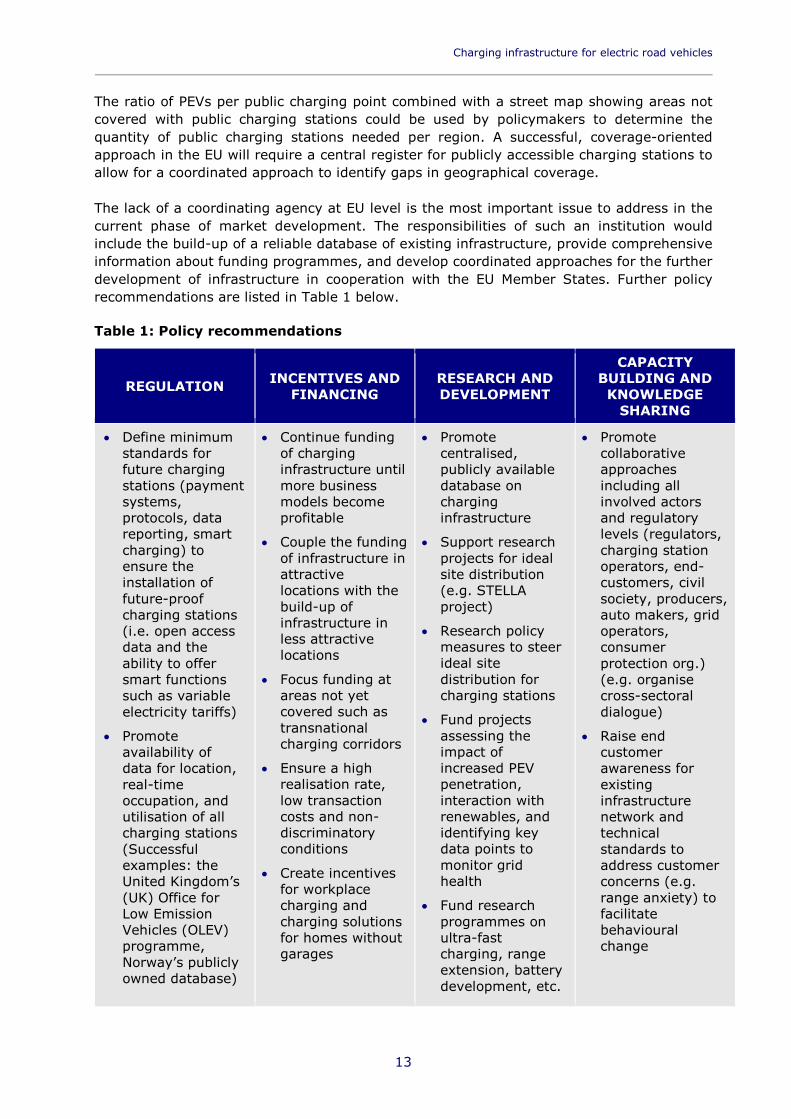
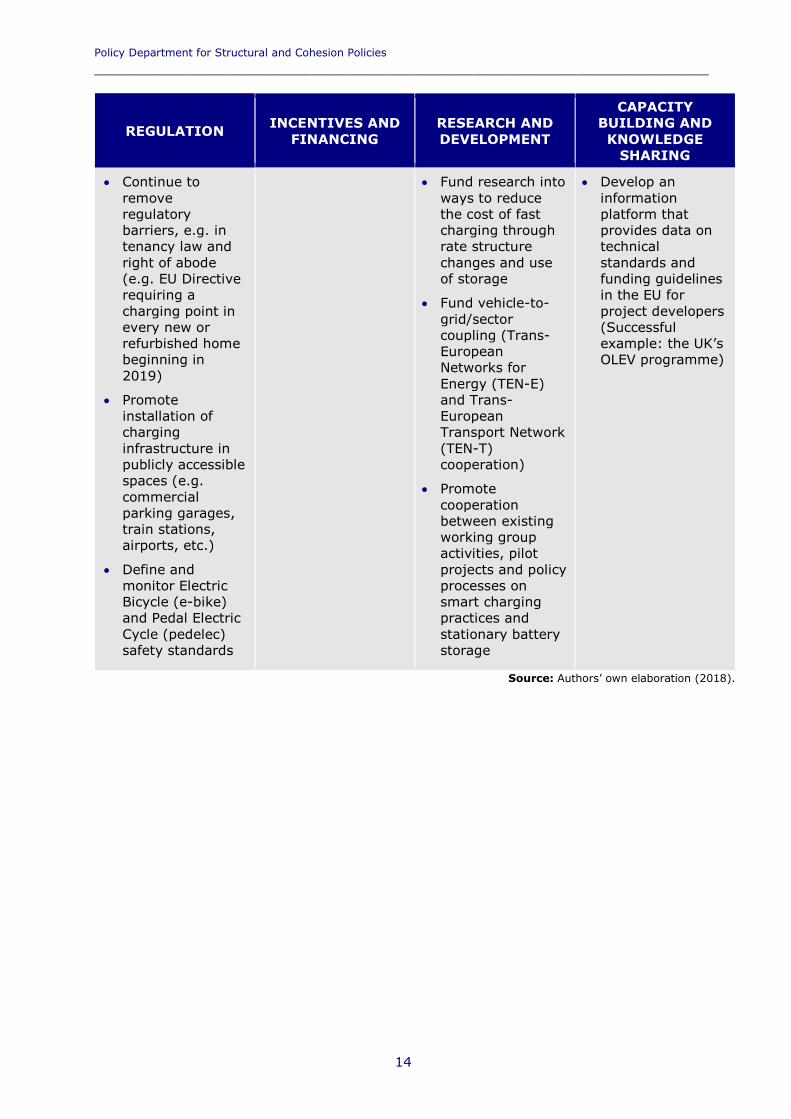
The ratio of PEVs per public charging point combined with a street map showing areas not covered with public charging stations could be used by policymakers to determine the quantity of public charging stations needed per region. A successful, coverage-oriented approach in the EU will require a central register for publicly accessible charging stations to allow for a coordinated approach to identify gaps in geographical coverage. The lack of a coordinating agency at EU level is the most important issue to address in the current phase of market development. The responsibilities of such an institution would include the build-up of a reliable database of existing infrastructure, provide comprehensive information about funding programmes, and develop coordinated approaches for the further development of infrastructure in cooperation with the EU Member States. Further policy recommendations are listed in Table 1 below. Table 1: Policy recommendations
REGULATION INCENTIVES AND FINANCING
RESEARCH AND DEVELOPMENT
CAPACITY BUILDING AND KNOWLEDGE
SHARING
• Define minimum standards for future charging stations (payment systems, protocols, data reporting, smart charging) to ensure the installation of future-proof charging stations (i.e. open access data and the ability to offer smart functions such as variable electricity tariffs)
• Promote availability of data for location, real-time occupation, and utilisation of all charging stations (Successful examples: the United Kingdom’s (UK) Office for Low Emission Vehicles (OLEV) programme, Norway’s publicly owned database)
• Continue funding of charging infrastructure until more business models become profitable
• Couple the funding of infrastructure in attractive locations with the build-up of infrastructure in less attractive locations
• Focus funding at areas not yet covered such as transnational charging corridors
• Ensure a high realisation rate, low transaction costs and non-discriminatory conditions
• Create incentives for workplace charging and charging solutions for homes without garages
• Promote centralised, publicly available database on charging infrastructure
• Support research projects for ideal site distribution (e.g. STELLA project)
• Research policy measures to steer ideal site distribution for charging stations
• Fund projects assessing the impact of increased PEV penetration, interaction with renewables, and identifying key data points to monitor grid health
• Fund research programmes on ultra-fast charging, range extension, battery development, etc.
• Promote collaborative approaches including all involved actors and regulatory levels (regulators, charging station operators, end-customers, civil society, producers, auto makers, grid operators, consumer protection org.) (e.g. organise cross-sectoral dialogue)
• Raise end customer awareness for existing infrastructure network and technical standards to address customer concerns (e.g. range anxiety) to facilitate behavioural change
Policy Department for Structural and Cohesion Policies _________________________________________________________________
14
REGULATION INCENTIVES AND FINANCING
RESEARCH AND DEVELOPMENT
CAPACITY BUILDING AND KNOWLEDGE
SHARING
• Continue to remove regulatory barriers, e.g. in tenancy law and right of abode (e.g. EU Directive requiring a charging point in every new or refurbished home beginning in 2019)
• Promote installation of charging infrastructure in publicly accessible spaces (e.g. commercial parking garages, train stations, airports, etc.)
• Define and monitor Electric Bicycle (e-bike) and Pedal Electric Cycle (pedelec) safety standards
• Fund research into ways to reduce the cost of fast charging through rate structure changes and use of storage
• Fund vehicle-to-grid/sector coupling (Trans-European Networks for Energy (TEN-E) and Trans-European Transport Network (TEN-T) cooperation)
• Promote cooperation between existing working group activities, pilot projects and policy processes on smart charging practices and stationary battery storage
• Develop an information platform that provides data on technical standards and funding guidelines in the EU for project developers (Successful example: the UK’s OLEV programme)
Source: Authors’ own elaboration (2018).
Charging infrastructure for electric road vehicles _________________________________________________________________________
15
1 INTRODUCTION
KEY FINDINGS
• The transition to low carbon transport is one of the key targets of the European Union’s (EU) current energy and climate policies. The EU set the target that by 2050, emissions from transport (excluding international waterborne transport) must be 60% lower than they were in 1990 and the EU must firmly be on the path towards full decarbonisation.
• The development of electromobility in the EU, with the exceptions of a few front-runner countries, has been rather slow.
• In the EU, the recharging infrastructure development is scattered and mainly coordinated at regional level. There are no explicit targets related to charging infrastructure at EU level, but rather a multitude of supporting measures.
• In addition to the lack of charging stations, there are different standards concerning the connector and rated power needed on the charger and vehicle side, as well as various payment methods.
• Nevertheless, the Plug-in Electric Vehicle (PEV) passenger car market share of new registrations has increased over the past five years, and so has the total stock of PEVs.
In the EU, the recharging infrastructure development is scattered and mainly coordinated at regional level. Individual EU Member States formulate targets and incentivise the deployment of charging infrastructure in accordance with Directive 2014/94/EU (Alternative Fuels Infrastructure Directive [AFID]). There are no explicit targets at EU level, but rather a multitude of supporting measures. As a result, most charging stations currently exist only in urban areas in Western European countries. An EU-wide network of fast chargers along the main motorways across the continent does currently not exist. In addition to simply the lack of stations, there are different standards concerning the connector and rated power needed on the charger and vehicle side, as well as the payment method. As a result, the business case for deploying a network of charging stations becomes even more challenging, because either all standards are accounted for or the operator risks narrowing the potential customer base to only those that have the matching connector. Standardisation of charging equipment can solve this issue and an EU-wide approach can help accelerate both the establishment of recharging infrastructure and the production of Electric Vehicles (EV).
1.1 The background to the topic The transition to low carbon transport is one of the key targets of the EU’s current energy and climate policies. The EU set the target that by 2050, emissions from transport (to the exclusion of international waterborne transport) must be 60% lower than they were in 1990 and the EU must firmly be on the path towards full decarbonisation.
Policy Department for Structural and Cohesion Policies _________________________________________________________________
16
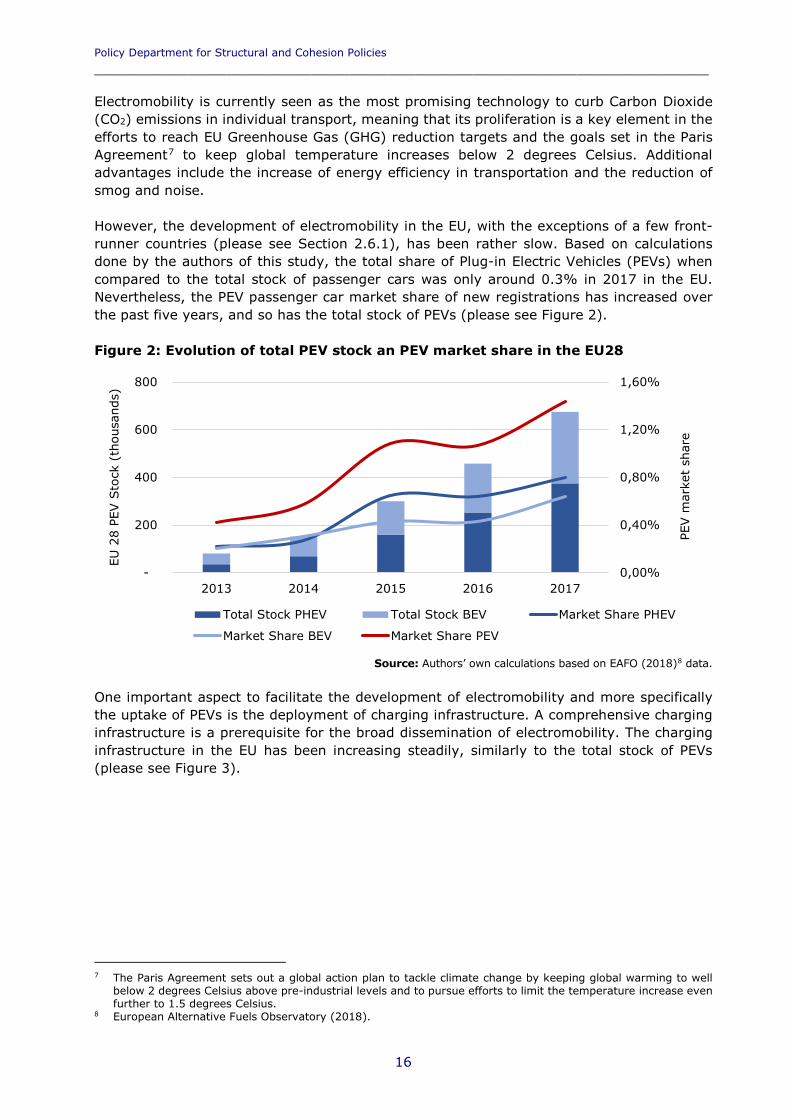
Electromobility is currently seen as the most promising technology to curb Carbon Dioxide (CO2) emissions in individual transport, meaning that its proliferation is a key element in the efforts to reach EU Greenhouse Gas (GHG) reduction targets and the goals set in the Paris Agreement7 to keep global temperature increases below 2 degrees Celsius. Additional advantages include the increase of energy efficiency in transportation and the reduction of smog and noise. However, the development of electromobility in the EU, with the exceptions of a few front-runner countries (please see Section 2.6.1), has been rather slow. Based on calculations done by the authors of this study, the total share of Plug-in Electric Vehicles (PEVs) when compared to the total stock of passenger cars was only around 0.3% in 2017 in the EU. Nevertheless, the PEV passenger car market share of new registrations has increased over the past five years, and so has the total stock of PEVs (please see Figure 2). Figure 2: Evolution of total PEV stock an PEV market share in the EU28
Source: Authors’ own calculations based on EAFO (2018)8 data.
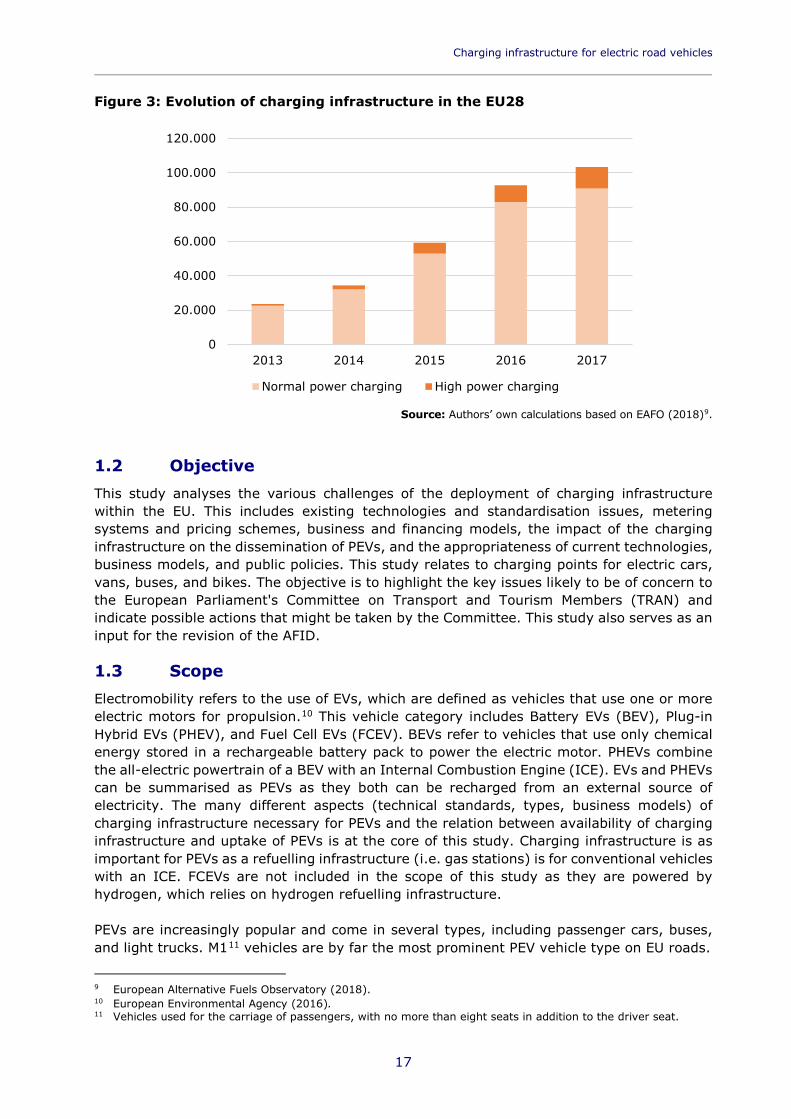
One important aspect to facilitate the development of electromobility and more specifically the uptake of PEVs is the deployment of charging infrastructure. A comprehensive charging infrastructure is a prerequisite for the broad dissemination of electromobility. The charging infrastructure in the EU has been increasing steadily, similarly to the total stock of PEVs (please see Figure 3).
7 The Paris Agreement sets out a global action plan to tackle climate change by keeping global warming to well
below 2 degrees Celsius above pre-industrial levels and to pursue efforts to limit the temperature increase even further to 1.5 degrees Celsius.
8 European Alternative Fuels Observatory (2018).
0,00%
0,40%
0,80%
1,20%
1,60%
-
200
400
600
800
2013 2014 2015 2016 2017
PEV m
arke
t sh
are
EU 2
8 PE
V S
tock
(th
ousa
nds)
Total Stock PHEV Total Stock BEV Market Share PHEV
Market Share BEV Market Share PEV
Charging infrastructure for electric road vehicles _________________________________________________________________________
17
Figure 3: Evolution of charging infrastructure in the EU28
Source: Authors’ own calculations based on EAFO (2018)9.
1.2 Objective This study analyses the various challenges of the deployment of charging infrastructure within the EU. This includes existing technologies and standardisation issues, metering systems and pricing schemes, business and financing models, the impact of the charging infrastructure on the dissemination of PEVs, and the appropriateness of current technologies, business models, and public policies. This study relates to charging points for electric cars, vans, buses, and bikes. The objective is to highlight the key issues likely to be of concern to the European Parliament's Committee on Transport and Tourism Members (TRAN) and indicate possible actions that might be taken by the Committee. This study also serves as an input for the revision of the AFID.
1.3 Scope Electromobility refers to the use of EVs, which are defined as vehicles that use one or more electric motors for propulsion.10 This vehicle category includes Battery EVs (BEV), Plug-in Hybrid EVs (PHEV), and Fuel Cell EVs (FCEV). BEVs refer to vehicles that use only chemical energy stored in a rechargeable battery pack to power the electric motor. PHEVs combine the all-electric powertrain of a BEV with an Internal Combustion Engine (ICE). EVs and PHEVs can be summarised as PEVs as they both can be recharged from an external source of electricity. The many different aspects (technical standards, types, business models) of charging infrastructure necessary for PEVs and the relation between availability of charging infrastructure and uptake of PEVs is at the core of this study. Charging infrastructure is as important for PEVs as a refuelling infrastructure (i.e. gas stations) is for conventional vehicles with an ICE. FCEVs are not included in the scope of this study as they are powered by hydrogen, which relies on hydrogen refuelling infrastructure. PEVs are increasingly popular and come in several types, including passenger cars, buses, and light trucks. M111 vehicles are by far the most prominent PEV vehicle type on EU roads.
9 European Alternative Fuels Observatory (2018). 10 European Environmental Agency (2016). 11 Vehicles used for the carriage of passengers, with no more than eight seats in addition to the driver seat.
0
20.000
40.000
60.000
80.000
100.000
120.000
2013 2014 2015 2016 2017
Normal power charging High power charging
Policy Department for Structural and Cohesion Policies _________________________________________________________________
18
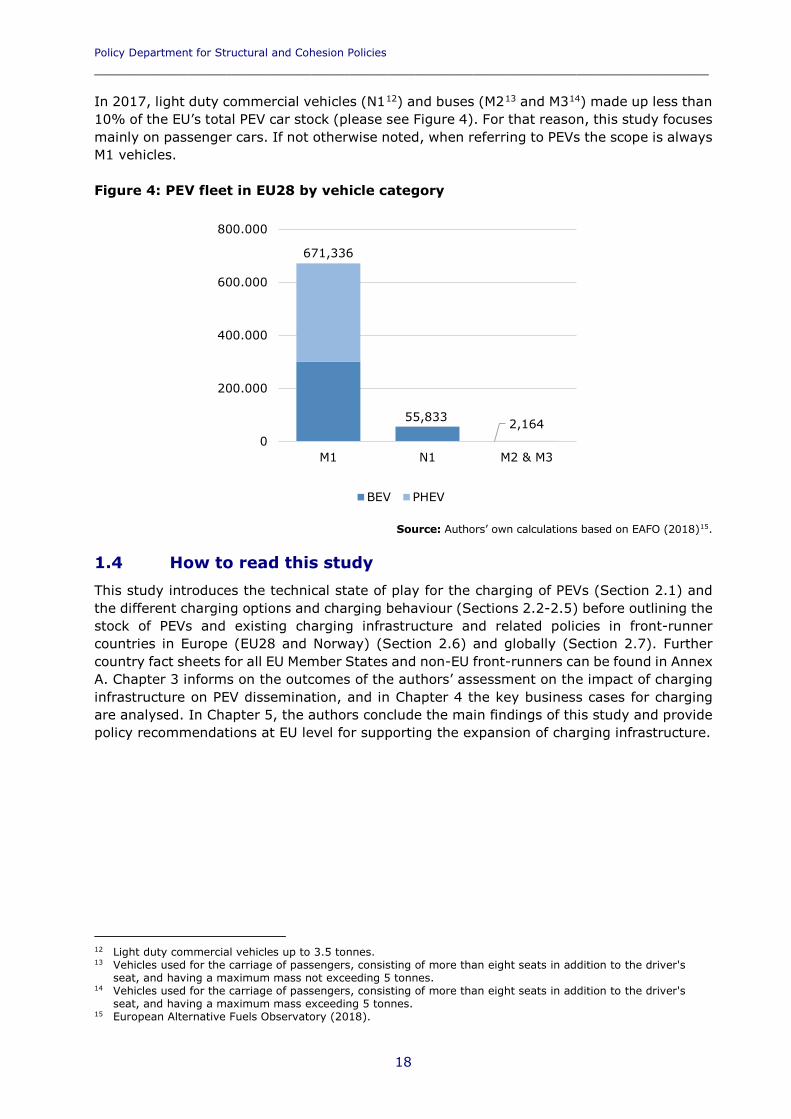
In 2017, light duty commercial vehicles (N112) and buses (M213 and M314) made up less than 10% of the EU’s total PEV car stock (please see Figure 4). For that reason, this study focuses mainly on passenger cars. If not otherwise noted, when referring to PEVs the scope is always M1 vehicles. Figure 4: PEV fleet in EU28 by vehicle category
Source: Authors’ own calculations based on EAFO (2018)15.
1.4 How to read this study This study introduces the technical state of play for the charging of PEVs (Section 2.1) and the different charging options and charging behaviour (Sections 2.2-2.5) before outlining the stock of PEVs and existing charging infrastructure and related policies in front-runner countries in Europe (EU28 and Norway) (Section 2.6) and globally (Section 2.7). Further country fact sheets for all EU Member States and non-EU front-runners can be found in Annex A. Chapter 3 informs on the outcomes of the authors’ assessment on the impact of charging infrastructure on PEV dissemination, and in Chapter 4 the key business cases for charging are analysed. In Chapter 5, the authors conclude the main findings of this study and provide policy recommendations at EU level for supporting the expansion of charging infrastructure.
12 Light duty commercial vehicles up to 3.5 tonnes. 13 Vehicles used for the carriage of passengers, consisting of more than eight seats in addition to the driver's
seat, and having a maximum mass not exceeding 5 tonnes. 14 Vehicles used for the carriage of passengers, consisting of more than eight seats in addition to the driver's
seat, and having a maximum mass exceeding 5 tonnes. 15 European Alternative Fuels Observatory (2018).
55,833 2,164
671,336
0
200.000
400.000
600.000
800.000
M1 N1 M2 & M3
BEV PHEV

Charging infrastructure for electric road vehicles _________________________________________________________________________
19
2 CURRENT STATE OF PLAY
KEY FINDINGS
This chapter provides an overview of the state of play regarding charging infrastructure. It is divided into sections on technical aspects of charging (Sections 2.1-2.4), charging behaviour (Section 2.5) and information on the situation in front-runner countries (Sections 2.6-2.7).
2.1 Technical state of play The refuelling of petrol or diesel cars is well-established and straightforward. There is only one way to deliver the fuel - through a fuel pump - and for most drivers only one place to access a fuel pump - at a retail petrol station. Plug-in EVs (PEVs), on the other hand, can be fuelled at different rates of speed and at many different locations, including at home. The complexity makes for a learning curve in the transition to using a PEV, but it also represents a key benefit for consumers: PEV drivers no longer need to travel to a central location to refuel. This chapter reviews the current state of PEV charging, both technologically and regarding where PEV charging occurs. Many types of vehicles (e.g. cars, trucks, or buses) can use standard PEV charging equipment to deliver power at various levels, with the difference that buses and trucks will most likely be charged at depots and that the much larger battery packs require significant power and energy to deliver a full charge. Electrification with overhead wires, as is done with some buses already, is not a part of this study. E-bikes and Pedal Electric Cycles (pedelecs) do not have a specific plug but are primarily charged with a conventional plug for the respective national socket that can power removable batteries. Electric bicycles (e-bikes) are bikes with an integrated electric motor, whereas a pedelec is a bicycle where the rider is assisted by a small electric motor.
KEY FINDINGS
• In contrast to conventionally fuelled vehicles, Electric Vehicle (EV) charging does not take place at a central location.
• While normal charging speeds are mostly covered by Alternating Current (AC) charging power, fast charging is performed with Direct Current (DC) charging power, which allows for much shorter charging times but incurs higher costs to the end consumer.
• Fast DC charging stations availability is currently low, but there are efforts to increase public availability and further push power levels from 50 Kilowatt (kW) to up to 400kW.
• Alternative charging technologies such as battery swapping, wireless charging, rapid bus charging and supercapacitors are not yet commercially viable on a large scale.
• Broad access to public charging infrastructure depends on standardised physical plugs and payment systems that are interoperable across different operators. European Union (EU) legislation requires minimum standards for physical plugs and payment systems so that interoperability between operators will likely be implemented soon.
• Front-runner countries on electromobility in Europe include the Netherlands, Germany, the United Kingdom (UK), France, and Norway. Outside of Europe, China and the United States of America (USA) lead.
Policy Department for Structural and Cohesion Policies _________________________________________________________________
20
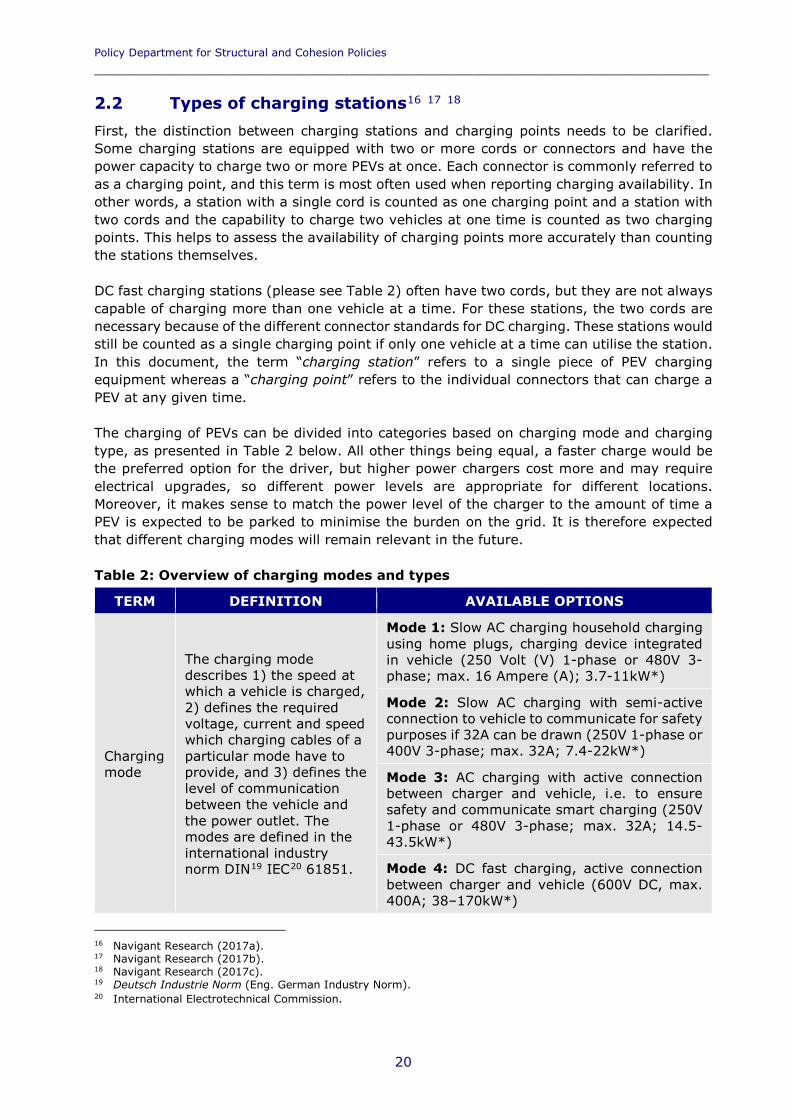
2.2 Types of charging stations16 17 18 First, the distinction between charging stations and charging points needs to be clarified. Some charging stations are equipped with two or more cords or connectors and have the power capacity to charge two or more PEVs at once. Each connector is commonly referred to as a charging point, and this term is most often used when reporting charging availability. In other words, a station with a single cord is counted as one charging point and a station with two cords and the capability to charge two vehicles at one time is counted as two charging points. This helps to assess the availability of charging points more accurately than counting the stations themselves. DC fast charging stations (please see Table 2) often have two cords, but they are not always capable of charging more than one vehicle at a time. For these stations, the two cords are necessary because of the different connector standards for DC charging. These stations would still be counted as a single charging point if only one vehicle at a time can utilise the station. In this document, the term “charging station” refers to a single piece of PEV charging equipment whereas a “charging point” refers to the individual connectors that can charge a PEV at any given time. The charging of PEVs can be divided into categories based on charging mode and charging type, as presented in Table 2 below. All other things being equal, a faster charge would be the preferred option for the driver, but higher power chargers cost more and may require electrical upgrades, so different power levels are appropriate for different locations. Moreover, it makes sense to match the power level of the charger to the amount of time a PEV is expected to be parked to minimise the burden on the grid. It is therefore expected that different charging modes will remain relevant in the future. Table 2: Overview of charging modes and types
TERM DEFINITION AVAILABLE OPTIONS
Charging mode
The charging mode describes 1) the speed at which a vehicle is charged, 2) defines the required voltage, current and speed which charging cables of a particular mode have to provide, and 3) defines the level of communication between the vehicle and the power outlet. The modes are defined in the international industry norm DIN19 IEC20 61851.
Mode 1: Slow AC charging household charging using home plugs, charging device integrated in vehicle (250 Volt (V) 1-phase or 480V 3-phase; max. 16 Ampere (A); 3.7-11kW*)
Mode 2: Slow AC charging with semi-active connection to vehicle to communicate for safety purposes if 32A can be drawn (250V 1-phase or 400V 3-phase; max. 32A; 7.4-22kW*)
Mode 3: AC charging with active connection between charger and vehicle, i.e. to ensure safety and communicate smart charging (250V 1-phase or 480V 3-phase; max. 32A; 14.5-43.5kW*)
Mode 4: DC fast charging, active connection between charger and vehicle (600V DC, max. 400A; 38–170kW*)
16 Navigant Research (2017a). 17 Navigant Research (2017b). 18 Navigant Research (2017c). 19 Deutsch Industrie Norm (Eng. German Industry Norm). 20 International Electrotechnical Commission.
Charging infrastructure for electric road vehicles _________________________________________________________________________
21
TERM DEFINITION AVAILABLE OPTIONS
Charging type
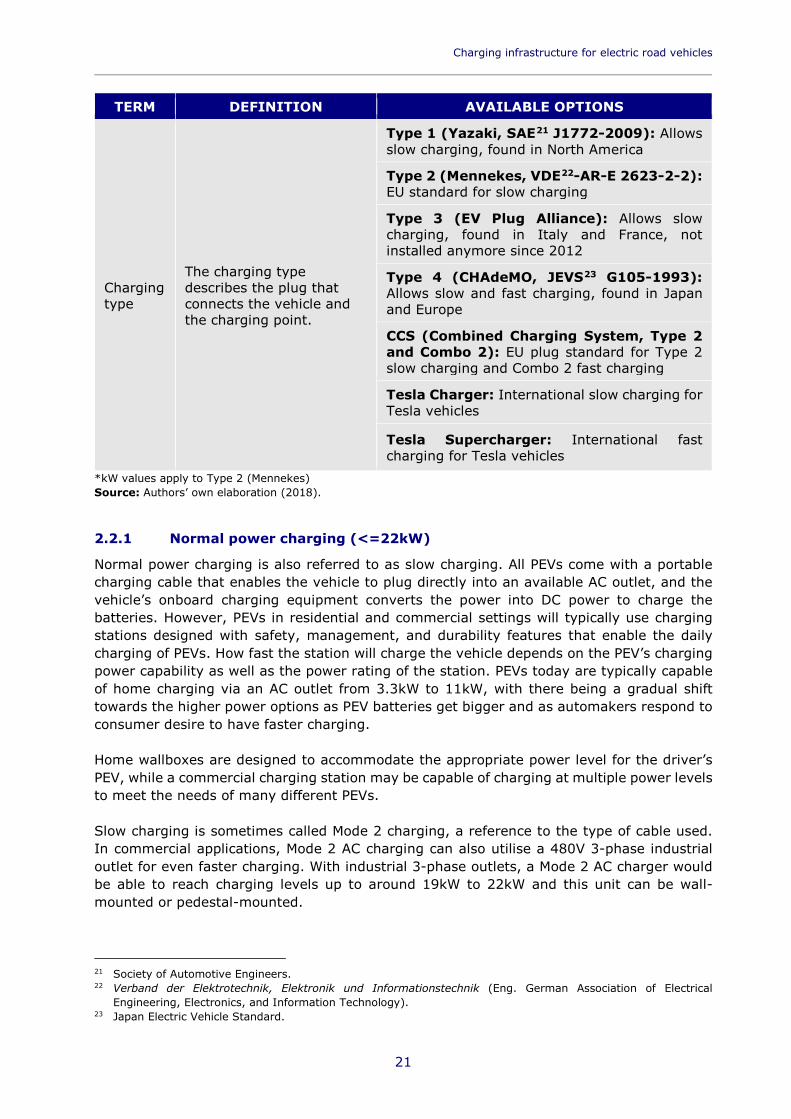
The charging type describes the plug that connects the vehicle and the charging point.
Type 1 (Yazaki, SAE21 J1772-2009): Allows slow charging, found in North America
Type 2 (Mennekes, VDE22-AR-E 2623-2-2): EU standard for slow charging
Type 3 (EV Plug Alliance): Allows slow charging, found in Italy and France, not installed anymore since 2012
Type 4 (CHAdeMO, JEVS23 G105-1993): Allows slow and fast charging, found in Japan and Europe
CCS (Combined Charging System, Type 2 and Combo 2): EU plug standard for Type 2 slow charging and Combo 2 fast charging
Tesla Charger: International slow charging for Tesla vehicles
Tesla Supercharger: International fast charging for Tesla vehicles
*kW values apply to Type 2 (Mennekes) Source: Authors’ own elaboration (2018).
2.2.1 Normal power charging (<=22kW)
Normal power charging is also referred to as slow charging. All PEVs come with a portable charging cable that enables the vehicle to plug directly into an available AC outlet, and the vehicle’s onboard charging equipment converts the power into DC power to charge the batteries. However, PEVs in residential and commercial settings will typically use charging stations designed with safety, management, and durability features that enable the daily charging of PEVs. How fast the station will charge the vehicle depends on the PEV’s charging power capability as well as the power rating of the station. PEVs today are typically capable of home charging via an AC outlet from 3.3kW to 11kW, with there being a gradual shift towards the higher power options as PEV batteries get bigger and as automakers respond to consumer desire to have faster charging. Home wallboxes are designed to accommodate the appropriate power level for the driver’s PEV, while a commercial charging station may be capable of charging at multiple power levels to meet the needs of many different PEVs. Slow charging is sometimes called Mode 2 charging, a reference to the type of cable used. In commercial applications, Mode 2 AC charging can also utilise a 480V 3-phase industrial outlet for even faster charging. With industrial 3-phase outlets, a Mode 2 AC charger would be able to reach charging levels up to around 19kW to 22kW and this unit can be wall-mounted or pedestal-mounted.
21 Society of Automotive Engineers. 22 Verband der Elektrotechnik, Elektronik und Informationstechnik (Eng. German Association of Electrical
Engineering, Electronics, and Information Technology). 23 Japan Electric Vehicle Standard.
Policy Department for Structural and Cohesion Policies _________________________________________________________________
22
Whenever a car is parked for several hours or overnight, Mode 2 AC charging is a good option. It can also fully serve the needs of Plug-in Hybrid Electric Vehicles (PHEVs) with its much smaller batteries. The costs of these stations vary widely depending on whether they are destined for home or commercial use, the power level, and other features such as network connections.
2.2.2 High power charging (>22kW)
There are two main options for fast charging (i.e. high-power charging): AC and DC charging. A fast charging mode that uses 3-phase AC power can provide power levels up to 43kW. The Renault Zoe, which continues to be one of the biggest sellers in the EU market, is capable of 43kW AC charging when connected with a 62A 240V outlet. However, this level of charging is only applicable where 3-phase power is offered and it is not widespread beyond the Zoe. It has the benefit of faster charging than other AC chargers, but at a lower cost than DC fast charging technology, the fast charging used by almost all automakers. DC fast charging provides power at a higher rate than most AC charging. A DC charger converts the AC power from the grid to DC power required for direct battery charging. This is primarily a service for Battery Electric Vehicles (BEVs) rather than most PHEVs (apart from the Mitsubishi Outlander PHEV), as the higher rate of power from DC equipment is needed to fully charge a large battery within an acceptable time-frame. A DC charging station costs significantly more than an AC charging station, but provides a charge in much less time. Most DC chargers today offer power at 50kW, although there are some that are lower, at around 20–25kW. More significantly, there is currently a push towards DC chargers at 100–150kW power levels, and even up to 400kW, to serve the next generation of PEVs with much bigger (80 Kilowatt-hour (kWh) and higher) batteries. The goal of a DC charger is to be able to provide up to 80% of the PEV’s charging levels in 20 minutes or less. With batteries becoming larger (i.e. increased electrical storage capacity), DC charging will move to higher power levels to continue to meet this goal. At present, fast charging puts a strain on batteries, especially if fast charging is carried out often. Furthermore, charging speeds beyond 150kW require a different standard of technical hardware in the vehicle. According to expert opinion power levels higher than 150kW will, at least in the short and medium term, only be relevant for a small premium segment. Such high-power levels are a technological challenge for the battery, and the availability of models that can charge with these power levels will remain limited.
Charging infrastructure for electric road vehicles _________________________________________________________________________
23
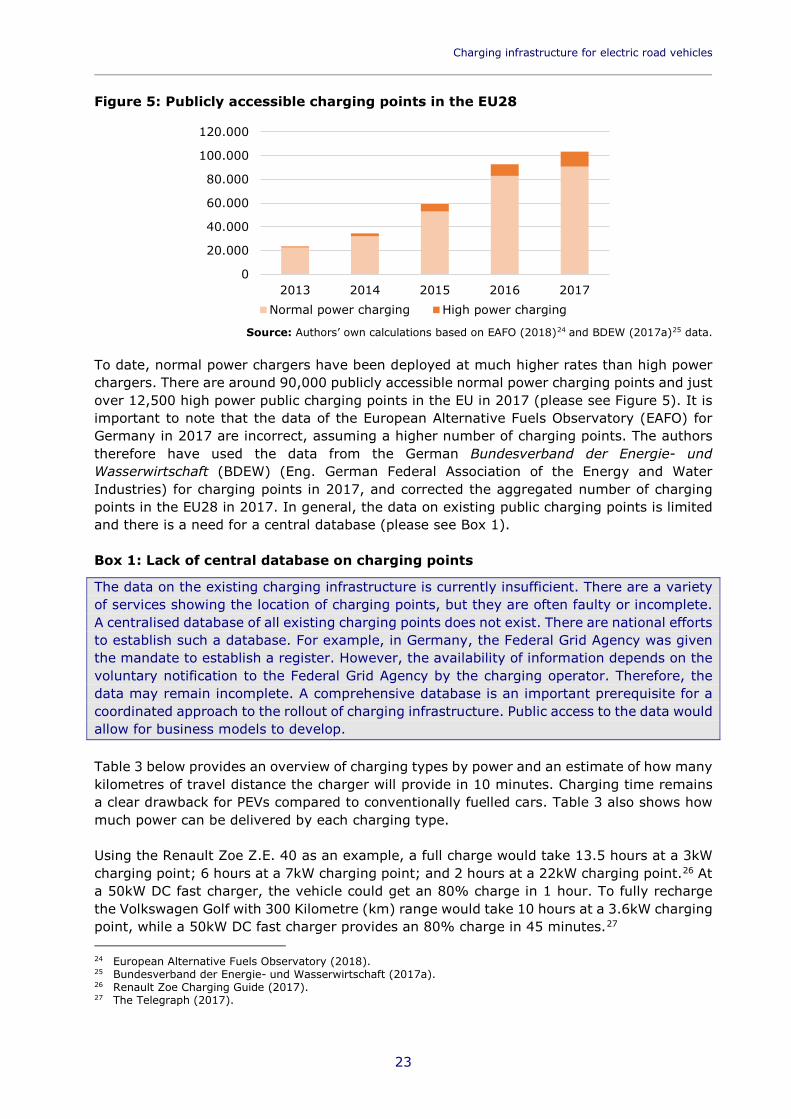
Figure 5: Publicly accessible charging points in the EU28
Source: Authors’ own calculations based on EAFO (2018)24 and BDEW (2017a)25 data.
To date, normal power chargers have been deployed at much higher rates than high power chargers. There are around 90,000 publicly accessible normal power charging points and just over 12,500 high power public charging points in the EU in 2017 (please see Figure 5). It is important to note that the data of the European Alternative Fuels Observatory (EAFO) for Germany in 2017 are incorrect, assuming a higher number of charging points. The authors therefore have used the data from the German Bundesverband der Energie- und Wasserwirtschaft (BDEW) (Eng. German Federal Association of the Energy and Water Industries) for charging points in 2017, and corrected the aggregated number of charging points in the EU28 in 2017. In general, the data on existing public charging points is limited and there is a need for a central database (please see Box 1). Box 1: Lack of central database on charging points
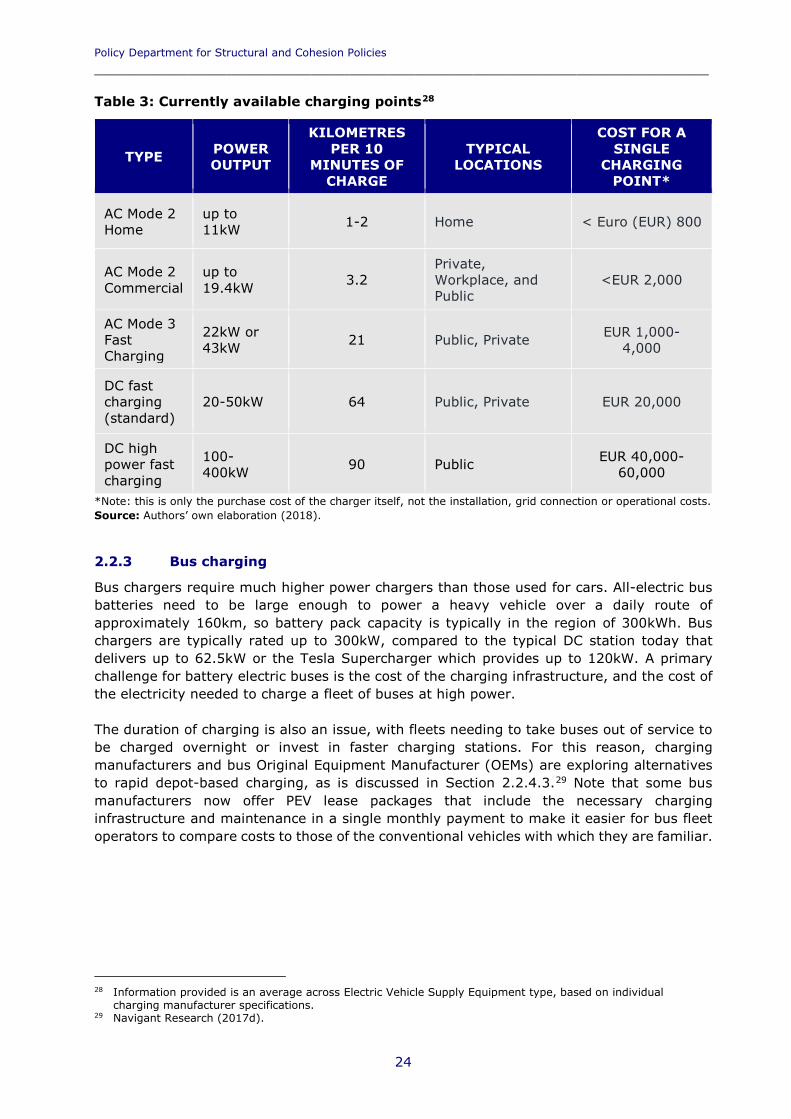
The data on the existing charging infrastructure is currently insufficient. There are a variety of services showing the location of charging points, but they are often faulty or incomplete. A centralised database of all existing charging points does not exist. There are national efforts to establish such a database. For example, in Germany, the Federal Grid Agency was given the mandate to establish a register. However, the availability of information depends on the voluntary notification to the Federal Grid Agency by the charging operator. Therefore, the data may remain incomplete. A comprehensive database is an important prerequisite for a coordinated approach to the rollout of charging infrastructure. Public access to the data would allow for business models to develop. Table 3 below provides an overview of charging types by power and an estimate of how many kilometres of travel distance the charger will provide in 10 minutes. Charging time remains a clear drawback for PEVs compared to conventionally fuelled cars. Table 3 also shows how much power can be delivered by each charging type. Using the Renault Zoe Z.E. 40 as an example, a full charge would take 13.5 hours at a 3kW charging point; 6 hours at a 7kW charging point; and 2 hours at a 22kW charging point.26 At a 50kW DC fast charger, the vehicle could get an 80% charge in 1 hour. To fully recharge the Volkswagen Golf with 300 Kilometre (km) range would take 10 hours at a 3.6kW charging point, while a 50kW DC fast charger provides an 80% charge in 45 minutes.27 24 European Alternative Fuels Observatory (2018). 25 Bundesverband der Energie- und Wasserwirtschaft (2017a). 26 Renault Zoe Charging Guide (2017). 27 The Telegraph (2017).
0
20.000
40.000
60.000
80.000
100.000
120.000
2013 2014 2015 2016 2017Normal power charging High power charging
Policy Department for Structural and Cohesion Policies _________________________________________________________________
24
Table 3: Currently available charging points28
TYPE POWER OUTPUT
KILOMETRES PER 10
MINUTES OF CHARGE
TYPICAL LOCATIONS
COST FOR A SINGLE
CHARGING POINT*
AC Mode 2 Home
up to 11kW 1-2 Home < Euro (EUR) 800
AC Mode 2 Commercial
up to 19.4kW 3.2
Private, Workplace, and Public
<EUR 2,000
AC Mode 3 Fast Charging
22kW or 43kW 21 Public, Private EUR 1,000-
4,000
DC fast charging (standard)
20-50kW 64 Public, Private EUR 20,000
DC high power fast charging
100-400kW 90 Public EUR 40,000-
60,000
*Note: this is only the purchase cost of the charger itself, not the installation, grid connection or operational costs. Source: Authors’ own elaboration (2018).
2.2.3 Bus charging
Bus chargers require much higher power chargers than those used for cars. All-electric bus batteries need to be large enough to power a heavy vehicle over a daily route of approximately 160km, so battery pack capacity is typically in the region of 300kWh. Bus chargers are typically rated up to 300kW, compared to the typical DC station today that delivers up to 62.5kW or the Tesla Supercharger which provides up to 120kW. A primary challenge for battery electric buses is the cost of the charging infrastructure, and the cost of the electricity needed to charge a fleet of buses at high power. The duration of charging is also an issue, with fleets needing to take buses out of service to be charged overnight or invest in faster charging stations. For this reason, charging manufacturers and bus Original Equipment Manufacturer (OEMs) are exploring alternatives to rapid depot-based charging, as is discussed in Section 2.2.4.3.29 Note that some bus manufacturers now offer PEV lease packages that include the necessary charging infrastructure and maintenance in a single monthly payment to make it easier for bus fleet operators to compare costs to those of the conventional vehicles with which they are familiar.
28 Information provided is an average across Electric Vehicle Supply Equipment type, based on individual
charging manufacturer specifications. 29 Navigant Research (2017d).
Charging infrastructure for electric road vehicles _________________________________________________________________________
25
Box 2: Safety of charging
In the fall of 2013, three fires were caused by PEVs (Tesla), raising doubts about the technology’s safety. Accidents related to PEVs can occur due to electric, thermal, or chemical safety hazards both during the charging process and the use of the vehicle. For electric cars, the safety standards of lithium ion batteries are set in the international standard IEC 62660 (sections 1-4). This norm prescribes testing procedures addressing the electric, thermal, and chemical safety of batteries. Charging modes and the respective safety norms are defined in the international industry norm DIN IEC 61851. Various studies and crash tests have shown that in accidents, EVs are at least as safe as combustion engine vehicles.30 31 32 One safety hazard arises from the wrong handling of charging equipment by the end user. Therefore, intuitive equipment and the instruction of end users is an important factor to ensure a high safety standard. In the case of DC chargers, extremely high levels of power are delivered, which present a new challenge for cooling. While all chargers are cooled, fast chargers with 300kW and above require liquid cooling in the cables to dissipate the heat inside. The risks and required safety measures are known, but no incidents have happened so far. There are potential safety concerns surrounding wireless charging. Since the charging occurs without direct human control, it must be designed to respond safely to the presence of foreign objects and living objects under or near the electromagnetic field. For example, metal objects that roll under the charging vehicle could heat up, so the vehicle must be able to detect the presence of such an object and respond appropriately. Similarly, the charging system should recognise and protect an animal or child that enters the electromagnetic field. These safety issues are well understood by developers, and standards are being developed by the IEC as well as the USA based automotive professional association, and the standards developing organisation SAE International. Overall, there are no indications that EVs pose higher risks than Internal Combustion Engine (ICE) vehicles. In the case of e-bikes and pedelecs, safety continues to be a concern. Risks emerge from the use of chargers not approved by the manufacturer, the lack of battery management systems to monitor the batteries and avoid overloading, and the uncontrolled global trade with different vehicle types. There have been several incidents, such as a fire at a bike dealer in the Netherlands caused by a pedelec.33
2.2.4 Alternative charging technologies
For the most part, current charging technologies – separate AC or DC charging units with a cord that connects to the vehicle – are sufficient to satisfy the PEV market as it is today. However, alternatives to the current technology have spurred interest with the promise of addressing some of the drawbacks of PEV charging, such as the length of charge time. Battery swapping (an alternative to charging), wireless charging, rapid bus charging, and supercapacitors are four emerging technologies sparking interest.
30 Allgemeiner Deutscher Automobil-Club (2017). 31 Dekra (2012). 32 Schaufenster Elektromobilität (2017). 33 Bike Europe (2018).
Policy Department for Structural and Cohesion Policies _________________________________________________________________
26
2.2.4.1 Battery Swapping
Battery swapping offers the promise of circumventing PEV recharging time and range limitation issues. A battery swapping station allows the PEV driver to replace the entire battery pack in minutes. While not a charging technology, this concept could offer an alternative to the need for conventional public charging equipment. The concept attracted the greatest level of interest and investment in the early years of the PEV market, from 2008-2014. During this period, a few countries adopted public battery swapping installations, including China, Denmark, and Israel. However, battery swapping requires all vehicles to be designed for easy battery access and standardisation across automakers’ vehicles. This is not often the case, so it is a significant barrier to this solution being adopted widely. In addition, battery swapping stations are costly; early estimates were that a station could cost around EUR 400,000 to install.34 Adding to these challenges, batteries are one of the PEV components that is evolving the most rapidly. It would add further costs to battery swap stations to maintain the most current technology for customers. Together, these challenges have prevented battery swapping from taking hold as a commercially viable alternative to charging and the solution has largely been dropped in most PEV markets.35 One notable exception is China, which has continued to pursue battery swapping in its portfolio of PEV charging options.36 The State Grid Corporation of China plans to expand on its existing network of battery swapping stations. Chinese automaker Nio unveiled the ES8, an all-electric Sport Utility Vehicle (SUV) that is equipped for battery swapping.37 Tesla has also been developing battery swapping technology over the years.38 Battery swapping could become a viable solution in certain fleet applications that use only vehicles of one car manufacturer. Indeed, the battery swapping solution is likely highly desirable in automated driving environments due to the speed by which a vehicle may be placed back into service, and ancillary benefits such as the ability of a company to monitor, maintain, and recycle batteries and employ off-vehicle batteries in various grid service markets. Battery swapping may eventually return as a viable solution for transportation electrification as automated, shared mobility services comprise a larger share of the personal vehicle market.
2.2.4.2 Wireless Charging
An emerging technology is wireless charging, which allows a vehicle to charge without being plugged into a charging station. A wireless charging system consists of a ground pad that lies beneath a parked vehicle and a receiving system embedded into the underside of the PEV that connects to the vehicle’s power electronics and battery systems. Power is transmitted from the ground pad to the receiver, charging the car. The system also has a control unit mounted in proximity to the ground pad that manages the charging. The primary benefit of wireless charging is the ease of use, since the driver no longer has to plug into the PEV every time they want to charge the car. Other benefits are the lack of cord management, most likely to be a concern in public charging locations where a lengthy charging cord may prove a hazard to the public right-of-way or drivers may not consistently return plugs to the charger. There may also be an aesthetic benefit of not having chargers with dangling cords in public spaces. However, wireless charging is more expensive than
34 Business Insider (2009). 35 Navigant Research (2013). 36 Next Big Future (2017). 37 Green Car Reports (2017). 38 Electrek (2017a).
Charging infrastructure for electric road vehicles _________________________________________________________________________
27
current wired solutions. It is also less efficient than wired charging due to the transfer of power through the air. However, this reduced efficiency is negligible. Although aftermarket wireless charging technology has been available since 2014, wireless charging will primarily be offered as a factory-installed option by automakers. Almost all auto OEMs (i.e. automakers), and a few tier one suppliers39, have been pursuing wireless PEV charging for several years, with a few announcing plans to introduce wireless charging in production vehicles as early as 2018. However, wireless charging is still a technology under development for commercial launch, with a host of complex operational and safety issues that must be addressed. For example, the wireless system must be able to charge PEVs with various ground clearance levels, especially if they will be placed in a public charging location. Also, wireless charging stations must allow some variance in the vehicle placement over the ground pad. The wireless system must be able to detect the presence of living or foreign objects in the charging field and respond appropriately. Technology developers are ahead in addressing these challenges, but the full-scale commercial launch of wireless charging is still likely to take a couple of years. In addition, for wireless charging to truly compete against the current field of conductive charging technologies, there needs to be industry standards that will allow wireless chargers to be readily deployed across the spectrum of PEVs. Industry stakeholders are working through the SAE to establish such standards, and in November 2017, the SAE published its “J2954 Recommended Practice for Wireless Power Transfer for Electric Vehicles”. This standard specifies acceptable criteria for interoperability, electromagnetic compatibility, minimum performance, safety, and testing. Finally, for this technology to replace conventional charging, it is likely that developers and automakers must either bring down costs or absorb the costs as part of the vehicle’s purchase price. It is possible that the convenience will be enough to spur drivers to adopt wireless charging in spite of the higher cost, but it is unclear at present how much and how quickly this technology will be embraced. It is likely that the first market will be with premium model PEVs as an option for home charging. Car-sharing or taxi fleets may find wireless charging attractive as a way to ensure PEVs are being charged without relying on the drivers to plug them in. Wireless charging could be attractive in public charging applications in the long term, but this is not likely to occur until the technology is widespread among the PEV fleet. Dynamic charging is another wireless option. With dynamic charging, the charging technology is embedded in the roadway, and vehicles receive a charge when they drive over it. This technology option is not as close to commercial viability as stationary wireless charging is. It would be an even more costly alternative than stationary wireless charging because it needs to be built into lengths of roadway. As discussed in the next Section 2.2.4.3, it is being pursued especially for bus or other fleet operations that drive a set route, where the cost of roadway upgrades could be limited.40
2.2.4.3 Rapid Bus Charging
As it becomes available, rapid bus charging could help to overcome the charging barrier and deal with range anxiety for bus fleets. Since they operate on a fixed route, buses could top up battery charge via a wireless connection at a rest point or turnaround. This solution would also allow the use of smaller, lighter, and cheaper battery packs. Such systems have been
39 A tier one supplier is a company supplying components (e.g. doors, light modules) directly to the OEM that set
up the car industry supply chain. 40 Navigant Research (2018).
Policy Department for Structural and Cohesion Policies _________________________________________________________________
28
tested in Italy, Germany, South Korea, the USA, and the United Kingdom (UK). The biggest challenge to widespread adoption is the agreement on technical standards. Some systems use induction charge plates under the road surface and some manufacturers prefer an overhead system that makes contact via an automated pantograph, either on the bus or on the charging station to eliminate the need for a manually inserted plug. For example, in the USA, electric bus manufacturer Proterra has offered licence-free use of its patented overhead, en route, opportunity charging system to encourage cooperation among OEMs. In 2016, ABB41 introduced a 600kW flash charger that is designed to top up bus batteries in about 15 seconds at bus stops. The bus can receive a full recharge when it returns to the bus depot, using a lower power charger. In 2017, ABB announced a 450kW Opportunity Charging (OppCharge) system to be trialled with Volvo. These options all present their own cost challenges, as the infrastructure must be deployed across the bus routes, rather than simply at the centralised depots, but they offer a solution to the problems of significant downtime for charging and costs related to high power charger installations.42 43 44
2.2.4.4 Supercapacitors
Capacitors offer an alternative to batteries for electrical energy storage via electric charge between two plates rather than through chemical changes. The larger capacity components are typically referred to as supercapacitors or ultracapacitors. Supercapacitors offer a very high power density compared to most batteries, which means they can be recharged much quicker. The main shortcoming of supercapacitors is their low energy density (i.e. storage capacity). Thus, they are better suited for mild-hybrid and stop-start applications than long-range, all-electric drive. Supercapacitors also have a good reputation for long life without degradation and operate with little sensitivity over a wide range of temperatures.45 Due to their low storage capacity, supercapacitors are very limited, niche and so far, no company has successfully produced them at cost competitively.
2.3 Standardisation of physical plugs in electric vehicles There has been a lot of discussion about the interoperability of charging types and the lack of standardisation for physical plugs. Interoperability of charging stations is key, especially for the realisation of cross-border travel. Charging stations are considered interoperable if they can serve a large variety of PEV models and offer payment methods that are accessible for all PEV drivers. Standardisation guarantees interoperability, provides clarity to manufacturers, allows for economies of scale, and ensures that safety standards are complied with. Besides the physical plugs and sockets, standardisation is relevant for charging protocols and payment systems, which will be discussed in Section 2.4. The aim to standardise PEV plugs can be traced back to the 1900s, but the introduction of common standards began much later. In the absence of clear legislation, different plug designs were developed in Europe and globally, which is presented in Table 4 for AC charging and in Table 5 for DC charging. 41 ABB is a Swedish-Swiss multinational corporation operating mainly in electrical equipment, power, automation
technology, and robotics. 42 Inside EVs (2016). 43 Electrek (2016). 44 ABB Group (2017). 45 Navigant Research (2017e).
Charging infrastructure for electric road vehicles _________________________________________________________________________
29
Table 4: Type and geographical distribution of the most common AC charging connectors
TYPE Type 1 (Yazaki) Type 2 (Mennekes)
Type 3 (EV Plug Alliance)
Tesla (USA)
GEOGRAPHIC DISTRIBUTION
North America, Japan
Europe, China Italy, France
Tesla vehicles in North America
AUTOMAKERS USA and Japanese automakers
Mandatory for EU sales
Not produced anymore Tesla
Source: Authors’ own elaboration (2018).
Table 5: Type and geographical distribution of the most common DC charging connectors
TYPE Type 4 (CHAdeMO)
CCS COMBO1 (North America)
CCS COMBO2 (Europe) Supercharger
GEOGRAPHIC DISTRIBUTION
Japan, Europe (until 2019)
North America Europe
North America, Europe
AUTOMAKERS Nissan, Mitsubshi, Kia, Citroën, Peugeot
BMW, Daimler, Ford, Fiat Chrysler, General Motors, Honda, Hyundai, Volkswagen
Tesla vehicles
Source: Authors’ own elaboration (2018). In 2014, the European Commission introduced the EN 62196 Type 2 standard, also known as the Mennekes plug, for slow charging. The Combo 2 was also introduced for fast charging as minimum standards for the equipment of charging points.46 Combo 2 is based on the CCS, the international norm for EVs: IEC 62196. In theory, future physical interoperability is warranted in Europe. However, some slow charging stations are equipped with Type 3 plugs and many fast charging stations today are equipped with both a Type 4 (also known as CHAdeMO) and a CCS Combo connector. This enables charging by vehicles with either type (they are not equipped with a Tesla connector as Tesla continues to manufacture, own, and operate its own line of fast chargers). Charging stations with Type 3 plugs for slow charging and the Japanese standard CHAdeMO for fast charging had already been built before 2014, so that individual charging stations may still not be operable for all vehicle models. To date, over 4,000 CHAdeMO stations are installed in Europe.47 Type 3 charging stations were built in Italy and France until 2012, but are no longer installed since Type 2 charging became the dominant charging connector in the EU. For such cases where physical interoperability is not fully warranted, there have been some bilateral attempts to further harmonise standards. Attempts include the project CROME, a German-French cooperation that agreed to offer Type 2 and Type 3 plugs in the regions Alsace, Lorraine, Rhineland-Palatinate, Saarland, and Baden-Württemberg. As a result, PEV drivers do not need to transport additional cables in the region anymore.48 46 Directive 2014/94/EU on the deployment of alternative fuels infrastructure (2014). 47 CHAdeMO (2017). 48 Karlsruhe Institute of Technology (2018).
Policy Department for Structural and Cohesion Policies _________________________________________________________________
30
At present, slow charging does not face significant technology standardisation issues. What may cause some confusion among consumers is the different charging levels that each PEV is capable of – which in turn determines the type of wallbox charger they should buy if they intend to charge at home. While consumers should be given guidance on this during the purchase process, any confusion over the charging process could cause some consumers to be wary of buying a PEV. For DC fast charging, automakers have developed three different DC fast charging standards for their vehicles: CCS Combo, Type 4 (CHAdeMO), and the Tesla Supercharger. Each supports specific plugs and adapters and each is championed by a single or set of automakers. Supercharger stations apply only to Tesla BEVs. CCS Combo is the standard of choice for most USA and German car companies including General Motors, Ford, Volkswagen/Audi, BMW, and Daimler. CHAdeMO is preferred by Japanese and French car companies, including Nissan, Mitsubishi, and Peugeot. Kia has opted for a CHAdeMO plug on its BEVs (like the Kia Soul), but the Hyundai Ioniq will use CCS Combo for its high-power charging. To satisfy the higher power requirements of medium and heavy-duty vehicles, many manufacturers have developed proprietary fast charging solutions of up to 400kW. This includes both cabled solutions that plug into the chassis, and overhead pantograph systems. With the power of light duty charging reaching 300-400kW, there is a potential for the same standard connectors to be offered on electric buses and trucks. PEVs are generally equipped to use only one type of DC fast charging plug. As such, PEVs that only have a CHAdeMO plug are not able to use DC fast charging stations that require a CCS Combo plug, and vice versa. However, more charging equipment manufacturers are delivering products with connectors that support both standards. Globally, it does not appear that automakers will coalesce around a single connector standard (as indicated by the different options chosen by different OEMs). This adds some cost to the equipment because of the need for two cords and connectors. In addition, as the cables need to be cooled, costs are increased for the dual supply. However, new DC fast charging deployments increasingly have opted to use dual-cord stations, to ensure maximum utilisation from PEV drivers, and the incremental cost of a second cord is relatively small compared to the total cost of DC fast charging station deployment. The cost of deploying fast charging networks is increased somewhat by this lack of a single standard for DC charging, but at present it does not appear to be a significant barrier to widespread deployment and use of DC fast chargers.
2.4 Payment systems and communication protocols This section deals with the payment and communication process at charging stations with a special focus on the issue of interoperability.
2.4.1 Interoperability of payment systems
The bill for public charging is calculated on the basis of either energy use, charging time, flat rate tariffs, or a combination of the three. In the absence of detailed regulation in the early years of charging infrastructure rollout, a diverse range of payment systems was developed by the industry. Charging stations therefore do not have a uniform payment mechanism. Payment options include cash, Radio-Frequency Identification (RFID) cards specific to charging network operators, mobile phone or direct communication between the car and charger, SMS payment, and payment with credit cards. Customers of one charging station operator cannot always charge conveniently at a station from a different operator.
Charging infrastructure for electric road vehicles _________________________________________________________________________
31
Consequently, drivers often have to sign up with multiple charging networks, carry the respective access cards and/or use a variety of mobile apps for access to the operator. Directive 2014/94/EU on the deployment of alternative fuels infrastructure (AFID) addressed this issue by allowing charging operators to provide recharging services to customers on a contractual basis, including in the name and on behalf of other service providers, and by obliging operators to offer charging services on an ad hoc basis with no prior contract.49 Charging at one charging station on behalf of a different operator requires that roaming between the operators works, which means that the two operators need to have a contractual agreement. Roaming requires that the charging stations have an internet connection, that their protocols are compatible, and that the station has either a RFID card reader or a function for remote activation. Currently, most EU Member States have a minimum of two different billing systems in place and most allow for ad hoc charging. Attempts to develop roaming solutions are currently national or even local. Hubject, the joint venture launched by the BMW Group, Bosch, Daimler, EnBW, Innogy, Siemens, and Volkswagen aims at harmonising roaming.50 The roaming platform E-clearing has the same purpose. There are also bilateral initiatives between charging station operators. An example for a municipal initiative is the city of Berlin, which introduced a single RFID card for all charging stations. The current situation is not always convenient for customers, in particular when travelling internationally. However, charging infrastructure operators are confident that the payment systems will be interoperable within the coming years as the market is moving quickly to find solutions. In addition, a research initiative was launched in 2015 between the EU and the USA to develop solutions for interoperability of PEVs and smart grids.51 In conclusion, EU legislation to ensure interoperability of payment systems was introduced rather late in the development of payment mechanisms.52 In the absence of common standards, different business models evolved while interoperability was not ensured. While the interoperability of payment mechanisms will likely be warranted by industry solutions in the near future, further regulation (in particular with regard to smart charging applications) will be needed to ensure an EU charging network that takes into account future needs.
2.4.2 Interoperability of communication protocols
Standard protocols carry out the communication between the car, the charging stations, the grid, and the roaming platforms. Communication functions include identification, authorisation, battery status, etc. Currently, there is a large variety of different protocols in place globally, which are not always interoperable. Not all protocols encompass services like roaming for payment and smart charging. To make charging stations operated by different providers accessible for a broad range of clients, many national providers of charging infrastructure have agreed to use the Open Clearing House Protocol (OCHP). The actors involved include Ladenetz.de (Germany), ElaadNL (the Netherlands), BlueCorner (Belgium), Becharged (Belgium), Estonteco (Luxemburg), Vlotte (Austria), ESBeCars (Ireland), and Inteli (Portugal).
49 Directive 2014/94/EU on the deployment of alternative fuels infrastructure (2014). 50 Hubject (2018). 51 European Commission (2015). 52 Directive 2014/94/EU on the deployment of alternative fuels infrastructure (2014).
Policy Department for Structural and Cohesion Policies _________________________________________________________________
32
Another protocol supported by a broad range of actors is the Open Charge Point Protocol (OCPP), which was initiated by ElaadNL, a collaborative foundation created by a number of Dutch grid operators and has more recently gained acceptance in the USA. For the further development of protocols, ElaadNL recommends that smart charging functions need to be improved.53 In addition, gaps remain with regards to Information Technology (IT) security, meaning that, for example, the protection of user data is not ensured. The German Commission for Electrical, Electronic & Information Technologies of DIN and VDE (VDE/DKE54) has established a working group to define the exact use and safety measures of protocols, which are responsible for the data exchange between the car and the charging station.
2.5 Charging behaviour As already noted, charging can take place anywhere a car will be parked for some period and where electricity is available. This can be at home, at work, at any retail or entertainment destination, and at public or private car parks. Investments in PEV charging spots to date have attempted to predict where drivers will want to charge. There are three main factors that influence PEV drivers’ decisions about where and how to charge: time, cost, and convenience. It is the nexus of these three factors that leads to consumer decisions about where and how to charge. A driver generally would prefer their PEV recharge as quickly as possible, but drivers will prefer to charge in locations where they have ready access and where the charging experience is not disruptive to their schedule. Convenience tends to favour home charging as the first choice, if available. It has also driven interest in charging at work or other locations where vehicles tend to be parked for longer periods of time. If home charging is not a good option, the driver must make decisions based on charging opportunities, what they will pay to charge, and the amount of charge needed for the intended distance travelled. For drivers without a home charger, both low and high power public charging spots are needed. For all drivers who wish to drive between cities and countries, high power DC fast charging stations are needed at a sufficient availability to ensure drivers can find a station without running out of charge. In Europe, most people can charge at home or at work.55 However, the availability of public charging stations increases the value of PEVs to drivers substantially, because as charging on routes other than to work is enabled, flexibility is thereby increased, and range anxiety is dampened.56 Much of today’s conventional wisdom on charging behaviour is based on anecdotal observations of PEV drivers, and some limited public reports on drivers’ charging habits. A 2017 study by researchers at the Imperial College in London surveyed PEV drivers in the UK and Ireland.57 They found that the key factors that affected where charging occurred and the distances driven by the PEV owner were:
53 ElaadNL (2016b). 54 Deutsche Kommission Elektrotechnik, Elektronik und Informationstechnik (Eng. German Commission for
Electrical Engineering, Electronics, and Information Technology). 55 Bakker S., Leguijt P., van Lente H. (2015). 56 Dimitropoulos A., Rietveld P., van Ommeren J. N. (2011). 57 Latinopoulis C., Sivakumar A., Polak J. (2017).
Charging infrastructure for electric road vehicles _________________________________________________________________________
33
Gender: Men are more likely to charge their PEVs out of the home than women. The research comes to the conclusion that this may be due to difference in labour force participation rates or feelings of public safety. Employment: The employed have a higher tendency to charge their vehicle away from their home, compared to students, retirees, and the unemployed, suggesting the use of workplace chargers. Vehicle availability: People with access to both a PEV and an Internal Combustion Engine (ICE) vehicle tend to charge more at home. These drivers may opt to use their PEV for shorter distance trips, and use the ICE vehicle for longer distances. Owning versus leasing: Drivers who rent/lease PEVs are more likely to charge at different locations than drivers who own their vehicle. Charging costs: Generally, drivers who indicated their recharge costs were zero in public locations are more likely to charge away from their home. This may indicate the use of free-to-charge public stations. Drivers who utilise free-to-charge stations are also more likely to pre-plan their travel activities. Travel flexibility: People who indicated flexibility in their daily schedules tend to charge their vehicles at home. This is possibly due to it being less time-sensitive and therefore not discouraged by longer charging times. Importance of mobility: Those who believe their mobility is indispensable have a higher likelihood of performing midday out-of-home charging. This is indirectly related to feelings of range anxiety. PEV experience: Drivers who have more experience with EVs are more likely to drive farther than those who do not. This may be due to the comfort with the charging needs of the vehicle and reduced range anxiety. Charger uncertainty: Uncertain availability of public charging infrastructure may also play a role in drivers’ decision to charge their vehicle at home.
2.6 State of play in Europe The EU has several regulatory measures in place that aim at increasing the number of charging points and the uptake of PEVs across the EU. The most prominent instrument is Directive 2014/94/EU on the deployment of alternative fuels infrastructure (please see Box 3). By promoting infrastructure for both refuelling and charging with alternative fuels such as electricity, hydrogen and natural gas, this directive is seeking to facilitate the market uptake of electromobility across the EU and to reduce European dependence on oil and oil-related products. Moreover, it aims to facilitate the standardisation of the technical specifications of charging points and make information on the use of alternative fuels more easily available to customers.58 Each EU Member State is obliged to submit a national strategy on AFID implementation. For example, the German national strategy lays out an investment plan of almost EUR 1 billion, of which EUR 300 million are allocated towards charging infrastructure programmes.59
58 Directive 2014/94/EU on the deployment of alternative fuels infrastructure (2014). 59 Bundesministerium für Verkehr und digitale Infrastruktur (2016).
Policy Department for Structural and Cohesion Policies _________________________________________________________________
34
Box 3: EU Directive on the deployment of alternative fuels infrastructure
“Under the Directive, each EU Member State has two years to draw up an alternative fuel deployment strategy and send it to the European Commission. These strategies or "national policy frameworks" will set out the country's national targets for putting in place new recharge and refuelling points for the different types of "clean fuel", such as electricity, hydrogen and natural gas, as well as relevant supporting actions.”60 The Directive tackles the following:
- Economies of scale: The build-up of an EU-wide network of charging and refuelling stations.
- Operability: The development of harmonised EU-wide standards. To achieve these goals, the Directive sets out specific requirements that must be addressed in the national policy frameworks, which had to be submitted to the European Commission by the end of 2016. Key requirements include:
- Set national target on the appropriate number of refuelling and charging points accessible to the public, to ensure that EVs can circulate at least in urban and suburban agglomerations by 31 December 2020.
- Define common technical specifications for charging points for PEVs and refuelling points for Liquified Natural Gas (LNG), Compressed Natural Gas (CNG) and, hydrogen-powered vehicles.
- Ensure that charging stations are equipped with Type 2 (Mennekes) for slow charging and CCS Combo 2 for fast charging (minimum requirement).
- Provide relevant, consistent, and clear consumer information. In addition, the European Commission is also seeking to increase the level of home charging by proposing that, as of 2025, charging stations should be built into new residential buildings with over 10 parking spaces.61 Lastly, the Trans-European Transport Network (TEN-T) regulation - in particular, the Innovation & New Technologies section - facilitates the deployment of low carbon transport infrastructure, while the Connecting Europe Facility (CEF) provides funding.62 63 As an example of EU funding programmes, the Green Vehicles programme has a total budget of EUR 56 million and supports road transport innovation including research on interfaces between the vehicle and the charging infrastructure.64 Apart from the regulator, the industry is also increasingly taking action in order to realise a comprehensive charging infrastructure in Europe. One example is Ionity, a strategic partnership between BMW, Daimler, Ford and Volkswagen with Audi and Porsche. Their goal is to build a network of reliable, high power charging stations (up to 350kW) along major routes across Europe. By joining forces with German service station group Tank & Rast, the international oil & gas companies OMV and Shell, and the convenience store chain Circle K, Ionity has secured the coverage of more than half of the approximately 400 sites planned between now and 2020.65
60 Directive 2014/94/EU on the deployment of alternative fuels infrastructure (2014). 61 European Commission (2016b). 62 Regulation (EU) No 1315/2013 (2013). 63 European Commission (n.d.). 64 European Commission (2017a). 65 Ionity (2017).
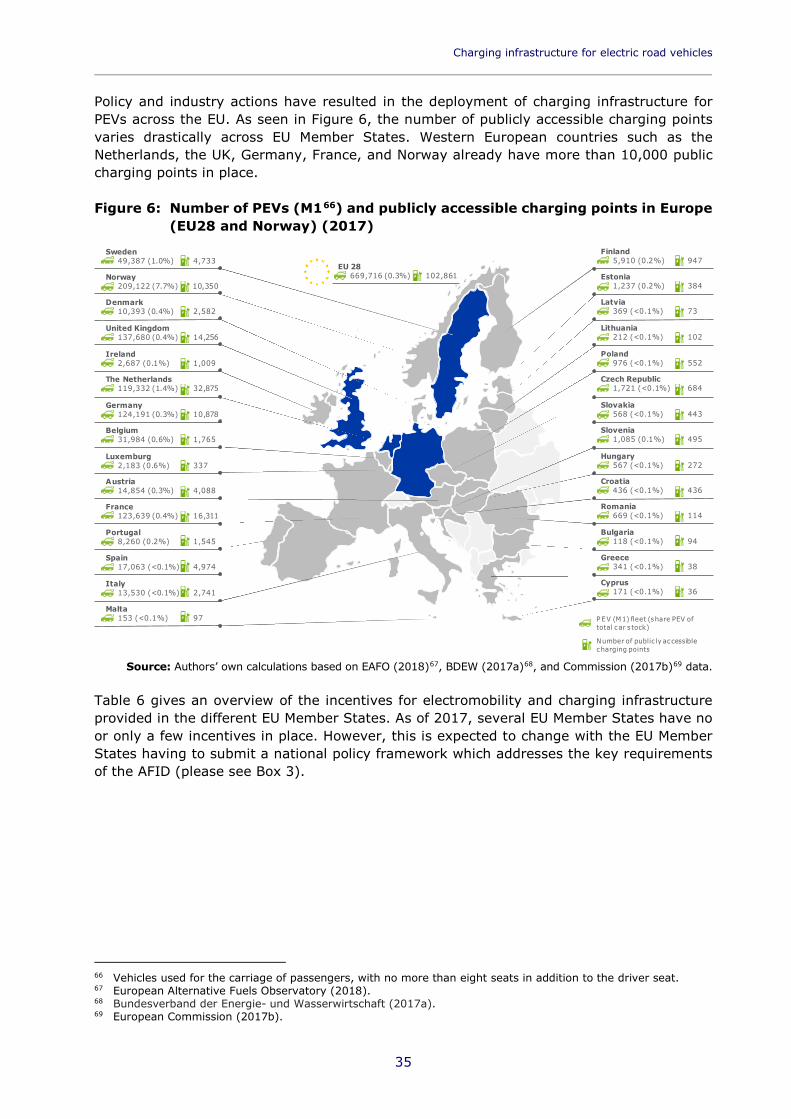
Charging infrastructure for electric road vehicles _________________________________________________________________________
35
Policy and industry actions have resulted in the deployment of charging infrastructure for PEVs across the EU. As seen in Figure 6, the number of publicly accessible charging points varies drastically across EU Member States. Western European countries such as the Netherlands, the UK, Germany, France, and Norway already have more than 10,000 public charging points in place. Figure 6: Number of PEVs (M166) and publicly accessible charging points in Europe
(EU28 and Norway) (2017)
Source: Authors’ own calculations based on EAFO (2018)67, BDEW (2017a)68, and Commission (2017b)69 data.
Table 6 gives an overview of the incentives for electromobility and charging infrastructure provided in the different EU Member States. As of 2017, several EU Member States have no or only a few incentives in place. However, this is expected to change with the EU Member States having to submit a national policy framework which addresses the key requirements of the AFID (please see Box 3).
66 Vehicles used for the carriage of passengers, with no more than eight seats in addition to the driver seat. 67 European Alternative Fuels Observatory (2018). 68 Bundesverband der Energie- und Wasserwirtschaft (2017a). 69 European Commission (2017b).
Sweden49,387 (1.0%) 4,733
Norway209,122 (7.7%) 10,350
Denmark10,393 (0.4%) 2,582
United Kingdom137,680 (0.4%) 14,256
Ireland2,687 (0.1%) 1,009
The Netherlands119,332 (1.4%) 32,875
Germany124,191 (0.3%) 10,878
Belgium31,984 (0.6%) 1,765
Luxemburg2,183 (0.6%) 337
Austria14,854 (0.3%) 4,088
France123,639 (0.4%) 16,311
Portugal8,260 (0.2%) 1,545
Spain17,063 (<0.1%) 4,974
Italy13,530 (<0.1%) 2,741
Malta153 (<0.1%) 97
Finland5,910 (0.2%) 947
Estonia1,237 (0.2%) 384
Latvia369 (<0.1%) 73
Lithuania212 (<0.1%) 102
Poland976 (<0.1%) 552
Czech Republic1,721 (<0.1%) 684
Slovakia568 (<0.1%) 443
Slovenia1,085 (0.1%) 495
Hungary567 (<0.1%) 272
Croatia436 (<0.1%) 436
Romania669 (<0.1%) 114
Bulgaria118 (<0.1%) 94
Greece341 (<0.1%) 38
Cyprus171 (<0.1%) 36
Number of public ly accessible charging points
PEV (M1) fleet (share PEV of total car s tock)
EU 28669,716 (0.3%) 102,861
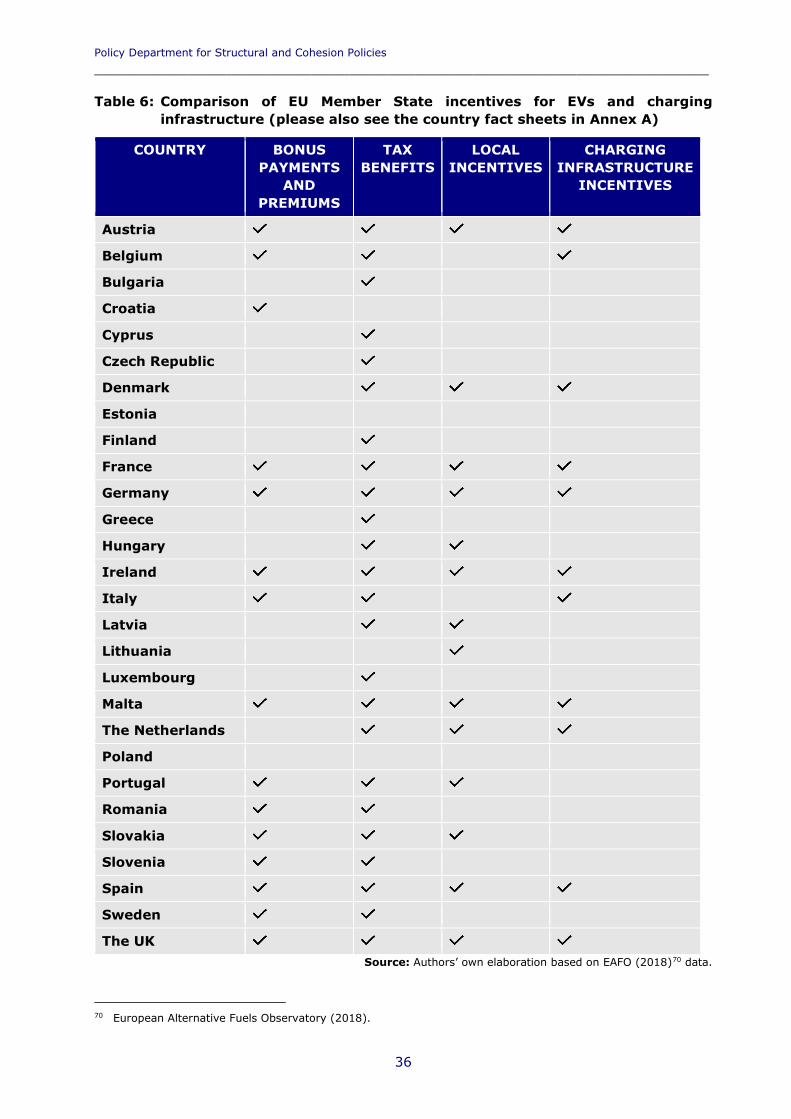
Policy Department for Structural and Cohesion Policies _________________________________________________________________
36
Table 6: Comparison of EU Member State incentives for EVs and charging infrastructure (please also see the country fact sheets in Annex A)
COUNTRY BONUS PAYMENTS
AND PREMIUMS
TAX BENEFITS
LOCAL INCENTIVES
CHARGING INFRASTRUCTURE
INCENTIVES
Austria
Belgium
Bulgaria
Croatia
Cyprus
Czech Republic
Denmark
Estonia
Finland
France
Germany
Greece
Hungary
Ireland
Italy
Latvia
Lithuania
Luxembourg
Malta
The Netherlands
Poland
Portugal
Romania
Slovakia
Slovenia
Spain
Sweden
The UK Source: Authors’ own elaboration based on EAFO (2018)70 data.
70 European Alternative Fuels Observatory (2018).
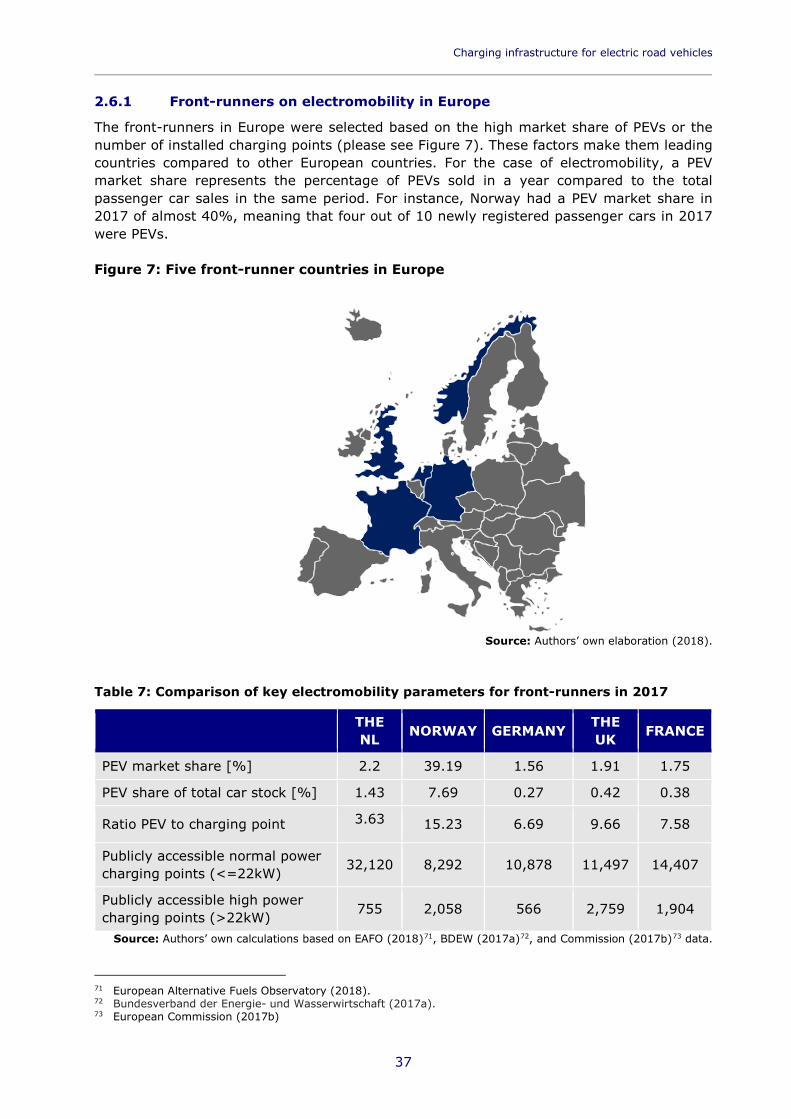
Charging infrastructure for electric road vehicles _________________________________________________________________________
37
2.6.1 Front-runners on electromobility in Europe
The front-runners in Europe were selected based on the high market share of PEVs or the number of installed charging points (please see Figure 7). These factors make them leading countries compared to other European countries. For the case of electromobility, a PEV market share represents the percentage of PEVs sold in a year compared to the total passenger car sales in the same period. For instance, Norway had a PEV market share in 2017 of almost 40%, meaning that four out of 10 newly registered passenger cars in 2017 were PEVs. Figure 7: Five front-runner countries in Europe
Source: Authors’ own elaboration (2018). Table 7: Comparison of key electromobility parameters for front-runners in 2017
THE NL NORWAY GERMANY THE
UK FRANCE
PEV market share [%] 2.2 39.19 1.56 1.91 1.75
PEV share of total car stock [%] 1.43 7.69 0.27 0.42 0.38
Ratio PEV to charging point 3.63 15.23 6.69 9.66 7.58
Publicly accessible normal power charging points (<=22kW) 32,120 8,292 10,878 11,497 14,407
Publicly accessible high power charging points (>22kW) 755 2,058 566 2,759 1,904
Source: Authors’ own calculations based on EAFO (2018)71, BDEW (2017a)72, and Commission (2017b)73 data. 71 European Alternative Fuels Observatory (2018). 72 Bundesverband der Energie- und Wasserwirtschaft (2017a). 73 European Commission (2017b)
Policy Department for Structural and Cohesion Policies _________________________________________________________________
38
2.6.1.1 The Netherlands
The Netherlands’ consumer incentives and the extensive funding of charging infrastructure have resulted in the highest number of publicly accessible charging points in the EU (please see the country fact sheet on the Netherlands in Annex A) and made the Netherlands a global leader in electromobility. Many cities, such as Amsterdam and Utrecht already have a comprehensive charging network in place. The country aims to have PEV sales reach 10% of new vehicles sold by 2020, and 50% by 2025. However, due to fewer direct incentives the market share of PEVs plummeted from 10% in 2015 to just 2% in 2017. To increase the market share of EVs, and ensure continuous leadership in electromobility, the Netherlands is currently constructing a dense network of charging stations spanning the entire country.74 Furthermore, the Netherlands wants all new cars to be emissions-free by 2030, effectively prohibiting new petrol and diesel vehicle sales.75
Direct consumer incentives
The government supports the sales of low emissions vehicles by offering (partial) exemption from registration tax, road tax, and company car tax. While these direct incentives are still relatively high compared to most other EU Member States, they have been lowered over the past years. Zero Emissions Vehicles (ZEV) are exempt from registration tax, which is a tax that increases with the car’s Carbon Dioxide (CO2) emissions (CO2-based tax). The road tax varies from one province to another and is determined by the curb weight and type of powertrain. Cars with CO2 emissions values less than 51g/km were exempted from the road tax until 1 of January 2016. Cars with 0g/km CO2 emissions will continue to be exempt, while cars between 1g/km and 50g/km will incur half of the regular road tax from 2016 onwards. Furthermore, an environment-investment deduction applies. For BEVs, a maximum of 36%, capped at EUR 50,000 can be deducted, and for PHEVs with CO2 emissions up to 30g/km, the maximum is 27%, capped at EUR 35,000.76 The Dutch Government levies a tax on the private use of company cars. If the private use of a company car exceeds 500km per year, 22% of the car’s purchase price is added to the taxable income. In comparison, the rate for ZEVs is only 4%.77
Charging infrastructure
Most of the early deployment of charging infrastructure was facilitated by ElaadNL, an initiative set up by seven grid operators in the country. The consortium includes the state-owned national grid operator TenneT from the Netherlands, as well as regional grid operators. With a budget of EUR 25 million, the consortium installed approximately 3,000 charging stations between 2010 and 2014.78 In recent years, the central government consolidated various programmes and began to promote charging stations through its Green Deal, a programme that allows organisations to easily cooperate with the federal government on green growth and social issues.79 In addition to funding for charging infrastructure, the National Charging Infrastructure Knowledge Platform Foundation, a partnership supported by the Netherlands Enterprise
74 International Council on Clean Transportation (2017a). 75 Electrek (2017b). 76 Netherlands Enterprise Agency (2017). 77 Algemene Nederlandse Wielrijdersbond (2017). 78 ElaadNL (2016a). 79 Dutch Ministries of Economic Affairs, Infrastructure and Environment, and Interior (2016).
Charging infrastructure for electric road vehicles _________________________________________________________________________
39
Agency, promotes collaborative projects to lower the cost of charging infrastructure and to foster knowledge exchange. Local authorities can apply for financial support from the central government for the installation of public charging infrastructure. Only projects that combine funding from local authorities and the private sector are eligible for financial support. The scheme was introduced in 2015 and is set to expire by July 2018.
Complementary policies
The Dutch Government devised several policies to incentivise businesses to purchase EVs. Additionally, policies are in place to prepare consumers and companies for electromobility. Education and promotion events include showcasing Dutch electromobility concepts at international trade shows. The website Nederland Elektrisch80 also educates consumers on electromobility, and summarises financial incentives for EVs. Other complementary policies include Green Deals, the Formula E-Team (a public-private platform to strengthen electric transport), and research on electric drive technologies that is partly funded by the Dutch Government.
2.6.1.2 Norway
Norway is the global leader in electromobility with a market share of 21% for BEVs in 2017, closely followed by PHEVs with 18%.81 In December 2016, the country reached a milestone of 100,000 BEVs registered. As of December 2017, PEVs represented almost 8% of the total fleet of 2.7 million passenger cars in Norway. Furthermore, the Norwegian parliament has agreed upon a 2025 target for all new passenger and light commercial cars to be zero or low emissions vehicles. This puts Norway on an ambitious course towards a zero emissions transport sector and an increasingly aggressive pace for the introduction of EVs.
Direct consumer incentives
Norway has surged ahead of other countries when it comes to PEV adoption, largely because ZEVs are exempt from Value-Added Tax (VAT). More so, EVs are also exempt from registration tax (BEVs only, PHEVs are eligible for a reduction of up to EUR 10,000) and pay a reduced road tax and company car tax. VAT (25%) and the registration tax combined can add up to an extra 100% on the net purchase price of a vehicle. BEVs being exempt from those substantial taxes make the price competitive with standard petrol and diesel-powered cars.82 Additionally, the annual road tax is reduced to EUR 45 for both BEVs and PHEVs, as opposed to at least EUR 280 for petrol or diesel cars.83 The basis for the calculation of the company car tax is the car’s full purchase price, which is reduced to 60% of the car’s purchase price for EVs.84
Charging infrastructure
Enova (formerly known as Transnova), an agency funded through natural gas and petroleum sales that promotes Greenhouse Gas (GHG) emissions reductions and energy efficiency improvements, has been the main sponsor of Norway’s charging infrastructure. Enova started as early as 2009 to deploy charging infrastructure across Norway with an investment of EUR 6 million and has since provided continuous funding. Most recently, the agency has focused on the installation of fast charging stations on remote motorways in northern Norway.
80 Nederland Elekrisch (2018). 81 European Alternative Fuels Observatory (2018). 82 Norwegian Ministry of Climate and Environment (2017). 83 Norwegian Tax Administration (2018a). 84 Norwegian Tax Administration (2018b).
Policy Department for Structural and Cohesion Policies _________________________________________________________________
40
In addition to the investments at national level, many cities have been extensively investing in charging stations. Oslo budgeted EUR 2 million for the initial construction of charging stations which has resulted in 2,000 charging points across the city.85 86 Furthermore, the Nobil87 database, a cooperation between the Enova and the Norwegian Electric Vehicle Association, provides publicly available data allowing anyone to build services using standardised data free of charge. Lastly, the Norwegian Government has a programme in place that aims to finance the deployment of at least two fast charging stations every 50km on all main roads in Norway by 2017.
Complementary policies
In addition to substantial direct incentives, owners of BEVs enjoy free use of toll roads, free charging at public charging stations, access to bus lanes and free/reduced fees on ferries.88 However, the National Transportation Plan 2018-2029 contains proposals to reinstate some fees again due to some municipalities complaining of revenue shortfalls from exempted EVs.89
2.6.1.3 Germany
Germany has been lagging behind its own ambition to reach 1 million EV sales by 2020 and 5 million by 2030. As of December 2017, around 124,000 PEVs were registered in Germany.90 The build-up of charging infrastructure has only recently picked up steam with the federal government widely supporting the deployment of public charging points. Today, the federal government offers a variety of direct incentives, including grants and tax breaks, as well as indirect incentives at municipal level. Two prominent programmes, Ladeinfrastruktur für Elektrofahrzeuge in Deutschland (Eng. Charging Infrastructure for Electric Vehicles in Germany) and Elektromobilität vor Ort (Eng. Electromobility Onsite), support the deployment of a demand-driven charging infrastructure for PEVs and assist the cross-sector cooperation of industry, public sector, and science to ease and accelerate the integration of electromobility into everyday life.91 92
Direct consumer incentives
ZEVs such as BEVs may receive a grant of EUR 2,000 and PHEVs EUR 1,500. To be eligible, the car’s net purchase price must be below EUR 60,000 and the car manufacturer must offer a discount that is at least as high as the grant.93 BEVs registered before 2016 are exempt from the road tax for 10 years and vehicles registered between 2016 and 2020 are exempt for five years. Germany levies an income tax on the benefits from the private use of company cars, which typically is calculated by adding 1% of the vehicle’s purchase price to the taxable monthly personal income.
85 Nobil (2012). 86 The City of Oslo (2018). 87 Nobil (2018). 88 Norwegian Ministry of Climate and Environment (2017). 89 Vinor, Jernbaneverket, Kystverket Statens Segvesen (2016). 90 European Alternative Fuels Observatory (2018). 91 Bundesministerium für Verkehr und digitale Infrastruktur (2017). 92 Bundesministerium für Verkehr und digitale Infrastruktur (2015). 93 Bundesamt für Wirtschaft und Ausfuhrkontrolle (2017).
Charging infrastructure for electric road vehicles _________________________________________________________________________
41
In the first year of the German incentive scheme (2013), the purchase price could be reduced by EUR 500 for each kilowatt-hour of electrical energy storage included in the vehicle; however, this tax benefit is being reduced by EUR 50 each year from 2014 onwards. At the same time, the total reduction was not allowed to exceed EUR 10,000 in 2013, and this limit is being reduced by EUR 500 each year. Accordingly, in 2018, the reduction amounts to EUR 250/kWh (up to EUR 7,500).94
Local incentives
In June 2015, Germany introduced its Elektromobilitätsgesetz (Eng. Federal Electromobility Regulation) as an important part of national energy and climate policies. With the introduction of this regulation, municipalities can grant special privileges to low emissions vehicles, defined as vehicles that do not exceed 50g CO2/km or have an electric range of 40km or more. Special privileges include preferential or free parking, access to bus lanes, and entry to restricted traffic zones. Additionally, the programme Elektromobilität vor Ort, which is set to run until 2019, specifically supports municipal actors with the development of electromobility at local level.
Charging infrastructure
The German Federal Ministry of Transport set up the Ladeinfrastruktur für Elektrofahrzeuge in Deutschland programme, with EUR 300 million allocated until 2020. Public charging points are eligible for a subsidy of a maximum of 60%. This subsidy is limited to EUR 30,000 for fast chargers with at least 100kW, EUR 12,000 for fast chargers with less than 100kW and EUR 3,000 for AC chargers.95 Additional financial support for charging infrastructure is available through projects that are part of the Modellregionen Elektromobilität (Eng. Electromobility Model Regions). While these projects operate on a local scale, the Schnellladenetz für Achsen und Metropolen (Eng. Fast Charging Network for Motorways and Cities) project uses federal and private funds to finance the construction of 600 DC fast charging outlets in metropolitan areas and along main motorways by 2017. In general, Germany favours market-driven instruments, including private-public partnerships to build PEV charging infrastructure.
Complementary policies
Germany has implemented a wide range of complementary policies that predominantly focus on demonstrating suitability of electromobility for everyday use. These measures include projects that showcase electromobility concepts, research and development support for vehicle manufacturers, and emissions targets for government fleets.
2.6.1.4 The UK
The UK Government set up the Office for Low Emission Vehicles (OLEV) to support the introduction and use of low emissions vehicles. Great Britain Pound/Pound Sterling (GBP) 900 million is set aside for programmes and schemes. The plug-in car grant offers direct incentives for private car owners, while CO2-based company car taxation can provide substantial incentives to purchasing PEVs as company cars. Indirect incentives are primarily part of local schemes, such as the Go Ultra Low City Scheme, a joint government and car industry campaign. A wide array of complementary policies supports research and development of electric mobility and raising consumer awareness. Both public and private charging infrastructure is subsidised or funded by the government.
94 Buzzriders (2017). 95 Bundesministerium für Verkehr und digitale Infrastruktur (2017).
Policy Department for Structural and Cohesion Policies _________________________________________________________________
42
Local incentives include exemptions from congestion charges, free or reduced parking for EVs, and interest-free loans for electromobility investments.
Direct consumer incentives
The plug-in car grant covers up to 35% of the purchase prices (up to a maximum of GBP 4,500) of EVs. There are six categories of vehicles based on the distance a vehicle can travel without any CO2 emissions and the type of vehicle (e.g. bus, motorcycle). Eligible vehicles include BEVs and Fuel Cell Electric Vehicles (FCEVs), and PHEVs with CO2 emissions of 75g/km or lower.96 The grant scheme was set up in 2011 and intended to cover up to 50,000 grants or a time frame up to 2017. After the 50,000-grant threshold was reached in 2015, the scheme received additional funding of GBP 100 million and was extended into at least 2020.97 Apart from grants, the UK also has tax benefits in place for low emissions vehicles. ZEVs costing less than GBP 40,000 are exempted from the annual road tax and owners of low emissions vehicles (< 75g CO2/km) pay a comparatively low rate. Taxes on the private use of company cars are determined based on the vehicle’s CO2 emissions. EVs emitting less than 50g CO2/km have their company car tax set at 9% for 2017–2018, 13% for 2018–2019, and 16% for 2019–2020. The tax on company cars exceeding 75g CO2/km is up to twice as high.98
Charging infrastructure
The Electric Vehicle Homecharge Scheme (EVHS) provides grant funding of up to 75% towards the cost of installing charging points at domestic properties across the UK.99 The Workplace Charging Scheme (WCS) is voucher-based and provides support towards the upfront costs of the purchase and installation of charging points, for eligible businesses, charities, and public-sector organisations.100 The On-street Residential Chargepoint Scheme (ORCS) provides grant funding for local authorities towards the cost of installing on-street residential charging points.
Complementary policies
To facilitate local EV incentives, the Go Ultra Low City Scheme aims to encourage even more drivers to switch to electric. The OLEV funds a variety of activities related to electromobility.
2.6.1.5 France
Similarly to the UK, the Netherlands and Norway, France has announced an end date on the sale of conventional petrol and diesel vehicles. By 2040, all new vehicles will have to be emissions-free. To support the increasing share of PEV sales, promotional programmes for charging infrastructure have been in place for several years. Since 2013, the Agence de l'Environnement et de la Maîtrise de l'Énergie (ADEME) (Eng. French Environment and Energy Management Agency) provides funding to municipalities and regional governments, helping to deploy more than 16,000 charging points (please see the country fact sheet on France in Annex A). A government proposal has recently set the short-term goal of 100,000 charging points into service by 2020.
96 Office for Low Emission Vehicles (2016b). 97 Autoexpress (2017). 98 Office for Low Emission Vehicles (2017). 99 Office for Low Emission Vehicles (2016a). 100 Office for Low Emission Vehicles (2016a).
Charging infrastructure for electric road vehicles _________________________________________________________________________
43
The mostly state-owned utility company Électricité de France (EDF) is at the forefront of national charging infrastructure providers, having constructed Corri-Door, a fast charging network with more than 200 locations across the country.101
Direct consumer incentives
Under a bonus‐malus system, a premium is granted for the purchase of a new EV whereas for high emissions vehicles, a fee (or malus) is imposed. For a vehicle emitting between 21g and 60g CO2/km, the bonus amounts to EUR 1,000; if it emits 20g CO2/km or less, the bonus amounts to EUR 6,000 (up to 27% of the purchase price). An incentive scheme grants up to EUR 4,000 (depending on CO2 emissions) to buyers of low emissions vehicles when they scrap an old diesel vehicle. In 2017, the scheme was extended to light commercial vehicles.102 BEVs are exempt from the company car tax, while hybrids emitting less than 110g CO2/km are exempt during the first two years after registration. Regions have the option to provide an exemption from the registration tax (either total or 50%) for alternative fuels vehicles.
Charging infrastructure
As part of the Loi sur la Transition Énergétique pour la Croissance Verte (Eng. Energy Transition for Green Growth Act), the French Government’s objective is to have 7 million charging points (including private chargers) available in France by 2030. The French ADEME has provided funding for public charging infrastructure to over 3,000 cities in France.103 Most of the EUR 50 million budget has been exhausted, resulting in dense charging networks in major urban areas, and there are very few charging points in rural places. Beneficiaries are required to deploy at least 20 charging points and provide free parking for charging vehicles. Furthermore, the French Government grants tax credits on a number of energy efficiency and renewable energy measures, including the installation of charging equipment for PEVs. Currently, the tax credit amounts to 30% of the cost of equipment and materials, excluding labour.104 The credit is limited to EUR 8,000 for a single person and EUR 16,000 for a two-person household. Tax exemptions are also granted to companies operating a public charging infrastructure.
Complementary policies
The Loi sur la Transition Énergétique pour la Croissance Verte sets EV targets for government and business car fleets. When replacing their vehicle fleets, the French state and its public bodies are required to purchase a minimum of 50% vehicles with low CO2 and air-polluting emissions, such as EVs. Local authorities have a lower target of 20%. By 2020, car rental and taxi firms are also required to purchase 10% low emissions vehicles when renewing their fleets. All new buses purchased for public transport services from 2025 onwards must be low emissions vehicles.
2.6.2 The rest of Europe
The market share of PEVs and the availability of charging infrastructure is significantly higher in Western Europe compared to Eastern Europe. This fact is mainly due to the financial 101 Corri-door (2018). 102 Ministère de la Transition écologique et solidaire (2016). 103 Agence de l'Environnement et de la Maîtrise de l'Énergie (2016). 104 International Council on Clean Transportation (2017a).
Policy Department for Structural and Cohesion Policies _________________________________________________________________
44
incentives and tax breaks for charging points and low emissions vehicles that have been introduced in Western European countries in the past decade. Some countries in Western Europe like Denmark are already phasing out their incentives, while others have not yet implemented any measures to facilitate electromobility, e.g. Poland or Estonia. Tax breaks are the most common measure to incentivise EVs in EU Member States. These include exemption or reduction of registration tax, road tax, and company car tax. Of the EU Member States, 19 have a CO2-based road tax in place, meaning that they levy car taxes partially or totally based on the vehicle’s CO2 emissions. This naturally benefits low emissions vehicles.105 In some areas, ZEVs are completely exempt from registration and road tax. Especially in Scandinavian countries where registration tax can be up to 150%, reduced levels of taxation had a significant impact on the sales of EVs. In Denmark, the market share of PEVs rose rapidly from 0.3% in 2013 to 2.4% in 2015 after the government reduced taxes for EVs. However, in 2015 the government decided to gradually phase out the tax breaks for EVs, which led to a significant drop in EV market share (please see the country fact sheet on Denmark in Annex A). Apart from tax breaks, grants and premiums are additional measures used to stimulate the uptake of EVs and the dissemination of charging infrastructure. Romania currently grants the highest subsidy. Under the Rabla Plus scheme, buyers of PEVs can receive a subsidy of up to EUR 11,500.106 Malta grants up to EUR 8,000, Slovenia up to EUR 7,500, and France up to EUR 6,000 to EV buyers. However, these high premiums are often subject to specific conditions, e.g. the scrappage of old diesel-powered vehicle as is the case in France. In general, buyers of PHEVs receive lower grants compared to buyers of ZEVs.
2.7 Front-runners on electromobility outside of Europe: China and USA
2.7.1 China
The market share of newly registered PEVs in China rose to 1.37% in 2016107, but the government seems determined to increase that number substantially. According to the national target, 4.3 million private charging outlets and 500,000 public charging stations will be built by 2020.108 In addition, dedicated targets for buses and taxis are in place. The plans are supported by an announced Chinese Yuan (CNY) 90 million (about EUR 12 million) of funding for charging infrastructure in selected regions.109
Direct consumer incentives
Until 2017, BEVs were subsidised with up to 50% of the purchase price. The subsidies have since been reduced by 20%.110 There are also tax benefits for acquisition and excise taxes amounting to EUR 4,500-7,500111 as well as further exemptions from registration and road taxes. Furthermore, over 20 provinces and 30 cities provide reduced electricity retail prices.112
105 European Automobile Manufacturers Association (2017a). 106 Romania liberia (2018). 107 International Energy Agency (2017). 108 China Daily (2018). 109 Navigant Research (2017f). 110 China Daily (2017). 111 International Energy Agency (2017). 112 National Energy Administration (2017).
Charging infrastructure for electric road vehicles _________________________________________________________________________
45
Local incentives
EV drivers are given access to bus lanes and are exempted from the access restrictions at peak times which are in place in many cities. PEVs may also charge and park free of charge in many places. In Beijing, Shanghai, and Chongqing, all new residential buildings must be pre-wired for charging equipment in their parking spaces.113 For larger public parking lots, a minimum of 10% of parking spaces must be equipped with charging stations.114 Another important advantage for EV drivers are total or partial waivers from licence plate availability restrictions.115
Charging infrastructure incentives (public and private)
The construction of municipal charging stations is subsidised by the central government.116 However, the mechanisms and ratios of funding provided depend on the provinces. The pilot cities of Shanghai, Beijing, and Shenzhen are obliged to provide one charging point for every eight PEVs, with charging points to be no farther than 1km from any point within the city centre.117
Complementary policies
Automakers need to obtain 10% of sales credits from EVs from 2019 onwards. Compliance is obligatory for companies with annual sales of over 30,000 units. A ban on gasoline-powered motorcycles is also in place. In January 2017, a new national standard for charging equipment was enforced. In addition, electricity price policy is being addressed: for PEV charging, preferable electricity prices are provided, benchmarking for charging and battery swapping service fees will be introduced and grid extension investments due to charging facilities will be provided.
2.7.2 The United States of America (USA)
The USA’s support for the growth of EVs is difficult to characterise due to the varying level of incentives provided by each individual state and municipal governments on top of federal policies and incentives. A strong push to accelerate charging infrastructure was made starting at federal level in 2009 in the USA, but this federal support has slowed substantially under the current administration. However, states and local governments are accelerating their plans and efforts with regional partnerships118 and local targets119. The more rigorous policies and regulations are in California, which is the main market for PEVs in the USA, and they have largely steered automaker production of PEVs.
Direct consumer incentives
The federal government currently offers a direct consumer incentive for the purchase of an EV in the form of a United States Dollar (USD) 7,500 (about EUR 6,400) tax credit. This tax credit is available for the first 200,000 qualified EVs sold from each manufacturer. In addition, some states, such as Colorado, offer additional tax credit on top of the federal tax credit. Other states, such as California, offer rebates.120 Some of these state-level incentives are determined by income or the cost to purchase the EV.
113 China Electricity Council (2016). 114 Navigant Research (2017f). 115 International Energy Agency (2017). 116 International Energy Agency (2017). 117 International Council on Clean Transportation (2017a). 118 US Department of Energy Alternative Fuels Data Center (2018). 119 State of Colorado (2018). 120 Tesla (n.d.).
Policy Department for Structural and Cohesion Policies _________________________________________________________________
46
Charging infrastructure
The federal government jump started the charging infrastructure in the USA by funding almost 19,000 charging stations for residential and commercial use through the 2009 American Reinvestment and Recovery Act. Additionally, tax credits were offered towards installing charging hardware up until 2016. While currently there are no other direct incentives offered from the federal government for charging points,121 the latter has provided support by identifying and suggesting motorway corridors for PEV charging infrastructure to be built.122 In this context, a corridor refers to a linear area connecting different major urban centres within or across countries by one or more modes of transportation, such as motorways or railways. The federal government has also encouraged the deployment of workplace charging, although no financial incentives have been offered through this initiative. Some states offer state tax credits and/or rebates for the installation of charging points. There are also counties and utilities that offer rebates for both residential and commercial purchase and installation of charging points.123 In addition, several state and city agencies have played a key role in the deployment of public charging stations, for example by securing funding or supporting public-private planning efforts. Electrify America is the major investor in PEV charging infrastructure in the USA for the foreseeable future. The Volkswagen company was created to invest USD 2 billion (EUR 1.6 billion) in charging infrastructure through 2026 to comply with a settlement with the Environmental Protection Agency (EPA) in the USA and the state of California. USD 800 million will be invested in California with the remaining USD 1.2 billion (EUR 0.97 billion) invested throughout the rest of the country. In Electrify America’s first investment cycle, it will establish a network of 650 charging sites in communities and 300 motorway fast charging sites across the country by mid-2019. Electrify America has selected 17 metropolitan areas to receive the first round of chargers. The motorway sites will have between four and 10 150kW and 350kW DC fast chargers. The first cycle of investment will also include installing 2,800 charging stations at workplace and multi-unit dwellings in the 17 metropolitan areas.124 There will be four 30-month cycles of investment, with different metropolitan areas receiving infrastructure during each cycle. As part of the total expenditure, each state receives funding that can be used for a variety of transportation projects to improve air quality, including up to 15% that can be allocated for light duty charging infrastructure.
Complementary policies
There are many complementary policies for EV adoption in the USA. These policies are typically suggestions provided by the federal government, but are established at lower levels of government. The most direct policy driving the EV market is the Zero Emissions Vehicle (ZEV) Program, created by California and adopted by nine additional states. The policy requires automakers to sell a specified percentage of new vehicles as PEVs.125 Many states and localities have also adopted policies that provide a benefit to using an EV, such as High Occupancy Vehicle (HOV) lane exemptions, EV charging rate incentives, reduced licence tax, EV-only parking spots, vehicle insurance discounts, free charging locations, and vehicle-to-grid energy credits.126 121 Pluglesspower.com (n.d.). 122 US Department of Transportation Federal Highway Administration (2018). 123 Clippercreek (n.d.). 124 Electrify America (2018). 125 Union of Concerned Scientists (2016). 126 Office of Energy Efficiency & Renewable Energy (n.d.).
Charging infrastructure for electric road vehicles _________________________________________________________________________
47
3 IMPACT OF CHARGING INFRASTRUCTURE ON THE DISSEMINATION OF PEVS
KEY FINDINGS
• The availability of charging infrastructure is positively correlated with Plug-in Electric Vehicle (PEV) adoption, but determining the exact influence on PEV adoption requires further experience with later market stages.
• While high availability of charging infrastructure does not automatically lead to high adoption rates, low availability is an inhibitor to the adoption of PEVs.
• There are differences between national and regional markets with respect to the importance of public charging infrastructure for PEV adoption.
• Besides charging infrastructure, the availability of financial consumer incentives is the most important factor for PEV adoption.
• For the rollout of charging infrastructure, most regions are applying a demand-oriented approach. A shift to a coverage-oriented approach has a high potential to reduce range anxiety.
• Type, location, and quantity of required charging infrastructure differs significantly for each country.
In this chapter, the authors of this study analyse the relation between the availability of public charging infrastructure and the uptake of PEVs. Some European Union (EU) Member States - such as the Netherlands, France, Germany and the United Kingdom (UK), but also Norway - have developed well-established charging networks of public and private charging points. This chapter analyses the development of charging infrastructure in the front-runner countries (please see Sections 2.6-2.7) to date, identifies success factors for the development of charging infrastructure and analyses the factors to consider for the development of rollout strategies for charging infrastructure. The assessment focuses on electric passenger cars (M1127)and does not include light duty commercial vehicles (N1128), as the latter are mainly used for daily routes without a need for public charging. The following questions will be covered:
1. What is the relationship between charging infrastructure and PEV adoption and use?
2. Do demand-oriented or coverage-oriented approaches have different impacts on PEV adoption and use?
3. What is the type, quantity, and location of public charging infrastructure required?
127 Vehicles used for the carriage of passengers, with no more than eight seats in addition to the driver seat. 128 Light duty commercial vehicles up to 3.5 tonnes.
Policy Department for Structural and Cohesion Policies _________________________________________________________________
48
3.1 Relationship between charging infrastructure and PEV adoption and use
The adoption of electromobility is a complex and sometimes unpredictable process.129 A core assumption is that visible and convenient charging infrastructure is necessary to alleviate range anxiety from current and potential PEV owners. Even if the infrastructure is not highly utilised, it is important for PEV adoption that drivers know it is present in locations that are helpful for their travels. Previous consumer surveys completed by Navigant Research have shown that the availability and proximity of charging stations is the primary reason why potential buyers are concerned about buying a PEV. The evidence available to clarify the relationship between charging infrastructure and PEV adoption and use is limited by the nature of the market stage across all analysed countries. According to the diffusion of innovation theory, which distinguishes between the market stages innovators, early adopters, early majority, late majority and laggards, all EU markets are still in the innovator phase of up to 2.5% of total car stock. In Europe, only Norway has surpassed this stage and is now in the early majority stage with a share higher than 7% of total car stock. As the experience with PEV market developments is still limited, conclusions about future market developments remain vague. Another limitation arises from imperfections of available data from the European Alternative Fuels Observatory (EAFO), as have been observed for the case of Germany, where the EAFO counts twice as many charging points as stated by the German Bundesverband der Energie- und Wasserwirtschaft (BDEW) (Eng. German Federal Association of the Energy and Water Industries).130 This section presents recent data on PEV uptake and evaluates it against the availability of charging infrastructure in the front-runner countries identified in Sections 2.6-2.7. In addition, existing literature is reviewed to assess the relationship. Two different indicators will be used to help illuminate the question at hand (i.e. relationship between charging infrastructure and PEV adoption and use): the number of PEVs per charging point in relation to market uptake and the number of PEVs per million inhabitants in relation to market uptake. The Alternative Fuels Infrastructure Directive (AFID) recommends that EU Member States ensure a ratio of a maximum of 10 PEVs per charging point. The expectation is that markets where this ratio is not met will experience a slower PEV adoption. From the perspective of policymakers, this indicator is useful to plan infrastructure rollout. In their 2016 International Council on Clean Transportation (ICCT) publication, authors Hall and Lutsey argue that the ratio of charging points per million inhabitants may be more useful, as this indicator is independent of both the number of vehicles already in the market and the geographical size of the countries to be compared.131 Therefore, both indicators will be considered in the following analysis.
• Indicator 1: Ratio of PEVs per public charging point
The expectation is that markets that have a (too) high ratio of PEVs per charging point will have a slower market uptake compared to markets that have a low ratio of PEVs per charging point. A high ratio would be correlated with low market uptake and vice versa. Market uptake is measured by share of new registrations per year.
129 van der Steen M., et al. (2015). 130 Bundesverband der Energie- und Wasserwirtschaft (2017b). 131 International Council on Clean Transportation (2017a).
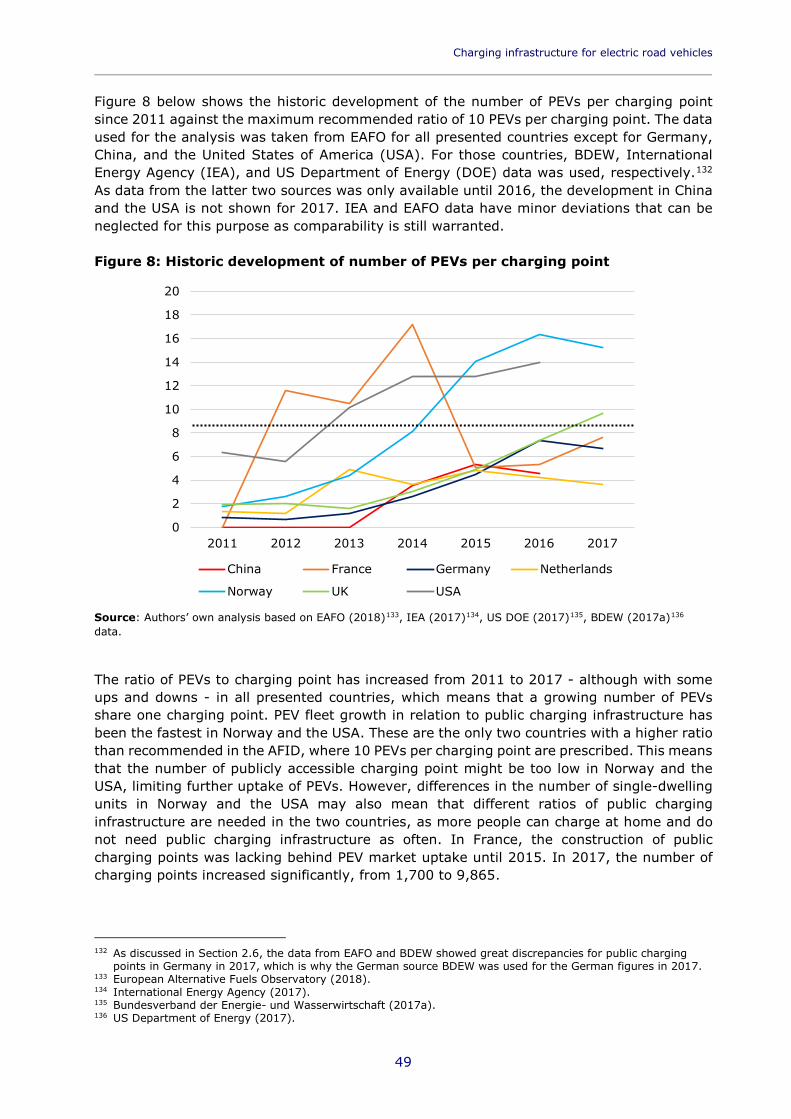
Charging infrastructure for electric road vehicles _________________________________________________________________________
49
Figure 8 below shows the historic development of the number of PEVs per charging point since 2011 against the maximum recommended ratio of 10 PEVs per charging point. The data used for the analysis was taken from EAFO for all presented countries except for Germany, China, and the United States of America (USA). For those countries, BDEW, International Energy Agency (IEA), and US Department of Energy (DOE) data was used, respectively.132 As data from the latter two sources was only available until 2016, the development in China and the USA is not shown for 2017. IEA and EAFO data have minor deviations that can be neglected for this purpose as comparability is still warranted. Figure 8: Historic development of number of PEVs per charging point
Source: Authors’ own analysis based on EAFO (2018)133, IEA (2017)134, US DOE (2017)135, BDEW (2017a)136 data.
The ratio of PEVs to charging point has increased from 2011 to 2017 - although with some ups and downs - in all presented countries, which means that a growing number of PEVs share one charging point. PEV fleet growth in relation to public charging infrastructure has been the fastest in Norway and the USA. These are the only two countries with a higher ratio than recommended in the AFID, where 10 PEVs per charging point are prescribed. This means that the number of publicly accessible charging point might be too low in Norway and the USA, limiting further uptake of PEVs. However, differences in the number of single-dwelling units in Norway and the USA may also mean that different ratios of public charging infrastructure are needed in the two countries, as more people can charge at home and do not need public charging infrastructure as often. In France, the construction of public charging points was lacking behind PEV market uptake until 2015. In 2017, the number of charging points increased significantly, from 1,700 to 9,865.
132 As discussed in Section 2.6, the data from EAFO and BDEW showed great discrepancies for public charging
points in Germany in 2017, which is why the German source BDEW was used for the German figures in 2017. 133 European Alternative Fuels Observatory (2018). 134 International Energy Agency (2017). 135 Bundesverband der Energie- und Wasserwirtschaft (2017a). 136 US Department of Energy (2017).
0
2
4
6
8
10
12
14
16
18
20
2011 2012 2013 2014 2015 2016 2017
China France Germany Netherlands
Norway UK USA
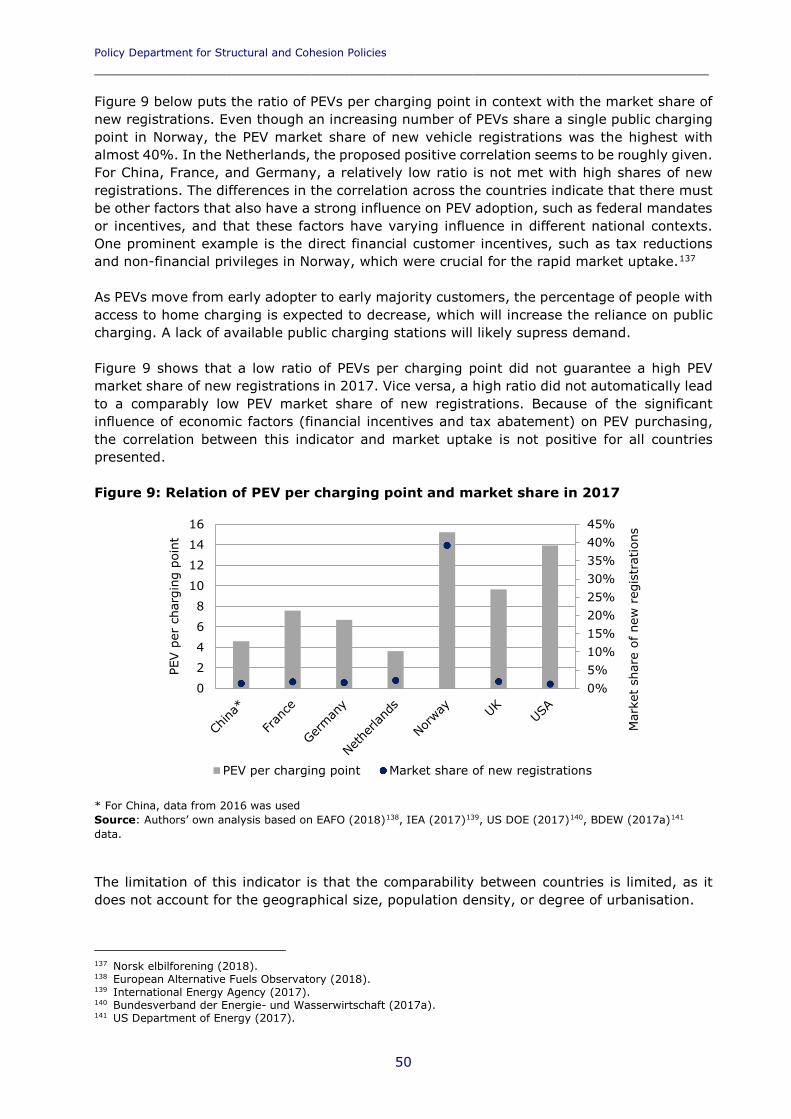
Policy Department for Structural and Cohesion Policies _________________________________________________________________
50
Figure 9 below puts the ratio of PEVs per charging point in context with the market share of new registrations. Even though an increasing number of PEVs share a single public charging point in Norway, the PEV market share of new vehicle registrations was the highest with almost 40%. In the Netherlands, the proposed positive correlation seems to be roughly given. For China, France, and Germany, a relatively low ratio is not met with high shares of new registrations. The differences in the correlation across the countries indicate that there must be other factors that also have a strong influence on PEV adoption, such as federal mandates or incentives, and that these factors have varying influence in different national contexts. One prominent example is the direct financial customer incentives, such as tax reductions and non-financial privileges in Norway, which were crucial for the rapid market uptake.137 As PEVs move from early adopter to early majority customers, the percentage of people with access to home charging is expected to decrease, which will increase the reliance on public charging. A lack of available public charging stations will likely supress demand. Figure 9 shows that a low ratio of PEVs per charging point did not guarantee a high PEV market share of new registrations in 2017. Vice versa, a high ratio did not automatically lead to a comparably low PEV market share of new registrations. Because of the significant influence of economic factors (financial incentives and tax abatement) on PEV purchasing, the correlation between this indicator and market uptake is not positive for all countries presented. Figure 9: Relation of PEV per charging point and market share in 2017
* For China, data from 2016 was used Source: Authors’ own analysis based on EAFO (2018)138, IEA (2017)139, US DOE (2017)140, BDEW (2017a)141 data.
The limitation of this indicator is that the comparability between countries is limited, as it does not account for the geographical size, population density, or degree of urbanisation.
137 Norsk elbilforening (2018). 138 European Alternative Fuels Observatory (2018). 139 International Energy Agency (2017). 140 Bundesverband der Energie- und Wasserwirtschaft (2017a). 141 US Department of Energy (2017).
0%5%10%15%20%25%30%35%40%45%
0
2
4
6
8
10
12
14
16
Mar
ket
shar
e of
new
reg
istr
atio
ns
PEV p
er c
harg
ing
poin
t
PEV per charging point Market share of new registrations

Charging infrastructure for electric road vehicles _________________________________________________________________________
51
This indicator (ratio of PEVs per public charging point) did not show the expected correlation for all countries. Therefore, the ratio of charging points per million inhabitants shall be assessed as well.
• Indicator 2: Ratio of public charging points per million inhabitants
Figure 10: Relation of charging point density per million inhabitants and market
share in 2016
Source: Authors’ own analysis based on EAFO (2018)142, IEA (2017)143, US DOE (2017)144, BDEW (2017a)145, World Bank (2017)146 data.
The highest ratio of charging points per million inhabitants can be observed in the Netherlands and Norway. In contrast to the Indicator 1 discussed in Figure 8 and Figure 9, Indicator 2 may be able to explain some of Norway’s success. While Norway is leading in terms of market share of new registrations, the high ratio of charging points per million inhabitants has not induced the same effect in the Netherlands (please see Figure 10). In China, France, Germany, the UK and the USA, however, the comparably low ratio may be associated with the low market shares. While both indicators reveal that there is some correlation between high availability of charging infrastructure and PEV adoption, there seem to be clear differences between national contexts. This can be explained by the following: first, other factors also have a strong influence on PEV adoption, so the high availability does not automatically lead to high adoption rates. However, lower availability of charging infrastructure is viewed as an inhibitor to new PEV purchases. Second, the comparability is limited as the focus on the national context may be too wide since potential customers make their purchase decision based on their regional infrastructure ecosystem. In their analysis of PEV adoption in 30 countries147, Sierzchula et al. (2014) consider multiple different variables148, and found that charging infrastructure (per inhabitant) has the 142 European Alternative Fuels Observatory (2018). 143 International Energy Agency (2017). 144 Bundesverband der Energie- und Wasserwirtschaft (2017a). 145 US Department of Energy (2017). 146 World Bank (2017). 147 Countries analysed include Australia, Austria, Belgium, Canada, China, Croatia, the Czech Republic, Denmark,
Estonia, Finland, France, Germany, Greece, Iceland, Ireland, Israel, Italy, Japan, the Netherlands, New Zealand, Norway, Poland, Portugal, Slovenia, Spain, Sweden, Switzerland, Turkey, the UK and the USA.
148 Variables considered include financial incentives, urban density, education level, an environmentalism indicator, fuel price, EV price, presence of production facilities, per capita vehicles, model availability, introduction date, charging infrastructure and electricity price.
0%
5%
10%
15%
20%
25%
30%
35%
0200400600800
10001200140016001800
Mar
ket
shar
e of
new
re
gist
ration
s
Cha
rgin
g po
ints
per
mill
ion
inah
bita
nts
Charging points per Mio. inhabitants Market share of new registrations
Policy Department for Structural and Cohesion Policies _________________________________________________________________
52
strongest correlation with PEV adoption among all variables, followed by the availability of financial incentives. This corresponds with the results of the data presented above, namely that the correlation can be observed in some countries, while in others it does not appear to be strong. Sierzchula et al. (2014) also claim that charging infrastructure and financial incentives may be complimentary and should therefore be introduced in coordination. They suggest that national variables such as government procurement plans and recipient groups for subsidies could have a strong effect on PEV adoption.149 In a 2017 white paper by the ICCT on electromobility in the USA, charging infrastructure was also found to be among the most important factors for PEV adoption along with consumer incentives and awareness raising.150 Within California, the highest PEV market shares of new registrations tend to be the ones with the most extensive public charging network. This includes San Jose with a 10% EV market share, San Francisco with 6%, and Los Angeles with 4%. Similar to Sierzcula et al., the ICCT white paper cautions that the correlation between charging infrastructure and PEV adoption is imperfect, and points towards factors such as availability of garages and private parking, or differences in workplace charging opportunities. The different types of non-residential charging infrastructure have varying utilisation rates and visibility to consumers, and therefore will have different impacts on public perception and the adoption of PEVs. For example, a study by the US DOE found that employees with access to workplace charging are six times more likely to purchase a PEV. This is an area where further study is warranted.151 In Europe, Harrison and Thiel (2017) use a system dynamics market agent model to predict that charging infrastructure only becomes the most influential variable for PEV adoption once a share of 5% of total national vehicle stock is reached. Below that level, which has currently only been reached by Norway, other policy instruments such as consumer incentives may be more effective.152 It should be noted that the analysis disregards the percentage of fast charging, which also varies across national and metropolitan contexts. The influence of fast versus slow charging on PEV adoption is not considered in this study and is subject to future research. Another factor which is relevant but outside of the scope of this study is the effect of available workplace charging infrastructure on the need for public charging infrastructure.
Conclusion
The evidence shows that the density of charging infrastructure generally correlates positively with PEV adoption. However, the influence of charging infrastructure as a variable seems to differ depending on the national context. Furthermore, there is a range of other factors that are proven or suspected to be correlated with PEV uptake, such as model availability, financial incentives, urban density, etc. At this point of early market development, it is unclear how these different factors interact and influence PEV adoption. Despite the uncertainty about the extent of influence, it can be concluded that charging infrastructure is necessary, but not sufficient for PEV adoption in any given market.
149 Sierzchula W., et al (2014). 150 International Council on Clean Transportation (2017b). 151 US Department of Energy (2016). 152 Harrison G., Thiel C. (2017).
Charging infrastructure for electric road vehicles _________________________________________________________________________
53
3.2 Impact of demand-oriented and coverage-oriented approaches to PEV adoption and use
In their analysis of the USA market, Li et al. (2016) stress the importance of charging infrastructure rollout in the early stages of market development.153 For the rollout of public charging infrastructure, two main approaches exist. The demand-oriented approach follows the assumption that charging infrastructure should be constructed at those sites where existing and future demand can be determined. This approach aims for the optimal allocation and utilisation of all charging points and avoids redundancies. The coverage-oriented approach follows the premise that public infrastructure should guarantee a minimum standard of service to the widest possible public by minimising the distance between the charging points. While this approach runs the risk of suboptimal utilisation, the coverage-oriented approach provides a safety net for emergency situations and reduces range anxiety of users, which is a major barrier to PEV adoption in the current market stage. To date, almost all the front-runner countries defined in this report are not engaging in the coverage-oriented approach, but apply a demand-oriented approach. Berlin is an interesting example of a demand-oriented approach. The city has defined request areas where citizens can ask for additional charging infrastructure depending on their car ownership. The USA, however, has taken a coverage-oriented approach in designating alternative fuel corridors. These corridors will enable PEVs to travel along most major motorways by spacing charging infrastructure at appropriate intervals. Electrify America is expected to provide a significant portion of this infrastructure along motorways in the coming years. After this network is complete and the range anxiety of drivers has been reduced, there will be more data available to determine the impact of infrastructure on PEV adoption. In addition, several funding initiatives, such as in California, require or prioritise allocations for infrastructure in underserved or lower income urban areas. In the context of the current national German funding regime, there are some steering mechanisms; for example, a regional factor included in the funding guidelines for charging infrastructure. A coverage-oriented approach would require a coordinated approach in which locations are defined ex ante. The German Ministry for Transport is currently preparing a tool to determine an ideal coverage scenario for Germany. China has required 88 pilot cities to install a charging network where charging points are positioned no farther than 1 Kilometre (km) from any point within the city centre, which can be understood as coverage-oriented (please see Section 2.7.1). In a similar endeavour for the European Commission, Thiel et al. developed a methodology using location rasters154 to determine adequate locations for the Italian city of Bolzano/Bozen and the Italian province of Alto Adige/Südtirol and received positive feedback from the municipal authorities.155 An important consideration is the availability of capacity on the grid to accommodate PEV charging at local level, especially when high power Direct Current charging (DC) fast charging is included. Many utilities are currently working with charging infrastructure providers to determine locations that are optimised for both PEV driver access and grid operations.
153 Li S. L., Xing J., Zhou Y. (2016). 154 US Federal Highway Administration (2017). 155 European Commission (2016a).
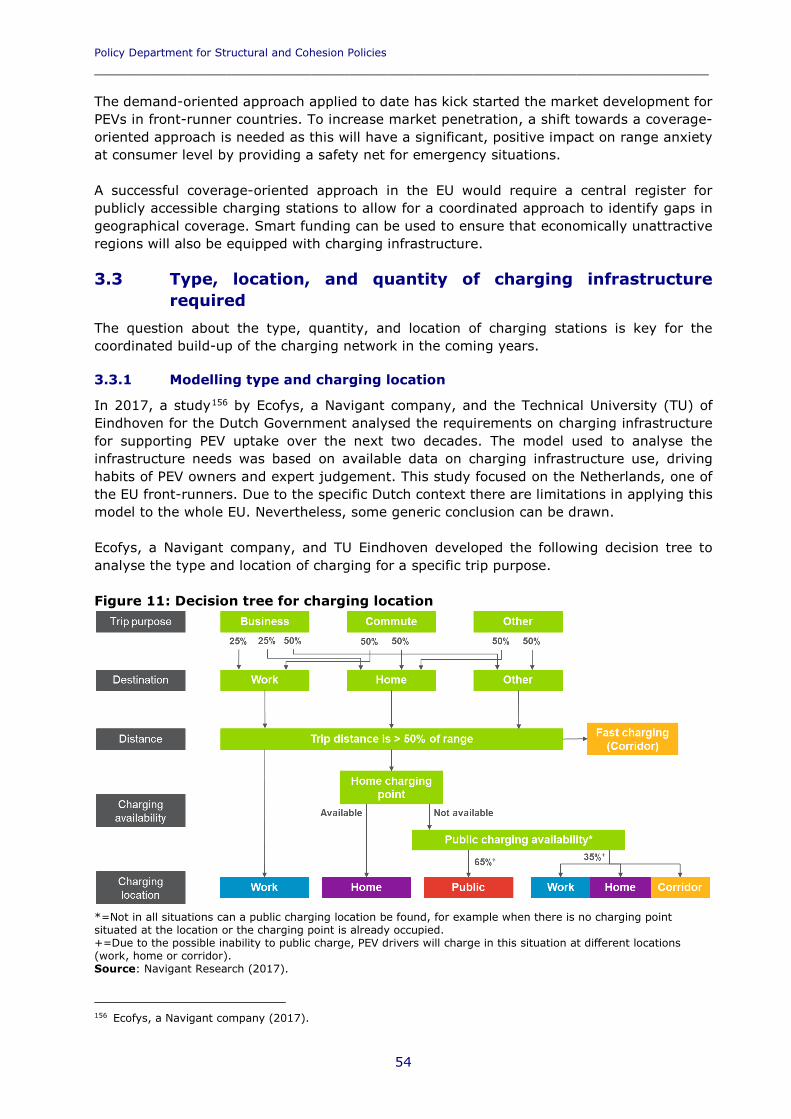
Policy Department for Structural and Cohesion Policies _________________________________________________________________
54
The demand-oriented approach applied to date has kick started the market development for PEVs in front-runner countries. To increase market penetration, a shift towards a coverage-oriented approach is needed as this will have a significant, positive impact on range anxiety at consumer level by providing a safety net for emergency situations. A successful coverage-oriented approach in the EU would require a central register for publicly accessible charging stations to allow for a coordinated approach to identify gaps in geographical coverage. Smart funding can be used to ensure that economically unattractive regions will also be equipped with charging infrastructure.
3.3 Type, location, and quantity of charging infrastructure required
The question about the type, quantity, and location of charging stations is key for the coordinated build-up of the charging network in the coming years.
3.3.1 Modelling type and charging location
In 2017, a study156 by Ecofys, a Navigant company, and the Technical University (TU) of Eindhoven for the Dutch Government analysed the requirements on charging infrastructure for supporting PEV uptake over the next two decades. The model used to analyse the infrastructure needs was based on available data on charging infrastructure use, driving habits of PEV owners and expert judgement. This study focused on the Netherlands, one of the EU front-runners. Due to the specific Dutch context there are limitations in applying this model to the whole EU. Nevertheless, some generic conclusion can be drawn. Ecofys, a Navigant company, and TU Eindhoven developed the following decision tree to analyse the type and location of charging for a specific trip purpose. Figure 11: Decision tree for charging location
*=Not in all situations can a public charging location be found, for example when there is no charging point situated at the location or the charging point is already occupied. +=Due to the possible inability to public charge, PEV drivers will charge in this situation at different locations (work, home or corridor). Source: Navigant Research (2017). 156 Ecofys, a Navigant company (2017).
Charging infrastructure for electric road vehicles _________________________________________________________________________
55
Where PEV drivers will charge is mainly dependent on the destination of their trip (please see Figure 11). This destination is directly related to the purpose of their trip (i.e. business trips, commuting to work and back, other trips unrelated to work). The total distance travelled for each trip purpose type can be obtained from a national survey on vehicles use. The sources often also indicate the distribution of these trips, e.g. the percentage of trips shorter than 10km, between 10km and 20km, between 20km and 30km, etc. In the case of the Netherlands, this source was the Onderzoek Verplaatsingen in Nederland (OViN) (Eng. Research on Movements in the Netherlands). By combining this information, a specific driver profile (distance for each purpose plus distribution of trip distances) can be made for each PEV driver type. For each PEV driver type, an indication can be made on when and how many times the vehicle will be charged, thereby considering technical parameters (energy use of the PEV, battery capacity, power of charging point) and charging preferences (please see Section 2.5). If charging at home is available, there is a clear preference for home charging for commuting and other trips. Business drivers will charge at home and at work, as both destinations make up about 50% of their trips. Even for other trips, business drivers will mainly charge at home. Public charging will only be used in absence of home charging and in case of longer trips (with more than 50% of range). In this model, public charging is defined as normal power charging at a public parking space and has to be differentiated from fast charging in corridors or in motorways (or en route to either of these), where charging occurs with higher frequency similar to fuel stations. Based on expert judgement, an impossibility of 35% to charge at a public point after a trip was assumed for the Dutch situation. Reasons could be that the public charging point is blocked by other PEV drivers or that the charging point is currently out of order. In countries with a higher ratio of PEVs per public charging point (like Norway), the likelihood of not being able to charge will be higher. If a public charging point is not available, charging will be done at home, work or in corridors (e.g. motorways). The outcomes of the model are dependent on the uptake of PEVs, and this will differ significantly per country. However, more general results and implications can be distinguished, which are valid for the Netherlands (which was the focus of this model), but are also likely applicable to other EU Member States:
Early adopters of PEVs more often have access to a place for home charging than the average drivers of a country. When PEV uptake becomes more common, it is likely that the home charger’s share in total chargers will decrease, requiring more public, work, and fast charging in corridors compared to the early years.
With a more prominent role of faster charging stations in corridors (which is likely the case in more spacious EU Member States outside the Netherlands), the number of PEVs per charging point will be significantly higher (because more PEVs can be charged in the same time).
There is a significant share of home, public and work chargers required. In the different scenarios for the Dutch case study, the share of these three charging locations was comparable, signifying the importance of developing infrastructure in all three locations.
It is important to have enough coverage of charging infrastructure to prevent range anxiety (the idea that a driver might run out of electricity before they can charge), but if the number of charging points is too high compared to the number of PEVs, there will not be a good business case for charging point operators.
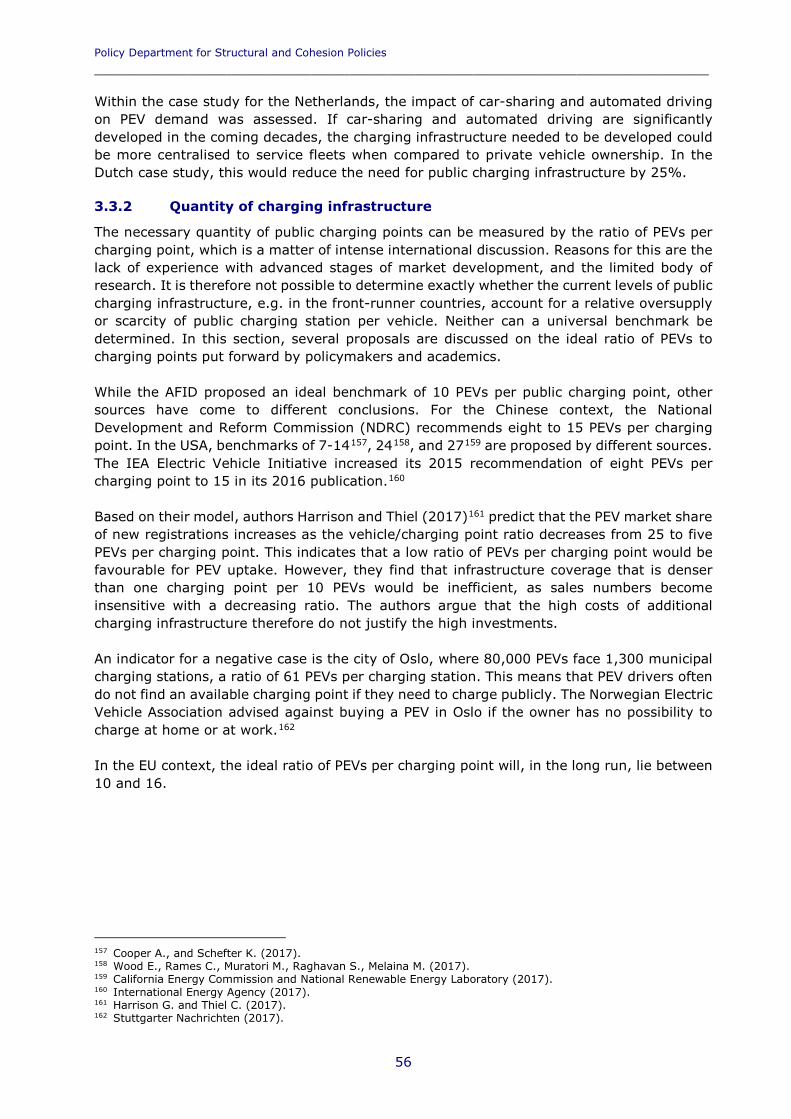
Policy Department for Structural and Cohesion Policies _________________________________________________________________
56
Within the case study for the Netherlands, the impact of car-sharing and automated driving on PEV demand was assessed. If car-sharing and automated driving are significantly developed in the coming decades, the charging infrastructure needed to be developed could be more centralised to service fleets when compared to private vehicle ownership. In the Dutch case study, this would reduce the need for public charging infrastructure by 25%.
3.3.2 Quantity of charging infrastructure
The necessary quantity of public charging points can be measured by the ratio of PEVs per charging point, which is a matter of intense international discussion. Reasons for this are the lack of experience with advanced stages of market development, and the limited body of research. It is therefore not possible to determine exactly whether the current levels of public charging infrastructure, e.g. in the front-runner countries, account for a relative oversupply or scarcity of public charging station per vehicle. Neither can a universal benchmark be determined. In this section, several proposals are discussed on the ideal ratio of PEVs to charging points put forward by policymakers and academics. While the AFID proposed an ideal benchmark of 10 PEVs per public charging point, other sources have come to different conclusions. For the Chinese context, the National Development and Reform Commission (NDRC) recommends eight to 15 PEVs per charging point. In the USA, benchmarks of 7-14157, 24158, and 27159 are proposed by different sources. The IEA Electric Vehicle Initiative increased its 2015 recommendation of eight PEVs per charging point to 15 in its 2016 publication.160 Based on their model, authors Harrison and Thiel (2017)161 predict that the PEV market share of new registrations increases as the vehicle/charging point ratio decreases from 25 to five PEVs per charging point. This indicates that a low ratio of PEVs per charging point would be favourable for PEV uptake. However, they find that infrastructure coverage that is denser than one charging point per 10 PEVs would be inefficient, as sales numbers become insensitive with a decreasing ratio. The authors argue that the high costs of additional charging infrastructure therefore do not justify the high investments. An indicator for a negative case is the city of Oslo, where 80,000 PEVs face 1,300 municipal charging stations, a ratio of 61 PEVs per charging station. This means that PEV drivers often do not find an available charging point if they need to charge publicly. The Norwegian Electric Vehicle Association advised against buying a PEV in Oslo if the owner has no possibility to charge at home or at work.162 In the EU context, the ideal ratio of PEVs per charging point will, in the long run, lie between 10 and 16.
157 Cooper A., and Schefter K. (2017). 158 Wood E., Rames C., Muratori M., Raghavan S., Melaina M. (2017). 159 California Energy Commission and National Renewable Energy Laboratory (2017). 160 International Energy Agency (2017). 161 Harrison G. and Thiel C. (2017). 162 Stuttgarter Nachrichten (2017).
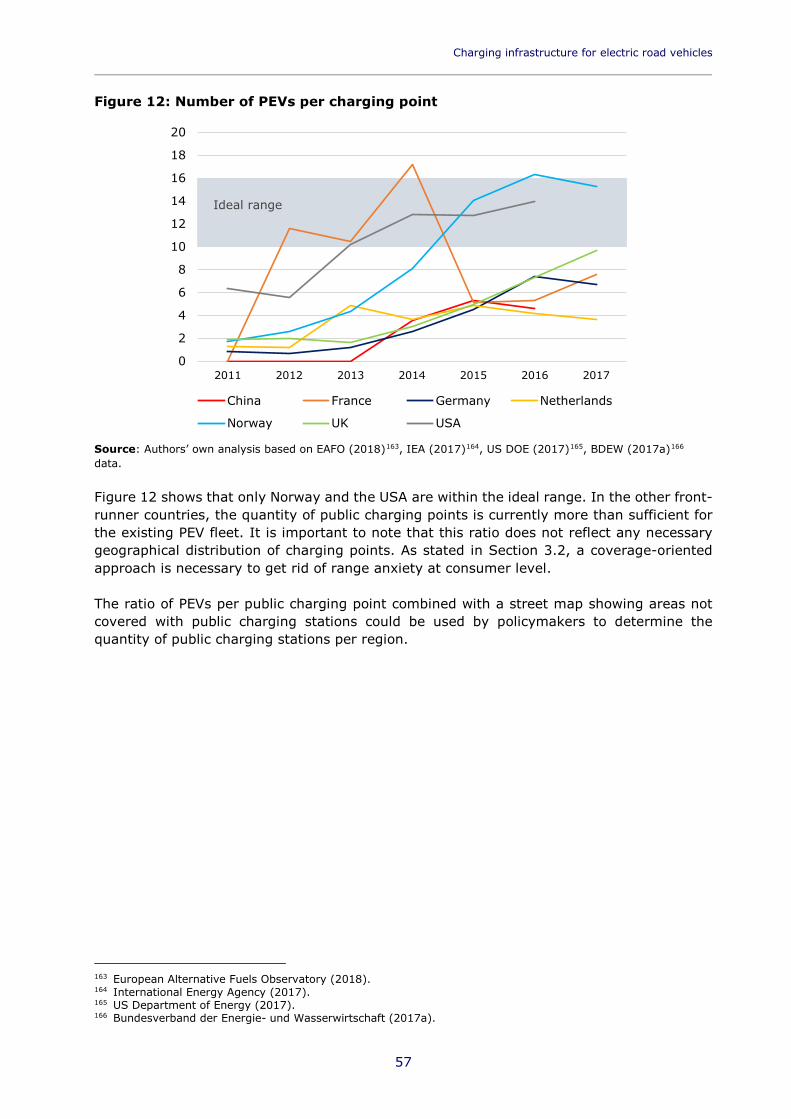
Charging infrastructure for electric road vehicles _________________________________________________________________________
57
Figure 12: Number of PEVs per charging point
Source: Authors’ own analysis based on EAFO (2018)163, IEA (2017)164, US DOE (2017)165, BDEW (2017a)166 data. Figure 12 shows that only Norway and the USA are within the ideal range. In the other front-runner countries, the quantity of public charging points is currently more than sufficient for the existing PEV fleet. It is important to note that this ratio does not reflect any necessary geographical distribution of charging points. As stated in Section 3.2, a coverage-oriented approach is necessary to get rid of range anxiety at consumer level. The ratio of PEVs per public charging point combined with a street map showing areas not covered with public charging stations could be used by policymakers to determine the quantity of public charging stations per region.
163 European Alternative Fuels Observatory (2018). 164 International Energy Agency (2017). 165 US Department of Energy (2017). 166 Bundesverband der Energie- und Wasserwirtschaft (2017a).
Ideal range
0
2
4
6
8
10
12
14
16
18
20
2011 2012 2013 2014 2015 2016 2017
China France Germany Netherlands
Norway UK USA

Policy Department for Structural and Cohesion Policies _________________________________________________________________
58
Charging infrastructure for electric road vehicles _________________________________________________________________________
59
4 BUSINESS CASE ANALYSIS
KEY FINDINGS
• Business models try to find additional revenue streams, such as parking fees, providing demand response, or other grid services, and creating advertisement space.
• Issues for charging station operators to consider is the changing nature of charging technology and how these changes may impact business models. Variations in the utilisation across locations and in time should also be taken into account.
• When evaluating Plug-in Electric Vehicle (PEV) charging infrastructure business models, there are many factors that must be considered including how the charging service is provided, how the business model engages with customers, how revenue is collected, and government support.
• Currently, the best performing business models are PEV Charging Network Companies and Mobile Charging Systems.
• Not all market players adopt every aspect of any one business model. Rather, market players can pick and choose pieces of many models to stitch together their products or services.
• All market players interact, whether they provide one piece of the solution or a full service of both hardware and network operations.
When evaluating Plug-in Electric Vehicle (PEV) charging infrastructure business models, there are many factors that must be considered. Figure 13 was used to identify relevant factors when analysing PEV charging models. A few factors of consideration selected from Figure 13 include how the charging service is provided (the charging infrastructure required), how the business model engages with customers (via software used to create a network), how revenue is collected (through metering, billing and other revenue streams), policy considerations, and government support. Infrastructure considerations include the PEV charging modes, which can be further complicated in execution due to different plug types being utilised in different markets. The software involved facilitates the communication between the vehicle and the charger, as well as how financial transactions are processed. Policy and government support for certain business models can help new and growing charging networks, and existing networks waiting for utilisation rates to rise. Other policies affect how charging network operators choose to collect revenue for providing their services (some revenue collection methods include pay-per-kilowatt, pay-per-minute, and/or some other method like subscription-based services). Other possible revenue streams include collecting parking and advertising revenue, and even the provision of grid services.167 Given the complexity of the previously stated factors, there are many business model options for PEV charging networks. The authors of this study selected factors from Figure 13 to consolidate types of business models and used these factors to categorise and score each model.
167 Hall S., Shepherd S., Wadud Z. (2017).

Policy Department for Structural and Cohesion Policies _________________________________________________________________
60
Items coloured green were included in the scoring methodology, while other factors (in blue) were used in the description of each business model. Figure 13: Business model elements
Source: Navigant Research (2017).
This template helps ensure the coverage of important aspects and functions of a business model. After taking into consideration the factors presented in Figure 13, the authors of this study took the following steps to analyse the business models:
Step 1: A list of business models was created based on available reports, literature, and developments, both in the European Union (EU) and other markets, as well as prior experience and insights from recent projects on charging infrastructure and EVs in, among others, the Netherlands, Norway, Germany, and the United States of America (USA).
Step 2: The list was organised in terms of unique aspects and functions determined by elements extracted from Figure 13.
Step 3: Business models on the list were scored on a scale from 1 to 5 (1=Low, 3=Moderate, 5=High). Funding sources was scored differently, on a scale from 1 to 3. Business models were then ranked on these characteristics to determine the most financially sustainable business models, based on the specific situation in the EU and expert judgement.
Charging infrastructure for electric road vehicles _________________________________________________________________________
61
4.1 Issues and considerations There are a few overarching issues that affect most PEV charging networks. First, while some business models try to find additional revenue streams, such as parking fees, providing demand response, or other grid services, and creating advertisement space as streams of revenue, new hypothetical business models are also being investigated for additional sources of value. For example, there is research on how partnerships can be formed to create revenue-sharing pools to finance new charging points, which may be financially valuable to the partners due to increases in customer visits.168 Another issue to consider is the changing nature of charging technology and how these changes may impact business models. While wireless and dynamic EV charging systems (please see Section 2.2.4.2) are gaining traction in laboratories and pilot projects, it is unlikely these technologies will have high market penetration in the next couple years. However, the convenience and efficiencies of wireless charging makes it a plausible replacement for traditional wired charging. Given that the lifetime of charging units is between five and 10 years, these new technologies could be integrated into current business models relatively seamlessly with future replacement cycles. For this to be put in place, proper planning of charging sites needs to be done during initial installation and the cars in circulation need to accept wireless technologies. Utilisation rates are also an issue in the expansion of public charging infrastructure. For example, a charger’s utilisation rate typically depends on the density of the area (urban, suburban, rural), the PEV penetration within an area, the availability of the local charging market, and local market incentives. The utilisation is also variable over time. Generally, when new PEV charging infrastructure is installed, utilisation is low, depending on PEVs in the area and awareness of the chargers. As the PEV stock and awareness grow over time, so too should the utilisation of the local chargers. In some cases, PEV chargers can be too busy to be reliable for a PEV owner.169 This is remedied as more stations are added in highly utilised areas to balance out the utilisation rates. However, low utilisation stations still provide value as they create a wider network coverage area for the consumer, which serves as a selling point for charging networks when they promote their products and services. The growth of any geographic market is highly variable as external factors affect both utilisation rates and the ability to expand networks. Although highly utilised stations suggest a need for additional chargers in the area, the ability to add stations may be affected by other external factors. For example, a location may have limited power capacity and cannot add additional charging infrastructure, or there is not available land to install more chargers. Utilisation rates should be examined on an individual, market-specific basis, as external factors are a large contributor to the utilisation rates of charging stations.
4.2 Business models reviewed There are many ways in which PEV charging network services vary across business models. For example, how revenue is collected (subscription versus pay-as-you-go, additional revenue sources like parking fees and advertisements), what sources of funding are used for capital costs, and how the model is capable of scaling growth. The factors used by the authors of this study to characterise the selected business models (from Figure 13) are described below.
168 Nigro N., Frades M. (2015). 169 Funke S., Gnann T., Plötz P. (2015).

Policy Department for Structural and Cohesion Policies _________________________________________________________________
62
Factors not included in the scoring methodology
The factors below, selected from the blue items provided in Figure 13, were selected to be included in the comparisons between business models. Due to the qualitative nature of this information, these factors were not used for scoring.
Summary of business model: Gives a general overview of any significant details of the business model.
Revenue collection method: Outlines if and how revenues are collected.
Established in market: Is this business model operating in the market?
Key benefit: What is the major benefit to using this business model?
Key challenge: What is the key challenge limiting this business model?
Factors included in the scoring methodology
The following factors are more easily quantifiable, and thus are included in the scoring process.
Profitability: States if the goals of the business model are to make a profit, elaborates on why or why not, and on the ability to make a profit.
Degree of scalability: Defines the ability of the business model to expand PEV charging infrastructure.
Contribution to public charging infrastructure: Identifies how well the business model supports public charging infrastructure.
Funding source: Used in the scoring methodology, but the details of each of the funding sources are not listed in the summaries below due to spatial limitations of the table. Funding source has a maximum score of three. For a business model to receive a score of three, it must receive only funding from private sources. A score of two indicates it receives funding from a combination of public and private sources, or only some portion of the funding sources are identifiable. A score of one is given when funding sources are completely unidentifiable.
In Table 8, the authors of this study identified and characterised seven business models for public PEV charging infrastructure, and explain the business models in more detail.
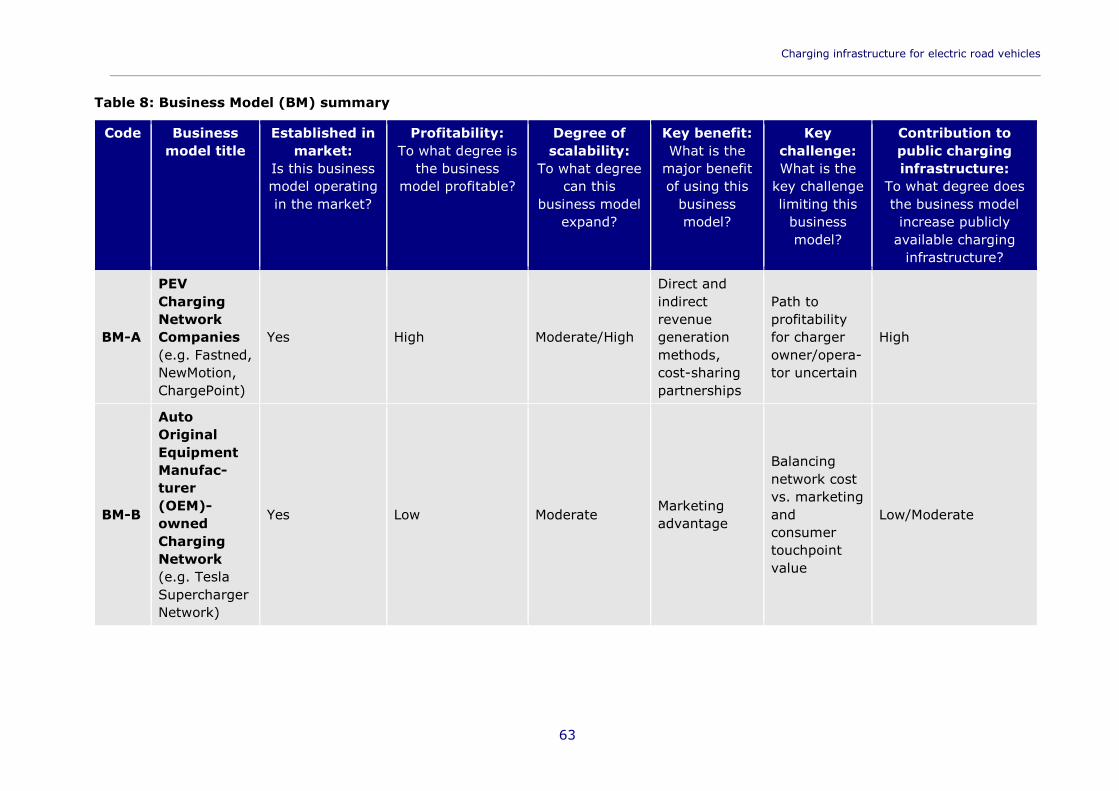
Charging infrastructure for electric road vehicles ______________________________________________________________________________________________________________
63
Table 8: Business Model (BM) summary
Code Business model title
Established in market:
Is this business model operating in the market?
Profitability: To what degree is
the business model profitable?
Degree of scalability:
To what degree can this
business model expand?
Key benefit: What is the
major benefit of using this
business model?
Key challenge: What is the
key challenge limiting this
business model?
Contribution to public charging infrastructure:
To what degree does the business model increase publicly
available charging infrastructure?
BM-A
PEV Charging Network Companies (e.g. Fastned, NewMotion, ChargePoint)
Yes High Moderate/High
Direct and indirect revenue generation methods, cost-sharing partnerships
Path to profitability for charger owner/opera-tor uncertain
High
BM-B
Auto Original Equipment Manufac-turer (OEM)-owned Charging Network (e.g. Tesla Supercharger Network)
Yes Low Moderate Marketing advantage
Balancing network cost vs. marketing and consumer touchpoint value
Low/Moderate
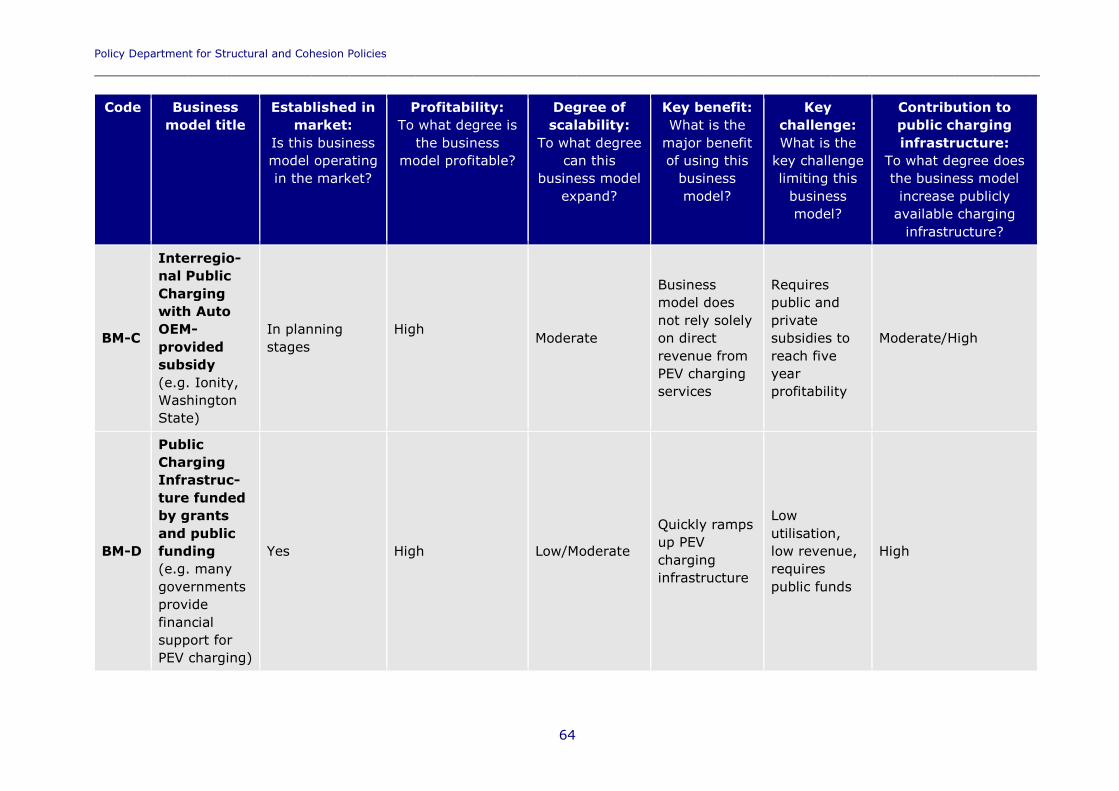
Policy Department for Structural and Cohesion Policies ____________________________________________________________________________________________________
64
Code Business model title
Established in market:
Is this business model operating in the market?
Profitability: To what degree is
the business model profitable?
Degree of scalability:
To what degree can this
business model expand?
Key benefit: What is the
major benefit of using this
business model?
Key challenge: What is the
key challenge limiting this
business model?
Contribution to public charging infrastructure:
To what degree does the business model increase publicly
available charging infrastructure?
BM-C
Interregio-nal Public Charging with Auto OEM-provided subsidy (e.g. Ionity, Washington State)
In planning stages
High Moderate
Business model does not rely solely on direct revenue from PEV charging services
Requires public and private subsidies to reach five year profitability
Moderate/High
BM-D
Public Charging Infrastruc-ture funded by grants and public funding (e.g. many governments provide financial support for PEV charging)
Yes High Low/Moderate
Quickly ramps up PEV charging infrastructure
Low utilisation, low revenue, requires public funds
High
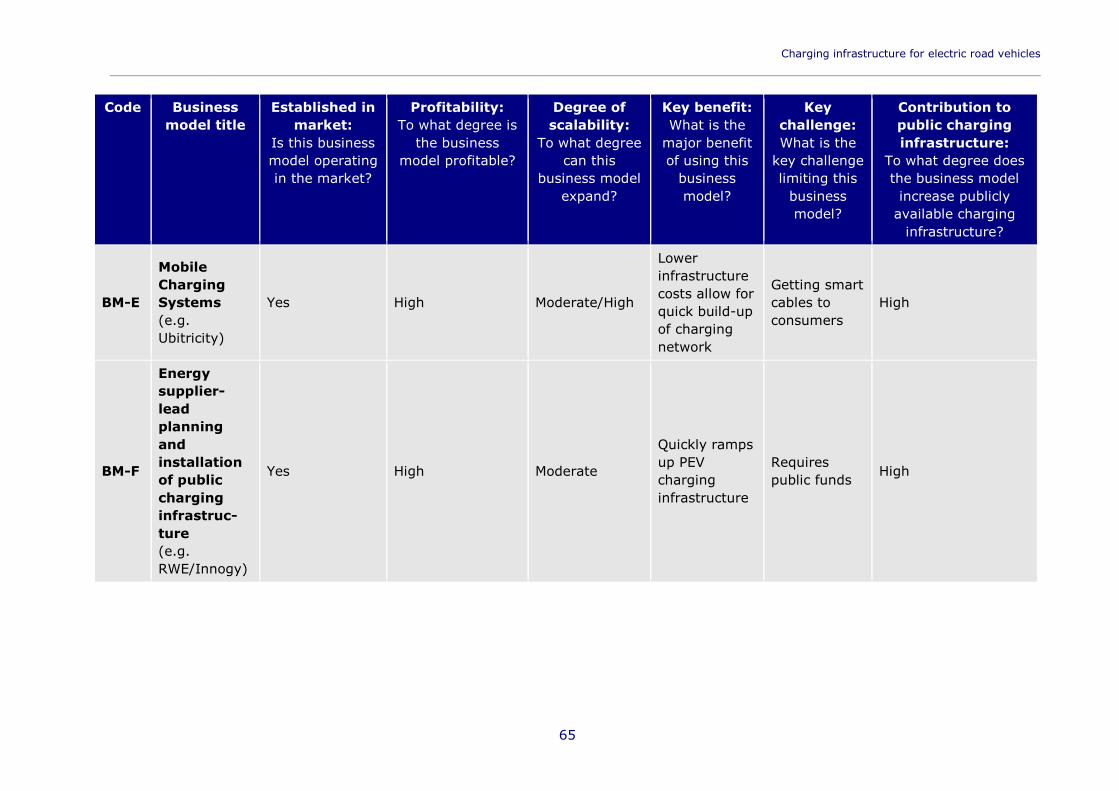
Charging infrastructure for electric road vehicles ______________________________________________________________________________________________________________
65
Code Business model title
Established in market:
Is this business model operating in the market?
Profitability: To what degree is
the business model profitable?
Degree of scalability:
To what degree can this
business model expand?
Key benefit: What is the
major benefit of using this
business model?
Key challenge: What is the
key challenge limiting this
business model?
Contribution to public charging infrastructure:
To what degree does the business model increase publicly
available charging infrastructure?
BM-E
Mobile Charging Systems (e.g. Ubitricity)
Yes High Moderate/High
Lower infrastructure costs allow for quick build-up of charging network
Getting smart cables to consumers
High
BM-F
Energy supplier-lead planning and installation of public charging infrastruc-ture (e.g. RWE/Innogy)
Yes High Moderate
Quickly ramps up PEV charging infrastructure
Requires public funds High
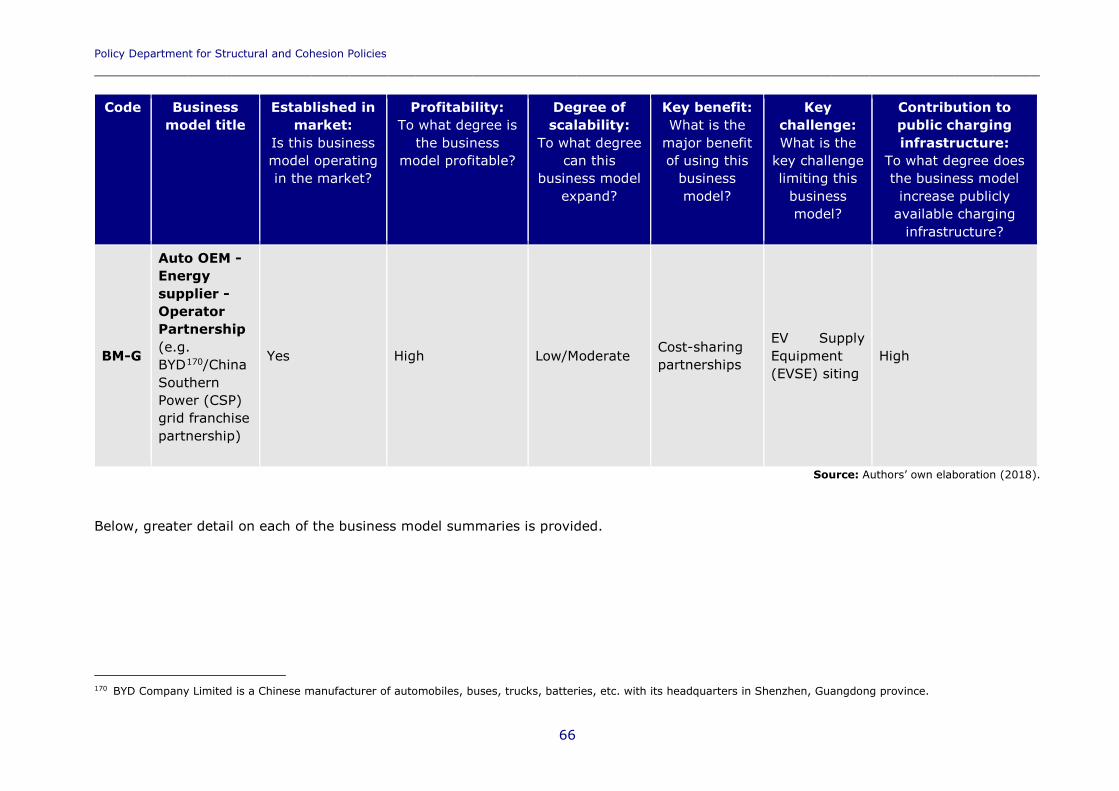
Policy Department for Structural and Cohesion Policies ____________________________________________________________________________________________________
66
Code Business model title
Established in market:
Is this business model operating in the market?
Profitability: To what degree is
the business model profitable?
Degree of scalability:
To what degree can this
business model expand?
Key benefit: What is the
major benefit of using this
business model?
Key challenge: What is the
key challenge limiting this
business model?
Contribution to public charging infrastructure:
To what degree does the business model increase publicly
available charging infrastructure?
BM-G
Auto OEM - Energy supplier - Operator Partnership (e.g. BYD170/China Southern Power (CSP) grid franchise partnership)
Yes High Low/Moderate Cost-sharing partnerships
EV Supply Equipment (EVSE) siting
High
Source: Authors’ own elaboration (2018). Below, greater detail on each of the business model summaries is provided.
170 BYD Company Limited is a Chinese manufacturer of automobiles, buses, trucks, batteries, etc. with its headquarters in Shenzhen, Guangdong province.
Charging infrastructure for electric road vehicles _________________________________________________________________________
67
BM-A: PEV Charging Network Companies171 172 (e.g. Fastned, ChargePoint, evGO, Allego, The New Motion, Electric Vehicle (EV) Box)
Summary of business model: There are a variety of PEV charging network companies across the EU and in other markets that provide access to their network of public charging infrastructure for a fee. These companies use similar business models with slight tweaks to differentiate them. In addition, the versions of this model achieve some of this differentiation by identifying multiple revenue sources to achieve profitability, which in turn allows them to scale the model and create more public charging infrastructure. In some circumstances, additional partnerships can be made to offset the costs of chargers and/or electricity, such as with retailers who find value in providing the service to their customers.173
Revenue collection method: Revenue collection methods vary both within and across business models. Typically, these companies collect revenue by charging for the purchase of electricity, either per-use/per-kilowatt-hour and/or through a subscription-based model, or by charging for access to a charger per minute. For example, Fastned has three price plans: users can either pay per kilowatt-hour purchased, or pay one of two monthly subscription fees, allowing the users to purchase electricity at a discount.174 These business models can also have revenue streams from the use of the parking spot and from selling advertising space.
Established in market: Yes, many of these companies have been around for five years or more.
Key benefit: Many of these business models include subscription services such as Fastned, where users can opt to pay a monthly fee for a lower cost per kilowatt-hour and creates additional revenue streams for the company, and helps reduce being reliant only on the sale of electricity. Under some circumstances, partners on charging installations may determine the price of the energy, allowing the operator to determine the value of the charging station.
Key challenge: Subscription-based business models face a considerable scaling issue. As these companies grow, they are limited in what ways they can increase revenue. PEV charging network companies with subscription-based business models become reliant on increasing PEV drivers and on a growing utilisation rate of public charging infrastructure. This contrasts with other business models that can take advantage of government support, OEM-provided charging networks, and identifying other streams of revenue.
Profitability: High. Many of these companies are private, and report strong revenue growth. Fastned has had both volume and revenue growth over the past two years and reported its first two DC fast chargers have reached the operational break-even point. Fastned credits its market growth to the region’s improved tax incentives for PEVs and to longer-range PEVs.
Degree of scalability: Moderate/High. Some PEV charging network companies create partnerships to distribute charging stations while others own and operate the stations themselves. These networks will expand if these companies see value in expanding their charging networks.
171 Fastned.nl (n.d.). 172 Chargepoint.com (n.d.). 173 Nigro N., Frades M. (2015). 174 Fastned.nl (n.d.).
Policy Department for Structural and Cohesion Policies _________________________________________________________________
68
Contribution to public charging infrastructure: High. The build-up of these charging networks relies on the utilisation of the chargers to collect revenue from the sale of electricity, and the prevalence of their availability increases subscriptions. Although subscriptions may deter some customers, it is a widely practiced business model.
BM-B: Auto OEM-owned Charging Network175 (e.g. Tesla Supercharger Network)
Summary of business model: Some auto OEMs have invested in their own fast charger network for their customers. These networks typically add value to the auto OEM by providing additional customer touch points, as well as marketing opportunities to capture new customers. Battery OEMs may also find value in providing charging networks.
Revenue collection method: In the past, auto OEM-owned charging networks, such as the Tesla Supercharger Network, did not bill users for the use of their chargers. Starting in 2017, Tesla is moving to a new pay-per-use model for new vehicle purchases.
Established in market: Yes. Tesla began building its Supercharger Network in 2012.
Key benefit: The primary benefit of this business model is the captive value provided to the company and its customers by tying the vehicles to the supporting infrastructure from a single company. Ideally, this model drives additional PEV sales and can be a service that also doubles as a marketing campaign.
Key challenge: The key challenge of this business model is obtaining the benefits for the OEM. The company must be able to prove to its shareholders that the charger network campaign is of equivalent value to a marketing campaign to drive additional vehicle sales.
Profitability: Low. The purpose of the auto OEM-owned network such as Tesla’s Supercharger Network is to serve as additional opportunities for Tesla to interact with and market to its customers and drive additional sales. Tesla has confirmed that its charging network will never be a revenue stream for the company and will only provide value to Tesla and its customers, rather than the entire market.
Degree of scalability: Moderate. The network is scalable so long as the company sees value in the network similar to that of a marketing campaign. Once the costs stop justifying the value, the charging infrastructure is no longer built up. That being said, Tesla’s Supercharger Network is the most complete global fast charging network to date.
Contribution to public charging infrastructure: Low/Moderate. While the network would be provided, it is possible similar business models would follow in Tesla’s footsteps and only provide charging to the OEM’s own vehicles.
175 Weiller C., et al. (2015).
Charging infrastructure for electric road vehicles _________________________________________________________________________
69
BM-C: Interregional Public Charging with Auto OEM-provided subsidy (e.g. Ionity, Washington State)
Business model summary: The European initiative Ionity is a recent application of a similar hypothetical business model identified by the Centre for Climate and Energy Solutions (C2ES).176 C2ES is a global think tank based in the USA, and was previously the Pew Centre on Global Climate Change and has previously been named the “world’s top environmental think tank”. While the C2ES model was developed with the USA in mind, it has global opportunities. In the case of Ionity and the hypothetical business model from C2ES, large businesses that benefit from PEV sales and use (such as automakers or fuel suppliers) contribute funding to subsidise the deployment of a DC fast charging network for interregional PEV travel. Ionity is a partnership with German OEMs and Ford, along with Shell, OMV, Tank & Rast, and Circle K. The partnership plans to create an electrified motorway network in Europe, providing 350 Kilowatt (kW) chargers every 120 Kilometre (km). It was announced in November 2017, so there is little available data. However, the data from the hypothetical model can be used to get a better understanding of what might be needed for Ionity to be successful.
Revenue collection method: Direct revenues from the sale of electricity to the consumer. Rates used in the hypothetical base-case scenario were USD (United States Dollar (USD) 0.50 (Euro (EUR) 0.43)/Kilowatt-hour (kWh), assuming 1,200 uses per station per year.
Established in market: In planning stages. Ionity was announced in November 2017. This is also a hypothetical business model using a real-world scenario for analysis.
Key benefit: This business model does not rely solely on direct revenue from PEV charging services. Partnerships with a company or entity can help finance charging infrastructure, as these entities see non-monetary value propositions from the development of such networks. Examples of private sector partners include automakers and battery suppliers looking to expand PEV networks as a tool to sell more PEVs, energy suppliers that wish to expand access to charging in their service territories, and retail/restaurants where on site charging may provide additional sales.
Key challenge: C2ES found that there are no scenarios where the charger’s owner-operator would profit from its investments under the base-case scenario without public subsidies.
Profitability: High in an overall ecosystem context. The OEM’s focus is on driving vehicle sales to obtain profits rather than profiting from the chargers themselves. With government incentives to help offset installation costs, a larger network can be created with the same amount of OEM capital (though requirements for open access might be needed to ensure universal usage capability by all market participants or the operator of the charging network and possibly for any other retail partners). C2ES found that the charging stations alone in its hypothetical business model are profitable within five years with outside or public subsidies.177
176 Nigro N., Frades M. (2015). 177 Centre for Climate and Energy Solutions (C2ES) found that the business model could have a five-year
profitability if the owner-operator was issued a one-time grant of USD 220,000 (~EUR 187,000), the BEV sales tax exemption continued, and a USD 110,000 (~EUR 94,000) loan at 5.4% interest. Other paths to profitability included changing the assumptions of the model by increasing the user fee to USD 0.70 (EUR 0.59)/kWh, or increasing the assumed utilisation rates from 1,200 uses per year to 2,000+ times per year.
Policy Department for Structural and Cohesion Policies _________________________________________________________________
70
Degree of scalability: Moderate. Under the right conditions, this business model is scalable under profitable conditions. The business model has some limitations: for example, it is mainly applicable for interregional travel with existing charging infrastructure gaps. In addition, depending on the private sector partner(s), charging infrastructure may be limited to only certain users. For this model to be profitable, C2ES identified a few public interventions.178
Contribution to public charging infrastructure: Moderate/High. This model is potentially limited depending on the private sector partner(s). The original model describes the partner as an auto OEM, which may limit the vehicle make and model type which can use the charging infrastructure. This may not be an issue if the partner was a battery supplier or an energy supplier.
BM-D: Public Charging Infrastructure funded by grants and public funding179 (e.g. many governments provide financial support for PEV charging)
Business model summary: This business model reflects governments assisting with the funding or commissioning charging point providers for the build-up of public EV charging infrastructure. The charging point providers purchase electricity from an energy supplier and sell electricity or charge for parking. These installations are often supported through public-private partnerships or directly through public grants. When governments first began funding PEV charging infrastructure installations, charging was often offered free of charge to incentivise the transition to PEVs. With the cost of installation and the cost of operation and maintenance, many of these public chargers are having to shift to a pay-per-use model. Many charging network companies started by using public funds to grow charging networks, and this can function as a funding mechanism for building up networks ahead of revenues justifying growth.
Revenue collection method: Though some charging used to be offered free of charge, now revenue is typically collected through the sale of electricity and/or a flat fee per charging session. Customers can also be charged for parking.
Established in market: Yes. Norway, France, the Netherlands, and Germany all provide assistance through public-private partnerships, while the United Kingdom (UK) has also offered grants.180 Please see Section 2.6.1 for more detail.
Key benefit: A local government commissioning the installation of the infrastructure ensures a holistic approach is taken to create a sufficient network of charging stations, particularly with the inclusion of low income and other overlooked areas.
Key challenge: Municipalities will have to justify the use of public funds under this model for the majority of PEV charging stations with lower utilisation rates by identifying other value propositions outside of revenue.
Profitability: High. When public money is provided to assist with the build-up of charging networks, charging network companies can achieve profitability much faster due to the reduced upfront capital costs typically required when expanding the network.
178 The public interventions identified by C2ES include: a low interest loan financing 50% of the project debt (30%
of the total project capital cost) at an interest rate of 5.4% with a 10-year term, a grant subsidising the cost of charging station equipment by 50%, a 50% subsidy for the cost of electric energy supplier upgrades, grid interconnection, construction, and equipment installation for DC fast charging sites, and a five-year extension on the BEV sales tax exemption policy. This study also assumes an increase in charging station utilisation growth rate from 15% to 30%.
179 Hall S., Shepherd S., Wadud Z. (2017). 180 Morland J. (2017).
Charging infrastructure for electric road vehicles _________________________________________________________________________
71
Degree of scalability: Low/Moderate. Outside of high utilisation areas, these types of operations require consistent public sector contributions to expand their available infrastructure.
Contribution to public charging infrastructure: High. This model supports the build-up of public charging infrastructure. The one caveat is that it is dependent on the PEV network operator commissioned for the project. An operator that requires a subscription may deter users and limit utilisation.
BM-E: Mobile Charging Systems181 (e.g. Ubitricity)
Summary of business model: Mobile charging systems enable owners to charge their vehicles by using a smart cable that acts as a mobile electricity metre. Companies such as Germany’s Ubitricity install low-cost sockets (SimpleSockets) in publicly accessible places (mainly street lamps) which can then be used by anyone with a SmartCable to top off their vehicle’s charge. The SmartCable communicates with the vendor and handles the transactions.
Revenue collection method: The user creates an account with the company and is charged based on the sale of electricity. These business models can also have revenue streams from the use of the parking spot and from selling advertising space.
Established in market: Yes. The London Borough of Hounslow recently begun installing Ubitricity’s SimpleSockets in some neighbourhoods.
Key benefit: This business model utilises low-cost charging infrastructure which provides an inexpensive way to expand publicly available charging infrastructure since installation usually requires only a special socket. Since the plug provided on the street lamp does not have a metre, power usage cannot be tracked without another device. The Ubitricity system provides an electricity revenue grade metre and a cellular grade modem in the charging cable that plugs into the port on the street lamp. This allows electricity consumption to be measured during a charging event and the amount consumed to be uploaded via the cellular modem to enable the financial transaction of electricity consumed. This charging infrastructure allows PEV users to charge their vehicle where public sockets already exist while still purchasing the electricity.
Key challenge: The key challenges to this business model are one, getting smart cables in the hands of PEV drivers and two, identifying opportunities for socket installation. The cable is something consumers would have to carry in their vehicle at all times, while companies would still need to get access to infrastructure owners and convince them to purchase and install the socket.
Profitability: High. Companies like Ubitricity look to make a profit by enabling access to a new network of charging infrastructure and the sale of electricity, while keeping upfront capital costs low.
Degree of scalability: Moderate/High. The low cost of charger installations and the prevalence of potential sites allows the network to expand cheaply and quickly. These networks will only expand if these companies see value in expanding their charging networks.
Contribution to public charging infrastructure: High. The build-up of these charging networks relies on the adoption of these sockets, the purchase of the smart cables, and the utilisation of the chargers to collect revenue from the sale of electricity.
181 Ubitricity (n.d.).
Policy Department for Structural and Cohesion Policies _________________________________________________________________
72
BM-F: Energy supplier-lead planning and installation of charging infrastructure182 (e.g. RWE/Innogy)
Business model summary: RWE/Innogy has partnered with over 100 companies to provide one of the largest public charging networks in Europe. The RWE/Innogy charging network operates on a pay-as-you-go structure, and users do not need an Innogy account to access the network of over 5,800 charging points. This model is different from the business model funded through public money in that the energy provider is the primary actor, or can partner with the PEV charging network companies, rather than PEV network companies being commissioned by governments. The source of funding comes from the energy providers’ sale of electricity to utility customers rather than public money.
Revenue collection method: Revenue can be collected several ways, depending on the energy supplier’s level of involvement. The energy supplier may outsource operations through a network provider, or the energy supplier could own and operate the stations themselves. Depending on the customer, revenue on the sale of electricity may be collected via energy bill charges, subscriptions, pay-per-use, or any combination. Other sources of potential revenue include parking fees and advertisement space.
Established in market: Yes. Innogy has owned and operated charging stations since its inception in 2016.
Key benefit: Energy suppliers can take a holistic approach to the build-up of charging infrastructure, making sure underserved and low-income areas are provided with sufficient charging amenities. In addition, most customers already have an account with an energy supplier. Once public charging transactions can occur and correctly charge the correct accounts, this may be superior to subscription-based models. This model could also provide the energy suppliers with the opportunity to use public charging stations to aggregate capacity for demand response events.
Key challenge: The general challenge is getting high enough utilisation to justify the use of all electricity customer funds to finance these projects. There is also a challenge for energy supplier-operated public charging stations to identify solutions for charging separate users in a public setting. Currently, these charging stations are linked to a specific energy supplier account. To transition to public charging stations, there will need to be a solution to enable the purchase transaction between different customers. There are a couple programmes providing a solution already.
One is Ubitricity’s business model, which uses RFID-encoded charging cables to identify users and handle transactions,183 while pilots in Germany and California are using blockchain technology to enable the transactions.184
Profitability: High. Energy suppliers are eager to cash in on the transition to EVs, and would be able to set their own rates to maximise their benefit (with approval from the proper authority). Energy suppliers and/or charging network operators could use any number of the revenue options available, such as subscription models, pay-per-use, parking fees, and advertisement space.
182 Hall S., Shepherd S., Wadud Z. (2017). 183 Ubitricity (n.d.). 184 Shareandcharge (n.d.).
Charging infrastructure for electric road vehicles _________________________________________________________________________
73
Degree of scalability: Moderate. The energy supplier will have to justify the use of utility customer funds for the rollout of PEV charging infrastructure before seeing increased revenues, and to identify solutions to technological challenges such as ways to charge different users. The advantage is that the energy supplier may have more autonomy as an actor than the government. In addition, models that commission a PEV charging network operator may create barriers to participation if they require subscriptions for use.
Contribution to public charging infrastructure: High. This model supports the build-up of public charging infrastructure. The one caveat with this model is that it is dependent on the PEV network operator commissioned for the project. An operator that requires a subscription may limit utilisation and deter users by requiring a subscription to use the station.
BM-G: Auto OEM – Energy supplier – Operator Partnership185 (e.g. BYD/China Southern Power Grid franchise partnership)
Summary of business model: In this business model, an auto OEM and an energy supplier partner are partnered for the build-up of public charging infrastructure. In the case of BYD/China Southern Power (CSP) grid franchise partnership, every new PEV driver in Shenzhen will get two vehicle charging stations installed, one at their residence and one near their place of business, free of charge. BYD and CSP take care of the installation costs, and franchise the maintenance and operation of the chargers. The goal of the partnership is to rapidly expand the available charging infrastructure for public use and promote the sales and adoption of EVs in Shenzhen, China. In 2017, Shenzhen announced a 100% increase in government grants for charging station operators.186 Other government subsidies include PEV use of bus lanes during rush hour, insurance privileges, and free annual maintenance checks, as well as extremely affordable peak and off-peak electricity prices for new PEV users: night charging is approximately Chinese Yuan (CNY) 0.03/kWh (<EUR 0.01/kWh).
Revenue collection method: The charging infrastructure is franchised, and then collects revenue based on electricity sold.187 188
Established in market: Yes, this partnership began in 2012.
Key benefit: This business model creates charging infrastructure that is directly tied to the sales of PEVs, and there is no immediate requirement for profitability.
Key challenge: It is unclear if this business model can continue to scale without subsidies provided by the government.
Profitability: High. Charging station installation is subsidised by the government/energy supplier/OEM and operated by a franchise. Subsidies help charging networks reduce capital costs and achieve profitability much faster.
Degree of scalability: Low/Moderate. Business models using government subsidies to increase access to PEV charging infrastructure require consistent public subsidies outside of high utilisation areas to continue growth.
185 Weiller C., et al. (2015). 186 Operators can receive CNY 300 or CNY 600 (EUR 38.51 or EUR 77.01) in government subsidies for every
kilowatt-hour of power capacity they build, depending on the type of chargers installed. These subsidies are only available to companies who run stations with a total charging capacity of over 8,000kW.
187 Weiller C., et al. (2015). 188 Lauer J., Dickhaut W. (2016).
Policy Department for Structural and Cohesion Policies _________________________________________________________________
74
Contribution to public charging infrastructure: High. Each vehicle purchased in Shenzhen receives two publicly usable charging stations.
4.3 Scoring Table 9 is the scorecard of the business models. The table is sorted by aggregate score from highest to lowest. Each business model is given a score between 1-5 (1=Poor, 3=Moderate, and 5=High) for the following categories:
Profitability scores were judged based on the business models’ strategies for securing revenue and the distinct path to profitability.
Degree of scalability was scored based on market opportunities, the presence of financial support (either through revenue or public support), and the ability to expand PEV charging infrastructure under the current model.
Contribution to public charging infrastructure was scored by assessing the goals and availability of the chargers provided by the business model.
Funding source is given a score between 1-3 (1=funding unidentifiable, 2=public/private fund mix or partially unidentifiable, 3=private funding only).
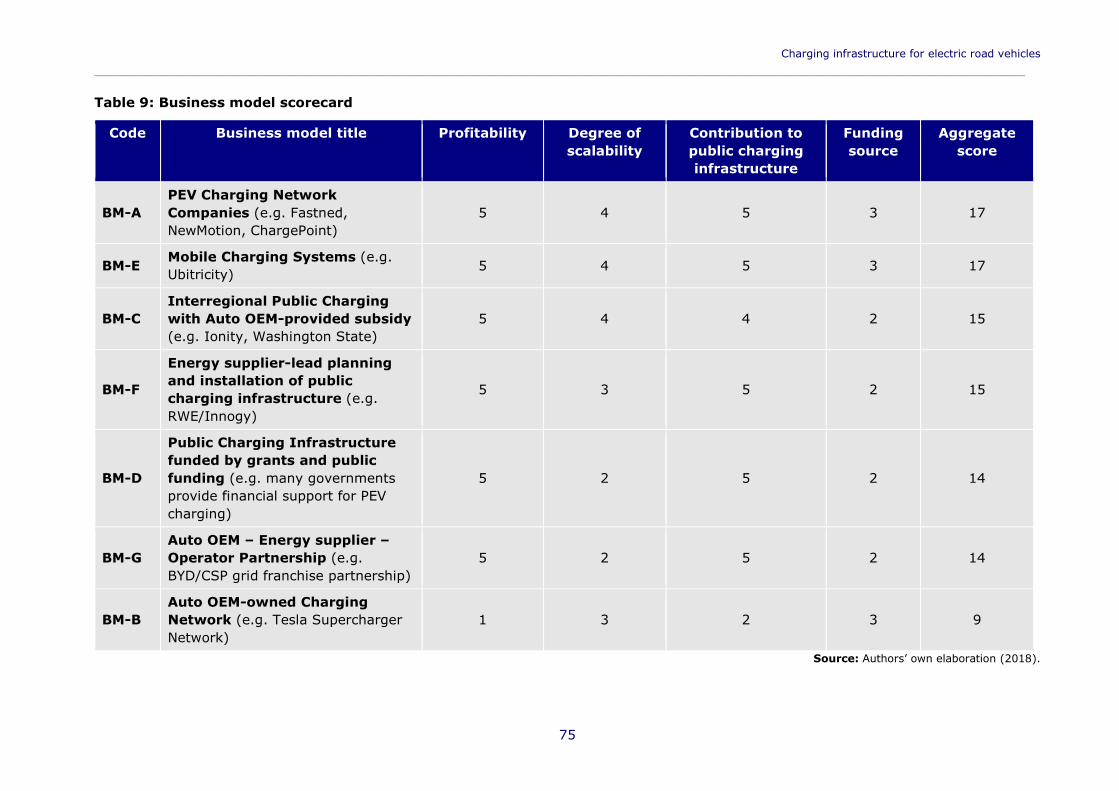
Charging infrastructure for electric road vehicles ______________________________________________________________________________________________________________
75
Table 9: Business model scorecard
Code Business model title Profitability Degree of scalability
Contribution to public charging infrastructure
Funding source
Aggregate score
BM-A PEV Charging Network Companies (e.g. Fastned, NewMotion, ChargePoint)
5 4 5 3 17
BM-E Mobile Charging Systems (e.g. Ubitricity) 5 4 5 3 17
BM-C Interregional Public Charging with Auto OEM-provided subsidy (e.g. Ionity, Washington State)
5 4 4 2 15
BM-F
Energy supplier-lead planning and installation of public charging infrastructure (e.g. RWE/Innogy)
5 3 5 2 15
BM-D
Public Charging Infrastructure funded by grants and public funding (e.g. many governments provide financial support for PEV charging)
5 2 5 2 14
BM-G Auto OEM – Energy supplier – Operator Partnership (e.g. BYD/CSP grid franchise partnership)
5 2 5 2 14
BM-B Auto OEM-owned Charging Network (e.g. Tesla Supercharger Network)
1 3 2 3 9
Source: Authors’ own elaboration (2018).
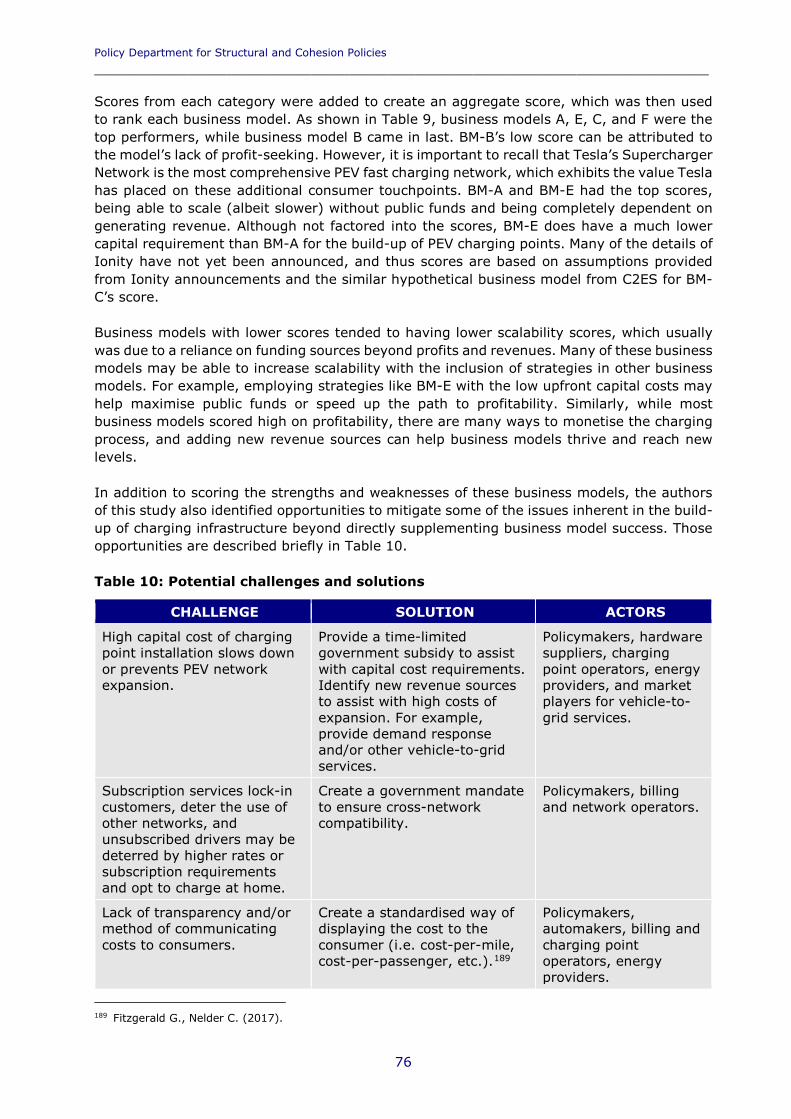
Policy Department for Structural and Cohesion Policies _________________________________________________________________
76
Scores from each category were added to create an aggregate score, which was then used to rank each business model. As shown in Table 9, business models A, E, C, and F were the top performers, while business model B came in last. BM-B’s low score can be attributed to the model’s lack of profit-seeking. However, it is important to recall that Tesla’s Supercharger Network is the most comprehensive PEV fast charging network, which exhibits the value Tesla has placed on these additional consumer touchpoints. BM-A and BM-E had the top scores, being able to scale (albeit slower) without public funds and being completely dependent on generating revenue. Although not factored into the scores, BM-E does have a much lower capital requirement than BM-A for the build-up of PEV charging points. Many of the details of Ionity have not yet been announced, and thus scores are based on assumptions provided from Ionity announcements and the similar hypothetical business model from C2ES for BM-C’s score. Business models with lower scores tended to having lower scalability scores, which usually was due to a reliance on funding sources beyond profits and revenues. Many of these business models may be able to increase scalability with the inclusion of strategies in other business models. For example, employing strategies like BM-E with the low upfront capital costs may help maximise public funds or speed up the path to profitability. Similarly, while most business models scored high on profitability, there are many ways to monetise the charging process, and adding new revenue sources can help business models thrive and reach new levels. In addition to scoring the strengths and weaknesses of these business models, the authors of this study also identified opportunities to mitigate some of the issues inherent in the build-up of charging infrastructure beyond directly supplementing business model success. Those opportunities are described briefly in Table 10. Table 10: Potential challenges and solutions
CHALLENGE SOLUTION ACTORS
High capital cost of charging point installation slows down or prevents PEV network expansion.
Provide a time-limited government subsidy to assist with capital cost requirements. Identify new revenue sources to assist with high costs of expansion. For example, provide demand response and/or other vehicle-to-grid services.
Policymakers, hardware suppliers, charging point operators, energy providers, and market players for vehicle-to-grid services.
Subscription services lock-in customers, deter the use of other networks, and unsubscribed drivers may be deterred by higher rates or subscription requirements and opt to charge at home.
Create a government mandate to ensure cross-network compatibility.
Policymakers, billing and network operators.
Lack of transparency and/or method of communicating costs to consumers.
Create a standardised way of displaying the cost to the consumer (i.e. cost-per-mile, cost-per-passenger, etc.).189
Policymakers, automakers, billing and charging point operators, energy providers.
189 Fitzgerald G., Nelder C. (2017).
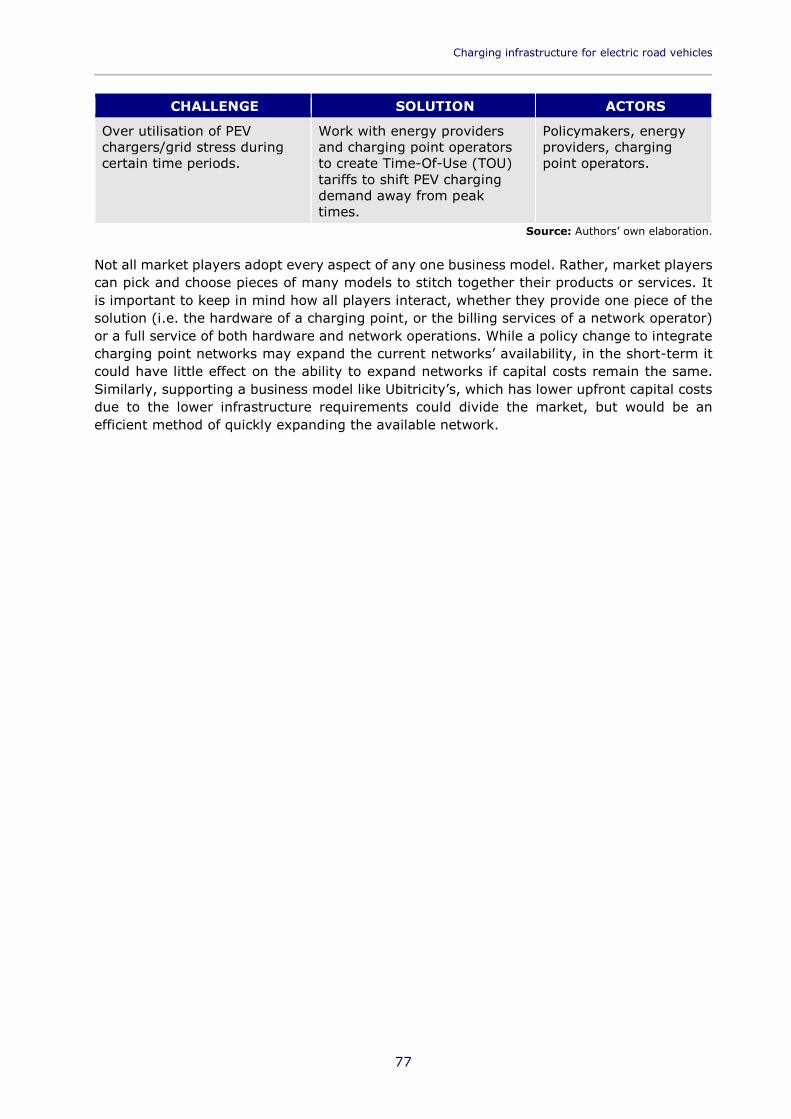
Charging infrastructure for electric road vehicles _________________________________________________________________________
77
CHALLENGE SOLUTION ACTORS
Over utilisation of PEV chargers/grid stress during certain time periods.
Work with energy providers and charging point operators to create Time-Of-Use (TOU) tariffs to shift PEV charging demand away from peak times.
Policymakers, energy providers, charging point operators.
Source: Authors’ own elaboration. Not all market players adopt every aspect of any one business model. Rather, market players can pick and choose pieces of many models to stitch together their products or services. It is important to keep in mind how all players interact, whether they provide one piece of the solution (i.e. the hardware of a charging point, or the billing services of a network operator) or a full service of both hardware and network operations. While a policy change to integrate charging point networks may expand the current networks’ availability, in the short-term it could have little effect on the ability to expand networks if capital costs remain the same. Similarly, supporting a business model like Ubitricity’s, which has lower upfront capital costs due to the lower infrastructure requirements could divide the market, but would be an efficient method of quickly expanding the available network.

Policy Department for Structural and Cohesion Policies _________________________________________________________________
78
Charging infrastructure for electric road vehicles _________________________________________________________________________
79
5 CONCLUSIONS AND POLICY RECOMMENDATIONS
KEY FINDINGS
• A clear commitment to a long-term strategy and a coordinating agency at European Union (EU) level, including the creation of an EU-wide database, will propel (Plug-in Electric Vehicle) (PEV) adoption forward.
• In the regulatory dimension, further detailed definitions for minimum standards for future charging stations should focus on smart charging technology and data exchange requirements.
• Financial support for public charging infrastructure should be continued until business models become more profitable, and funding should be coupled to steering mechanisms for the locations of charging stations.
• Further research is needed on aspects including ideal site distribution, ultra-fast charging, PEV range extension, and battery development.
• Collaborative processes for the definition of regulation as well as awareness raising among end users for existing charging infrastructure will be key.
This chapter summarises the main conclusions and, on the basis of this, evaluates the appropriateness of current support for PEV charging infrastructure. It also provides recommendations on required actions and suggestions to facilitate the deployment of PEV charging in the EU.
5.1 Summary of findings To date, the build-up of charging infrastructure is progressing at varying rates relative to PEV sales in a given country, and has largely been funded by government efforts. Range anxiety continues to be an issue for potential PEV drivers as they want chargers to be as visible as petrol stations appear today. Depending on where the potential driver is located, range anxiety could either be due to an actual lack of infrastructure or a lack of awareness thereof. Funding programmes exist largely at national level and are complemented by further funding programmes from the EU. EU Member States are currently heterogeneous with regard to the extent of their respective PEV charging network. The information on existing funding programmes is imperfect, as there is no centralised information platform at EU level for providers of PEV charging services. In terms of the technical hardware, the standards for PEV charging modes and types in place in the EU are sufficient to guarantee uniform quality, safety of charging and investor security for market actors. This is not the case so far for Electric Bicycles (e-bikes) and Pedal Electric Cycles (pedelecs) where the unchecked import of battery types without battery management systems presents a safety hazard.
Policy Department for Structural and Cohesion Policies _________________________________________________________________
80
The harmonisation of payment systems and protocols (software), is further behind than for the technical hardware. Despite progress in parts of the industry uniting around Hubject, the industry joint venture that aims at harmonising roaming, and the widely used communication protocol Open Charge Point Protocol (OCPP), the high number of payment systems may be confusing to customers and negatively impacts convenience. Subscription services lock-in customers, deterring them from using other networks, and unsubscribed drivers may be deterred by paying higher rates or subscription requirements and instead opt to charge at home. The communication between the charging station and the vehicle works despite a high number of different protocols, but payment systems are not always compatible with different protocols. The diversity of payment systems is mirrored in the large range of consumer prices for charging, which varies hugely from region to region. There is no agreement yet on how future communication between the charging station and the grid will be managed. Market actors appear divided on the question of to what extent the diversity of protocols is an issue. To date, there are no minimal requirements for future functions of charging stations, such as the ability to support smart charging. The authors’ analysis shows that the density of charging infrastructure generally correlates positively with PEV adoption. However, the influence of charging infrastructure as a variable differs depending on the national context. Furthermore, there is a range of other factors that are proven or suspected to be correlated with PEV uptake, such as model availability, financial incentives, urban density, etc. At this point of early market development, it is unclear how these factors interact and influence PEV adoption. Despite the uncertainty about the extent of its influence, it can be concluded that charging infrastructure is necessary, but not sufficient for PEV adoption in any given market. In this early stage of market development for PEVs, most front-runner countries, with the exception of the United States of America (USA), have applied a demand-oriented approach for their charging infrastructure rollout. To increase market penetration, a shift towards a coverage-oriented approach is needed. This will have a significant, positive impact on range anxiety at consumer level by providing a safety net for emergency situations. However, if the number of charging points is too high compared to the number of PEVs, there will not be a good business case for charging point operators. A successful coverage-oriented approach in the EU requires a central register for publicly accessible charging stations, to allow for a coordinated approach to identify gaps in geographical coverage. To date, there is no universal database for EU charging stations. While individual business models have been developed that show charging station locations, they are often faulty or incomplete. This is due to the absence of a comprehensive database. There are some local and national initiatives, but they will neither be able to provide the type and amount of data needed for the build-up of reliable applications, nor be able to inform prospective market players about the likely utilisation and the revenue depending on the location with sufficient detail. Such a publicly available database would be beneficial to policymakers, the private sector, and the end users. The lack of requirements for data sharing on key indicators can make measuring policy driven impacts challenging. The ratio of PEVs per public charging point combined with a street map showing areas not covered with public charging stations could be used by policymakers to determine the quantity of public charging stations per region.
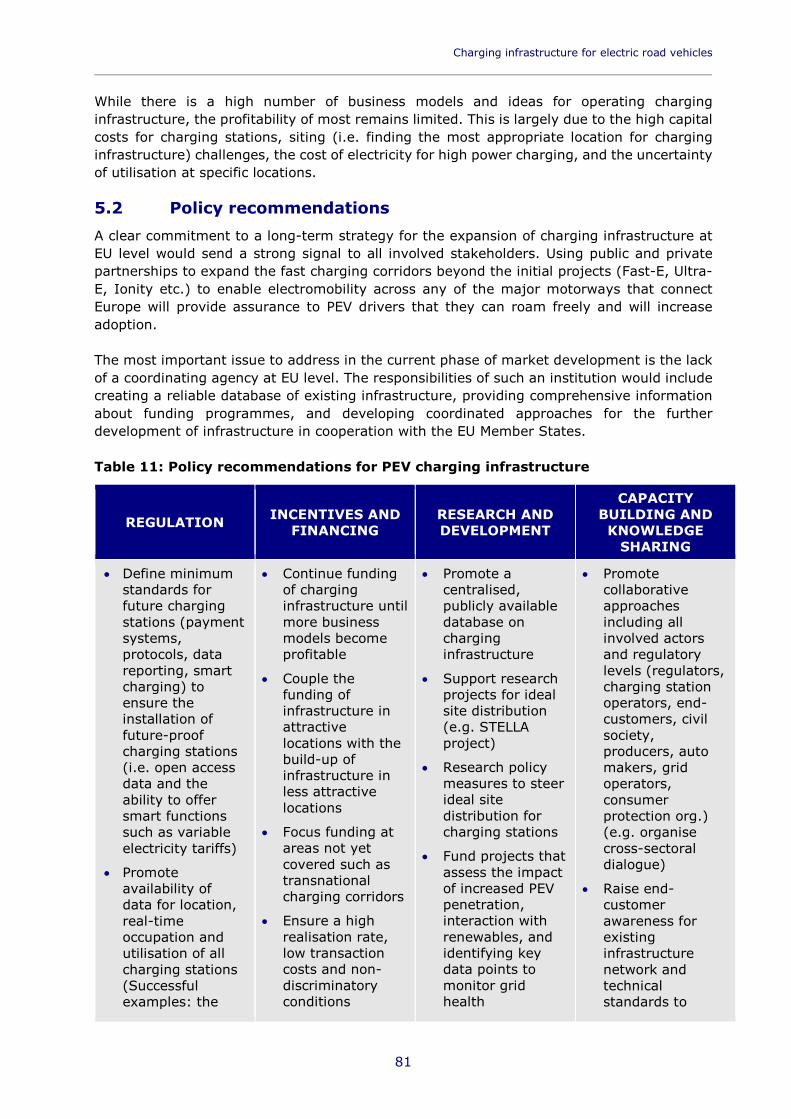
Charging infrastructure for electric road vehicles _________________________________________________________________________
81
While there is a high number of business models and ideas for operating charging infrastructure, the profitability of most remains limited. This is largely due to the high capital costs for charging stations, siting (i.e. finding the most appropriate location for charging infrastructure) challenges, the cost of electricity for high power charging, and the uncertainty of utilisation at specific locations.
5.2 Policy recommendations A clear commitment to a long-term strategy for the expansion of charging infrastructure at EU level would send a strong signal to all involved stakeholders. Using public and private partnerships to expand the fast charging corridors beyond the initial projects (Fast-E, Ultra-E, Ionity etc.) to enable electromobility across any of the major motorways that connect Europe will provide assurance to PEV drivers that they can roam freely and will increase adoption. The most important issue to address in the current phase of market development is the lack of a coordinating agency at EU level. The responsibilities of such an institution would include creating a reliable database of existing infrastructure, providing comprehensive information about funding programmes, and developing coordinated approaches for the further development of infrastructure in cooperation with the EU Member States. Table 11: Policy recommendations for PEV charging infrastructure
REGULATION INCENTIVES AND FINANCING
RESEARCH AND DEVELOPMENT
CAPACITY BUILDING AND KNOWLEDGE
SHARING
• Define minimum standards for future charging stations (payment systems, protocols, data reporting, smart charging) to ensure the installation of future-proof charging stations (i.e. open access data and the ability to offer smart functions such as variable electricity tariffs)
• Promote availability of data for location, real-time occupation and utilisation of all charging stations (Successful examples: the
• Continue funding of charging infrastructure until more business models become profitable
• Couple the funding of infrastructure in attractive locations with the build-up of infrastructure in less attractive locations
• Focus funding at areas not yet covered such as transnational charging corridors
• Ensure a high realisation rate, low transaction costs and non-discriminatory conditions
• Promote a centralised, publicly available database on charging infrastructure
• Support research projects for ideal site distribution (e.g. STELLA project)
• Research policy measures to steer ideal site distribution for charging stations
• Fund projects that assess the impact of increased PEV penetration, interaction with renewables, and identifying key data points to monitor grid health
• Promote collaborative approaches including all involved actors and regulatory levels (regulators, charging station operators, end-customers, civil society, producers, auto makers, grid operators, consumer protection org.) (e.g. organise cross-sectoral dialogue)
• Raise end-customer awareness for existing infrastructure network and technical standards to

Policy Department for Structural and Cohesion Policies _________________________________________________________________
82
REGULATION INCENTIVES AND FINANCING
RESEARCH AND DEVELOPMENT
CAPACITY BUILDING AND KNOWLEDGE
SHARING
UK’s Office for Low Emission Vehicles (OLEV) programme, Norway’s publicly owned database)
• Continue to remove regulatory barriers, e.g. in tenancy law and right of abode (e.g. EU Directive requiring a charging point in every new or refurbished home beginning in 2019)
• Promote installation of charging infrastructure in publicly accessible spaces (e.g. commercial parking garages, train stations, airports, etc.)
• Define and monitor e-bike and pedelec safety standards
• Create incentives for workplace charging and charging solutions for homes without garages
• Fund research programmes on ultra-fast charging, range extension, battery development, etc.
• Fund research into ways to reduce the cost of fast charging through rate structure changes and use of storage
• Fund vehicle-to-grid/sector coupling (Trans-European Networks for Energy (TEN-E) and Trans-European Transport Network (TEN-T) cooperation)
• Promote cooperation between existing working group activities, pilot projects, and policy processes on smart charging practices and stationary battery storage
address customer concerns (e.g. range anxiety) to facilitate behavioural change
• Develop an information platform that provides data on technical standards and funding guidelines in the EU for project developers (Successful example: the UK’s OLEV programme)
Source: Authors’ own elaboration (2018).
Charging infrastructure for electric road vehicles _________________________________________________________________________
83
REFERENCES
• ABB Group (2017), ABB powers 450kW fast charging for electric buses in Gothenburg, URL: http://www.abb.com/cawp/seitp202/be24f0a9ca998b59c12581e00031630b.aspx.
• Agence de l'Environnement et de la Maîtrise de l'Énergie (ADEME) (Eng. French Environment and Energy Management Agency) (2016), Dispositif de déploiement des Infrastructures de recharge pour véhicules électriques, URL: https://appelsaprojets.ademe.fr/aap/IRVE 20162016-92.
• Allgemeiner Deutscher Automobil-Club (ADAC) (Eng. General German Automobile Club) (2017), Crash Test Elektroauto, URL: https://www.adac.de/infotestrat/tests/crash-test/elektroauto/default.aspx.
• Algemene Nederlandse Wielrijdersbond (ANWB) (Eng. The Royal Dutch Touring Club) (2017), Bijtelling - Betalen voor het privégebruik van een auto van de zaak, URL: https://www.anwb.nl/auto/autobelastingen/bijtelling.
• Autoexpress (2017), Budget 2017: What it means for the motorist, URL: http://www.autoexpress.co.uk/car-news/consumer-news/98845/budget-2017-what-it-means-for-the-motorist.
• Bakker S., Leguijt P., and van Lente H. (2015), Niche accumulation and standardization–the case of electric vehicle recharging plugs, Journal of Cleaner Production.
• Bike Europe (2018), Underrated E-Bike Battery Fire Hazards Call for Attention on Safe Storage, URL: http://www.bike-eu.com/home/nieuws/2018/02/underrated-e-bike-battery-fire-hazards-call-for-attention-on-safe-storage-10132804.
• Bloomberg News (2017), China gives Automakers More Time in World`s Biggest EV (Electric Vehicle) Plan, URL: https://www.bloomberg.com/news/articles/2017-09-28/china-to-start-new-energy-vehicle-production-quota-from-2019.
• Bundesamt für Wirtschaft und Ausfuhrkontrolle (BAFA) (Eng. German Federal Office for Economic Affaris and Export Control) (2017), Elektromobilität (Umweltbonus).
• Bundesministerium für Nachhaltigkeit und Tourismus (Eng. Austrian Federal Ministry for Sustainability and Tourism) (2017), Aktionspaket zur Förderung der E-Mobilität, URL: https://www.klimaaktiv.at/mobilitaet/elektromobilitaet/foerderaktion_epkw2.html.
• Bundesministerium für Verkehr und digitale Infrastruktur (BMVI) (Eng. German Federal Ministry of Transport and Digital Infrastructure) (2015), Förderrichtlinie Elektromobilität vor Ort.
• Bundesministerium für Verkehr und digitale Infrastruktur (BMVI) (Eng. German Federal Ministry of Transport and Digital Infrastructure) (2016), Nationaler Strategierahmen über den Aufbau der Infrastruktur für alternative Kraftstoffe.

Policy Department for Structural and Cohesion Policies _________________________________________________________________
84
• Bundesministerium für Verkehr und digitale Infrastruktur (BMVI) (Eng. German Federal Ministry of Transport and Digital Infrastructure) (2017), Förderrichtlinie Ladeinfrastruktur für Elektrofahrzeuge in Deutschland.
• Bundesverband der Energie- und Wasserwirtschaft (BDEW) (Eng. German Federal Association of the Energy and Water Industries) (2017a), Erhebung Ladeinfrastruktur, URL: https://www.bdew.de/media/documents/PI_20171024_Anlage_Grafiken-Erhebung-Ladeinfrastruktur.pdf.
• Bundesverband der Energie- und Wasserwirtschaft (BDEW) (Eng. German Federal Association of the Energy and Water Industries ) (2017b), Schon 10.700 Ladepunkte in Deutschland, URL: https://www.bdew.de/presse/presseinformationen/schon-10700-ladepunkte-deutschland/.
• Bundesverband Elektromobilität Österreich (Eng. Austrian Federal Organisation on Electromobility) (2017), Das grüne E-Kennzeichen, URL: http://www.beoe.at/e-kennzeichen/.
• Business Insider (2009), The Cost of a Better Place Battery Swapping Station: $ 500,000, URL: http://www.businessinsider.com/the-cost-of-a-better-place-battery-swapping-station-500000-2009-4.
• Buzzriders (2017), Elektrofahrzeuge als Dienstwagen: steuern – 1%-regel und Fahrtenbuch, URL: http://www.buzzriders.com/2017/04/elektrofahrzeuge-als-dienstwagen-steuern-und-1-regel/.
• California Energy Commission and National Renewable Energy Laboratory (2017), EV Infrastructure Projection Tool (EVI-Pro), URL: https://maps.nrel.gov/cec-evse/.
• CHAdeMO (2017), CHAdeMO celebrates 13500 charge points, URL: https://www.chademo.com/chademo-celebrates-13500-charge-points/.
• Chargepoint.com. (n.d.), Allen Ladeanforderungen gerecht werden, URL: https://www.chargepoint.com/.
• China Daily (2017), Tougher rules for electric vehicle subsidies, URL: http://www.chinadaily.com.cn/business/motoring/2017-01/03/content_27842725.htm.
• China Daily (2018), China New Energy Vehicles public charging points increased 51 pct in 2017 – Xinhua, URL: https://www.reuters.com/article/china-autos-charging/china-nev-public-charging-points-increased-51-pct-in-2017-xinhua-idUSL4N1PG077.
• China Electricity Council (2016), Interpretation der Unterschiede in der Verteilung von öffentlichen Ladeeinrichtungen, URL: http://www.cec.org.cn/xinwenpingxi/2016-04-19/151780.html.
• Clippercreek (n.d.), EVSE Rebates and Tax Credits, by State, URL: https://www.clippercreek.com/evse-rebates-and-tax-credits-by-state/.
Charging infrastructure for electric road vehicles _________________________________________________________________________
85
• Cooper A. and Schefter K. (2017), Plug-in Electric Vehicle Sales Forecast Through 2025 and the Charging Infrastructure Required, URL: www.edisonfoundation.net/iei/publications/Documents/IEI_EEI%20PEV%20Sales%20and%20Infrastructure%20thru%202025_FINAL%20%282%29.pdf.
• Corri-door (2018), URL: http://www.corri-door.com/.
• Dekra (2012), Die Sicherheit von Elektroautos, URL: http://www.dekra-elektromobilitaet.de/de/sicherheit.
• Dimitropoulos A., Rietveld P. and van Ommeren J. N. (2011), Consumer valuation of driving range: A meta-analysis.
• Directive 2014/94/EU on the deployment of alternative fuels infrastructure (2014).
• Ecofys (2017), Toekomstverkenning elektrisch vervoer. URL: https://www.ecofys.com/nl/publications/toekomstverkenning-elektrisch-vervoer/.
• ElaadNL (2016a), About Us, URL: www.elaad.nl/organisatie/over-ons/about-us/.
• ElaadNL (2016b), EV related protocol study, URL: http://www.elaad.nl/uploads/files/EV_related_protocol_overview_v1.0.pdf.
• Electrek (2016), Electric bus maker Proterra follows Tesla’s lead and open-sources its Fast-Charging patents, URL: https://electrek.co/2016/06/28/electric-bus-maker-proterra-tesla-lead-open-sources-fast-charging-patents/.
• Electrek (2017a), Tesla is working on a new mobile battery-swap technology to deploy out of a trailer, URL: https://electrek.co/2017/09/15/tesla-new-battery-swap-technology-to-deploy-trailer/.
• Electrek (2017b), The Dutch government confirms plan to ban new petrol and diesel cars by 2030, URL: https://electrek.co/2017/10/10/netherlands-dutch-ban-petrol-diesel-cars-2030-electric-cars/.
• Electrify America (2018), Our Plan, URL: https://www.electrifyamerica.com/our-plan.
• Eltis (2015), Croatian government offer subsidies for electric vehicles, URL: http://www.eltis.org/discover/news/croatian-government-offers-subsidies-electric-vehicles.
• European Alternative Fuels Observatory (EAFO) (2018), European Union, URL: http://www.eafo.eu/eu.
• European Automobile Manufacturers Association (ACEA) (2017a), Overview of CO2-based motor vehicle taxes in the EU, URL: http://www.acea.be/publications/article/overview-of-co2-based-motor-vehicle-taxes-in-the-eu.
• European Automobile Manufacturers Association (ACEA) (2017b), Overview on tax incentives for electric vehicles in the EU, URL: http://www.acea.be/uploads/publications/EV_incentives_overview_2017.pdf.
Policy Department for Structural and Cohesion Policies _________________________________________________________________
86
• European Commission (2015), EU/US – new lab for interoperability of e-vehicles and smart grids. URL: https://ec.europa.eu/jrc/en/news/new-european-interoperability-centre-electric-vehicles-and-smart-grids-opened.
• European Commission (2016a), Optimal allocation of electric vehicle charging infrastructure in cities and regions, URL: http://publications.jrc.ec.europa.eu/repository/bitstream/JRC101040/allocatechargingpoints_sciencepolreport_eurreport_online.pdf.
• European Commission (2016b), Proposal for a Directive of the European Parliament and of the Council amending Directive 2010/31/EU on the energy performance of buildings, COM/2016/0765 final, Brussels.
• European Commission (2017a), Green Vehicles, URL: https://ec.europa.eu/inea/en/horizon-2020/green-vehicles.
• European Commission (2017b), Statistical Pocketbook 2017: EU Transport in figures.
• European Commission (n.d.), Transeuropean European Transport Network TENtec, URL: http://ec.europa.eu/transport/infrastructure/tentec/tentec-portal/site/en/innovation.html.
• European Environmental Agency (2016), Electric vehicles in Europe, URL: https://www.eea.europa.eu/publications/electric-vehicles-in-europe.
• Fastned.nl. (n.d.), Choose the price plan that suits you, URL: https://fastned.nl/en/choose-your-priceplan/.
• Fitzgerald G. and Nelder C. (2017), EVgo fleet and tariff analysis, Rocky Mountain Institute, Basalt, Colorado, URL: https://www.rmi.org/wp-content/uploads/2017/04/eLab_EVgo_Fleet_and_Tariff_Analysis_2017.pdf.
• Funke S., Gnann T., and Plötz P. (2015), Addressing the different needs for charging infrastructure: An analysis of some criteria for charging infrastructure set-up, URL: https://www.isi.fraunhofer.de/content/dam/isi/dokumente/cce/2015/Funke2015_Adressing-the-different-needs-for-charging-infrastructure.pdf.
• Green Car Reports (2017), Nio ES8 electric SUV to go on sale in China this month; half the price of Tesla Model X, URL: https://www.greencarreports.com/news/1114409_nio-es8-electric-suv-to-go-on-sale-in-china-this-month-half-the-price-of-tesla-model-x.
• Hall S., Shepherd S., and Wadud Z. (2017), The Innovation Interface: Business model innovation for electric vehicle futures, Report, University of Leeds, Leeds, UK, URL: http://homepages.see.leeds.ac.uk/~earshal/Files/11167_SEE_electrical_vehicles_report_WEB.pdf.
• Hamelink, M. (n.d.), Dutch vision charging infrastructure, Ministry of Economic Affairs, URL: http://amsterdamv2gconference.eu/images/program/NL%20Min%20Econ%20Affairs%20-%20V2G%20Conference17.pdf.
Charging infrastructure for electric road vehicles _________________________________________________________________________
87
• Harrison G. and Thiel C. (2017), An exploratory policy analysis of electric vehicle sales competition and sensitivity to infrastructure in Europe, Technological Forecasting and Social Change.
• Hubject (2018) Die eRoaming-Plattform für kundenfreundliches Laden von Elektrofahrzeugen. URL: https://www.hubject.com/.
• Inside EVs (2016), Proterra opens electric bus fast charging technology, URL: https://insideevs.com/proterra-opens-electric-bus-fast-charging-technology.
• International Council on Clean Transportation (ICCT) (2017a), White Paper on: Emerging best practices for electric vehicle charging infrastructure, URL: https://www.theicct.org/sites/default/files/publications/EV-charging-best-practices_ICCT-white-paper_04102017_vF.pdf.
• International Council on Clean Transportation (ICCT) (2017b), White Paper on: Expanding the Electric Vehicle Market in U.S. Cities. International Council on Clean Transportation, URL: https://www.theicct.org/sites/default/files/publications/US-Cities-EVs_ICCT-White-Paper_25072017_vF.pdf.
• International Energy Agency (IEA) (2017), Global EV Outlook 2017, Two Million and Counting, URL: https://www.iea.org/publications/freepublications/publication/GlobalEVOutlook2017.pdf.
• Ionity (2017), Fast charging station network starts to take shape: Site partners for 18 European countries secured, Munich, URL: http://www.ionity.eu/assets/20171127-ionity-en.pdf.
• Karlsruhe Institue of Technology (2018), The CROME Research Project - CROss-border Mobility for EVs, URL: http://crome.forschung.kit.edu/english/.
• Latinopoulis C., Sivakumar A., and Polak J. (2017), Modeling electric vehicle charging behavior: What is the relationship between charging location, driving distance and range anxiety?
• Lauer J. and Dickhaut W. (2016), Shenzhen’s new energy vehicles and charging infrastructure – policies, instruments and development, SBE16, Hamburg, Germany.
• Li S. L., Xing J., and Zhou Y. (2016), The market for electric vehicles: indirect network effects and policy design. Journal of the association of environmental and resource economists.
• Ministère de la Transition écologique et solidaire (Eng. Ministry for an Ecological and Solidary Transition) (2016), Bonus-malus écologique, prime à la conversion et bonus vélo, URL: https://www.ecologique-solidaire.gouv.fr/bonus-malus-ecologique-et-prime-conversion#.
• Money Saver Spain (2017), Grants for Cars: Electric and Alternative Fuels, URL: http://moneysaverspain.com/grants-electric-cars-spain/.
Policy Department for Structural and Cohesion Policies _________________________________________________________________
88
• Morland J. (2017), Comparing the top 5 European countries for electric vehicle Adoption, Fleetcarma, URL: https://www.fleetcarma.com/european-countries-electric-vehicle-adoption/.
• National Energy Administration (2017), China Electric Vehicle Charging Infrastructure Development, URL: http://www.nea.gov.cn/136376732_14978397401671n.pdf.
• Navigant Research (2013), Electric Vehicle Charging Equipment.
• Navigant Research (2017a), Electric Vehicle Charging Equipment.
• Navigant Research (2017b), DC Charging Networks in the United States.
• Navigant Research (2017c), DC Fast Charging Equipment for EVs.
• Navigant Research (2017d), Market Data: Electric Drive Buses.
• Navigant Research (2017e), Market Data: Electric Drive Trucks.
• Navigant Research (2017f), China Smart Cities Policy Research.
• Navigant Research (2017g), Market Data: Electric Vehicle Market Forecasts.
• Navigant Research (2018) Wireless EV Charging. (upcoming).
• Nederland Elekrisch (2018), home, URL: https://nederlandelektrisch.nl/.
• The Netherlands Enterprise Agency (2017), Electric transport in the Netherlands – 2016 highlights, URL: https://www.rvo.nl/sites/default/files/2017/04/Highlights-2016-Electric-transport-in-the-Netherlands-RVO.nl_.pdf.
• Netherlands Ministries of Economic Affairs, Infrastructure and Environment, and Interior (2016), Electric Transport Green Deal 2016–2020, URL: www.greendeals.nl/wp-content/uploads/2016/04/Green-Deal-Electric-Transport-2016-2020.pdf.
• Next Big Future (2017), China could launch network of battery swapping vans, URL: https://www.nextbigfuture.com/2017/12/china-could-launch-network-of-battery-swapping-vans.html.
• Nigro N. and Frades M. (2015), Business models for financially sustainable ev charging Networks, Center for Climate and Energy Solutions. Arlington, VA.
• Nobil (2012), The Norwegian Charging Station Database for Electromobility. Norwegian Electric Vehicle Association, URL: http://www.mdpi.com/2032-6653/5/3/702.
• Nobil (2018), home, URL: http://info.nobil.no/index.php/english.
• Norsk elbilforening (2018), Norwegian EV policy, URL: https://elbil.no/english/norwegian-ev-policy/.
Charging infrastructure for electric road vehicles _________________________________________________________________________
89
• Norwegian Ministry of Climate and Environment (2017), Norway's electric vehicle policies, URL: http://www.mhsr.sk/uploads/files/ocrMJ55J.pdf.
• Norwegian Tax Administration (2018b), Car rates - company cars, URL: http://www.skatteetaten.no/en/Rates/Car-rates---company-cars/.
• Norwegian Tax Administration (2018a), Pay annual motor vehicle tax, URL: http://www.skatteetaten.no/en/person/cars-and-other-vehicles/annual-motor-vehicle-tax/pay/.
• Office for Low Emission Vehicles (2016a), Grant schemes for electric vehicle charging infrastructure.
• Office for Low Emission Vehicles (2016b), Plug-in car grant.
• Office for Low Emission Vehicles (2017), Tax benefits for ultra low emission vehicles, URL: https://www.gov.uk/government/uploads/system/uploads/attachment_data/file/620416/factsheet-tax-implications-refresh.pdf.
• Office of Energy Efficiency & Renewable Energy (n.d.), Electric Vehicles: Tax Credits and Other Incentives, URL: https://energy.gov/eere/electricvehicles/electric-vehicles-tax-credits-and-other-incentives.
• Pluglesspower.com. (n.d.), Updated 2017 Incentives for Electric Vehicles and EVSE (for Tesla and More), URL: https://www.pluglesspower.com/learn/updated-2017-incentives-electric-vehicles-evse-state-federal-tax-credits-grants-loans-rebates/.
• Portail du Développement durable et des Infrastructures (2017), Tax reform measures for company cars.
• Regulation (EU) (2013) No 1315/2013 of the European Parliament and of the Council on Union guidelines for the development of the trans-European transport network.
• Romania liberia (2018), RABLA Plus: Cum îți iei mașină electrică nouă cu mai puțin de 11.000 euro, URL: http://m.romanialibera.ro/stiinta-tehnologie/auto/rabla-plus--cum-iti-iei-masina-electrica-noua-cu-mai-putin-de-11-000-euro-451000.
• Society of Automotive Engineers International (2017), J2954 Recommended Practice for Wireless Power Transfer for Electric Vehicles, URL: https://www.sae.org/standards/content/j2954_201711/.
• Schaufenster Elektromobilität (2017), Sicherheit von Elektrofahrzeugen, URL: http://schaufenster-elektromobilitaet.org/media/media/documents/dokumente_der_begleit__und_wirkungsforschung/Ergebnispapier_37_Sicherheit_von_Elektrofahrzeugen.pdf.
• Shareandcharge (n.d.), no title, URL: https://shareandcharge.com/en/.
• Sierzchula W. et al (2014, May), The influence of financial incentives and other socio-economic factors on electric vehicle adoption, Energy Policy.
Policy Department for Structural and Cohesion Policies _________________________________________________________________
90
• State of Colorado (2018), Colorado Electric Vehicle Plan, URL: https://www.colorado.gov/governor/sites/default/files/colorado_electric_vehicle_plan_-_january_2018.pdf.
• Stuttgarter Nachrichten (2017) Vereinigung rät vom Elektroauto-Kauf ab. URL: https://www.stuttgarter-nachrichten.de/inhalt.engpass-in-oslo-vereinigung-raet-vom-elektroauto-kauf-ab.fe8b8b41-6f41-4b15-9fae-45fb1d9ae874.html.
• Telegraph (2017), Volkswagen e-Golf review - is the battery Golf our current favourite? URL: http://www.telegraph.co.uk/cars/volkswagen/volkswagen-e-golf-review/.
• Tesla (n.d.), Vehicle Incentives, URL: https://www.tesla.com/support/incentives.
• The City of Oslo (2018), The Electric Vehicle Capital of the World, URL: https://www.oslo.kommune.no/english/politics-and-administration/green-oslo/best-practices/the-electric-vehicle-capital-of-the-world/#gre.
• Ubitricity (n.d.), no title, URL: https://www.ubitricity.com/en/.
• Union of Concerned Scientists (2016), What is ZEV?, URL: https://www.ucsusa.org/clean-vehicles/california-and-western-states/what-is-zev#.WnQlG6inHIV.
• US Department of Energy (2016) Workplace Charging Challenge. Progress Update 2016: A New Sustainable Commute. URL: https://www.afdc.energy.gov/uploads/publication/wpc_2016_progress_report.pdf.
• US Department of Energy (2017) Alternative Fuels Data Center. URL: https://www.afdc.energy.gov/.
• US Department of Energy Alternative Fuels Data Center (2018), Regional Electric Vehicle West Plan, URL: https://www.afdc.energy.gov/laws/11874.
• US Department of Transportation Federal Highway Administration (2018), Alternative Fuel Corridors, URL: https://hepgis.fhwa.dot.gov/fhwagis/ViewMap.aspx?map=Highway+Information%7CElectric+Vehicle+%28EV%29.
• US Federal Highway Administration (2017), Alternative Fuel Corridors. URL: https://www.fhwa.dot.gov/environment/alternative_fuel_corridors/.
• van der Steen M. et al. (2015), EV policy compared: An international comparison of governments’ policy strategy towards e-mobility. In E-Mobility in Europe, Springer, Cham.
• Vinor, Jernbaneverket, Kystverket Statens Segvesen (2016), National Transport Plan 2018-2029, URL: https://www.ntp.dep.no/English/_attachment/1525049/binary/1132766?_ts=1571e02a3c0.

Charging infrastructure for electric road vehicles _________________________________________________________________________
91
• Weiller C. et al. (2015), Competing and co-existing business models for electric vehicles: Lessons from international case studies, International Journal of Automotive Technology and Management.
• Wood E., Rames C., Muratori M., Raghavan S., Melaina M. (2017), National Plug-In Electric Vehicle Infrastructure Analysis, URL: https://energy.gov/sites/prod/files/2017/09/f36/NationalPlugInElectricVehicleInfrastructureAnalysis_Sept2017.pdf.
• World Bank (2017) Population, total. URL: https://data.worldbank.org/indicator/sp.pop.totl.
• Xin, Z. (2017, January 26), State Grid Scales Up Charging. China Daily, URL: www.chinadaily.com.cn/business/2017-01/26/content_28058742.htm.
• Yang, J., Liu, Y., Qin, P., and Liu, A. A. (2014), A review of Beijing׳ s vehicle registration lottery: Short-term effects on vehicle growth and fuel consumption. Environment for Development, 75.
• Yang, Z. and Bandivadekar, A. (2017), Global Update Light-duty Vehicle Greenhouse Gas and Fuel Economy Standards, URL: https://www.theicct.org/publications/2017-global-update-LDV-GHG-FE-standards.

Policy Department for Structural and Cohesion Policies _________________________________________________________________
92
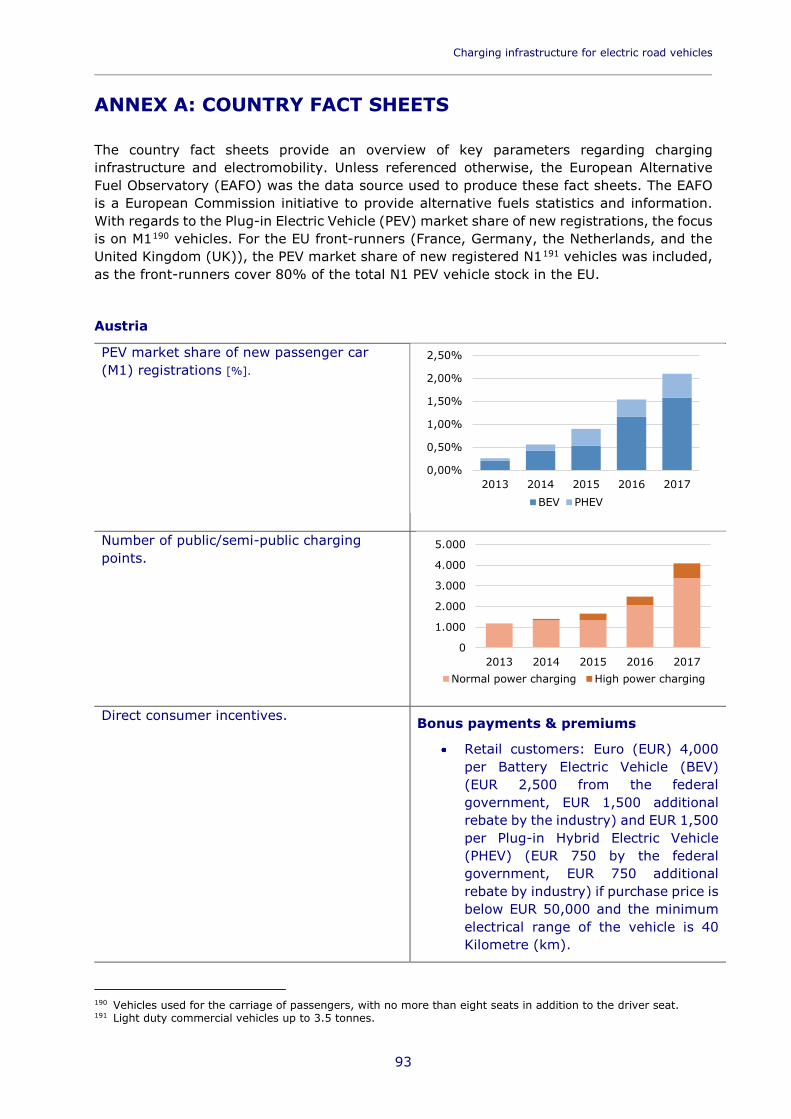
Charging infrastructure for electric road vehicles _________________________________________________________________________
93
ANNEX A: COUNTRY FACT SHEETS The country fact sheets provide an overview of key parameters regarding charging infrastructure and electromobility. Unless referenced otherwise, the European Alternative Fuel Observatory (EAFO) was the data source used to produce these fact sheets. The EAFO is a European Commission initiative to provide alternative fuels statistics and information. With regards to the Plug-in Electric Vehicle (PEV) market share of new registrations, the focus is on M1190 vehicles. For the EU front-runners (France, Germany, the Netherlands, and the United Kingdom (UK)), the PEV market share of new registered N1191 vehicles was included, as the front-runners cover 80% of the total N1 PEV vehicle stock in the EU.
Austria
PEV market share of new passenger car (M1) registrations [%].
Number of public/semi-public charging points.
Direct consumer incentives. Bonus payments & premiums
Retail customers: Euro (EUR) 4,000 per Battery Electric Vehicle (BEV) (EUR 2,500 from the federal government, EUR 1,500 additional rebate by the industry) and EUR 1,500 per Plug-in Hybrid Electric Vehicle (PHEV) (EUR 750 by the federal government, EUR 750 additional rebate by industry) if purchase price is below EUR 50,000 and the minimum electrical range of the vehicle is 40 Kilometre (km).
190 Vehicles used for the carriage of passengers, with no more than eight seats in addition to the driver seat. 191 Light duty commercial vehicles up to 3.5 tonnes.
0,00%
0,50%
1,00%
1,50%
2,00%
2,50%
2013 2014 2015 2016 2017BEV PHEV
0
1.000
2.000
3.000
4.000
5.000
2013 2014 2015 2016 2017Normal power charging High power charging
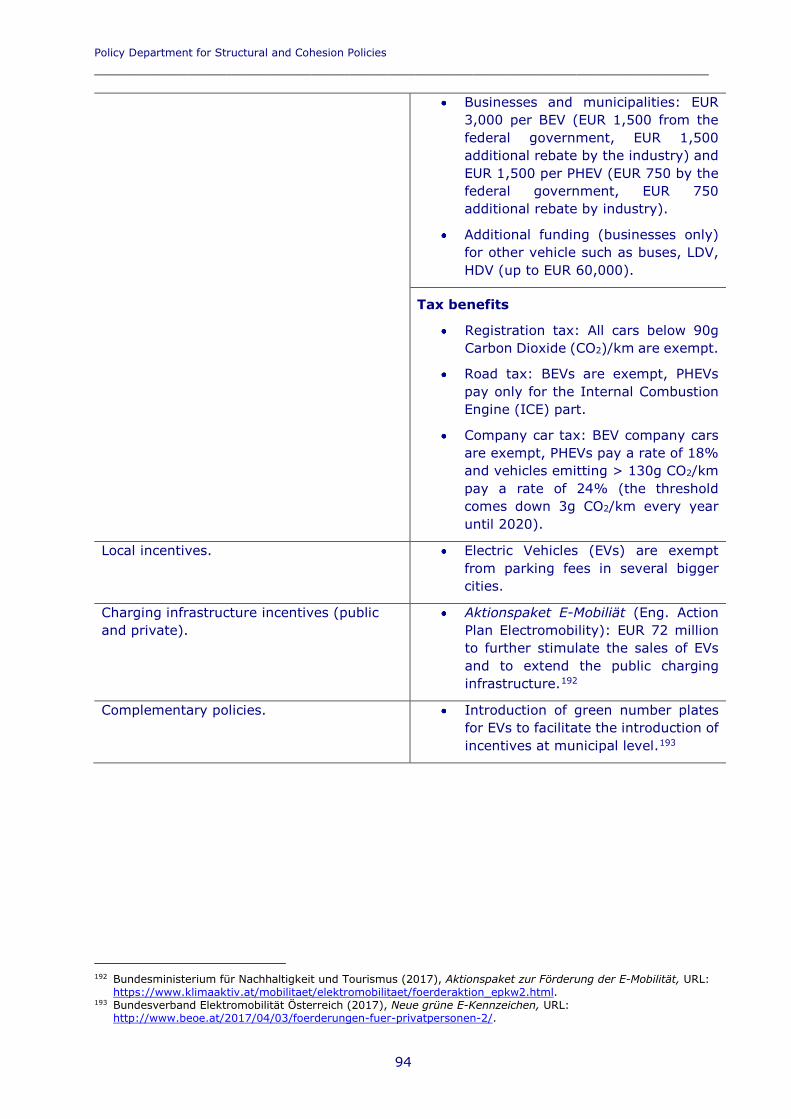
Policy Department for Structural and Cohesion Policies _________________________________________________________________
94
Businesses and municipalities: EUR 3,000 per BEV (EUR 1,500 from the federal government, EUR 1,500 additional rebate by the industry) and EUR 1,500 per PHEV (EUR 750 by the federal government, EUR 750 additional rebate by industry).
Additional funding (businesses only) for other vehicle such as buses, LDV, HDV (up to EUR 60,000).
Tax benefits
Registration tax: All cars below 90g Carbon Dioxide (CO2)/km are exempt.
Road tax: BEVs are exempt, PHEVs pay only for the Internal Combustion Engine (ICE) part.
Company car tax: BEV company cars are exempt, PHEVs pay a rate of 18% and vehicles emitting > 130g CO2/km pay a rate of 24% (the threshold comes down 3g CO2/km every year until 2020).
Local incentives. Electric Vehicles (EVs) are exempt from parking fees in several bigger cities.
Charging infrastructure incentives (public and private).
Aktionspaket E-Mobiliät (Eng. Action Plan Electromobility): EUR 72 million to further stimulate the sales of EVs and to extend the public charging infrastructure.192
Complementary policies. Introduction of green number plates for EVs to facilitate the introduction of incentives at municipal level.193
192 Bundesministerium für Nachhaltigkeit und Tourismus (2017), Aktionspaket zur Förderung der E-Mobilität, URL:
https://www.klimaaktiv.at/mobilitaet/elektromobilitaet/foerderaktion_epkw2.html. 193 Bundesverband Elektromobilität Österreich (2017), Neue grüne E-Kennzeichen, URL:
http://www.beoe.at/2017/04/03/foerderungen-fuer-privatpersonen-2/.
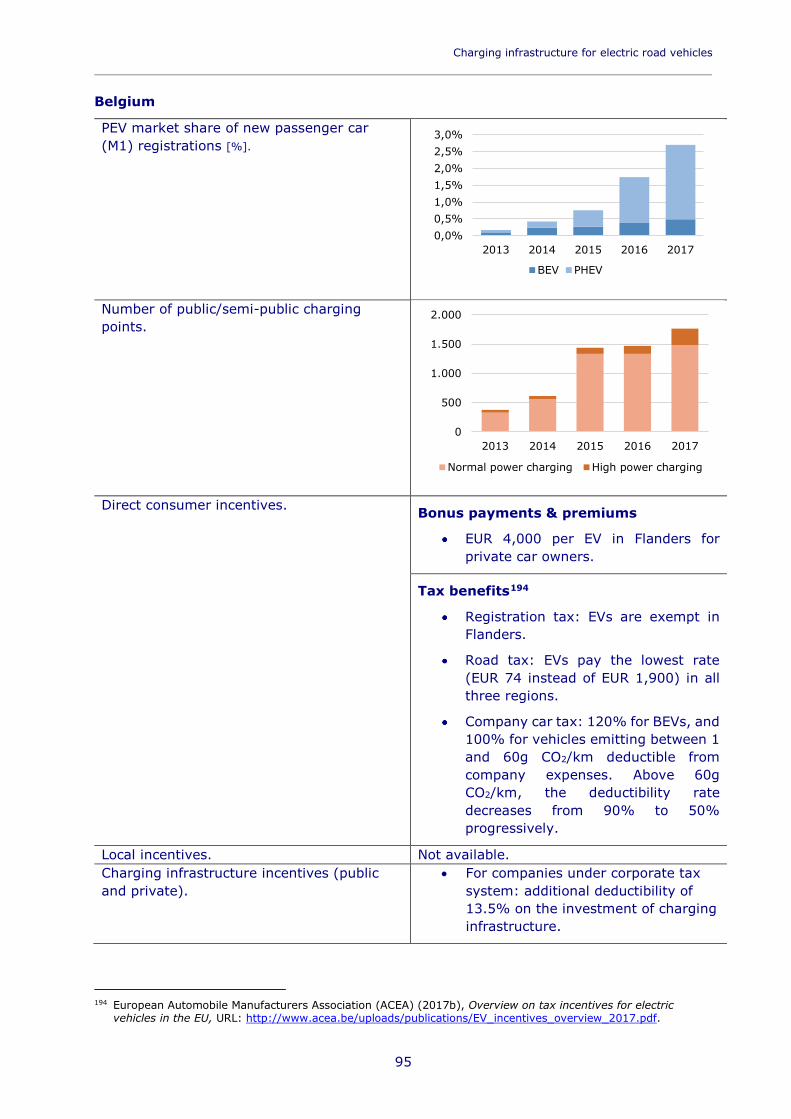
Charging infrastructure for electric road vehicles _________________________________________________________________________
95
Belgium
PEV market share of new passenger car (M1) registrations [%].
Number of public/semi-public charging points.
Direct consumer incentives. Bonus payments & premiums
EUR 4,000 per EV in Flanders for private car owners.
Tax benefits194
Registration tax: EVs are exempt in Flanders.
Road tax: EVs pay the lowest rate (EUR 74 instead of EUR 1,900) in all three regions.
Company car tax: 120% for BEVs, and 100% for vehicles emitting between 1 and 60g CO2/km deductible from company expenses. Above 60g CO2/km, the deductibility rate decreases from 90% to 50% progressively.
Local incentives. Not available. Charging infrastructure incentives (public and private).
• For companies under corporate tax system: additional deductibility of 13.5% on the investment of charging infrastructure.
194 European Automobile Manufacturers Association (ACEA) (2017b), Overview on tax incentives for electric
vehicles in the EU, URL: http://www.acea.be/uploads/publications/EV_incentives_overview_2017.pdf.
0
500
1.000
1.500
2.000
2013 2014 2015 2016 2017
Normal power charging High power charging
0,0%0,5%1,0%1,5%2,0%2,5%3,0%
2013 2014 2015 2016 2017
BEV PHEV
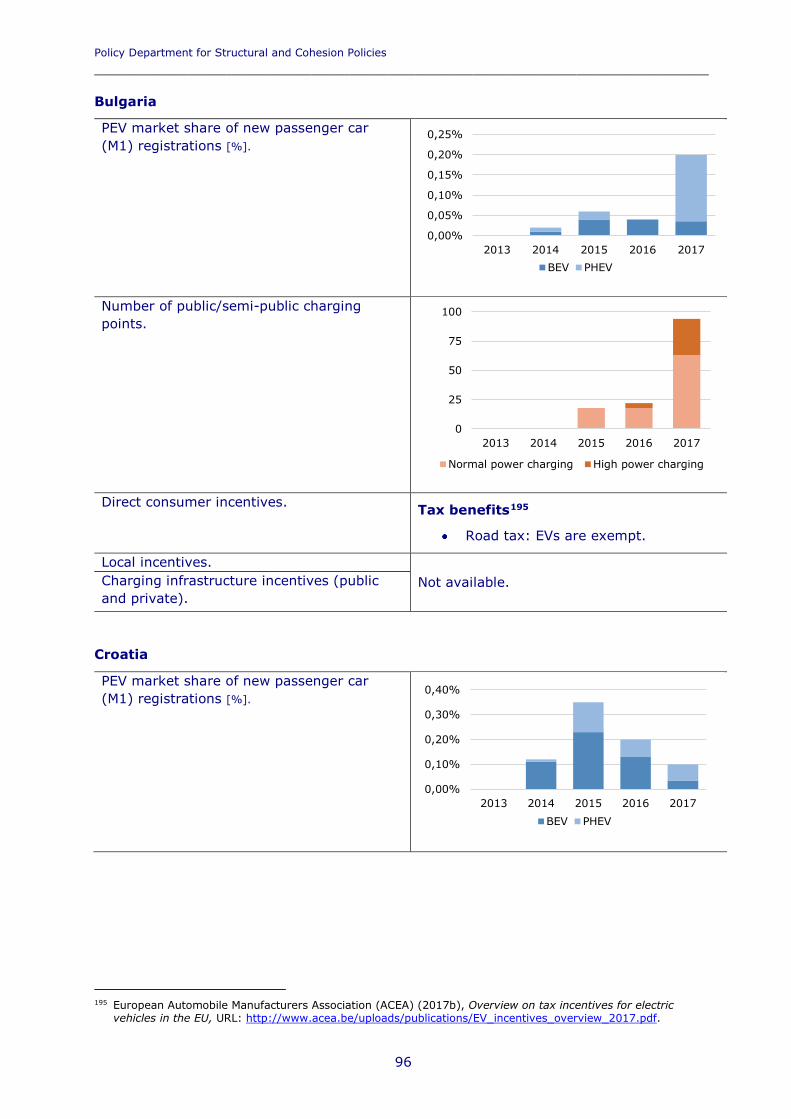
Policy Department for Structural and Cohesion Policies _________________________________________________________________
96
Bulgaria
PEV market share of new passenger car (M1) registrations [%].
Number of public/semi-public charging points.
Direct consumer incentives. Tax benefits195
Road tax: EVs are exempt.
Local incentives. Not available. Charging infrastructure incentives (public
and private).
Croatia
PEV market share of new passenger car (M1) registrations [%].
195 European Automobile Manufacturers Association (ACEA) (2017b), Overview on tax incentives for electric
vehicles in the EU, URL: http://www.acea.be/uploads/publications/EV_incentives_overview_2017.pdf.
0,00%
0,05%
0,10%
0,15%
0,20%
0,25%
2013 2014 2015 2016 2017BEV PHEV
0,00%
0,10%
0,20%
0,30%
0,40%
2013 2014 2015 2016 2017BEV PHEV
0
25
50
75
100
2013 2014 2015 2016 2017
Normal power charging High power charging
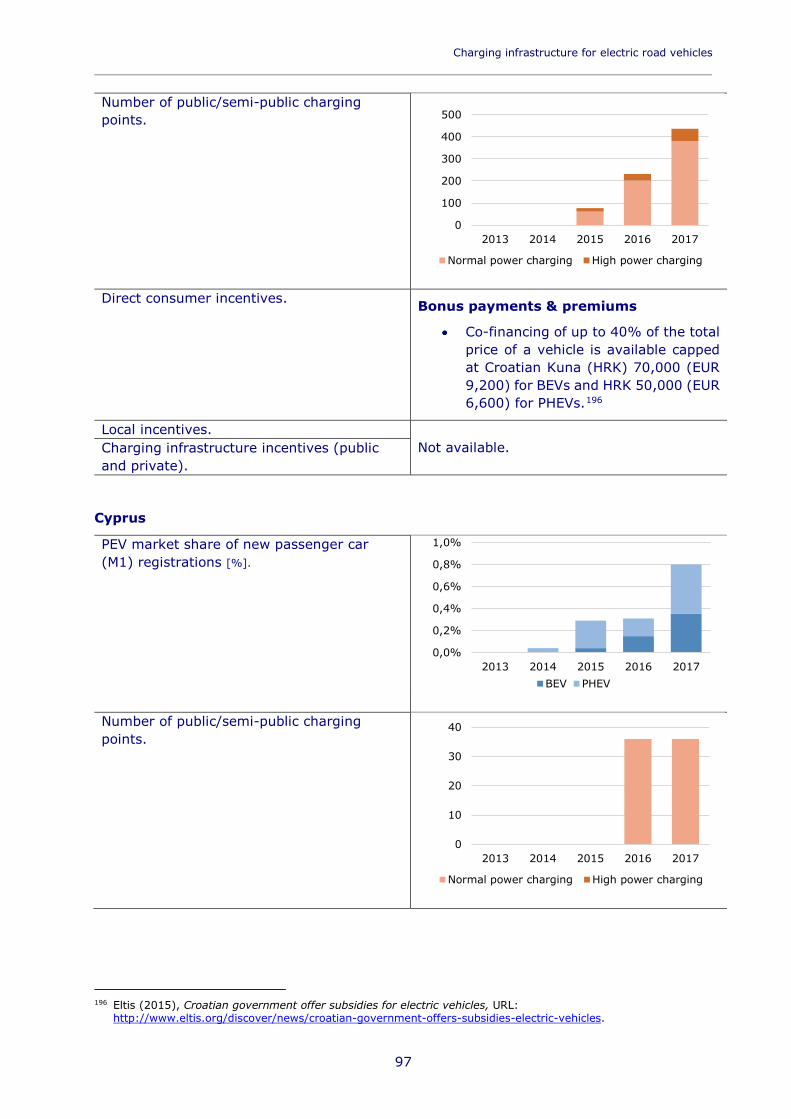
Charging infrastructure for electric road vehicles _________________________________________________________________________
97
Number of public/semi-public charging points.
Direct consumer incentives. Bonus payments & premiums
Co-financing of up to 40% of the total price of a vehicle is available capped at Croatian Kuna (HRK) 70,000 (EUR 9,200) for BEVs and HRK 50,000 (EUR 6,600) for PHEVs.196
Local incentives. Not available. Charging infrastructure incentives (public
and private).
Cyprus
PEV market share of new passenger car (M1) registrations [%].
Number of public/semi-public charging points.
196 Eltis (2015), Croatian government offer subsidies for electric vehicles, URL:
http://www.eltis.org/discover/news/croatian-government-offers-subsidies-electric-vehicles.
0
100
200
300
400
500
2013 2014 2015 2016 2017
Normal power charging High power charging
0,0%
0,2%
0,4%
0,6%
0,8%
1,0%
2013 2014 2015 2016 2017BEV PHEV
0
10
20
30
40
2013 2014 2015 2016 2017
Normal power charging High power charging
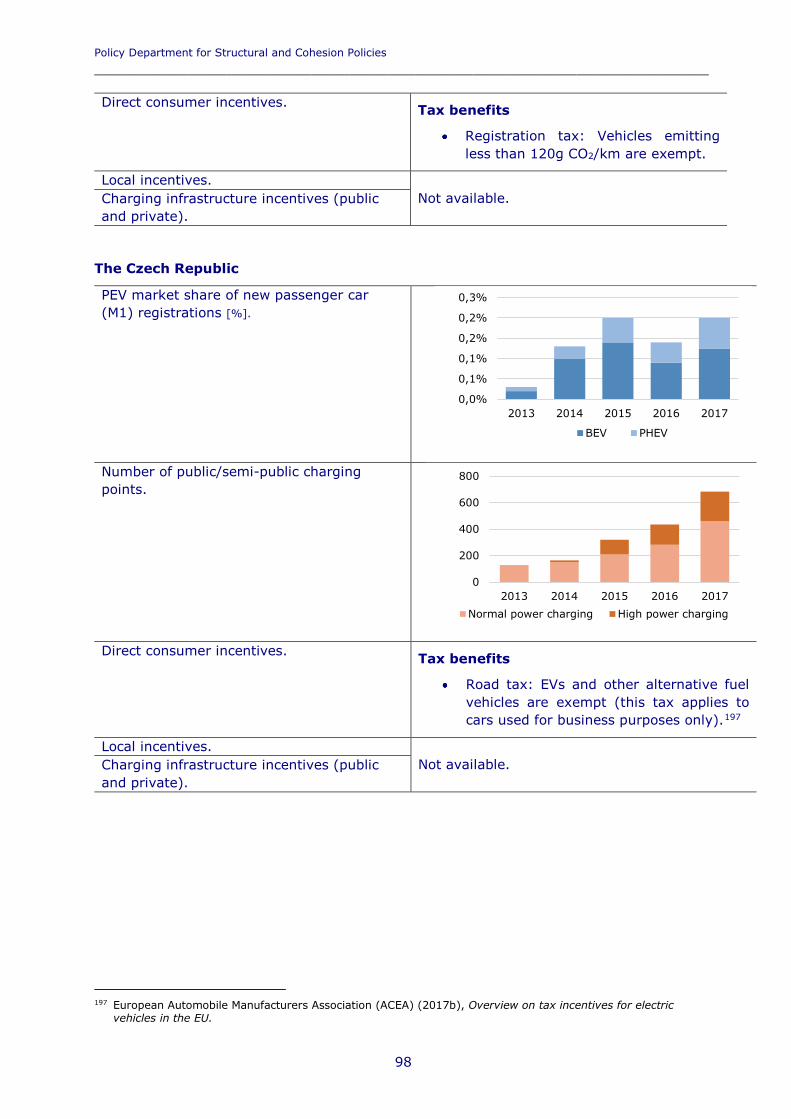
Policy Department for Structural and Cohesion Policies _________________________________________________________________
98
Direct consumer incentives. Tax benefits
Registration tax: Vehicles emitting less than 120g CO2/km are exempt.
Local incentives. Not available. Charging infrastructure incentives (public
and private).
The Czech Republic
PEV market share of new passenger car (M1) registrations [%].
Number of public/semi-public charging points.
Direct consumer incentives. Tax benefits
Road tax: EVs and other alternative fuel vehicles are exempt (this tax applies to cars used for business purposes only).197
Local incentives. Not available. Charging infrastructure incentives (public
and private).
197 European Automobile Manufacturers Association (ACEA) (2017b), Overview on tax incentives for electric
vehicles in the EU.
0,0%
0,1%
0,1%
0,2%
0,2%
0,3%
2013 2014 2015 2016 2017
BEV PHEV
0
200
400
600
800
2013 2014 2015 2016 2017Normal power charging High power charging
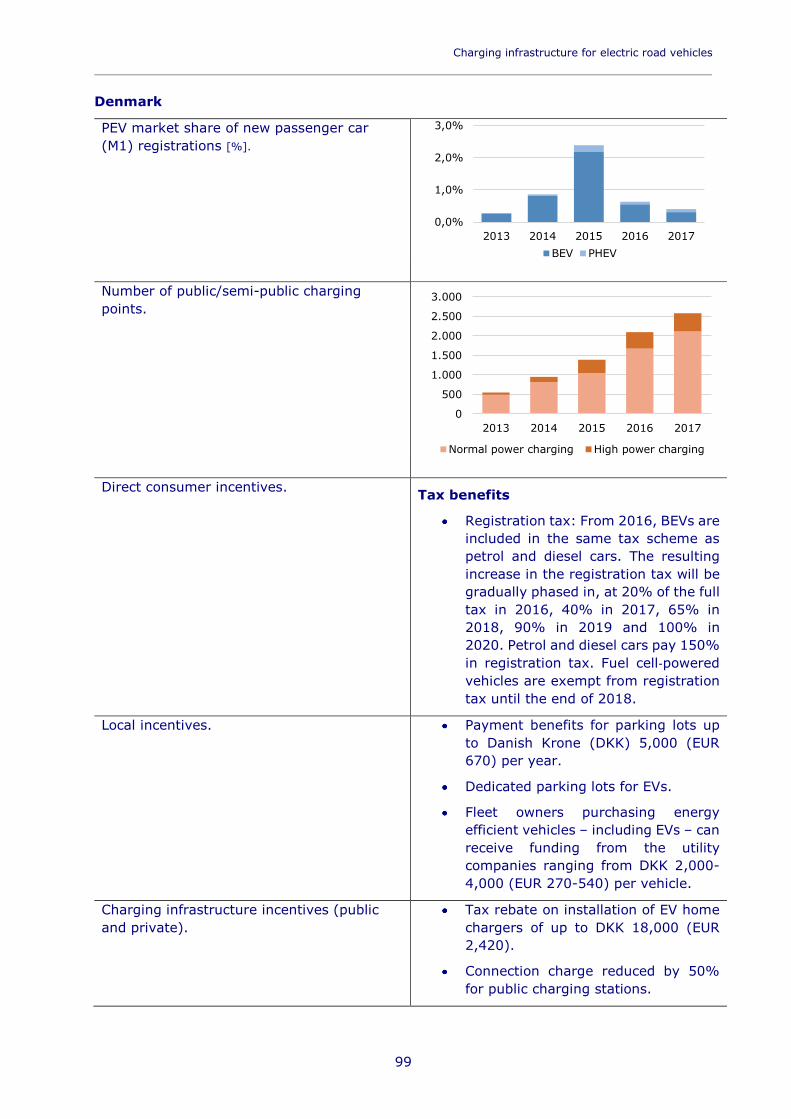
Charging infrastructure for electric road vehicles _________________________________________________________________________
99
Denmark
PEV market share of new passenger car (M1) registrations [%].
Number of public/semi-public charging points.
Direct consumer incentives. Tax benefits
Registration tax: From 2016, BEVs are included in the same tax scheme as petrol and diesel cars. The resulting increase in the registration tax will be gradually phased in, at 20% of the full tax in 2016, 40% in 2017, 65% in 2018, 90% in 2019 and 100% in 2020. Petrol and diesel cars pay 150% in registration tax. Fuel cell‐powered vehicles are exempt from registration tax until the end of 2018.
Local incentives. Payment benefits for parking lots up to Danish Krone (DKK) 5,000 (EUR 670) per year.
Dedicated parking lots for EVs.
Fleet owners purchasing energy efficient vehicles – including EVs – can receive funding from the utility companies ranging from DKK 2,000-4,000 (EUR 270-540) per vehicle.
Charging infrastructure incentives (public and private).
Tax rebate on installation of EV home chargers of up to DKK 18,000 (EUR 2,420).
Connection charge reduced by 50% for public charging stations.
0,0%
1,0%
2,0%
3,0%
2013 2014 2015 2016 2017BEV PHEV
0
500
1.000
1.500
2.000
2.500
3.000
2013 2014 2015 2016 2017
Normal power charging High power charging

Policy Department for Structural and Cohesion Policies _________________________________________________________________
100
Estonia
PEV market share of new passenger car (M1) registrations [%].
Number of public/semi-public charging points.
Direct consumer incentives.
Not available. Local incentives. Charging infrastructure incentives (public and private).
Finland
PEV market share of new passenger car (M1) registrations [%].
Number of public/semi-public charging points.
Direct consumer incentives. Tax benefits
0,0%
0,5%
1,0%
1,5%
2,0%
2013 2014 2015 2016 2017BEV PHEV
0
100
200
300
400
2013 2014 2015 2016 2017
Normal power charging High power charging
0,0%
1,0%
2,0%
3,0%
2013 2014 2015 2016 2017BEV PHEV
0
200
400
600
800
1.000
2013 2014 2015 2016 2017
Normal power charging High power charging
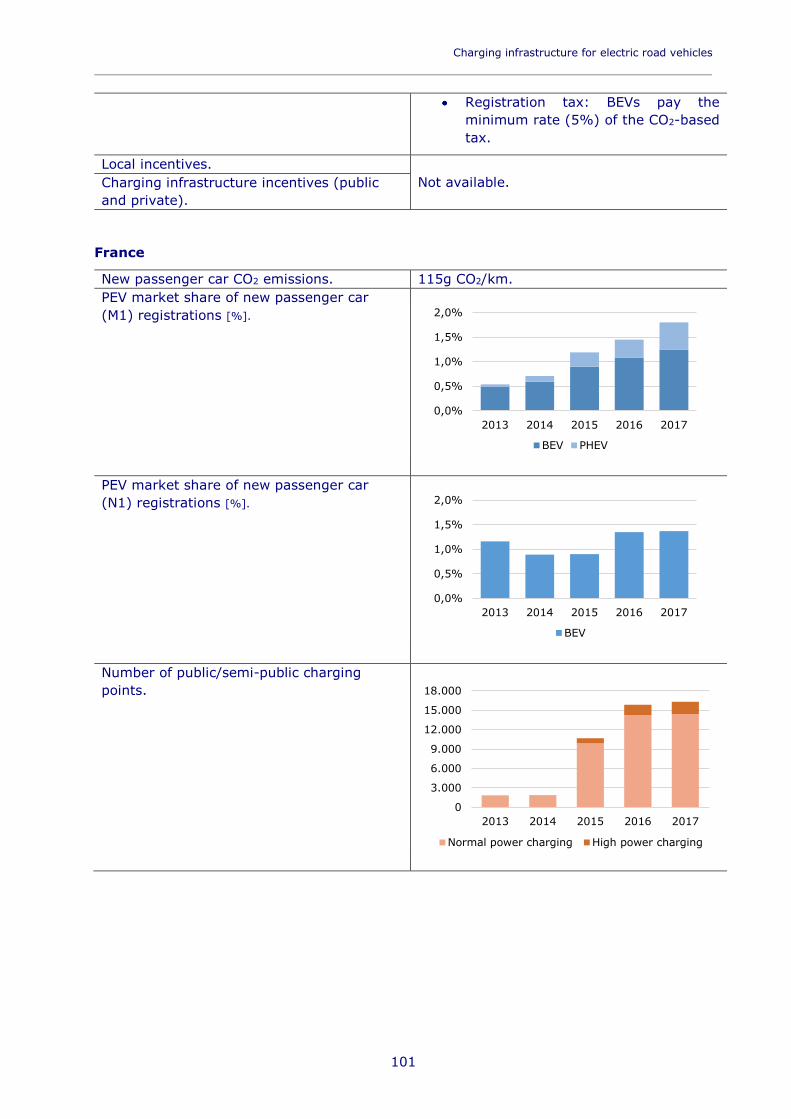
Charging infrastructure for electric road vehicles _________________________________________________________________________
101
Registration tax: BEVs pay the minimum rate (5%) of the CO2-based tax.
Local incentives. Not available. Charging infrastructure incentives (public
and private).
France
New passenger car CO2 emissions. 115g CO2/km. PEV market share of new passenger car (M1) registrations [%].
PEV market share of new passenger car (N1) registrations [%].
Number of public/semi-public charging points.
0
3.000
6.000
9.000
12.000
15.000
18.000
2013 2014 2015 2016 2017
Normal power charging High power charging
0,0%
0,5%
1,0%
1,5%
2,0%
2013 2014 2015 2016 2017
BEV PHEV
0,0%
0,5%
1,0%
1,5%
2,0%
2013 2014 2015 2016 2017
BEV
Policy Department for Structural and Cohesion Policies _________________________________________________________________
102
Direct consumer incentives. Bonus payments & premiums
EVs and PHEVs emitting 20g CO2/km or less get EUR 6,000, vehicles emitting between 21 and 60g/km receive a EUR 1,000 premium.
"L" category vehicles (quadricycles, motorbikes, scooters, etc.) receive a premium of EUR 250 per kilowatt-hour, with a limit of EUR 1,000 or 27% of purchase price.
Diesel scrappage scheme: Up to EUR 4,000 if an old diesel vehicle car is replaced by a low emissions vehicle.
Tax benefits:
Registration tax: Regions have the option to provide an exemption (either total or 50%) for alternative fuel vehicles.
Company car tax: BEVs are exempt and hybrid vehicles emitting less than 110g CO2/km are exempt during the first two years after registration.
Charging infrastructure incentives (public and private).
EUR 50 million funding available for charging infrastructure covering up to 30% of the equipment cost.
Public-private partnerships to accelerate the construction of charging points.
Tax breaks for home charging equipment.
Complementary policies. EV targets for government and business fleets.
Subsidy for car rental and taxi firms.
Research and development funding.
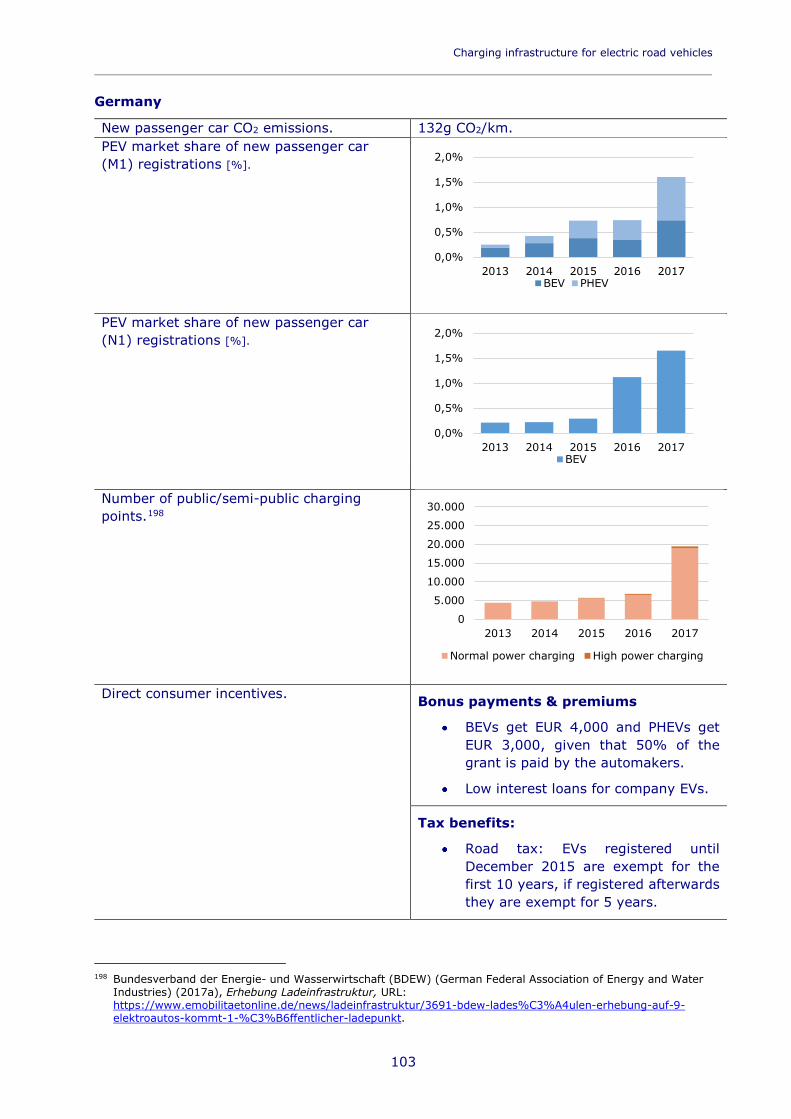
Charging infrastructure for electric road vehicles _________________________________________________________________________
103
Germany
New passenger car CO2 emissions. 132g CO2/km. PEV market share of new passenger car (M1) registrations [%].
PEV market share of new passenger car (N1) registrations [%].
Number of public/semi-public charging points.198
Direct consumer incentives. Bonus payments & premiums
BEVs get EUR 4,000 and PHEVs get EUR 3,000, given that 50% of the grant is paid by the automakers.
Low interest loans for company EVs.
Tax benefits:
Road tax: EVs registered until December 2015 are exempt for the first 10 years, if registered afterwards they are exempt for 5 years.
198 Bundesverband der Energie- und Wasserwirtschaft (BDEW) (German Federal Association of Energy and Water
Industries) (2017a), Erhebung Ladeinfrastruktur, URL: https://www.emobilitaetonline.de/news/ladeinfrastruktur/3691-bdew-lades%C3%A4ulen-erhebung-auf-9-elektroautos-kommt-1-%C3%B6ffentlicher-ladepunkt.
0
5.000
10.000
15.000
20.000
25.000
30.000
2013 2014 2015 2016 2017
Normal power charging High power charging
0,0%
0,5%
1,0%
1,5%
2,0%
2013 2014 2015 2016 2017BEV PHEV
0,0%
0,5%
1,0%
1,5%
2,0%
2013 2014 2015 2016 2017BEV
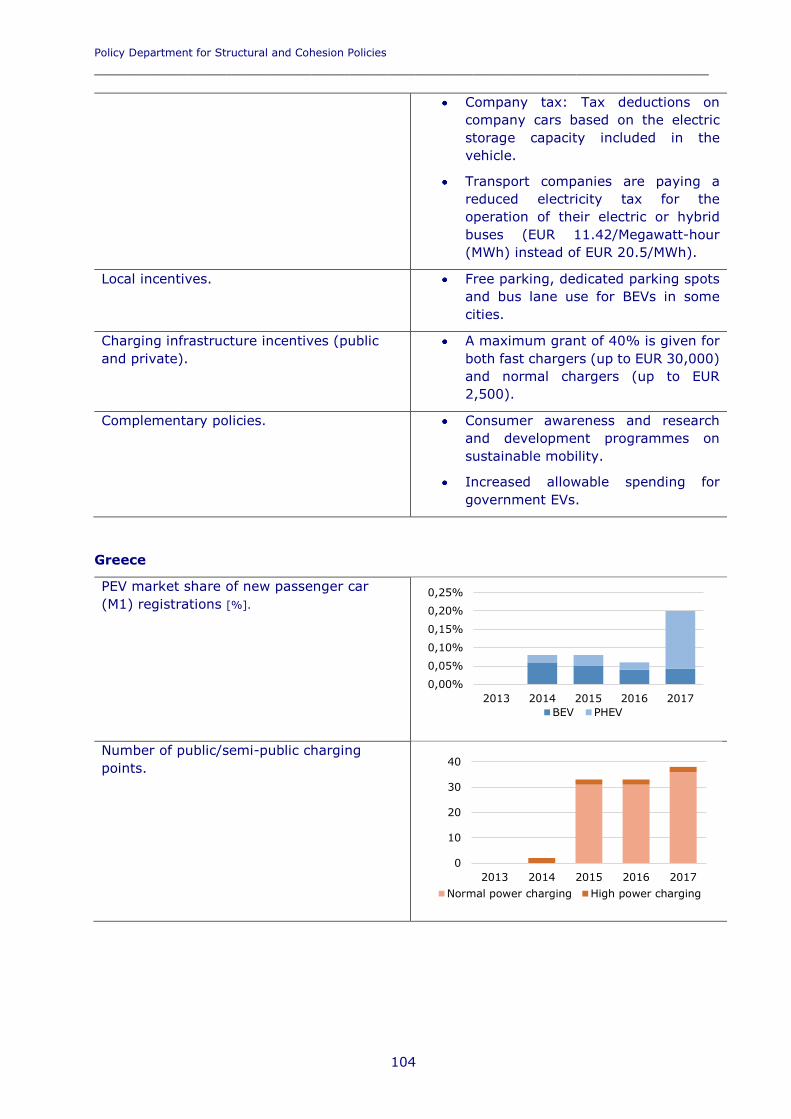
Policy Department for Structural and Cohesion Policies _________________________________________________________________
104
Company tax: Tax deductions on company cars based on the electric storage capacity included in the vehicle.
Transport companies are paying a reduced electricity tax for the operation of their electric or hybrid buses (EUR 11.42/Megawatt-hour (MWh) instead of EUR 20.5/MWh).
Local incentives. Free parking, dedicated parking spots and bus lane use for BEVs in some cities.
Charging infrastructure incentives (public and private).
A maximum grant of 40% is given for both fast chargers (up to EUR 30,000) and normal chargers (up to EUR 2,500).
Complementary policies. Consumer awareness and research and development programmes on sustainable mobility.
Increased allowable spending for government EVs.
Greece
PEV market share of new passenger car (M1) registrations [%].
Number of public/semi-public charging points.
0,00%
0,05%
0,10%
0,15%
0,20%
0,25%
2013 2014 2015 2016 2017BEV PHEV
0
10
20
30
40
2013 2014 2015 2016 2017Normal power charging High power charging
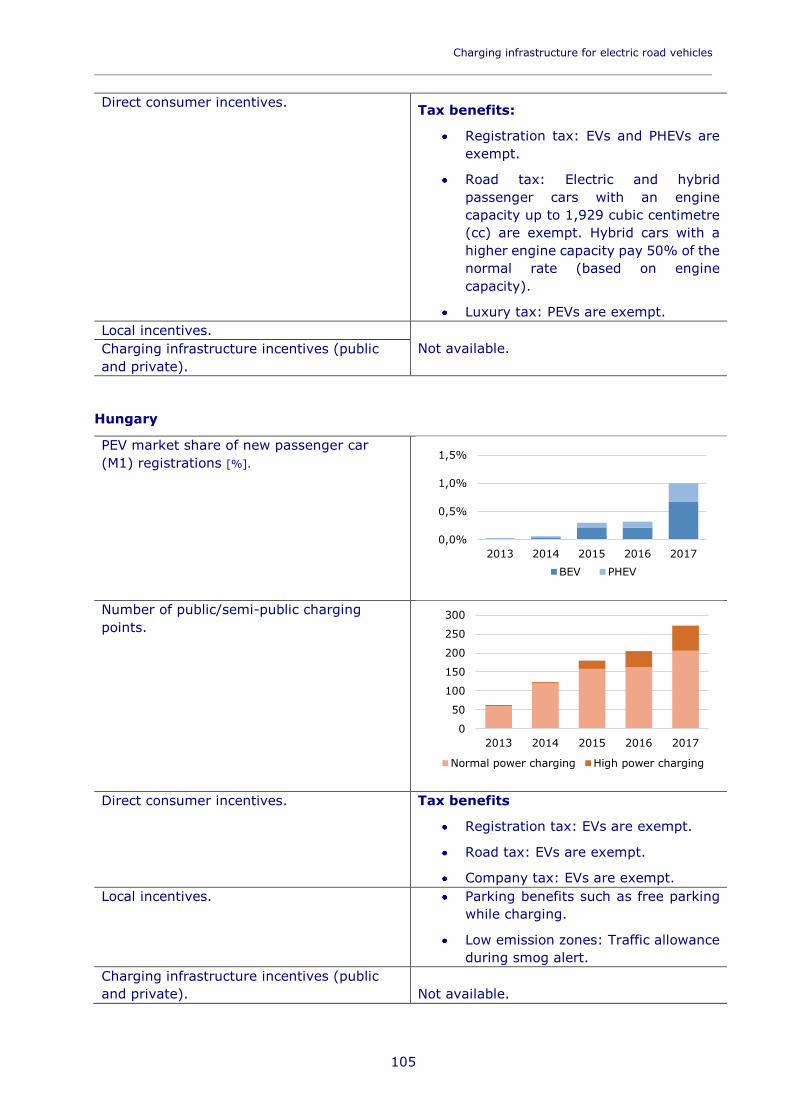
Charging infrastructure for electric road vehicles _________________________________________________________________________
105
Direct consumer incentives. Tax benefits:
Registration tax: EVs and PHEVs are exempt.
Road tax: Electric and hybrid passenger cars with an engine capacity up to 1,929 cubic centimetre (cc) are exempt. Hybrid cars with a higher engine capacity pay 50% of the normal rate (based on engine capacity).
Luxury tax: PEVs are exempt. Local incentives.
Not available. Charging infrastructure incentives (public and private).
Hungary
PEV market share of new passenger car (M1) registrations [%].
Number of public/semi-public charging points.
Direct consumer incentives. Tax benefits
Registration tax: EVs are exempt.
Road tax: EVs are exempt.
Company tax: EVs are exempt. Local incentives. Parking benefits such as free parking
while charging.
Low emission zones: Traffic allowance during smog alert.
Charging infrastructure incentives (public and private). Not available.
0,0%
0,5%
1,0%
1,5%
2013 2014 2015 2016 2017BEV PHEV
0
50
100
150
200
250
300
2013 2014 2015 2016 2017
Normal power charging High power charging
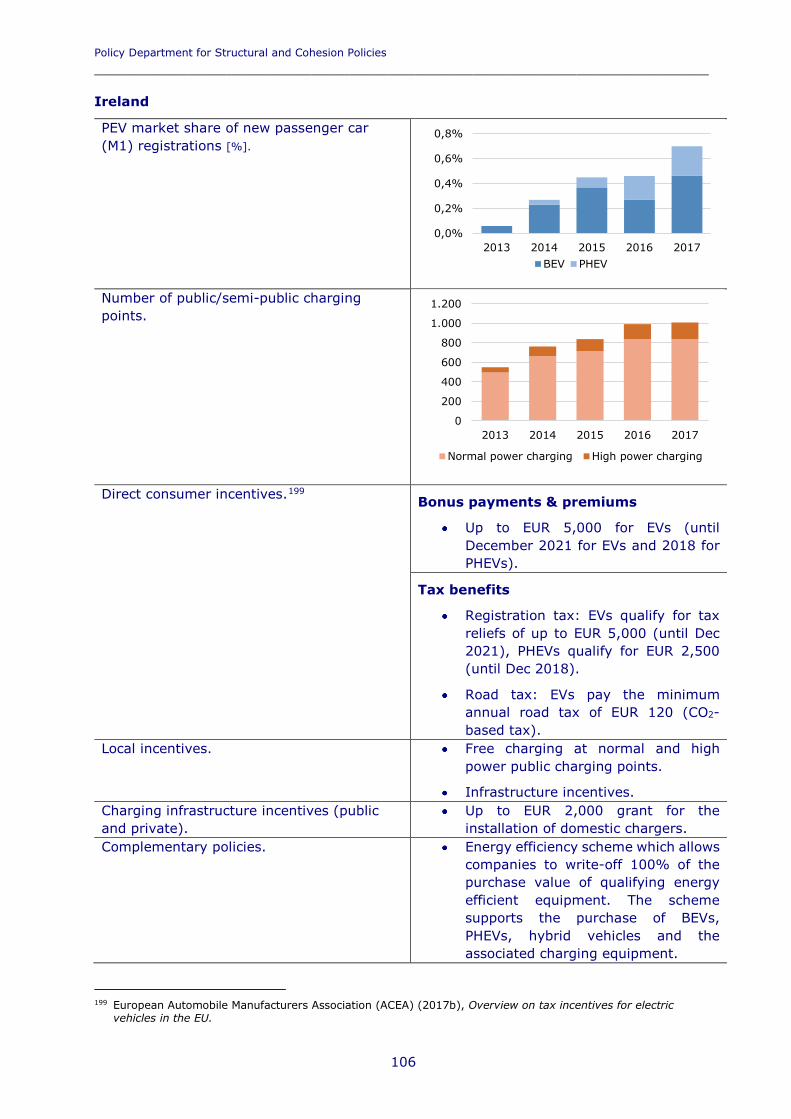
Policy Department for Structural and Cohesion Policies _________________________________________________________________
106
Ireland
PEV market share of new passenger car (M1) registrations [%].
Number of public/semi-public charging points.
Direct consumer incentives.199 Bonus payments & premiums
Up to EUR 5,000 for EVs (until December 2021 for EVs and 2018 for PHEVs).
Tax benefits
Registration tax: EVs qualify for tax reliefs of up to EUR 5,000 (until Dec 2021), PHEVs qualify for EUR 2,500 (until Dec 2018).
Road tax: EVs pay the minimum annual road tax of EUR 120 (CO2-based tax).
Local incentives. Free charging at normal and high power public charging points.
Infrastructure incentives. Charging infrastructure incentives (public and private).
Up to EUR 2,000 grant for the installation of domestic chargers.
Complementary policies. Energy efficiency scheme which allows companies to write-off 100% of the purchase value of qualifying energy efficient equipment. The scheme supports the purchase of BEVs, PHEVs, hybrid vehicles and the associated charging equipment.
199 European Automobile Manufacturers Association (ACEA) (2017b), Overview on tax incentives for electric
vehicles in the EU.
0,0%
0,2%
0,4%
0,6%
0,8%
2013 2014 2015 2016 2017BEV PHEV
0
200
400
600
800
1.000
1.200
2013 2014 2015 2016 2017
Normal power charging High power charging
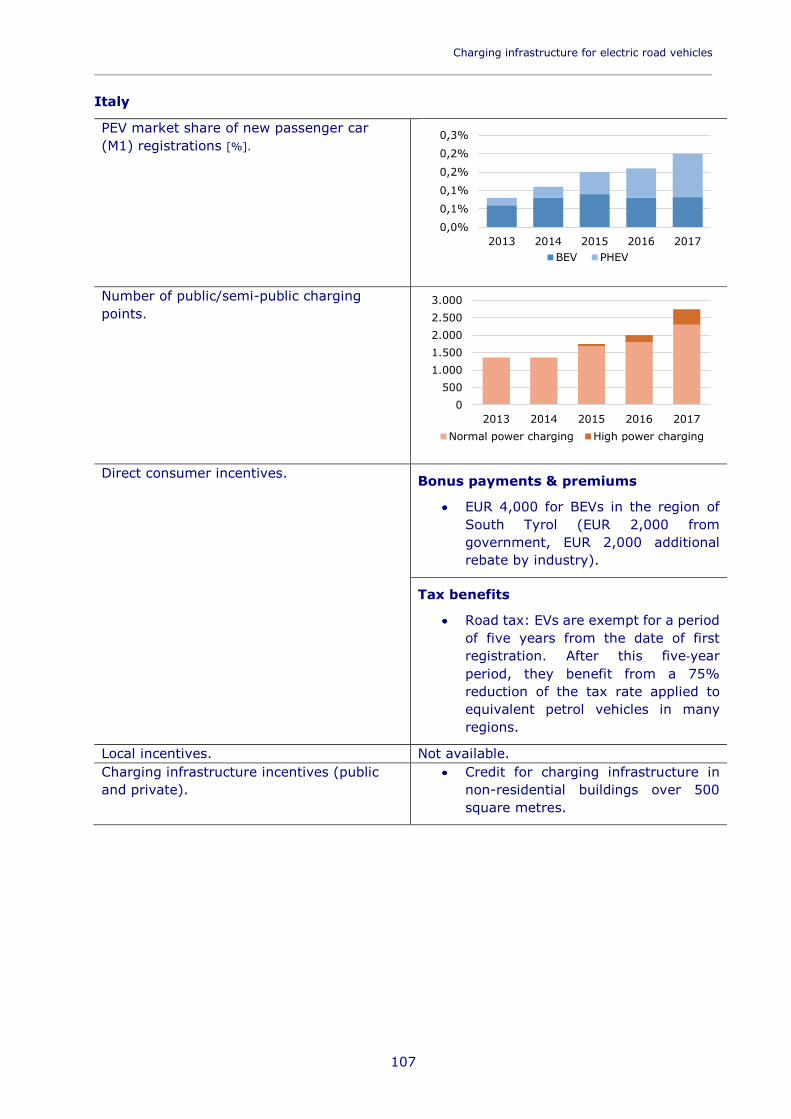
Charging infrastructure for electric road vehicles _________________________________________________________________________
107
Italy
PEV market share of new passenger car (M1) registrations [%].
Number of public/semi-public charging points.
Direct consumer incentives. Bonus payments & premiums
EUR 4,000 for BEVs in the region of South Tyrol (EUR 2,000 from government, EUR 2,000 additional rebate by industry).
Tax benefits
Road tax: EVs are exempt for a period of five years from the date of first registration. After this five‐year period, they benefit from a 75% reduction of the tax rate applied to equivalent petrol vehicles in many regions.
Local incentives. Not available. Charging infrastructure incentives (public and private).
Credit for charging infrastructure in non-residential buildings over 500 square metres.
0,0%
0,1%
0,1%
0,2%
0,2%
0,3%
2013 2014 2015 2016 2017BEV PHEV
0500
1.0001.5002.0002.5003.000
2013 2014 2015 2016 2017Normal power charging High power charging
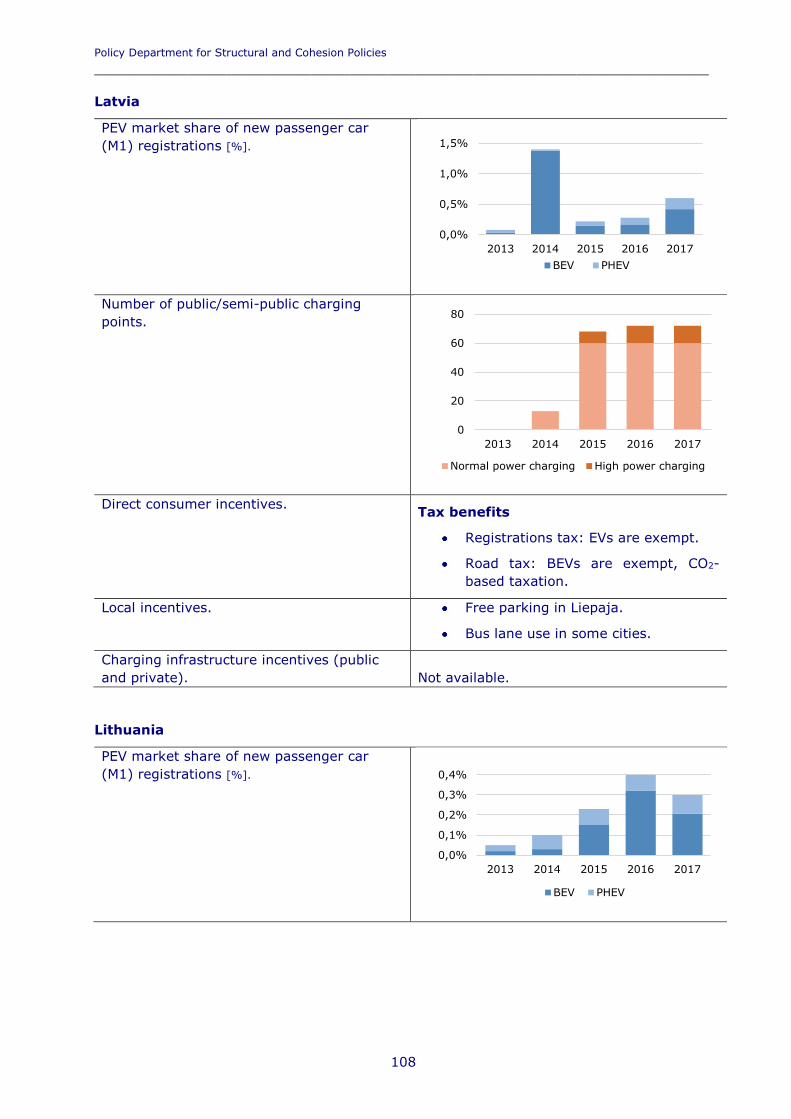
Policy Department for Structural and Cohesion Policies _________________________________________________________________
108
Latvia
PEV market share of new passenger car (M1) registrations [%].
Number of public/semi-public charging points.
Direct consumer incentives. Tax benefits
Registrations tax: EVs are exempt.
Road tax: BEVs are exempt, CO2-based taxation.
Local incentives. Free parking in Liepaja.
Bus lane use in some cities.
Charging infrastructure incentives (public and private). Not available.
Lithuania
PEV market share of new passenger car (M1) registrations [%].
0,0%
0,5%
1,0%
1,5%
2013 2014 2015 2016 2017BEV PHEV
0
20
40
60
80
2013 2014 2015 2016 2017
Normal power charging High power charging
0,0%
0,1%
0,2%
0,3%
0,4%
2013 2014 2015 2016 2017
BEV PHEV
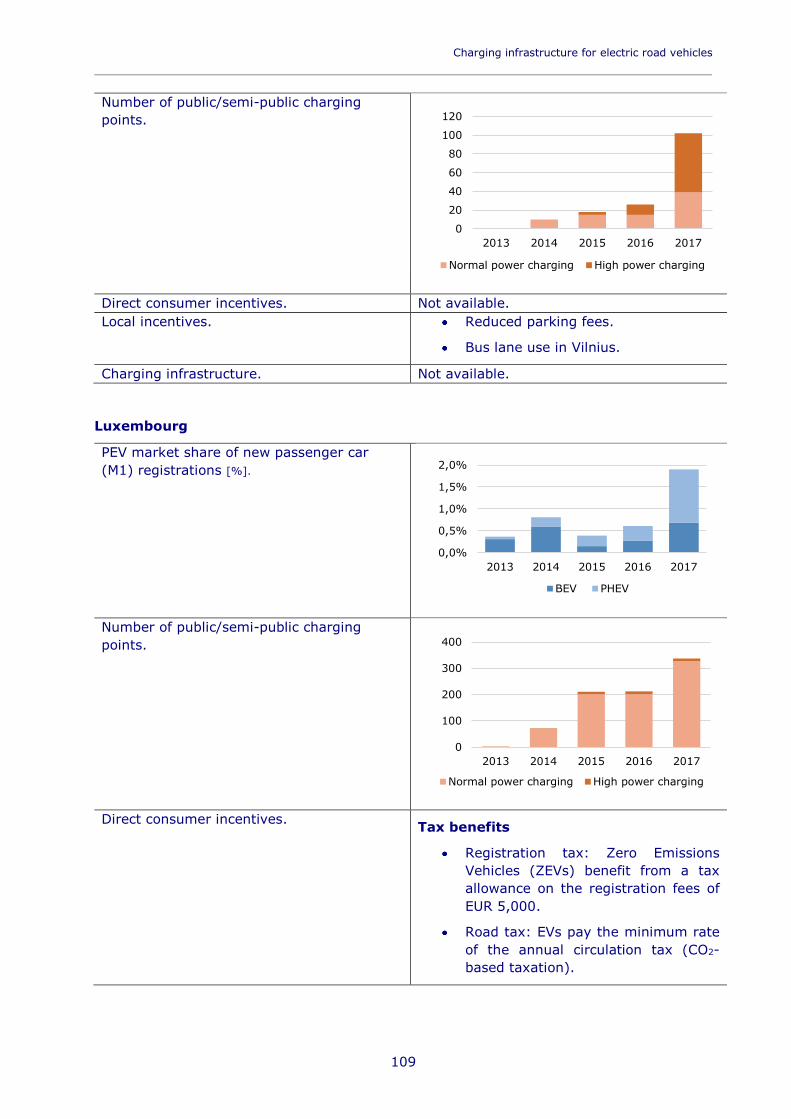
Charging infrastructure for electric road vehicles _________________________________________________________________________
109
Number of public/semi-public charging points.
Direct consumer incentives. Not available. Local incentives. Reduced parking fees.
Bus lane use in Vilnius.
Charging infrastructure. Not available.
Luxembourg
PEV market share of new passenger car (M1) registrations [%].
Number of public/semi-public charging points.
Direct consumer incentives. Tax benefits
Registration tax: Zero Emissions Vehicles (ZEVs) benefit from a tax allowance on the registration fees of EUR 5,000.
Road tax: EVs pay the minimum rate of the annual circulation tax (CO2-based taxation).
0
20
40
60
80
100
120
2013 2014 2015 2016 2017
Normal power charging High power charging
0,0%
0,5%
1,0%
1,5%
2,0%
2013 2014 2015 2016 2017
BEV PHEV
0
100
200
300
400
2013 2014 2015 2016 2017
Normal power charging High power charging
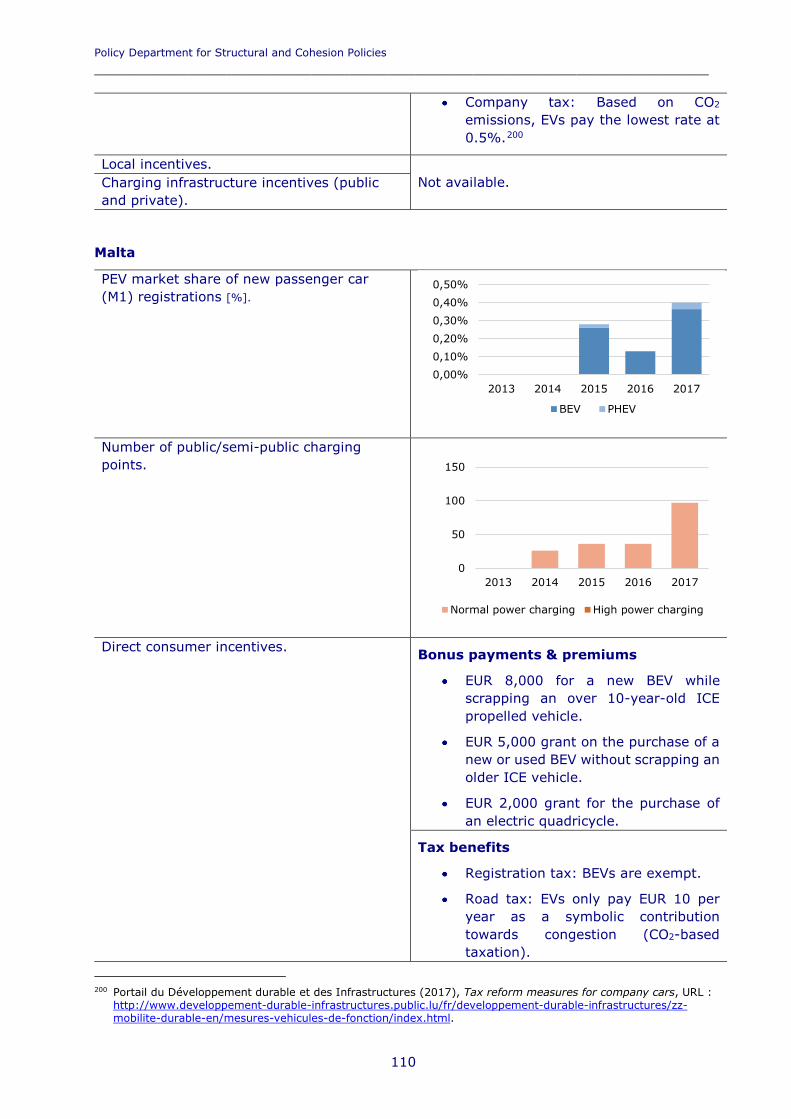
Policy Department for Structural and Cohesion Policies _________________________________________________________________
110
Company tax: Based on CO2 emissions, EVs pay the lowest rate at 0.5%.200
Local incentives. Not available. Charging infrastructure incentives (public
and private).
Malta
PEV market share of new passenger car (M1) registrations [%].
Number of public/semi-public charging points.
Direct consumer incentives. Bonus payments & premiums
EUR 8,000 for a new BEV while scrapping an over 10-year-old ICE propelled vehicle.
EUR 5,000 grant on the purchase of a new or used BEV without scrapping an older ICE vehicle.
EUR 2,000 grant for the purchase of an electric quadricycle.
Tax benefits
Registration tax: BEVs are exempt.
Road tax: EVs only pay EUR 10 per year as a symbolic contribution towards congestion (CO2-based taxation).
200 Portail du Développement durable et des Infrastructures (2017), Tax reform measures for company cars, URL :
http://www.developpement-durable-infrastructures.public.lu/fr/developpement-durable-infrastructures/zz-mobilite-durable-en/mesures-vehicules-de-fonction/index.html.
0,00%0,10%0,20%0,30%0,40%0,50%
2013 2014 2015 2016 2017
BEV PHEV
0
50
100
150
2013 2014 2015 2016 2017
Normal power charging High power charging
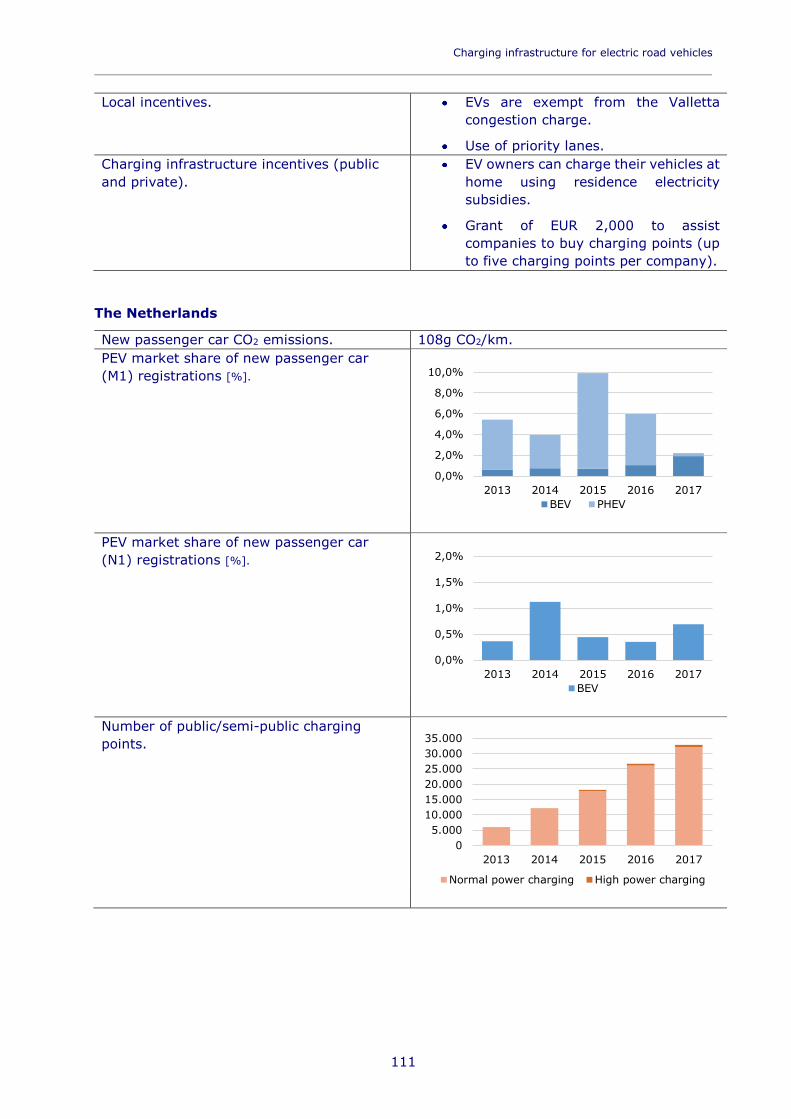
Charging infrastructure for electric road vehicles _________________________________________________________________________
111
Local incentives. EVs are exempt from the Valletta congestion charge.
Use of priority lanes. Charging infrastructure incentives (public and private).
EV owners can charge their vehicles at home using residence electricity subsidies.
Grant of EUR 2,000 to assist companies to buy charging points (up to five charging points per company).
The Netherlands
New passenger car CO2 emissions. 108g CO2/km. PEV market share of new passenger car (M1) registrations [%].
PEV market share of new passenger car (N1) registrations [%].
Number of public/semi-public charging points.
0,0%
2,0%
4,0%
6,0%
8,0%
10,0%
2013 2014 2015 2016 2017BEV PHEV
05.000
10.00015.00020.00025.00030.00035.000
2013 2014 2015 2016 2017
Normal power charging High power charging
0,0%
0,5%
1,0%
1,5%
2,0%
2013 2014 2015 2016 2017BEV
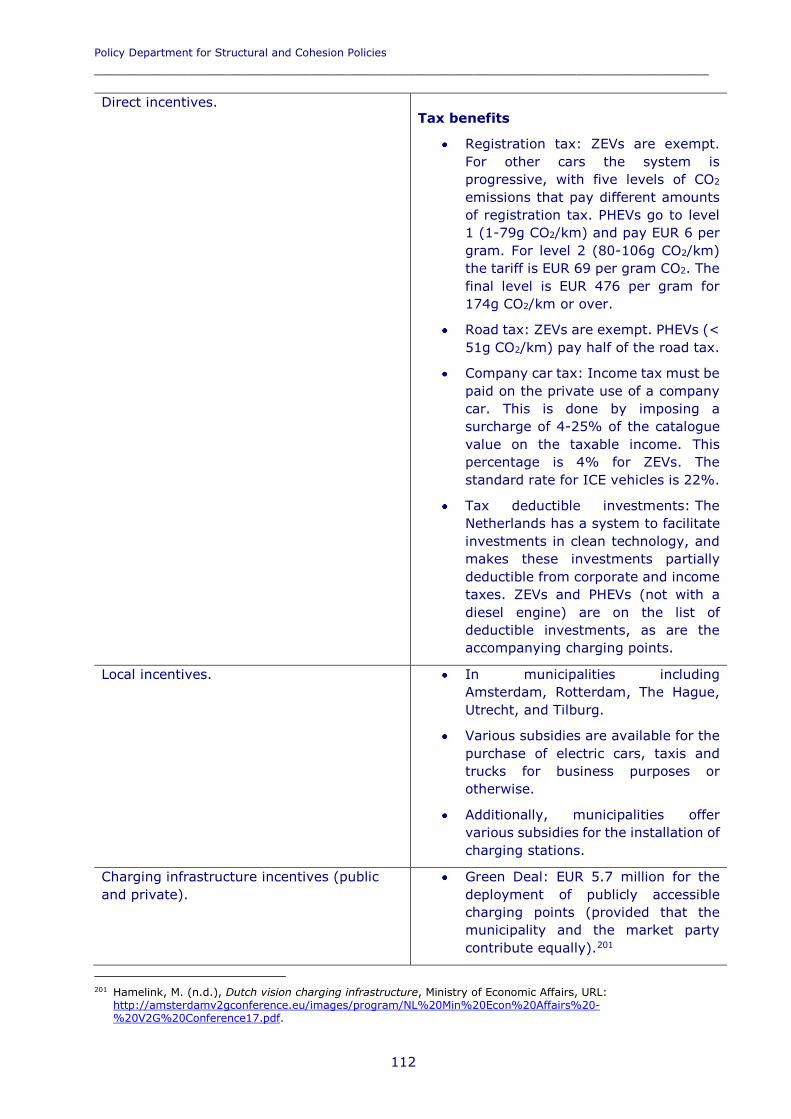
Policy Department for Structural and Cohesion Policies _________________________________________________________________
112
Direct incentives. Tax benefits
Registration tax: ZEVs are exempt. For other cars the system is progressive, with five levels of CO2 emissions that pay different amounts of registration tax. PHEVs go to level 1 (1-79g CO2/km) and pay EUR 6 per gram. For level 2 (80-106g CO2/km) the tariff is EUR 69 per gram CO2. The final level is EUR 476 per gram for 174g CO2/km or over.
Road tax: ZEVs are exempt. PHEVs (< 51g CO2/km) pay half of the road tax.
Company car tax: Income tax must be paid on the private use of a company car. This is done by imposing a surcharge of 4-25% of the catalogue value on the taxable income. This percentage is 4% for ZEVs. The standard rate for ICE vehicles is 22%.
Tax deductible investments: The Netherlands has a system to facilitate investments in clean technology, and makes these investments partially deductible from corporate and income taxes. ZEVs and PHEVs (not with a diesel engine) are on the list of deductible investments, as are the accompanying charging points.
Local incentives. In municipalities including Amsterdam, Rotterdam, The Hague, Utrecht, and Tilburg.
Various subsidies are available for the purchase of electric cars, taxis and trucks for business purposes or otherwise.
Additionally, municipalities offer various subsidies for the installation of charging stations.
Charging infrastructure incentives (public and private).
Green Deal: EUR 5.7 million for the deployment of publicly accessible charging points (provided that the municipality and the market party contribute equally).201
201 Hamelink, M. (n.d.), Dutch vision charging infrastructure, Ministry of Economic Affairs, URL:
http://amsterdamv2gconference.eu/images/program/NL%20Min%20Econ%20Affairs%20-%20V2G%20Conference17.pdf.
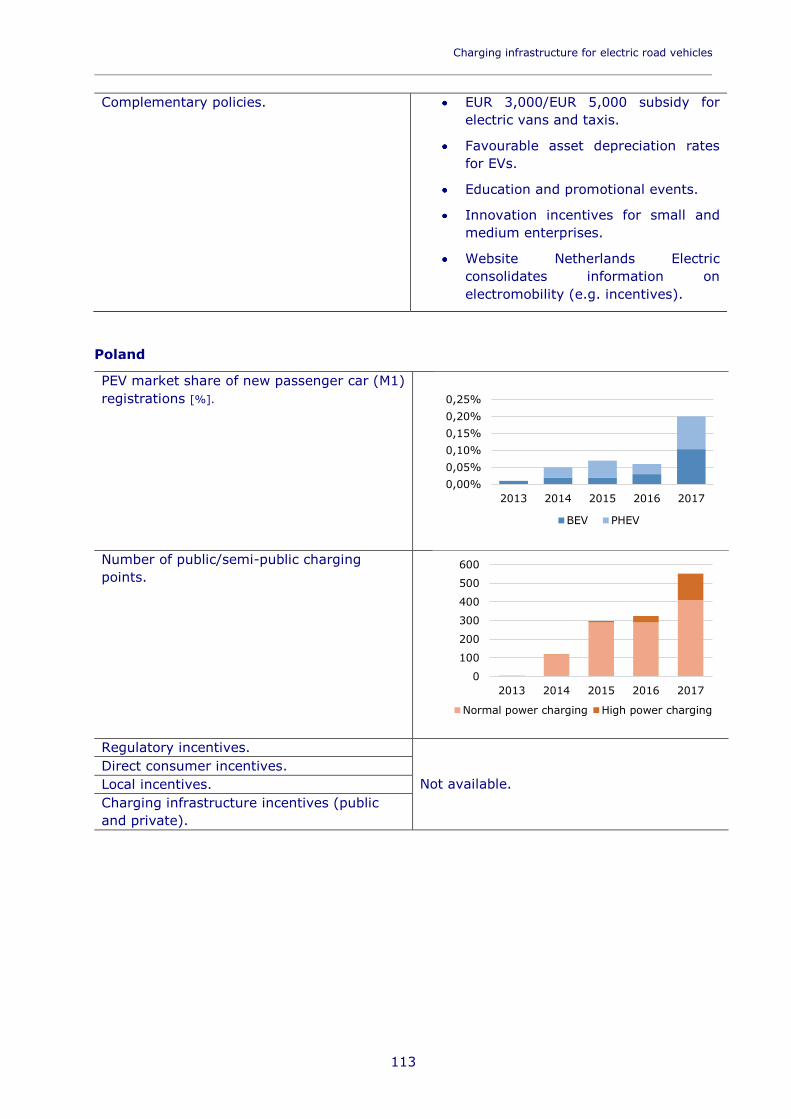
Charging infrastructure for electric road vehicles _________________________________________________________________________
113
Complementary policies. EUR 3,000/EUR 5,000 subsidy for electric vans and taxis.
Favourable asset depreciation rates for EVs.
Education and promotional events.
Innovation incentives for small and medium enterprises.
Website Netherlands Electric consolidates information on electromobility (e.g. incentives).
Poland
PEV market share of new passenger car (M1) registrations [%].
Number of public/semi-public charging points.
Regulatory incentives.
Not available. Direct consumer incentives. Local incentives. Charging infrastructure incentives (public and private).
0,00%0,05%0,10%0,15%0,20%0,25%
2013 2014 2015 2016 2017
BEV PHEV
0
100
200
300
400
500
600
2013 2014 2015 2016 2017
Normal power charging High power charging
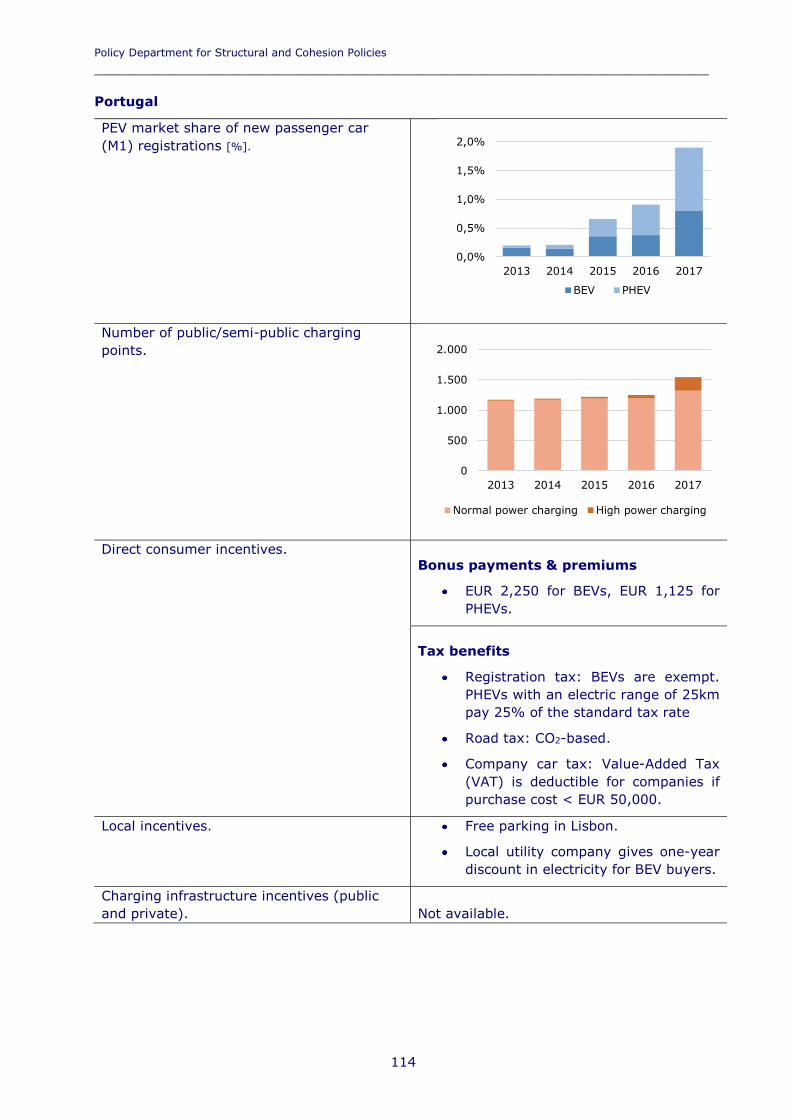
Policy Department for Structural and Cohesion Policies _________________________________________________________________
114
Portugal
PEV market share of new passenger car (M1) registrations [%].
Number of public/semi-public charging points.
Direct consumer incentives.
Bonus payments & premiums
EUR 2,250 for BEVs, EUR 1,125 for PHEVs.
Tax benefits
Registration tax: BEVs are exempt. PHEVs with an electric range of 25km pay 25% of the standard tax rate
Road tax: CO2-based.
Company car tax: Value-Added Tax (VAT) is deductible for companies if purchase cost < EUR 50,000.
Local incentives. Free parking in Lisbon.
Local utility company gives one-year discount in electricity for BEV buyers.
Charging infrastructure incentives (public and private). Not available.
0,0%
0,5%
1,0%
1,5%
2,0%
2013 2014 2015 2016 2017
BEV PHEV
0
500
1.000
1.500
2.000
2013 2014 2015 2016 2017
Normal power charging High power charging
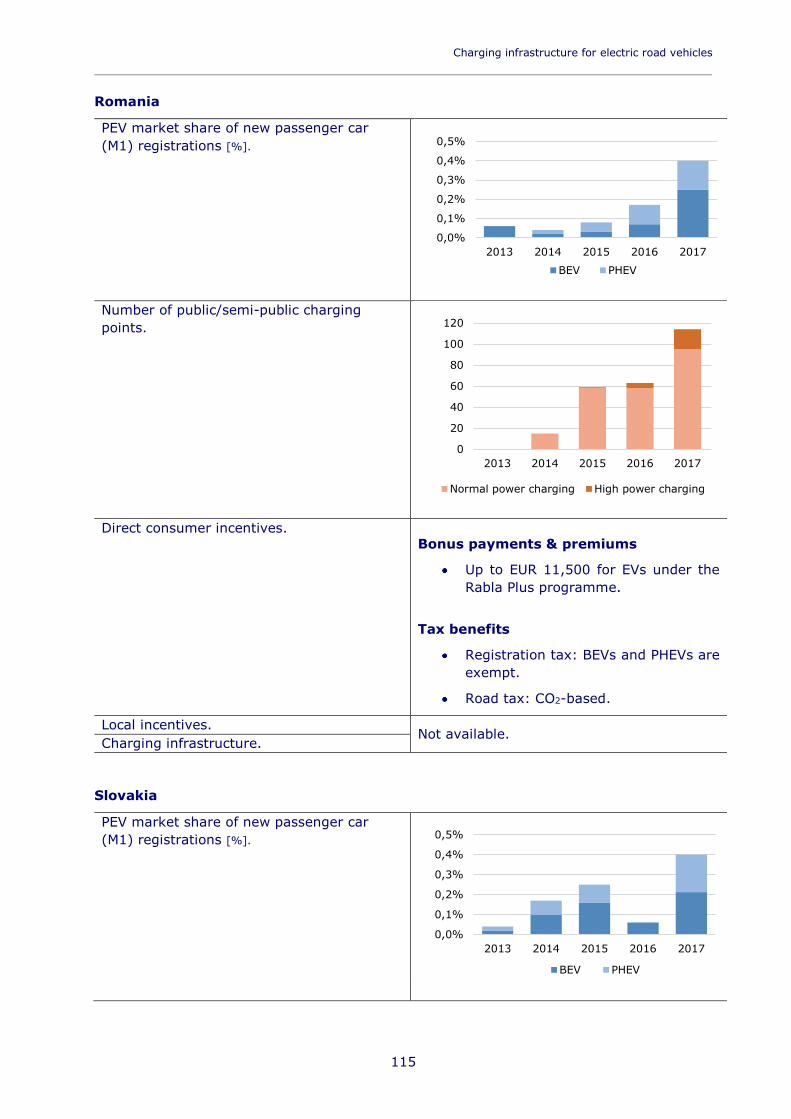
Charging infrastructure for electric road vehicles _________________________________________________________________________
115
Romania
PEV market share of new passenger car (M1) registrations [%].
Number of public/semi-public charging points.
Direct consumer incentives.
Bonus payments & premiums
Up to EUR 11,500 for EVs under the Rabla Plus programme.
Tax benefits
Registration tax: BEVs and PHEVs are exempt.
Road tax: CO2-based.
Local incentives. Not available.
Charging infrastructure.
Slovakia
PEV market share of new passenger car (M1) registrations [%].
0,0%
0,1%
0,2%
0,3%
0,4%
0,5%
2013 2014 2015 2016 2017
BEV PHEV
0
20
40
60
80
100
120
2013 2014 2015 2016 2017
Normal power charging High power charging
0,0%
0,1%
0,2%
0,3%
0,4%
0,5%
2013 2014 2015 2016 2017
BEV PHEV
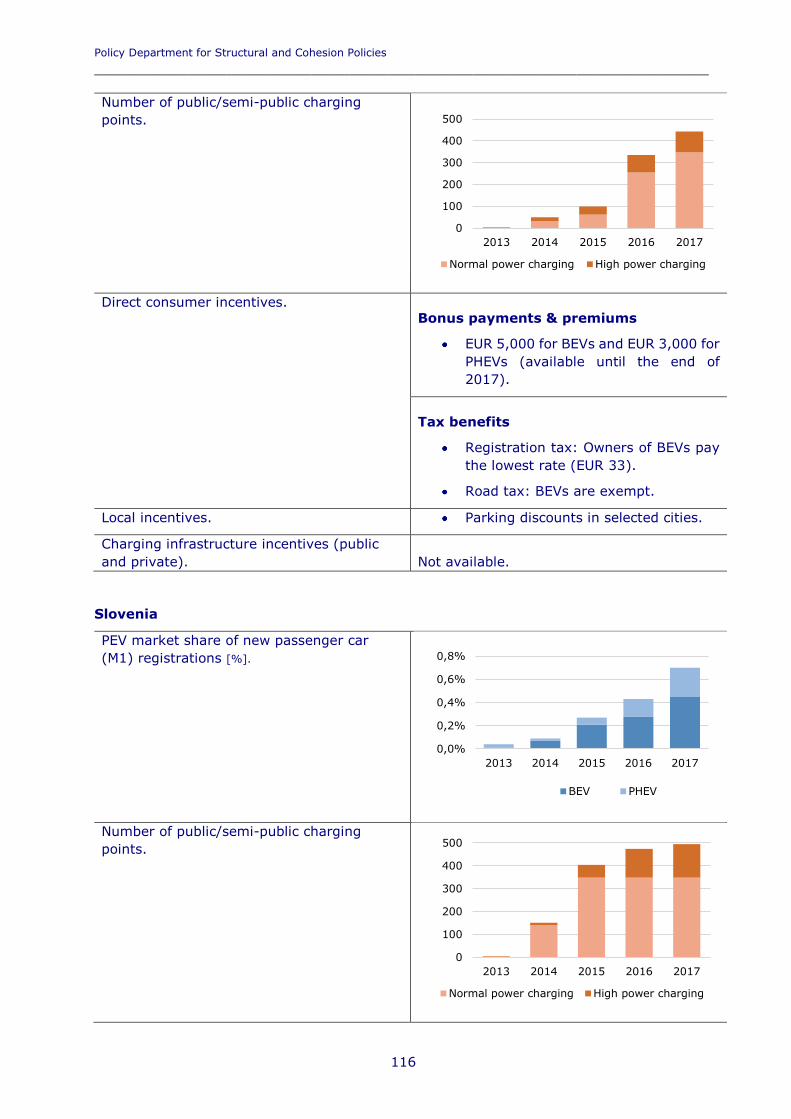
Policy Department for Structural and Cohesion Policies _________________________________________________________________
116
Number of public/semi-public charging points.
Direct consumer incentives.
Bonus payments & premiums
EUR 5,000 for BEVs and EUR 3,000 for PHEVs (available until the end of 2017).
Tax benefits
Registration tax: Owners of BEVs pay the lowest rate (EUR 33).
Road tax: BEVs are exempt.
Local incentives. Parking discounts in selected cities.
Charging infrastructure incentives (public and private). Not available.
Slovenia
PEV market share of new passenger car (M1) registrations [%].
Number of public/semi-public charging points.
0
100
200
300
400
500
2013 2014 2015 2016 2017
Normal power charging High power charging
0,0%
0,2%
0,4%
0,6%
0,8%
2013 2014 2015 2016 2017
BEV PHEV
0
100
200
300
400
500
2013 2014 2015 2016 2017
Normal power charging High power charging
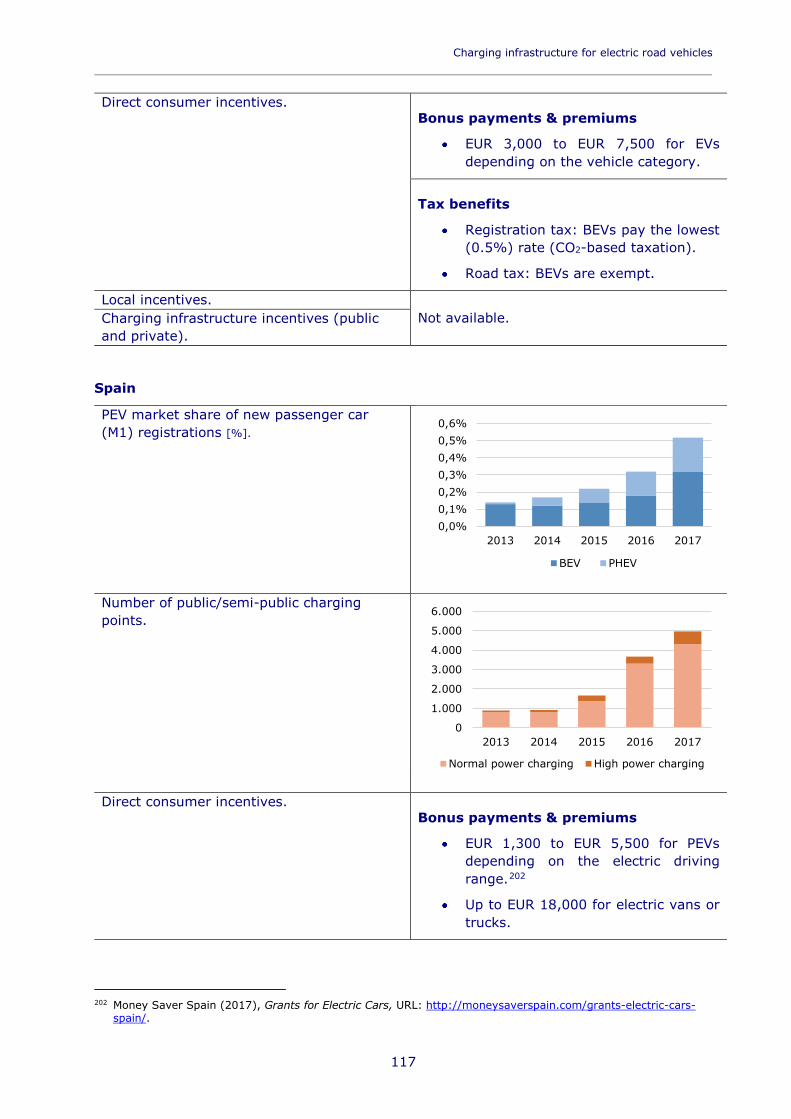
Charging infrastructure for electric road vehicles _________________________________________________________________________
117
Direct consumer incentives. Bonus payments & premiums
EUR 3,000 to EUR 7,500 for EVs depending on the vehicle category.
Tax benefits
Registration tax: BEVs pay the lowest (0.5%) rate (CO2-based taxation).
Road tax: BEVs are exempt.
Local incentives. Not available. Charging infrastructure incentives (public
and private).
Spain
PEV market share of new passenger car (M1) registrations [%].
Number of public/semi-public charging points.
Direct consumer incentives.
Bonus payments & premiums
EUR 1,300 to EUR 5,500 for PEVs depending on the electric driving range.202
Up to EUR 18,000 for electric vans or trucks.
202 Money Saver Spain (2017), Grants for Electric Cars, URL: http://moneysaverspain.com/grants-electric-cars-
spain/.
0,0%0,1%0,2%0,3%0,4%0,5%0,6%
2013 2014 2015 2016 2017
BEV PHEV
0
1.000
2.000
3.000
4.000
5.000
6.000
2013 2014 2015 2016 2017
Normal power charging High power charging
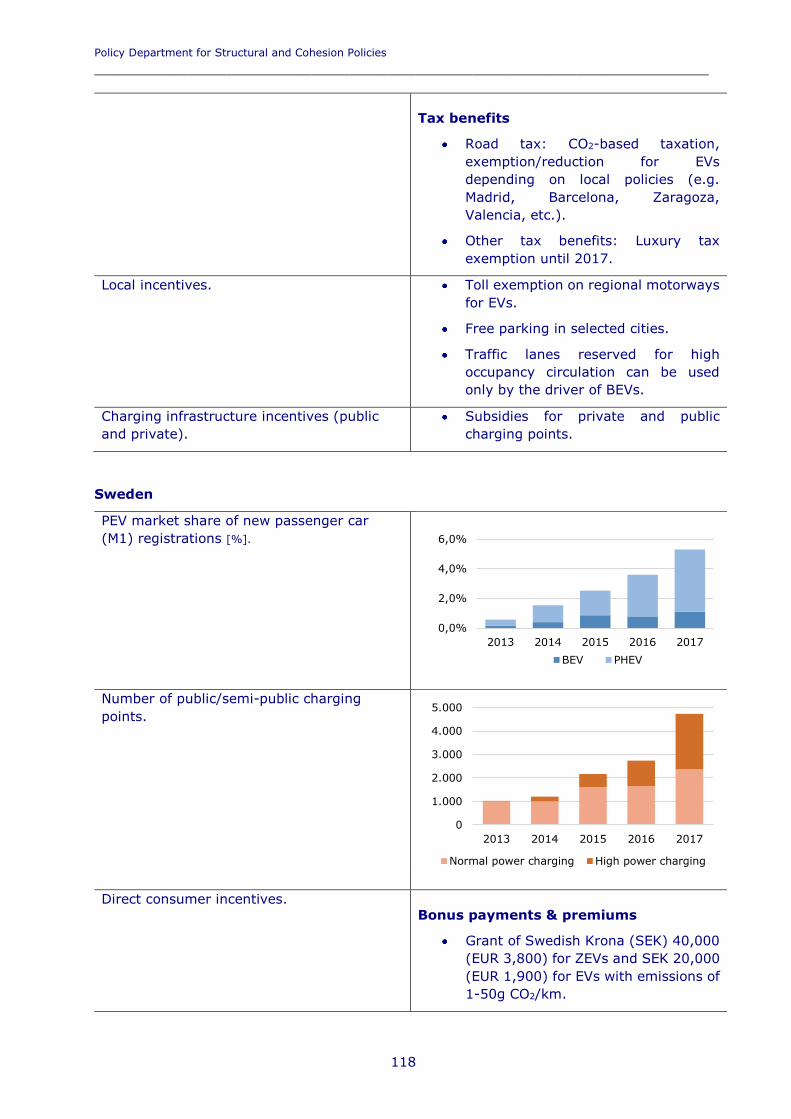
Policy Department for Structural and Cohesion Policies _________________________________________________________________
118
Tax benefits
Road tax: CO2-based taxation, exemption/reduction for EVs depending on local policies (e.g. Madrid, Barcelona, Zaragoza, Valencia, etc.).
Other tax benefits: Luxury tax exemption until 2017.
Local incentives. Toll exemption on regional motorways for EVs.
Free parking in selected cities.
Traffic lanes reserved for high occupancy circulation can be used only by the driver of BEVs.
Charging infrastructure incentives (public and private).
Subsidies for private and public charging points.
Sweden
PEV market share of new passenger car (M1) registrations [%].
Number of public/semi-public charging points.
Direct consumer incentives.
Bonus payments & premiums
Grant of Swedish Krona (SEK) 40,000 (EUR 3,800) for ZEVs and SEK 20,000 (EUR 1,900) for EVs with emissions of 1-50g CO2/km.
0,0%
2,0%
4,0%
6,0%
2013 2014 2015 2016 2017BEV PHEV
0
1.000
2.000
3.000
4.000
5.000
2013 2014 2015 2016 2017
Normal power charging High power charging
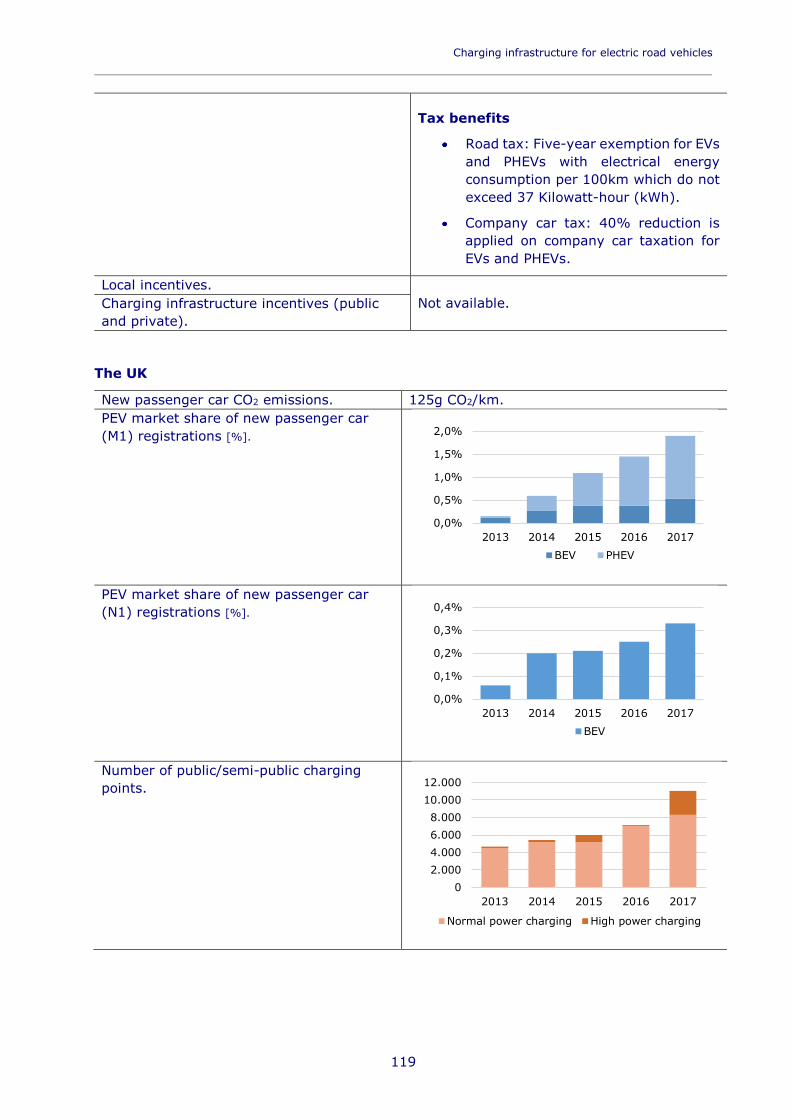
Charging infrastructure for electric road vehicles _________________________________________________________________________
119
Tax benefits
Road tax: Five-year exemption for EVs and PHEVs with electrical energy consumption per 100km which do not exceed 37 Kilowatt-hour (kWh).
Company car tax: 40% reduction is applied on company car taxation for EVs and PHEVs.
Local incentives. Not available. Charging infrastructure incentives (public
and private).
The UK
New passenger car CO2 emissions. 125g CO2/km. PEV market share of new passenger car (M1) registrations [%].
PEV market share of new passenger car (N1) registrations [%].
Number of public/semi-public charging points.
0,0%
0,5%
1,0%
1,5%
2,0%
2013 2014 2015 2016 2017BEV PHEV
0,0%
0,1%
0,2%
0,3%
0,4%
2013 2014 2015 2016 2017BEV
02.0004.0006.0008.000
10.00012.000
2013 2014 2015 2016 2017
Normal power charging High power charging
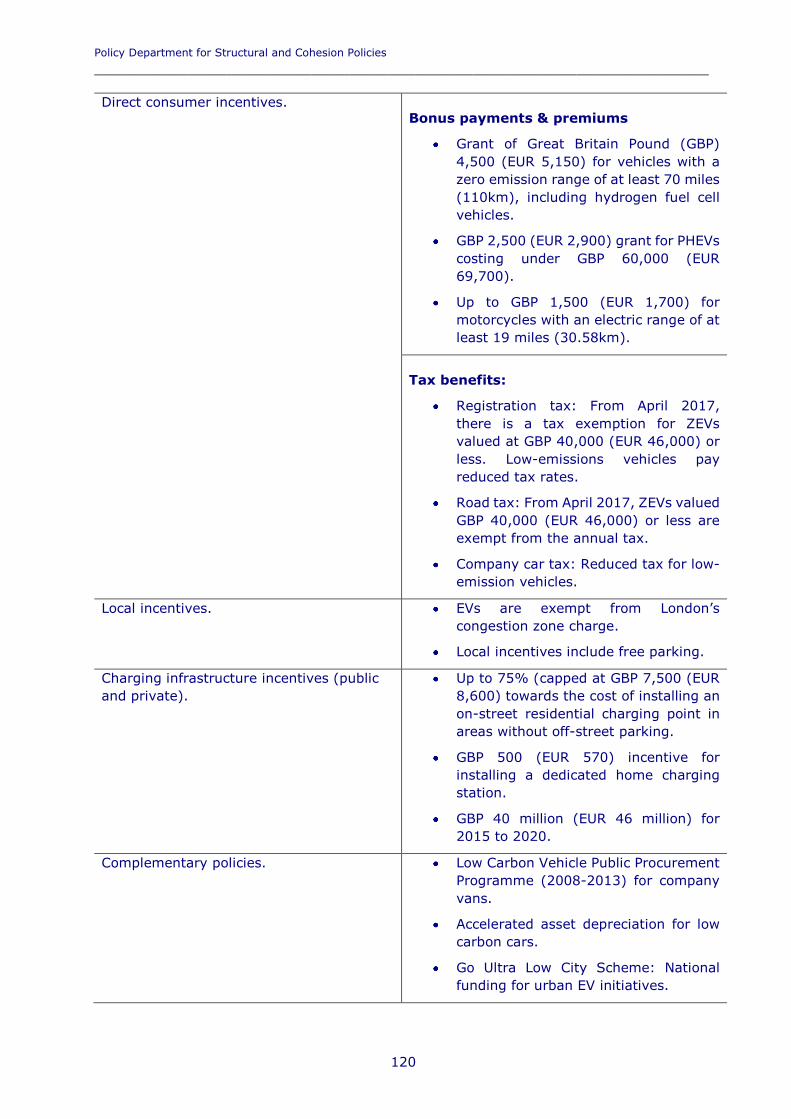
Policy Department for Structural and Cohesion Policies _________________________________________________________________
120
Direct consumer incentives. Bonus payments & premiums
Grant of Great Britain Pound (GBP) 4,500 (EUR 5,150) for vehicles with a zero emission range of at least 70 miles (110km), including hydrogen fuel cell vehicles.
GBP 2,500 (EUR 2,900) grant for PHEVs costing under GBP 60,000 (EUR 69,700).
Up to GBP 1,500 (EUR 1,700) for motorcycles with an electric range of at least 19 miles (30.58km).
Tax benefits:
Registration tax: From April 2017, there is a tax exemption for ZEVs valued at GBP 40,000 (EUR 46,000) or less. Low-emissions vehicles pay reduced tax rates.
Road tax: From April 2017, ZEVs valued GBP 40,000 (EUR 46,000) or less are exempt from the annual tax.
Company car tax: Reduced tax for low-emission vehicles.
Local incentives. EVs are exempt from London’s congestion zone charge.
Local incentives include free parking.
Charging infrastructure incentives (public and private).
Up to 75% (capped at GBP 7,500 (EUR 8,600) towards the cost of installing an on-street residential charging point in areas without off-street parking.
GBP 500 (EUR 570) incentive for installing a dedicated home charging station.
GBP 40 million (EUR 46 million) for 2015 to 2020.
Complementary policies. Low Carbon Vehicle Public Procurement Programme (2008-2013) for company vans.
Accelerated asset depreciation for low carbon cars.
Go Ultra Low City Scheme: National funding for urban EV initiatives.
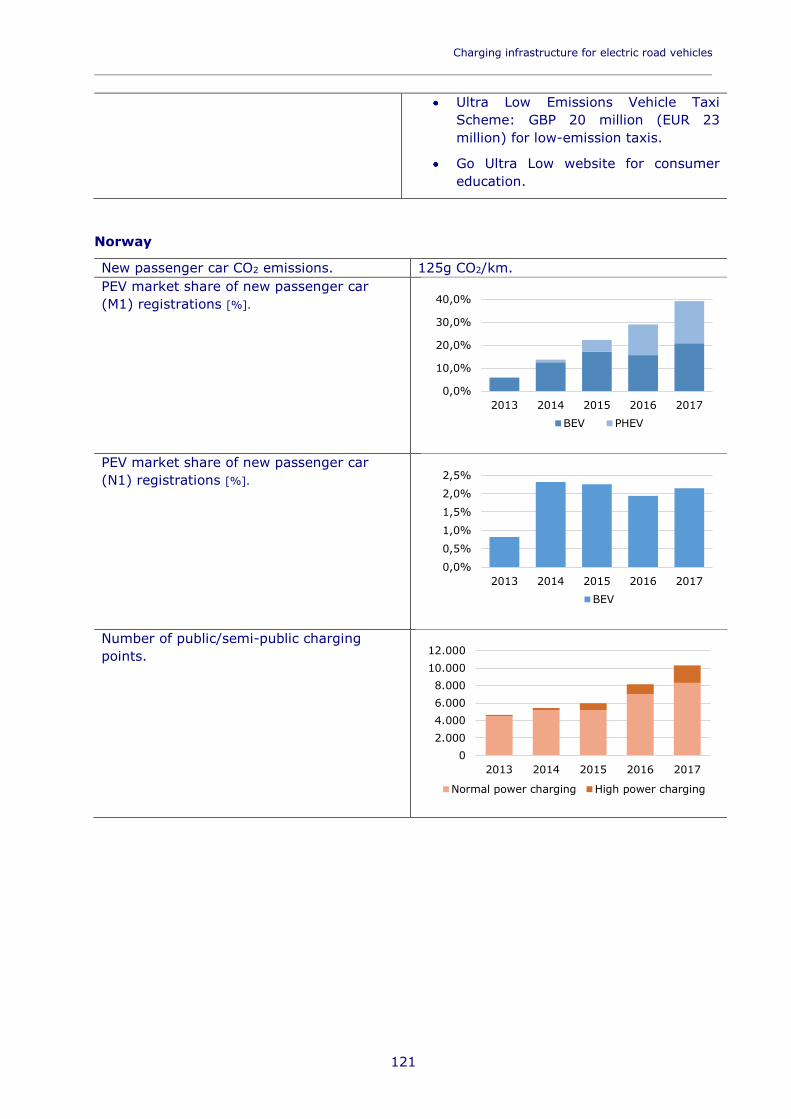
Charging infrastructure for electric road vehicles _________________________________________________________________________
121
Ultra Low Emissions Vehicle Taxi Scheme: GBP 20 million (EUR 23 million) for low-emission taxis.
Go Ultra Low website for consumer education.
Norway
New passenger car CO2 emissions. 125g CO2/km. PEV market share of new passenger car (M1) registrations [%].
PEV market share of new passenger car (N1) registrations [%].
Number of public/semi-public charging points.
0,0%
10,0%
20,0%
30,0%
40,0%
2013 2014 2015 2016 2017BEV PHEV
0,0%
0,5%
1,0%
1,5%
2,0%
2,5%
2013 2014 2015 2016 2017BEV
02.0004.0006.0008.000
10.00012.000
2013 2014 2015 2016 2017
Normal power charging High power charging

Policy Department for Structural and Cohesion Policies _________________________________________________________________
122
Direct consumer incentives. Tax benefits:
VAT: EVs are exempt from 25% VAT on purchase.
Registration tax: BEVs are exempt, PHEVs are eligible for a reduction of up to EUR 10,000.
Road tax: Reduced for EVs to EUR 45 annually (normal rate is at least EUR 280).
Company car tax: The basis for the company car tax is the vehicle’s full purchase price, which is reduced to 60% for EVs.
Local incentives. Some cities provide funding for normal charging stations in shared apartment buildings, parking garages, malls, etc.
Charging infrastructure incentives (public and private).
EUR 6 million invested by the state agency Enova in the deployment of public charging infrastructure.
Oslo invested EUR 2 million in municipal public charging.
Governmental programme to finance the deployment of at least two fast charging stations every 50km on all main roads in Norway by 2017.
Complementary policies. No charges on toll roads or ferries.
Free municipal parking.
Access to bus lanes.
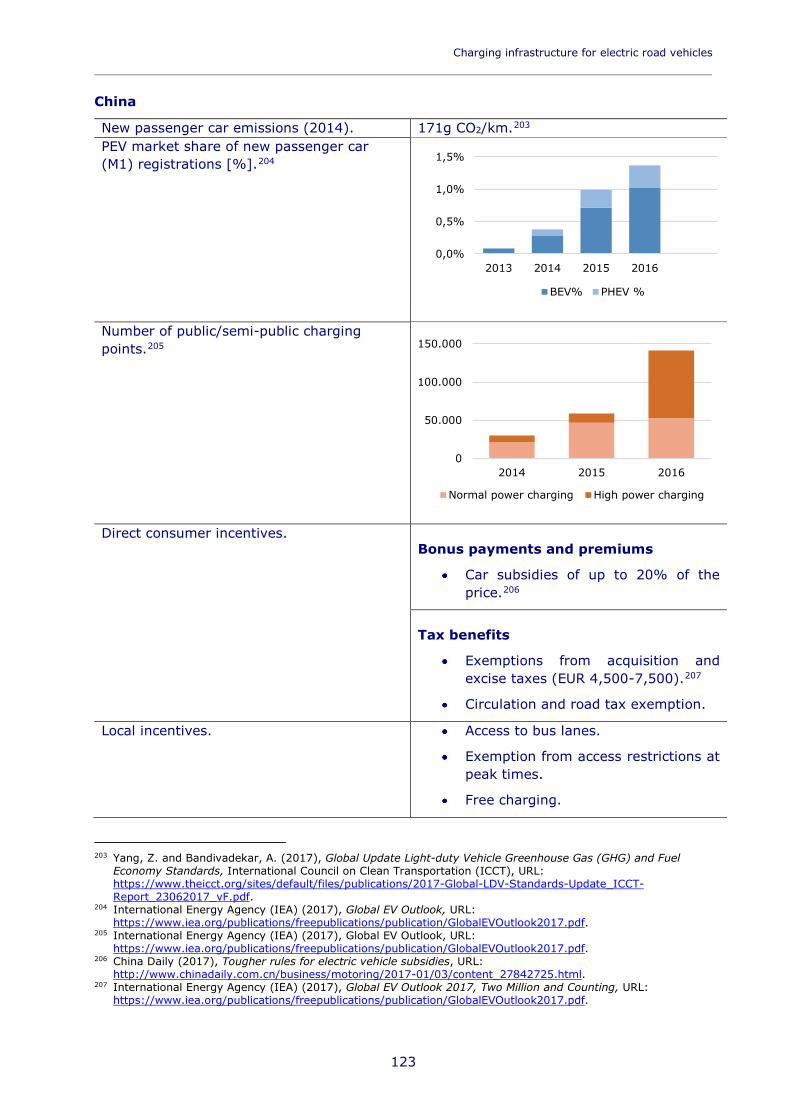
Charging infrastructure for electric road vehicles _________________________________________________________________________
123
China
New passenger car emissions (2014). 171g CO2/km.203 PEV market share of new passenger car (M1) registrations [%].204
Number of public/semi-public charging points.205
Direct consumer incentives.
Bonus payments and premiums
Car subsidies of up to 20% of the price.206
Tax benefits
Exemptions from acquisition and excise taxes (EUR 4,500-7,500).207
Circulation and road tax exemption.
Local incentives. Access to bus lanes.
Exemption from access restrictions at peak times.
Free charging.
203 Yang, Z. and Bandivadekar, A. (2017), Global Update Light-duty Vehicle Greenhouse Gas (GHG) and Fuel
Economy Standards, International Council on Clean Transportation (ICCT), URL: https://www.theicct.org/sites/default/files/publications/2017-Global-LDV-Standards-Update_ICCT-Report_23062017_vF.pdf.
204 International Energy Agency (IEA) (2017), Global EV Outlook, URL: https://www.iea.org/publications/freepublications/publication/GlobalEVOutlook2017.pdf.
205 International Energy Agency (IEA) (2017), Global EV Outlook, URL: https://www.iea.org/publications/freepublications/publication/GlobalEVOutlook2017.pdf.
206 China Daily (2017), Tougher rules for electric vehicle subsidies, URL: http://www.chinadaily.com.cn/business/motoring/2017-01/03/content_27842725.html.
207 International Energy Agency (IEA) (2017), Global EV Outlook 2017, Two Million and Counting, URL: https://www.iea.org/publications/freepublications/publication/GlobalEVOutlook2017.pdf.
0,0%
0,5%
1,0%
1,5%
2013 2014 2015 2016
BEV% PHEV %
0
50.000
100.000
150.000
2014 2015 2016
Normal power charging High power charging
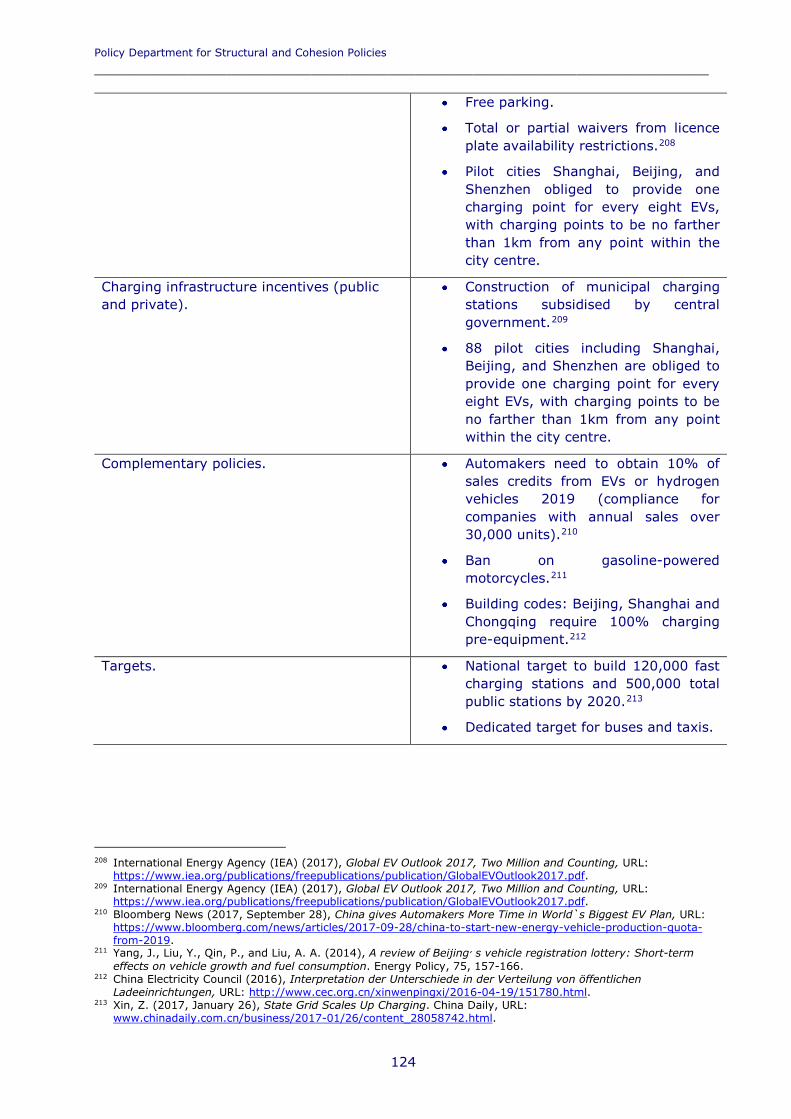
Policy Department for Structural and Cohesion Policies _________________________________________________________________
124
Free parking.
Total or partial waivers from licence plate availability restrictions.208
Pilot cities Shanghai, Beijing, and Shenzhen obliged to provide one charging point for every eight EVs, with charging points to be no farther than 1km from any point within the city centre.
Charging infrastructure incentives (public and private).
Construction of municipal charging stations subsidised by central government.209
88 pilot cities including Shanghai, Beijing, and Shenzhen are obliged to provide one charging point for every eight EVs, with charging points to be no farther than 1km from any point within the city centre.
Complementary policies. Automakers need to obtain 10% of sales credits from EVs or hydrogen vehicles 2019 (compliance for companies with annual sales over 30,000 units).210
Ban on gasoline-powered motorcycles.211
Building codes: Beijing, Shanghai and Chongqing require 100% charging pre-equipment.212
Targets. National target to build 120,000 fast charging stations and 500,000 total public stations by 2020.213
Dedicated target for buses and taxis.
208 International Energy Agency (IEA) (2017), Global EV Outlook 2017, Two Million and Counting, URL:
https://www.iea.org/publications/freepublications/publication/GlobalEVOutlook2017.pdf. 209 International Energy Agency (IEA) (2017), Global EV Outlook 2017, Two Million and Counting, URL:
https://www.iea.org/publications/freepublications/publication/GlobalEVOutlook2017.pdf. 210 Bloomberg News (2017, September 28), China gives Automakers More Time in World`s Biggest EV Plan, URL:
https://www.bloomberg.com/news/articles/2017-09-28/china-to-start-new-energy-vehicle-production-quota-from-2019.
211 Yang, J., Liu, Y., Qin, P., and Liu, A. A. (2014), A review of Beijing׳ s vehicle registration lottery: Short-term effects on vehicle growth and fuel consumption. Energy Policy, 75, 157-166.
212 China Electricity Council (2016), Interpretation der Unterschiede in der Verteilung von öffentlichen Ladeeinrichtungen, URL: http://www.cec.org.cn/xinwenpingxi/2016-04-19/151780.html.
213 Xin, Z. (2017, January 26), State Grid Scales Up Charging. China Daily, URL: www.chinadaily.com.cn/business/2017-01/26/content_28058742.html.
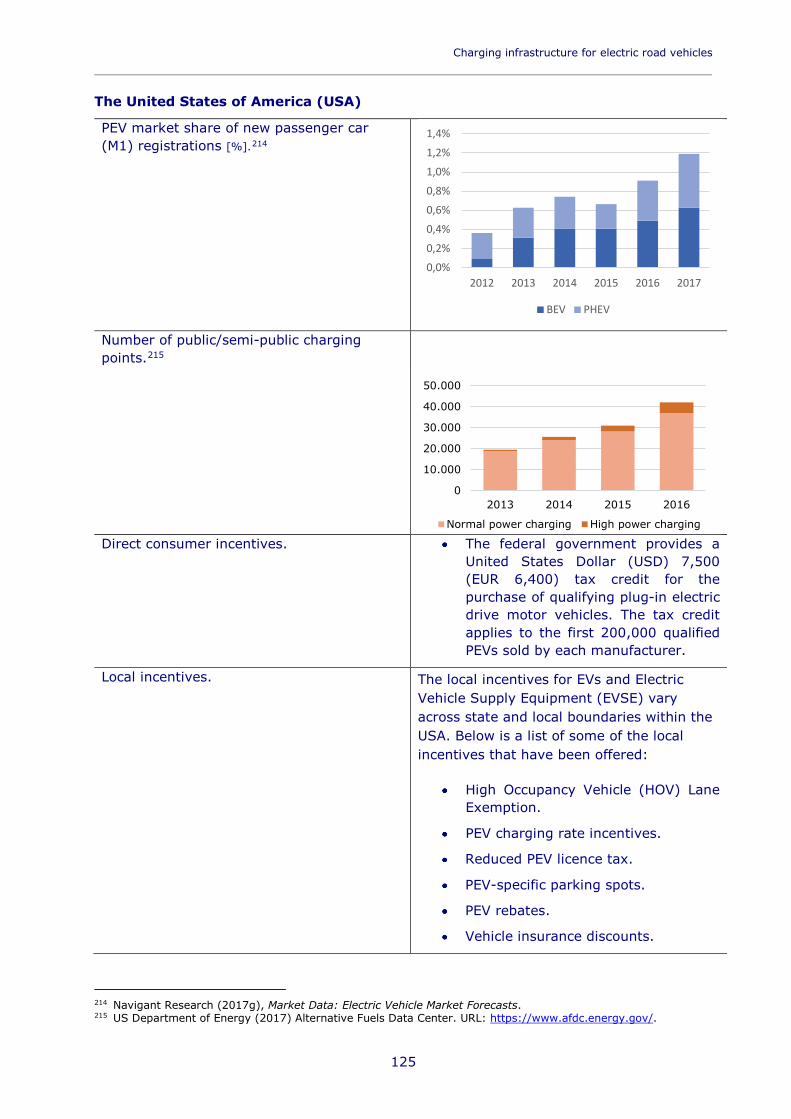
Charging infrastructure for electric road vehicles _________________________________________________________________________
125
The United States of America (USA)
PEV market share of new passenger car (M1) registrations [%].214
Number of public/semi-public charging points.215
Direct consumer incentives. The federal government provides a United States Dollar (USD) 7,500 (EUR 6,400) tax credit for the purchase of qualifying plug-in electric drive motor vehicles. The tax credit applies to the first 200,000 qualified PEVs sold by each manufacturer.
Local incentives. The local incentives for EVs and Electric Vehicle Supply Equipment (EVSE) vary across state and local boundaries within the USA. Below is a list of some of the local incentives that have been offered:
High Occupancy Vehicle (HOV) Lane Exemption.
PEV charging rate incentives.
Reduced PEV licence tax.
PEV-specific parking spots.
PEV rebates.
Vehicle insurance discounts.
214 Navigant Research (2017g), Market Data: Electric Vehicle Market Forecasts. 215 US Department of Energy (2017) Alternative Fuels Data Center. URL: https://www.afdc.energy.gov/.
0,0%
0,2%
0,4%
0,6%
0,8%
1,0%
1,2%
1,4%
2012 2013 2014 2015 2016 2017
BEV PHEV
0
10.000
20.000
30.000
40.000
50.000
2013 2014 2015 2016
Normal power charging High power charging
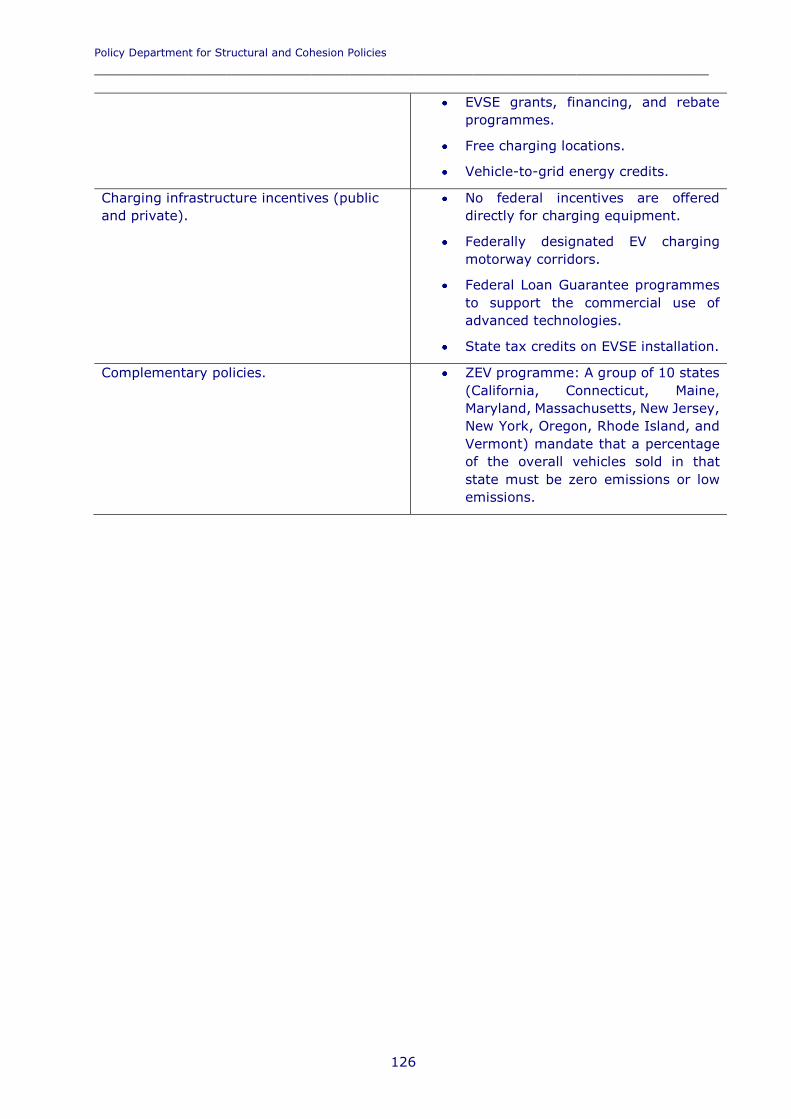
Policy Department for Structural and Cohesion Policies _________________________________________________________________
126
EVSE grants, financing, and rebate programmes.
Free charging locations.
Vehicle-to-grid energy credits.
Charging infrastructure incentives (public and private).
No federal incentives are offered directly for charging equipment.
Federally designated EV charging motorway corridors.
Federal Loan Guarantee programmes to support the commercial use of advanced technologies.
State tax credits on EVSE installation.
Complementary policies. ZEV programme: A group of 10 states (California, Connecticut, Maine, Maryland, Massachusetts, New Jersey, New York, Oregon, Rhode Island, and Vermont) mandate that a percentage of the overall vehicles sold in that state must be zero emissions or low emissions.


PE 617.470 IP/B/TRAN/2017-050
Print ISBN 978-92-846-2854-4 | doi:10.2861/013597 | QA-01-18-453-EN-C PDF ISBN 978-92-846-2855-1 | doi:10.2861/62486 | QA-01-18-453-EN-N
This study analyses the various challenges of the deployment of charging infrastructure within the EU. This includes existing technologies and standardisation issues, metering systems and pricing schemes, business and financing models, the impact of the charging infrastructure on the dissemination of Plug-in Electric Vehicles (PEVs), and the appropriateness of current technologies, business models, and public policies.