Embed Size (px)
Citation preview

Indian Commercial Vehicle Industry
“Factors -favorable or Unfavorable”
Submitted by-Gaurav Gupta

1
CONTENTS
Title Page number
Chapter-1 Introduction
1.1 Overview 3
1.2 What is shaping India’s commercial vehicle industry 4
1.3 Summary 4
Chapter-2 Research methodology
2.1 Introduction 5
2.2 Need for study 5
2.3 Statement of the problem 5
2.4 Research objectives 5
2.5 Hypothesis 6
2.6 Literature review 6
2.7 Survey method 7
2.8 Sampling 8
2.9 Data collection 9
2.10 Method of data analysis 9
2.11 Summary 9
Chapter-3 Data Analysis & Interpretation
3.1 Introduction 10
3.2 Demographic details of the respondents 10
3.3 Frequency of response 11
3.4 Descriptive statistics 11
3.5 Testing of hypothesis 12
3.6 Summary 17
Chapter-4 Summary, Finding, Conclusions and Recommendations
4.1 Summary 18
4.2 Findings 18
4.3 Limitation 18
4.4 Conclusions 19
4.5 Recommendation 20
Appendix A- Questionnaire 21

2
Executive Summary
Scope & objective
The aim of the study made through this project is to know the impact of the various
factors on the demand of commercial vehicles in India & use various statistical tools to
substantiate the results.
Research methodology
1. research design
2. sampling plan
3. instruments of collection of data
4. data analysis and interpretation
The questionnaire method is adopted for the collection of data. The level of agreement to
the 13 statements are allowed to mark in 5 point score Likert-scale. The sample has been
drawn from the population based on the judgment method. The duly filled questionnaire
is collected from the respondents. The frequency and descriptive statistical analysis of
responses are carried out. The statistical approach ANOVA, T test is used for the analysis
of responses.
Conclusion
Various factors contribute in the increase in sales & demand of commercial vehicles in
India & based on the questionnaire survey conducted we can conclude that manufacturing
process , freight rate , fuel price , road connectivity will affect the demand & sales of
commercial vehicles in India.
Limitation
Within the limit period of time it is too difficult to cultivate in a whole market. Cost is
also a major factor of pushing back to us in our research.
Recommendation
The research analysis recommended that the company & government may look into the
following aspects reviewed in this research in Likert-scale, to increase sales & demand of
commercial vehicles.
Improvement in manufacturing process
Reduction in freight rate
Reduction in fuel price
Reduction in interest rate
Improvement in road connectivity

3
Chapter 1
Introduction
1.1 Overview
The Indian commercial vehicles (CV) industry has a long history, possibly dating back to
the passenger vehicles industry. Telco, the first entrant in the segment, continues to be the
largest till date, with a market reach unrivalled by its competitors. Telco pioneered
production of commercial vehicles in the country with technical collaboration with
Daimler-Benz of Germany in 1954.
The industry has made a significant contribution to the country’s industrialization and
progress. In fact, India achieved self-sufficiency in commercial vehicles, except in the
high-tonnage classes, where the demand has nonetheless been limited. The entry of
Ashok Leyland, with technology from British Leyland, marked the beginning of
competition in the truck and bus segment
Emerging from a two year down cycle
After two years of down cycle, some segments of the domestic Commercial Vehicle (CV)
industry have shown signs of recovery in FY 2015. In the first ten months of the fiscal,
the pace at which domestic CV sales have been declining has reduced to 4.6% compared
to a contraction of 20.2% witnessed during FY 2014(Exibit-1). Within the CV space, the
Medium & Heavy Commercial Vehicle (M&HCV) Truck segment has in fact posted
a positive growth of 19.0% in 10m FY 2015 while the HCV (16T+) segment,
which accounts for almost half of total M&HCV (Truck) sales has been witnessing
strong demand (up 42.6% in 10m FY 2015) on back of replacement demand (following
two years of deferment) and capacity addition by organized fleet operators to
some extent.
While the M&HCV Truck segment seems to have bottomed out, the LCV Truck
segment is still experiencing sluggish trends (down13.8% YoY) as significant
capacity addition over the past few years and constrained financing environment amidst
rising delinquencies remains a challenge for the segment.

4
1.2 What is shaping India’s commercial vehicle industry?
After a few years of strong growth, the Indian commercial vehicle (CV) industry hit a
rough patch last year, impacted by the overall economic slowdown, delay in
infrastructure projects and weak investment sentiment. However, the industry has long-
term growth potential, subject to the economy accelerating back to 7–8% GDP growth
per annum and the government expediting policies that support growth in manufacturing
and infrastructure development While deregulation of diesel prices will make the industry
dependent on subsidies, it is likely to create demand uncertainty in the short-term as truck
owners and manufacturers adjust to the new normal
To prepare for the years ahead, industry participants in the Indian CV industry should
answer the following questions to evaluate how well they are positioned to respond to the
emerging opportunities and challenges:
How will the demand & sales of trucks (Heavy vehicles) evolve?
How will products need to adapt?
How will business models need to adapt?
What are the new market dynamics?
What are the supply or value chain issues and implications?
With respect to above industry analysis we had identified following mega trends that are
likely to impact and change the face of the Indian CV industry
1.3 Summary
In this context we will identify the most important factors among the 6 factors that will
impact the sales & demand of commercial vehicles in India. With this project we also
identify new factors that can impact the demand of commercial vehicles in India

5
Chapter 2
Research methodology
2.1. Introduction
According to Green and Tall “A research design is the specification of the methods and
procedures for acquiring the information needed. It is the overall operational pattern or
framework of the project that stipulates which information is to be collected, from where
it is to be collected and by what procedures.”
The research methodology used is to evaluate the accuracy and effectiveness of the
findings & its effect on demand of commercial vehicles. The quantitative data is collected
by questionnaire method from a convenience sample. The responses are analyzed and
arrived at conclusions
2.2. Need for study
1. Crucial role in Make in India campaign
2. Very crucial for Indian growth story as it is a major component of supply chain of
goods and transport
3. The project is of interest to both domestic and international automobile
manufacturers
2.3 Statement of purpose
The study is aimed at to evaluate the various factors which affect the demand & sales of
commercial vehicle in India.
2.4 Research objectives
It’s always better to start your search with a predefined objective, rather than beating
around the bush. An objective will give you a direction to work upon and proceed your
further research. Therefore, my project objective is,
Identify the various factors which affect the demand & sales of the commercial
vehicles in India.
Illustrate the way in which the identified factors affect the commercial vehicles.

6
2.5 HYPOTHESIS
The suggested hypothesis for each of the research objectives is developed .The
hypothesis as per the research objectives are as follows
a) Interest rate , Fuel price & Freight rate will impact the sales of CV
b) Goods Roads and connectivity will improve sales of CV
c) Regulatory (legal) provisions will impact sales of CV.
d) Improvement in manufacturing process will increase sales of CV
2.6 LITERATURE REVIEW
The literature review is conducted to identify the similarities & differences among the
articles in research results, theoretical claims & methodological approaches. It will also
help us identify the open questions or directions for further research that authors identify
or questions that warrant further investigation. The literature review also explains the
relationship between material in the articles & research questions. The literature review is
helps to identify various gaps & limitation which will affect our research. The literature
review for our research is given below,
7
The various findings from the literature are as follows,
1. The improvement in freight rate & infrastructure projects will increase the demand for
commercial vehicles in India.
2. The reduction in the interest rate & excise duty will bring back buyers.
3. Export to BRIC countries will improve sales
4. Improvemnet in manufacturing processes will result in high sales.
2.7 SURVEY METHOD
The research process based on primary data analysis and secondary data analysis will be
clearly defined to meet the objectives of the study.
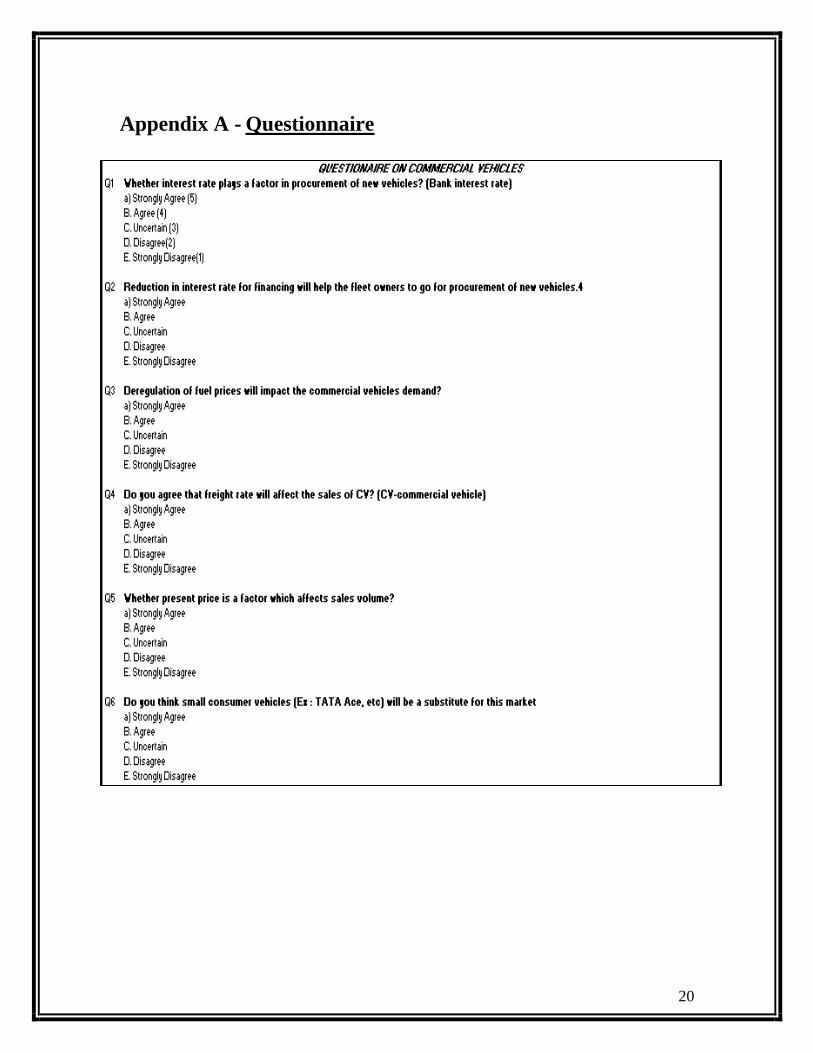
1. Primary survey method- A questionnaire was designed in accordance with our
mentor in MDI. I chose a sample of about 50 respondent customers around the Delhi
NCR region from which I can get the instant information of whose analysis will give me
the desired outcome of my research project.
The questionnaire based survey is used in this study. The data collection and analysis is
carried-out based on statistical theories. The questionnaire is composed of 13 questions to
evaluate the response of the employees. The questionnaire was issued in person. The
questionnaire consists of different types of questions. The information about
demographic data of the participants is gathered using multiple choice questions (closed),
for which the respondents are required to tick the right answers. Demographic questions
are used to correlate the response between different types of groups. This is very
important to find whether the responses are consistent across the group. The main part of
the questionnaire, which is related to the hypothesis of the thesis, consists of likert-scale
questions. Answer to these questions helps to find how strongly the respondents agree
with the particular statement. The answers of the questions are based on the five-level
scale and options are strongly agree, agree, neither agree nor disagree, disagree, strongly
disagree. The questionnaire is given in Appendix A
1. Secondary survey method -collected some data from the secondary sources like
published Company documents, internet, literature etc. to substantiate my primary
data.
2.8 Sampling
In statistics and survey methodology, sampling is concerned with the selection of a subset
of individuals from within a statistical population to estimate characteristics of the whole
population. Two advantages of sampling are that the cost is lower and data collection is
faster.

8
Probability samples are selected from the population and are considered as the
representative of the population. They provide the most valid or credible results because
they reflect the characteristics of the population from which they are selected. Non-
probability samples are not truly representative and less desirable than probability
samples. Non-probability samples are used when a researcher may not be able to obtain a
random or stratified sample, or it may be too expensive. A researcher may not care about
generalizing to a larger population. The validity of non-probability samples can be
increased by trying to approximate random selection, and by eliminating as many sources
of bias as possible.
In this study, judgment sampling is used. Judgment sampling is a non-probability
sampling technique where the researcher selects the sample based on judgment. In this
method, the researcher may decide to draw the entire sample from one "representative"
group identified, even though the population includes all such groups. When using this
method, the researcher must be confident that the chosen sample is truly representative of
the entire population. In the present study, the response was collected from the people in
& around the Delhi NCR region. Out of the sample population of 100 people, 50 people
responded. The response of 50 people was collected with the aid of questionnaire.
2.9 Data collection
The information in the thesis is collected by questionnaire method. The questionnaire was
composed of 13 questions relating to the parameters, interest rate, fuel price, freight rate,
operational efficiency, inventory management, after sales service, road connectivity. The
paper copies of questionnaire were given in hand to the respondents as well as online
survey is floated and requested to fill up.
The questionnaire consists of different types of questions. The information about
demographic data of the participants is gathered from the multiple choice question
(closed), for which just required that right answers be ticked by the respondents. The
main part of the questionnaire, which is focused to evaluate the postulates given in the
hypothesis, consists of Likert-scale questions. These questions help to find how strongly
the respondents agree with the particular statement. The answers to the questions are
based on the five-level scale and the options are strongly agree, agree, nether agree nor
disagree, disagree and strongly disagree.
2.10 Method of data analysis
The statistical analysis of the data collected based on the questionnaire is carried out. The
frequency of the responses is determined and compared. The score was assigned to the
options strongly agree, agree, nether agree nor disagree, disagree and strongly disagree
are 5 to 1. The minimum, maximum, mean, standard deviation and variance of the scores
of the responses corresponding to each statement is computed and reported in this thesis.
The descriptive statistical analysis is carried out using SPSS software.

9
Cronbach's alpha is a measure of internal consistency, that is, how closely related a set of
items are as a group. Cronbach's alpha is coefficient or reliability. Cronbach's alpha is
given by
2
X
N
1i
2
iY
11N
N
where N is the number of components or statements and equal to 50 persons in the
present study. 2
X is the variance of observed test score and 2
iY is the component i in
the sample of persons.
Pearson’s correlation coefficient (r) is given by
n
1i Y
i
X
i YYXX
1N
1r
where
X
i XX
, X and X are the standard score, sample mean, and sample standard
deviation, respectively.
ANOVA is use to test the hypothesis the computation details for testing more than 2
parameters while T test is used for testing of 1 parameter or 2 parameters.
2.11 SUMMARY
The various aspects of design of experiments are described. The questionnaire method is
adopted for the collection of data. The level of agreement to the 13 statements are
allowed to mark in 5 point score Likert-scale. The sample has been drawn from the
population based on the judgment method. The duly filled questionnaire is collected from
the respondents. The frequency and descriptive statistical analysis of responses are
carried out.

10
Chapter 3
DATA ANALYSIS AND INTERPRETATIONS
3.1 Introduction
The duly filled-up questionnaire was collected from 50 respondents in & around the
Delhi NCR region. The data of response is analyzed using SPSS & Microsoft excel
software. The ratio of the response to the total number of respondents is computed and
expressed in percentage. The response for the questions related to the subject area of the
study is collected in Likert-scale. The descriptive statistical method is also used to
analyze the data. The minimum, maximum, mean, standard deviation and variance have
been computed based on the five point scale response of the respondent.
3.2 Demographic details of the respondents
The first part of the questionnaire was designed to collect the demographic details of the
respondents. The demographic information gives the details of gender, age, education and
experience. The demographic information of the respondents are given in
Table .1. Gender statistics
The gender statistics of the respondents are given in Fig 5.1. The male respondents are
found to be 90 percent.
The age statistics of the respondents is given in Fig 5.2. The respondents having formal
age less than 35 years is found to 98 percent.

11
The education statistics of respondents is given in Fig 5.3. The managers having formal
education greater than bachelors degree is found to 100 percent. The majority of the
respondents are well educated.
3.3 FREQUENCY OF response
The second part of the questionnaire is connected with hypothesis of the research. There
were 13 statements on various aspects of factors impacting the demand of commercial
vehicles in India and the respondents are requested to tick the level of agreement or
disagreement in a Likert scale.
3.4 Descriptive statistics
The statements in the questionnaire have been reviewed statistically. Descriptive statistics
quantitatively describes the main features of a collected data. For this purpose, the scores
assigned to various options are as follows:- 5 to ‘strongly agree’, 4 to ‘agree’, 3 to
‘neither agree or disagree’, 2 to ‘disagree’ and 1 to ‘strongly disagree’. The Descriptive
analysis is represented by maximum, minimum, standard deviation and variance
Statistics of scores of response for statements in questionnaire is given below in FigureA

12
The minimum score for every statement in the questionnaire is given in second column of
Figure A. The highest score in second columns is 3, which corresponds to the response
‘uncertain’ and is for statement no. 1. The lowest score in the second column is 1, which
corresponds to the response ‘disagree’, and is for statement number 4 & 10. This
indicates that there is scope for improvement for the parameters pointed out in statement
number 4 & 10. The maximum score of the statements are given in third column of
Figure A. The maximum score for all statements is 5, which corresponds to the response
‘strongly agree’.
The mean of score is given in fourth column of Figure A. Higher the magnitude of mean
indicates that higher is the level of agreement on the statement and vice versa. Highest
magnitude of means is found to be 4.14 and is for statement number 8. This indicates that
the improvement in safety standards of commercial vehicles will improve sales. The
lowest magnitude of mean is found to be 3.14 and is found to be for statement number 4.
This indicates that availability of substitutes affect the sales only marginally. .
The standard deviation and variance of the score data indicate the spread of the data from
the mean and is given in Figure A. The deviation is 0.528 for statement number 1. This
indicates that the low interest rate & easy financing will increase the demand &
procurement of commercial vehicles. The deviation is 0.953 for statement number 7. This

13
indicates that toll rate will not have large effect on demand & a sale of commercial
vehicles.The variance is indicative of variation from the mean. The variance is correlated
standard deviation; the arguments placed for standard deviation can be extended to
variance also 3.5 Testing of hypothesis
The initial questionnaire testing is given in Figure B. The hypothesis of the research work
was
e) Interest rate , Fuel price & Freight rate will impact the sales of CV
f) Goods Roads and connectivity will improve sales of CV
g) Regulatory (legal) provisions will impact sales of CV.
h) Improvement in manufacturing process will increase sales of CV.
The range of scores of the responses is 2 to 5. The magnitude of mean of scores is an
indication to the overall satisfaction level of respondent. The mean of scores is 3.687,
which is greater than mid value of maximum score (equal to 2.17).The deviation of
collected data from the mean is low and hence the interpretation based on mean is can be
acceptable. The variance is 0.801. Cronbach’s alpha is 0.754, a magnitude greater than
0.7 indicates that the data is reliable for testing the hypothesis.
The research hypothesis is to study the level of satisfaction of employees on the
performance appraisal of the company. The aspect of satisfaction is explicitly stated in
the questionnaire.
Hypothesis 1: Interest rate, Fuel price & Freight rate will impact the sales of Commercial vehicles
1. Reduction in interest rate will help the fleet owners to go for procurement of
new vehicles.
2. Deregulation of fuel prices will impact the commercial vehicles demand?
3. Do you agree that freight rate will affect the sales of CV? (CV-commercial
vehicle)
Parameter-1 Interest rate
Parameter-2 Fuel price
Parameter -3 Freight rate
The responses of the various statements in the questionnaire are combined to evaluate
each parameter. The sum of the scores of responses of statements is assumed to be the

14
response of each of three parameters. The statistical analysis, namely, correlation
coefficient and ANNOVA F-test are carried out.
Analysis of variance is carried out for testing the hypothesis. F-statistics of the responses
for satisfaction and paratemeters1 to 3 is computed for testing hypothesis.
The null hypothesis is:-
The demand & sales of commercial vehicles is unrelated to Interest rate bank
charge for procurement of vehicle.
The demand & sales of commercial vehicles is unrelated to Fuel price
The demand & sales of commercial vehicles is unrelated to Freight rate.
Impact
N Mean Std.
Deviation
Std.
Error
95% Confidence Interval for
Mean
Minimu
m
Maximu
m
Lower Bound Upper Bound
interest
rate 50 3.92 .528 .075 3.77 4.07 3 5
fuel price 50 3.90 .580 .082 3.74 4.06 2 5
freight rate 50 3.76 .822 .116 3.53 3.99 2 5
Total 150 3.86 .656 .054 3.75 3.97 2 5
ANOVA
Impact
Sum of Squares Df Mean Square F Sig.
Between Groups .760 2 .380 .882 .416
Within Groups 63.300 147 .431
Total 64.060 149
The calculated F-value & significant value of ANOVA is given in Table 1. It may be
noted that the calculated significant value is 0.416, which indicate that the null hypothesis
is accepted and it may be concluded that the parameters, namely, interest rate, fuel price
& freight rate are not related to the demand of commercial vehicles.
Hypothesis 2: Goods Roads and connectivity will improve sales of CV
1. Roads connectivity will increase the sales & demand for commercial vehicle.
2. Good roads will increase the demand for commercial vehicle in a
Parameter-1 Roads connectivity
Parameter-2 Good roads
The responses of the various statements in the questionnaire are combined to evaluate
each parameter. The sum of the scores of responses of statements is assumed to be the
response of each of three parameters. The statistical analysis, namely, independent T test
will be used for statistical analysis.

15
Analysis of variance is carried out for testing the hypothesis. T test statistics of the
responses and paratemeters1 to 2 is computed for testing hypothesis.
The null hypothesis is:-
The demand & sales of commercial vehicles is unrelated to roads connectivity.
The demand & sales of commercial vehicles is unrelated to good roads.
The calculated significant value of T test is given in Table 1. It may be noted that the
calculated significant value is 0.143, which indicate that the null hypothesis is accepted
and it may be concluded that the parameters, namely, good road connectivity is not
related to the demand of commercial vehicles.
Hypothesis 3: Improvement in manufacturing process will increase sales of CV
1. Do you agree that improvement in operational efficiency will address demand?.
2. Efficient inventory management, i.e., keeping stock ready as soon as order is
placed, will enable increase in sales volume.
3. Do you agree that Focus on after-sales service will create demand of CV? (CV-
commercial vehicle).
Parameter-1 operational efficiency
Parameter-2 Inventory Management
Parameter-3 After sales service
The responses of the various statements in the questionnaire are combined to evaluate
each parameter. The sum of the scores of responses of statements is assumed to be the

16
response of each of three parameters. The statistical analysis, namely, correlation
coefficient and ANNOVA F-test are carried out.
Analysis of variance is carried out for testing the hypothesis. F-statistics of the responses
for satisfaction and paratemeters1 to 3 is computed for testing hypothesis.
The null hypothesis is:-
The demand & sales of commercial vehicles is unrelated to operational efficiency.
The demand & sales of commercial vehicles is unrelated to inventory
management.
The calculated F-value & significant value of ANOVA is given in Table 3. It may be
noted that the calculated significant value is 0.310, which indicate that the null hypothesis
is accepted and it may be concluded that the parameters, namely, operational efficiency,
inventory management,& after sales service are not related to the demand of commercial
vehicles
Hypothesis 4: Goods Roads and connectivity will improve sales of CV
1. Do you agree that CV which don’t follow statutory regulation of emission, there
demand will decrease?
2. Do you agree that CV (trucks) safety standards in vehicles will impact demand?
Parameter-1 Emission standard
Parameter-2 safety standard
The responses of the various statements in the questionnaire are combined to evaluate
each parameter. The sum of the scores of responses of statements is assumed to be the

17
response of each of three parameters. The statistical analysis, namely, independent T test
will be used for statistical analysis.
Analysis of variance is carried out for testing the hypothesis. T test statistics of the
responses and paratemeters1 to 2 is computed for testing hypothesis.
The null hypothesis is:-
The demand & sales of commercial vehicles is unrelated to emission standard.
The demand & sales of commercial vehicles is unrelated to safety standard.
The calculated significant value of T test is given in Table 1. It may be noted that the
calculated significant value is 0.041, which indicate that the null hypothesis is rejected
and it may be concluded that the parameters, namely, safety standards & emission rate is
related to the demand of commercial vehicles.
3.6 Summary
The data analysis & interpretation shows that our hypothesis that interest rate, fuel price,
freight rate, operational efficiency, inventory management, after sales service, road
connectivity will impact the sales & demand of commercial vehicles is accepted while
hypothesis that statutory regulations such as emission & safety standards is rejected.

18
Chapter 4
2. Summary, findings, CONCLUSIONS AND
RECOMMENDATIONS
4.1 Summary
The effect of various factors on the demand & sales of commercial vehicles is studied..
The factors influencing the demand of commercial vehicles are identified. The
parameters, namely, interest rate , fuel price , freight rate , operational efficiency ,
inventory management , after sales service , statutory regulations(such as emission ,
safety) , substitutes , toll price ,road connectivity are considered for the analysis. A
questionnaire containing 13 statements is prepared and the response is collected. The
frequency of the responses is analyzed. The responses are mapped to a 5 point score
Likert’s scale. The descriptive statistical analysis of the score of the responses is carried
out using correlation, ANOVA, T test approaches.
4.2 FINDINGS
The findings of the questionnaire based research are:-
1. Majority of the respondent is males.
2. Majority of the respondent are in the age group of 25 to 35 years
3. Majority of the respondents is having formal education more than bachelors
degree
4. The descriptive statistical analysis indicated that the mean of the score is greater
than 3.0 for all 13 statements in the questionnaire
5. The standard deviation of the score is less than 1.0 for all 13 statements in the
questionnaire.
6. The mean score for all the questions and all the respondents is found to 3. 97.
7. The ANOVA indicated that the interest rate, fuel price & freight are not correlated
with demand of commercial vehicles with 95% confidence level.
8. The ANOVA indicated that the operational efficiency, after sales service &
inventory management are not correlated with demand of commercial vehicles
with 95% confidence level.
9. The T test indicated that the roads connectivity & demand of commercial vehicles
are not correlated.
10. The T test indicated that the statutory regulations such as emission rate, safety
standard are related to demand of commercial vehicles.

19
4.3 Limitation of the study
1. Money was the major constraint during my project.
2. Duration of the study also limited for further intensive study.
3. Mostly stress was given on primary data collection and it was difficult to collect
secondary data from organization and dealers.
4. Limited coverage area was also a major constraint while conducting the study.
4.4 Conclusion
The analysis of the research suggests that fair improvement in various factors such as
interest rate, fuel price, freight rate, operational efficiency, inventory management, after
sales service, road connectivity is required to improve the demand of commercial
vehicles in India. Based on the questionnaire survey conducted, it can be concluded that
manufacturing process, roads connectivity, & reduction in freight rate, fuel price, and
interest rate will not affect the sales & demand of commercial vehicles.
4.5 Recommendation
The research analysis is done on the sample of 50 respondents which is not the correct
representation of the entire population so we can recommend that more responses are
required to correctly predict the factors responsible for the increase in the demand of
commercial vehicle.
Based on questionnaire & sample selected we predict that factors such as interest rate,
fuel price, freight rate, operational efficiency, inventory management, after sales service,
road connectivity will not affect CV demand while statutory regulation such as emission
& safety standards will affect the demand.
So further research & analysis is recommended for the research topic.
20
Appendix A - Questionnaire