Embed Size (px)
Citation preview
a SpringerOpen Journal
Ayolabi et al. SpringerPlus 2013, 2:433http://www.springerplus.com/content/2/1/433
RESEARCH Open Access
Mapping saline water intrusion into the coastalaquifer with geophysical and geochemicaltechniques: the University of Lagos campus case(Nigeria)Elijah A Ayolabi1, Adetayo F Folorunso1,2*, Abiodun M Odukoya1 and Adelere E Adeniran3
Abstract
Saltwater intrusion into the coastal aquifer, a phenomenon brought by the flow of seawater into freshwateraquifers originally caused by groundwater extraction near the coast, has long been recognised as a major concernaround the world. In this study, we employed geophysical and geochemical techniques to map and provideevidences that the coastal aquifers in the study area have been intruded by saltwater from the adjacent Lagoslagoon. The resistivity data were acquired with an electrode spacing (a) that vary between 1.6 to 8 m, andexpansion factor n of 30. The depth inverted models obtained from inversion of the fifteen resistivity data obtainedin the area revealed significant impact of the lagoon water on the aquifers indicated as low resistivity usually below7 Ωm. A combination of four different electrode arrays – Schlumberger, Wenner, Dipole-dipole and pole–dipole,with at least three deployed at each site ( except for three traverses – traverses 13, 14 and 15), yield betterhorizontal and vertical resolution, having depth range of 36–226 m with 1.6–8 m electrode spacing used. Thedelineated geoelectric layers were juxtaposed with logs from both boreholes located within the campus. Evidencefrom geochemical study of borehole and the lagoon water samples corroborated the ERT result. Progressivedecrease in total dissolved solute (TDS) and electrical conductivity (EC) from the lagoon to the coastal aquiferbuttresses gradual encroachment of the inland aquifers by the intruding lagoon water. In addition, similar trendwas observed in heavy metal distribution Pollution Index (PI) plot suggesting possible underground flow of waterfrom the lagoon to the aquifers. From this study, we deduced that excessive groundwater extraction and possiblythe reduction of groundwater gradients which allows saline-water to displace fresh water in the aquifer of theinvestigated area are responsible for the saline water intrusion observed.
Keywords: Saltwater intrusion; ERT; Coastal aquifer; Geochemical study; Pollution index; Delineation
IntroductionSaltwater intrusion into the coastal aquifer has long beenrecognised as a major concern around the world. The in-trusion occurs as a result of the induced flow of seawaterinto freshwater aquifers originally caused by groundwaterdevelopment around the coast (Al Barwani and Helmi,2006). The induced gradients usually cause migration of saltwater from the sea toward a borehole where groundwater
* Correspondence: [email protected] of Geosciences, University of Lagos, Lagos, Nigeria2College of Marine Geosciences, Ocean University of China, Qingdao 266003,ChinaFull list of author information is available at the end of the article
© 2013 Ayolabi et al.; licensee Springer. This isAttribution License (http://creativecommons.orin any medium, provided the original work is p
is being pumped from aquifers that are in hydraulic con-nection with the sea (Abdalla et al., 2010). This will defin-itely make the freshwater in the well unusable and thushamper the development of potable water for municipaluse. Almost two thirds of the world’s population are saidto be living within 400 km of the ocean shoreline and justover half live within 200 km, an area only taking up 10%of the earth’s surface (Hinrichsen, 2007). These coastaldwellers depend largely on groundwater as main source offresh water for daily survival, industrial and agriculturalpurposes; a development that could lead to excessivegroundwater extraction.
an Open Access article distributed under the terms of the Creative Commonsg/licenses/by/2.0), which permits unrestricted use, distribution, and reproductionroperly cited.
Ayolabi et al. SpringerPlus 2013, 2:433 Page 2 of 14http://www.springerplus.com/content/2/1/433
Basically, fresh water is less dense than salt water and soit floats on top. Therefore, saline water is found belowfresh water discharge from higher altitude in coastal areas.Also, the boundary between salt water and fresh water isnot distinct; the zone of dispersion, transition zone, or salt-water interface is brackish with salt water and fresh watermixing. It then means that salinity will increase with depthwhere both fresh water and saline water occur. As such,the increase in salinity will produce consequent decreasein electrical resistivity of water, and thus resistivity varieswith depth within groundwater well in coastal aquifer.These variations could then be mapped by methods cap-able of detecting differences in salinity. Thus, we employed
Figure 1 a) The geography of the University of Lagos campus b) The
electrical resistivity, geochemical and physical measure-ments of well water and seawater samples in this work.Electrical methods have been used to solve problems re-
lated to environmental studies, especially relating to con-tamination of subsurface soil and groundwater and aquifervulnerability (Loke, 2004; Sorensen et al., 2005; Atakpoand Ayolabi, 2009; Gemail et al., 2011, Vaudelet et al.,2011). Vulnerability of groundwater aquifer is defined asthe susceptibility of a given aquifer to pollution (Younger,2007). Many authors see aquifer vulnerability from the per-spective of anthropogenic input into groundwater, espe-cially from the surface, without recourse to undergroundmovement of materials (soil, minerals and water) – internal
University building showing the Lagoon and some ERT lines.
Ayolabi et al. SpringerPlus 2013, 2:433 Page 3 of 14http://www.springerplus.com/content/2/1/433
erosion devoid of human influence. Sjödahl, et al. (2008)noted that the knowledge of the temporal development ofinternal erosion is limited. In coastal regions, many factorscontribute to such movement which include, but not lim-ited to, salt water intrusion owing to massive withdrawalfrom the adjoining inland groundwater aquifers.
Geology setting and site descriptionUniversity of Lagos is located within Lagos, SouthwesternNigeria. Geographically, the campus is surrounded bywater bodies; lagoon and creek, and has large tract of land(Figure 1a and b). It is generally low-lying and charac-terized by torrential rainfall and a shallow water table(as shallow as 0.5 m around the coast). The geology of thearea is characterized by two bands of sand separated bysilty mud. It lies within the Dahomey Basin. The age ofthe Sedimentary formations of Lagos area could be de-scribed as ranging from the Cretaceous through Tertiaryto Quaternary sediments. Abeokuta group are Cretaceoussediments while Ilaro, Oshosun, Akinbo and EwekoroFormations are Tertiary (Obaje, 2009). Quaternary sedi-ments are alluvial deposits, covering most part of the LagosCoastal areas and river valleys. For details lithographic suc-cession of Dahomey Basin of which Lagos is an integralpart, readers can refer to Okosun (1990) and Obaje (2009).The University with population of students and staff to-
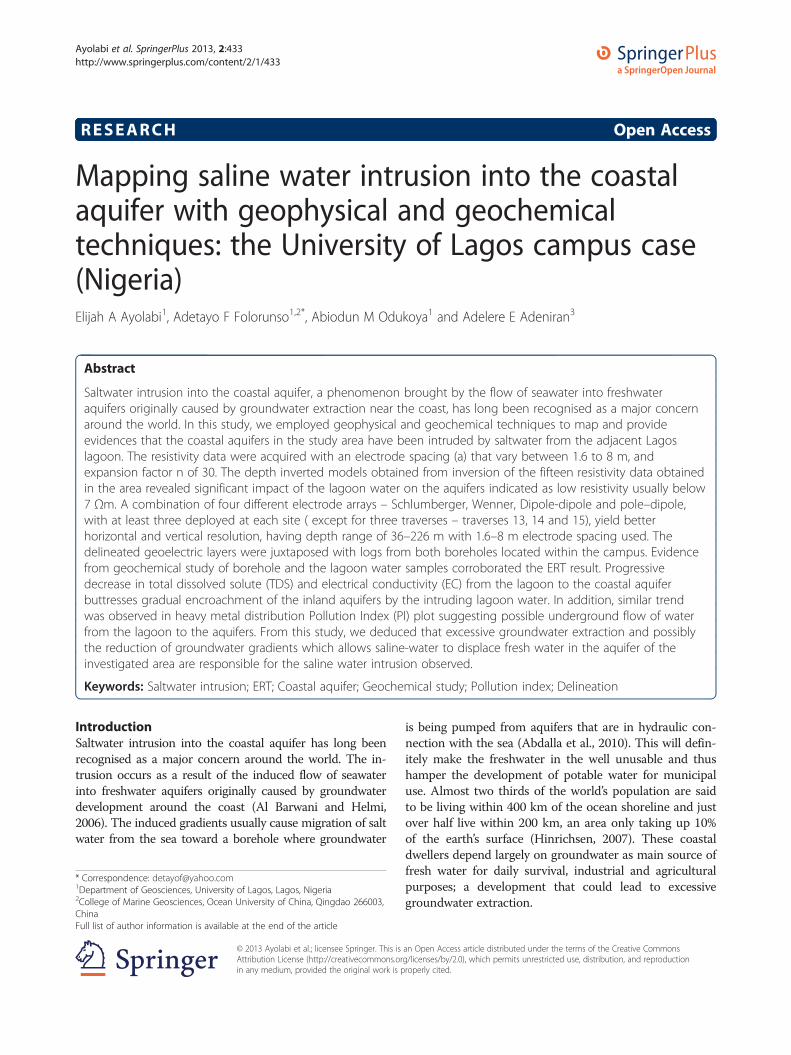
talling about fifty thousand depends on its own boreholesfor the water supply; hence, this has led to disproportionate
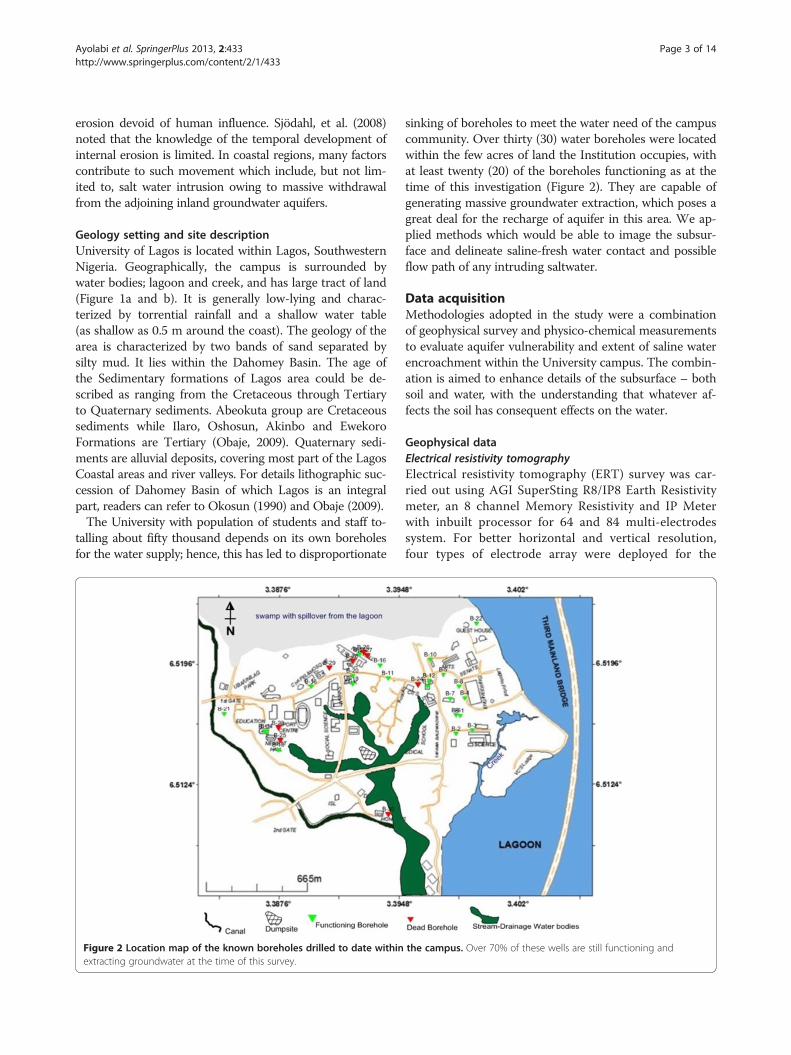
Figure 2 Location map of the known boreholes drilled to date withinextracting groundwater at the time of this survey.
sinking of boreholes to meet the water need of the campuscommunity. Over thirty (30) water boreholes were locatedwithin the few acres of land the Institution occupies, withat least twenty (20) of the boreholes functioning as at thetime of this investigation (Figure 2). They are capable ofgenerating massive groundwater extraction, which poses agreat deal for the recharge of aquifer in this area. We ap-plied methods which would be able to image the subsur-face and delineate saline-fresh water contact and possibleflow path of any intruding saltwater.
Data acquisitionMethodologies adopted in the study were a combinationof geophysical survey and physico-chemical measurementsto evaluate aquifer vulnerability and extent of saline waterencroachment within the University campus. The combin-ation is aimed to enhance details of the subsurface – bothsoil and water, with the understanding that whatever af-fects the soil has consequent effects on the water.
Geophysical dataElectrical resistivity tomographyElectrical resistivity tomography (ERT) survey was car-ried out using AGI SuperSting R8/IP8 Earth Resistivitymeter, an 8 channel Memory Resistivity and IP Meterwith inbuilt processor for 64 and 84 multi-electrodessystem. For better horizontal and vertical resolution,four types of electrode array were deployed for the
the campus. Over 70% of these wells are still functioning and
Ayolabi et al. SpringerPlus 2013, 2:433 Page 4 of 14http://www.springerplus.com/content/2/1/433
investigation – Schlumberger, Wenner, Dipole-dipoleand pole – dipole with three in operation at each site,except line 1, 3, 13, 14 and 15 due to some logistics.There were variations in the minimum electrode spa-cing ‘a’ used (from 1.6-8.0 m) owing to constraint inspace since the entire campus is built up. Notwithstand-ing, a fairly deeper depth were probed in the traverses,having used expansion factor n = 30.The choice of arrays for the survey was based on our
desire to have good sensitivity to vertical and horizontalchanges in the subsurface resistivity at both shallow anddeeper depths, at the same time probe into the deeperdepth and to have good vertical and horizontal datacoverage under each ERT line. Despite possible noisefrom other activities on the campus, we still want thebest result. We therefore chose the arrays to meet thesedemands. Wenner array is known in its ability to resolvevertical changes (horizontal structures), has a moderatedepth of investigation though poor at horizontal cover-age upon increasing the electrode spacing (Loke 2000).To make up for this, we employed Dipole-Dipole(Douple-Dipole) which is good in mapping verticalstructures, as well has a better horizontal data coveragethan the Wenner (Loke, 2004). Pole-Dipole gave thehighest depth (226 m) to satisfy our intention for deeperdepth. We also chose Schlumberger for 2-D survey arraywith overlapping data levels because of its good horizon-tal and vertical resolution.
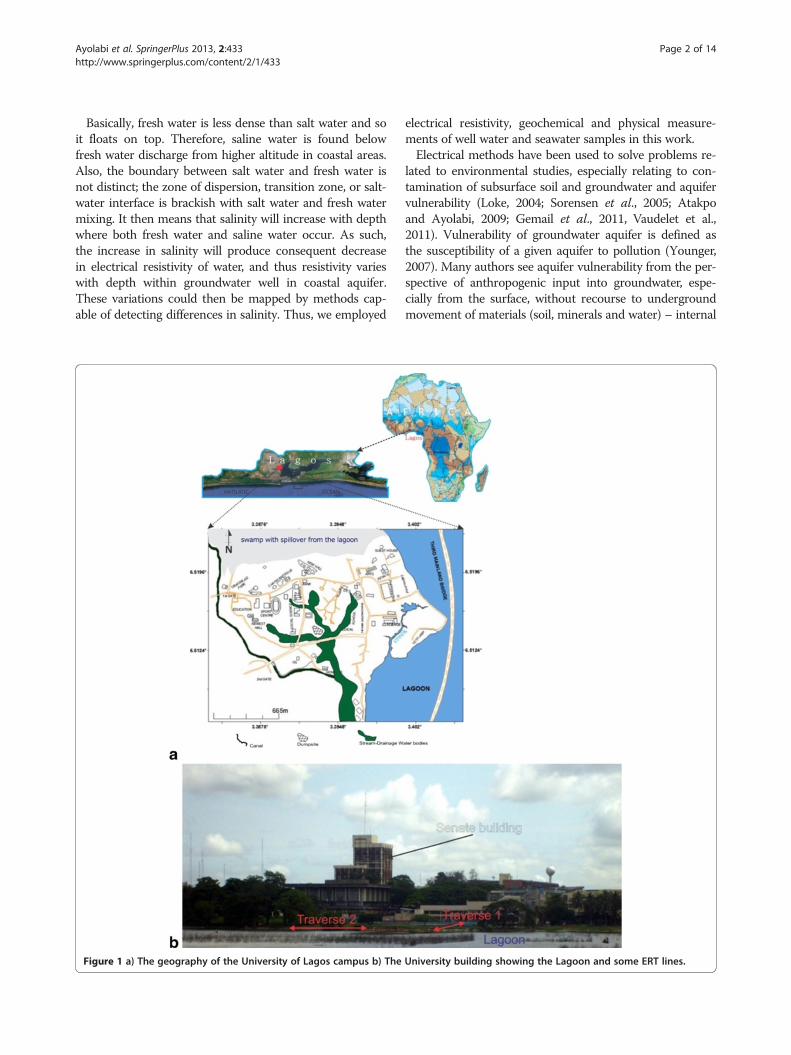
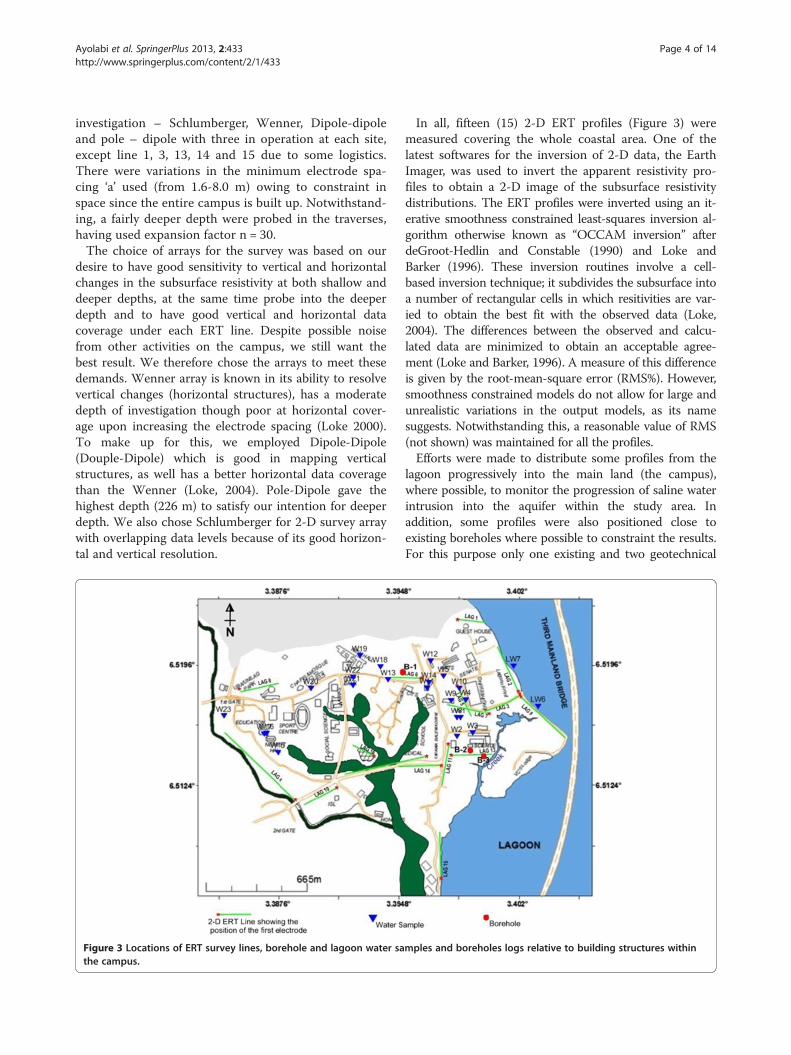
Figure 3 Locations of ERT survey lines, borehole and lagoon water sathe campus.
In all, fifteen (15) 2-D ERT profiles (Figure 3) weremeasured covering the whole coastal area. One of thelatest softwares for the inversion of 2-D data, the EarthImager, was used to invert the apparent resistivity pro-files to obtain a 2-D image of the subsurface resistivitydistributions. The ERT profiles were inverted using an it-erative smoothness constrained least-squares inversion al-gorithm otherwise known as “OCCAM inversion” afterdeGroot-Hedlin and Constable (1990) and Loke andBarker (1996). These inversion routines involve a cell-based inversion technique; it subdivides the subsurface intoa number of rectangular cells in which resitivities are var-ied to obtain the best fit with the observed data (Loke,2004). The differences between the observed and calcu-lated data are minimized to obtain an acceptable agree-ment (Loke and Barker, 1996). A measure of this differenceis given by the root-mean-square error (RMS%). However,smoothness constrained models do not allow for large andunrealistic variations in the output models, as its namesuggests. Notwithstanding this, a reasonable value of RMS(not shown) was maintained for all the profiles.Efforts were made to distribute some profiles from the
lagoon progressively into the main land (the campus),where possible, to monitor the progression of saline waterintrusion into the aquifer within the study area. Inaddition, some profiles were also positioned close toexisting boreholes where possible to constraint the results.For this purpose only one existing and two geotechnical
mples and boreholes logs relative to building structures within
Ayolabi et al. SpringerPlus 2013, 2:433 Page 5 of 14http://www.springerplus.com/content/2/1/433
boreholes drilled during the course of our survey wereused for correlation.
Geochemical dataWater samples from twenty one boreholes and two lagoonwater were collected at various locations within Universityof Lagos (Figure 3). Eight boreholes were not functioningat the time of this study. Several sensitive parameters ofwater such as total dissolved solids (TDS), electrical con-ductivity (EC), temperature and pH were determined insitu using digital meters (e.g. water treatment works(WTW)-conductivity meter model L/92 and WTW- pHmeter model pH/91). The meter was calibrated with pHsolutions 4 and 7. Water samples of approximately125 mL were collected for multi-element analysis; pres-sure filtered through 0.2 mm Nuclepore membranes and
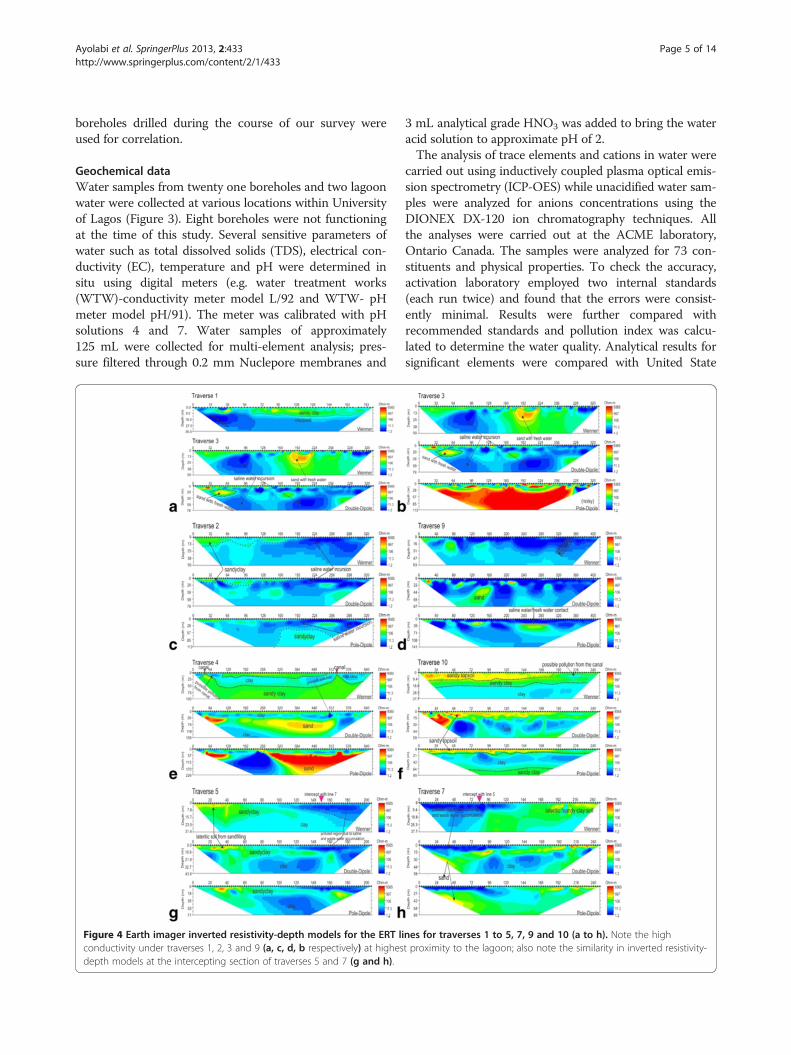
Figure 4 Earth imager inverted resistivity-depth models for the ERT liconductivity under traverses 1, 2, 3 and 9 (a, c, d, b respectively) at highesdepth models at the intercepting section of traverses 5 and 7 (g and h).
3 mL analytical grade HNO3 was added to bring the wateracid solution to approximate pH of 2.The analysis of trace elements and cations in water were
carried out using inductively coupled plasma optical emis-sion spectrometry (ICP-OES) while unacidified water sam-ples were analyzed for anions concentrations using theDIONEX DX-120 ion chromatography techniques. Allthe analyses were carried out at the ACME laboratory,Ontario Canada. The samples were analyzed for 73 con-stituents and physical properties. To check the accuracy,activation laboratory employed two internal standards(each run twice) and found that the errors were consist-ently minimal. Results were further compared withrecommended standards and pollution index was calcu-lated to determine the water quality. Analytical results forsignificant elements were compared with United State
nes for traverses 1 to 5, 7, 9 and 10 (a to h). Note the hight proximity to the lagoon; also note the similarity in inverted resistivity-
Ayolabi et al. SpringerPlus 2013, 2:433 Page 6 of 14http://www.springerplus.com/content/2/1/433
Environmental Protection standards (USEPA). The stan-dards include Maximum Contaminant Levels (MCLs),Secondary Maximum Contaminant Levels (SMCLs) estab-lished by the USEPA (2002, 2004 and 2009). MCLs are en-forceable standards that specify the highest level of acontaminant that is allowed in drinking water. Details ofhydrogeochemistry of the study area evidencing and de-tailing chemistry and spatial evolution are presented in an-other paper currently in preparation.
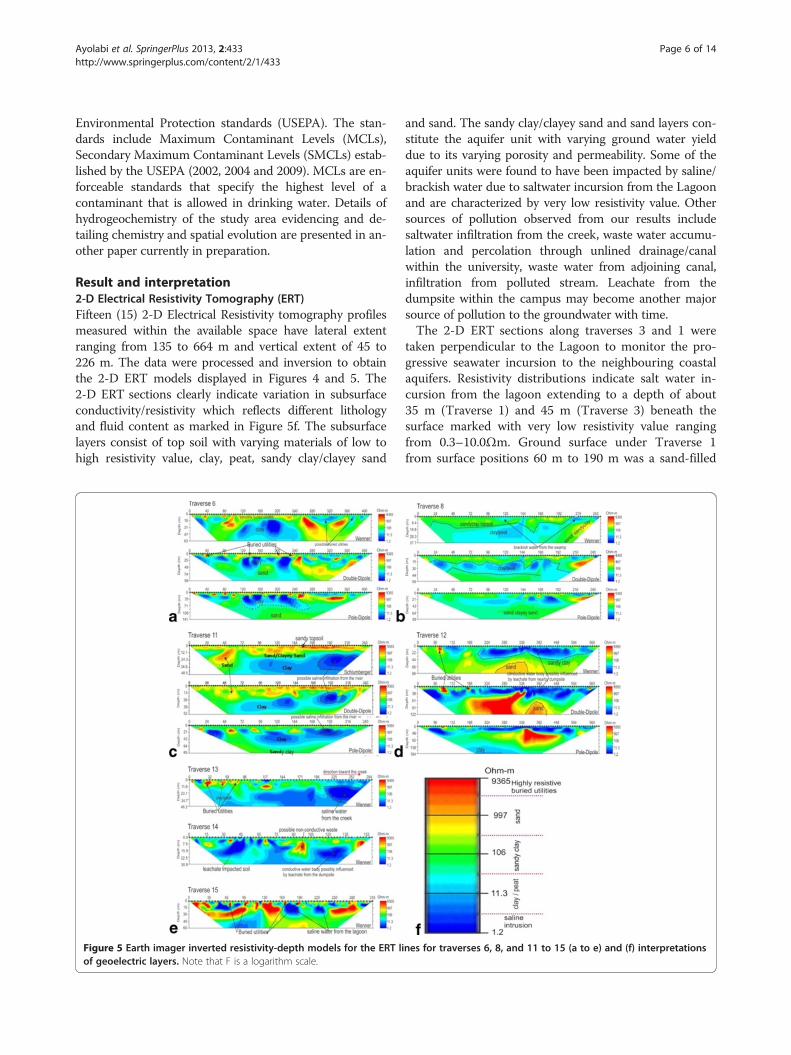
Result and interpretation2-D Electrical Resistivity Tomography (ERT)Fifteen (15) 2-D Electrical Resistivity tomography profilesmeasured within the available space have lateral extentranging from 135 to 664 m and vertical extent of 45 to226 m. The data were processed and inversion to obtainthe 2-D ERT models displayed in Figures 4 and 5. The2-D ERT sections clearly indicate variation in subsurfaceconductivity/resistivity which reflects different lithologyand fluid content as marked in Figure 5f. The subsurfacelayers consist of top soil with varying materials of low tohigh resistivity value, clay, peat, sandy clay/clayey sand
Figure 5 Earth imager inverted resistivity-depth models for the ERT liof geoelectric layers. Note that F is a logarithm scale.
and sand. The sandy clay/clayey sand and sand layers con-stitute the aquifer unit with varying ground water yielddue to its varying porosity and permeability. Some of theaquifer units were found to have been impacted by saline/brackish water due to saltwater incursion from the Lagoonand are characterized by very low resistivity value. Othersources of pollution observed from our results includesaltwater infiltration from the creek, waste water accumu-lation and percolation through unlined drainage/canalwithin the university, waste water from adjoining canal,infiltration from polluted stream. Leachate from thedumpsite within the campus may become another majorsource of pollution to the groundwater with time.The 2-D ERT sections along traverses 3 and 1 were
taken perpendicular to the Lagoon to monitor the pro-gressive seawater incursion to the neighbouring coastalaquifers. Resistivity distributions indicate salt water in-cursion from the lagoon extending to a depth of about35 m (Traverse 1) and 45 m (Traverse 3) beneath thesurface marked with very low resistivity value rangingfrom 0.3–10.0Ωm. Ground surface under Traverse 1from surface positions 60 m to 190 m was a sand-filled
nes for traverses 6, 8, and 11 to 15 (a to e) and (f) interpretations
Ayolabi et al. SpringerPlus 2013, 2:433 Page 7 of 14http://www.springerplus.com/content/2/1/433
land reclaimed from lagoon prior to the erection of theUniversity Guess House building. This was well notedduring the field survey. This possibly accounts for thethick high resistive material display above the saline waterintrusion zone in the resistivity structure (Figure 4a). Pol-lution observed within the subsurface along this traversewas probably due to combination of saltwater incursionfrom the lagoon and waste water percolation into thesubsurface along the drainage/waste water channel. Butnear surface high resistivity structure at isolated points(Figure 4b) along the traverse was due to the existence ofburied drainage/bridge/high resistivity exotic materials.2-D ERT sections for Traverses 2 and 9 were taken par-
allel to the lagoon probing a vertical depth of 50–113 mand 63–141 m respectively. The subsurface within thisarea is composed of predominantly low resistivity(0.11–5.0 Ωm) structure reflective of saline water incur-sion in to the aquifer. Figure 4c (Traverse 2) show that theentire traverse has been impacted by the lagoon water in-cursion to a depth of 40–85 m beneath the surface whileFigure 4D (Traverse 9) clearly indicates Lagoon water inva-sion of the fresh water aquifer to a depth of 0–42 m; bothat higher depths due to high proximity to the lagoon. Thisclearly shows that the first and the second aquifer havebeen polluted by the saltwater incursion from the lagoon.Traverses 4 was run parallel to and Traverse 10 per-
pendicular to a major canal that demarcates southernand western sides of the campus from surrounding com-munities. 2-D ERT model along Traverse 4 (Figure 4e)shows possible brackish water pollution from the carnal(very low resistivity, 1–20 Ωm) beneath electrode positions0–88 m and 424–640 m at a near surface depth of 0–25 m.At surface positions 424–640 m, the pollution falls withinthe first aquifer unit possibly prevented from further perco-lation by the underlying thin clayey layer (less than 50 Ωm).Similarly, low resistivity value of 10–20 Ωm (Traverse 10)was noticed within near surface depth of 0-9 m at a lateraldistance of 195–225 m towards the Canal (Figure 4f) sug-gestive of the same possible brackish water invasion of thislayer. The underlain sand/clayey sand is the aquifer unitand is prone to pollution as evident from polluted water in-vasion from the canal.2-D ERT models for Traverses 5 (Figure 4g) and 7
(Figure 4h) were taken across each other and away fromthe lagoon, to further see the effect of the incursion in-land. Low resistivity (below 10 Ωm) observed at the nearsurface from both traverses is a clear indication ofchange in lithology and fluid content (the site is water-logged, not sand-fill and host brackish water evidentlyseen on the surface). This portion has been highly im-pacted by the accumulation of conductive waste water(brackish water) around the area and possibly saltwaterfrom the lagoon may have polluted the groundwaterwithin the first aquifer along the traverse as depicted by
very low resistivity value toward the second part ofTraverse 5 which corresponds with the first part ofTraverse 7 (Figure 4h – the intercept referred). The sec-ond geoelectric layer is sand with resistivity of 106–500Ωm, which is possibly represents the aquifer unit.Depth range of 63–141 m was delineated from
Traverse 6 (Figure 5a) established beside borehole B-1(Figure 6a). Isolated near surface high resistivity withinthe sandy clay topsoil was reflective of buried utilitiessuch as drainage and water, cables and canal. Becausethe traverse was located close to the water work stationof the university, all pipes conducting water to the waterstation were buried in the topsoil around the traverse.Juxtaposing with borehole data the second sandy layer inthe borehole was probably not mapped in the geoelectriclayer because of the presence of saline water in the di-minutive sandy layer which increases its conductivityand thus makes it impossible to be differentiated fromunderlying clayey layer. A long stretch of clay layer wasmapped under this traverse, as observed from the logdata. The 2-D ERT section (Figure 5b) along Traverse 8depicts possible pollution from brackish water of theswamp.Traverse 11 (Figure 5c) taken opposite Traverse 12, al-
most parallel but not across the stream dipping slightlytowards the stream also reveals very low resistivity value(3.5–30 Ωm) towards the stream (third geoelectric layer)suggesting the possibility of infiltration of saline waterfrom the stream at depth of about 18–70 m (surface po-sitions of 170–250 m). This was mapped by bothSchlumberger, double-dipole and pole-dipole methods.2-D ERT model structure on Traverse 12 (Figure 5d) in-dicates low resistivity distributions towards the centralportion of the traverse as a combination of water resist-ivity within the stream and its sediment as electrodeswithin these regions fell within the stream. This low re-sistivity structure is a reflection of the conductive natureof the stream (brackish water) and its sediment. The ex-tension of this low resistivity structure outside thestream bank westward is suggestive of the possibilitythat the shallow aquifer in this area may have been pol-luted by the brackish water percolation through the por-ous topsoil. This stream could possibly serve as rechargeunit for the aquifer.Traverses 13 located close to the creek (Figure 5e),
near the two Shell auger boreholes was marshy fre-quently flooded by the creek especially during rainingseason. Region close to the Lagoon exhibits very low re-sistivity structure reflective of saltwater intrusion fromthe creek as observed at surface distance of 210–284 mbelow 10 m depth. The affected layer was thought to bethe first aquifer; its incursion by the lagoon water is anindication of progressive seawater intrusion to the inlandaquifer within the campus. The Shell Auger borehole
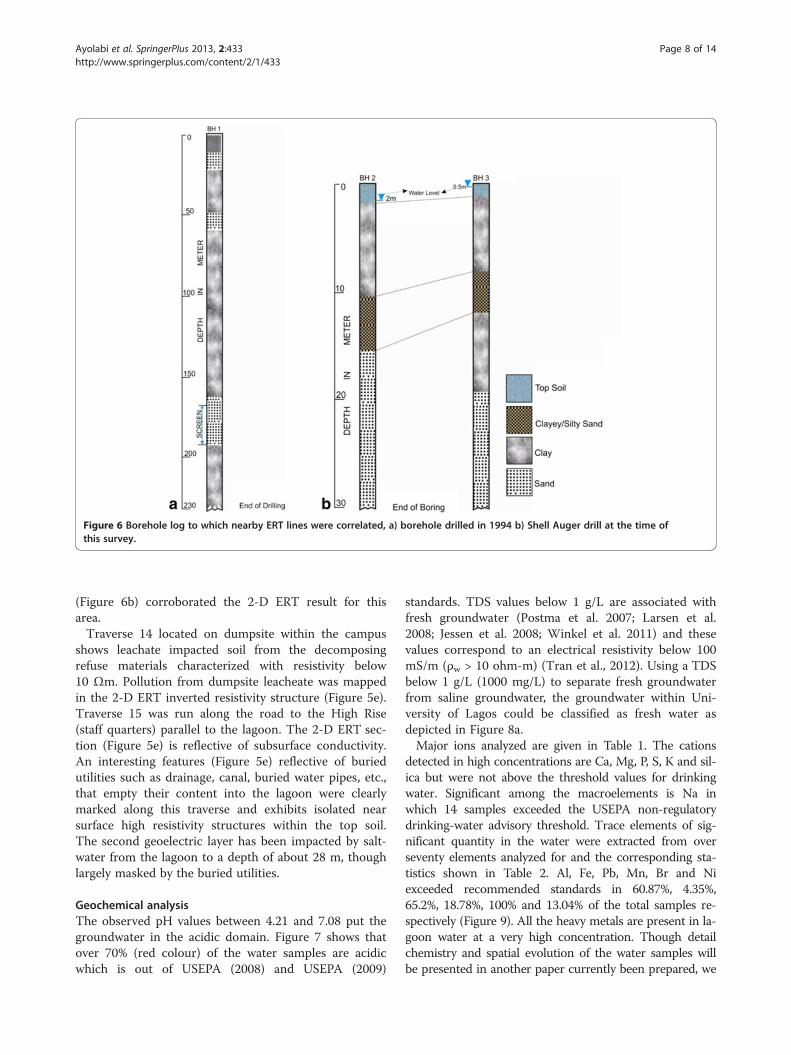
Figure 6 Borehole log to which nearby ERT lines were correlated, a) borehole drilled in 1994 b) Shell Auger drill at the time ofthis survey.
Ayolabi et al. SpringerPlus 2013, 2:433 Page 8 of 14http://www.springerplus.com/content/2/1/433
(Figure 6b) corroborated the 2-D ERT result for thisarea.Traverse 14 located on dumpsite within the campus
shows leachate impacted soil from the decomposingrefuse materials characterized with resistivity below10 Ωm. Pollution from dumpsite leacheate was mappedin the 2-D ERT inverted resistivity structure (Figure 5e).Traverse 15 was run along the road to the High Rise(staff quarters) parallel to the lagoon. The 2-D ERT sec-tion (Figure 5e) is reflective of subsurface conductivity.An interesting features (Figure 5e) reflective of buriedutilities such as drainage, canal, buried water pipes, etc.,that empty their content into the lagoon were clearlymarked along this traverse and exhibits isolated nearsurface high resistivity structures within the top soil.The second geoelectric layer has been impacted by salt-water from the lagoon to a depth of about 28 m, thoughlargely masked by the buried utilities.
Geochemical analysisThe observed pH values between 4.21 and 7.08 put thegroundwater in the acidic domain. Figure 7 shows thatover 70% (red colour) of the water samples are acidicwhich is out of USEPA (2008) and USEPA (2009)
standards. TDS values below 1 g/L are associated withfresh groundwater (Postma et al. 2007; Larsen et al.2008; Jessen et al. 2008; Winkel et al. 2011) and thesevalues correspond to an electrical resistivity below 100mS/m (ρw > 10 ohm-m) (Tran et al., 2012). Using a TDSbelow 1 g/L (1000 mg/L) to separate fresh groundwaterfrom saline groundwater, the groundwater within Uni-versity of Lagos could be classified as fresh water asdepicted in Figure 8a.Major ions analyzed are given in Table 1. The cations
detected in high concentrations are Ca, Mg, P, S, K and sil-ica but were not above the threshold values for drinkingwater. Significant among the macroelements is Na inwhich 14 samples exceeded the USEPA non-regulatorydrinking-water advisory threshold. Trace elements of sig-nificant quantity in the water were extracted from overseventy elements analyzed for and the corresponding sta-tistics shown in Table 2. Al, Fe, Pb, Mn, Br and Niexceeded recommended standards in 60.87%, 4.35%,65.2%, 18.78%, 100% and 13.04% of the total samples re-spectively (Figure 9). All the heavy metals are present in la-goon water at a very high concentration. Though detailchemistry and spatial evolution of the water samples willbe presented in another paper currently been prepared, we
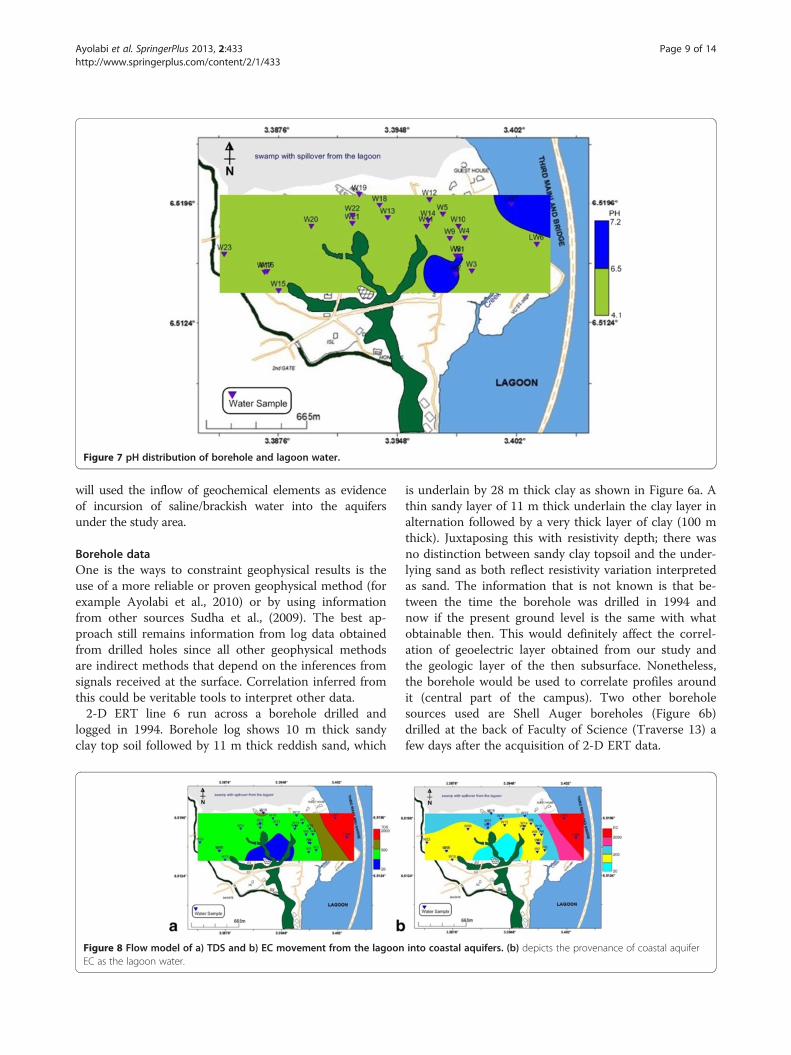
Figure 7 pH distribution of borehole and lagoon water.
Ayolabi et al. SpringerPlus 2013, 2:433 Page 9 of 14http://www.springerplus.com/content/2/1/433
will used the inflow of geochemical elements as evidenceof incursion of saline/brackish water into the aquifersunder the study area.
Borehole dataOne is the ways to constraint geophysical results is theuse of a more reliable or proven geophysical method (forexample Ayolabi et al., 2010) or by using informationfrom other sources Sudha et al., (2009). The best ap-proach still remains information from log data obtainedfrom drilled holes since all other geophysical methodsare indirect methods that depend on the inferences fromsignals received at the surface. Correlation inferred fromthis could be veritable tools to interpret other data.2-D ERT line 6 run across a borehole drilled and
logged in 1994. Borehole log shows 10 m thick sandyclay top soil followed by 11 m thick reddish sand, which
Figure 8 Flow model of a) TDS and b) EC movement from the lagoonEC as the lagoon water.
is underlain by 28 m thick clay as shown in Figure 6a. Athin sandy layer of 11 m thick underlain the clay layer inalternation followed by a very thick layer of clay (100 mthick). Juxtaposing this with resistivity depth; there wasno distinction between sandy clay topsoil and the under-lying sand as both reflect resistivity variation interpretedas sand. The information that is not known is that be-tween the time the borehole was drilled in 1994 andnow if the present ground level is the same with whatobtainable then. This would definitely affect the correl-ation of geoelectric layer obtained from our study andthe geologic layer of the then subsurface. Nonetheless,the borehole would be used to correlate profiles aroundit (central part of the campus). Two other boreholesources used are Shell Auger boreholes (Figure 6b)drilled at the back of Faculty of Science (Traverse 13) afew days after the acquisition of 2-D ERT data.
into coastal aquifers. (b) depicts the provenance of coastal aquifer
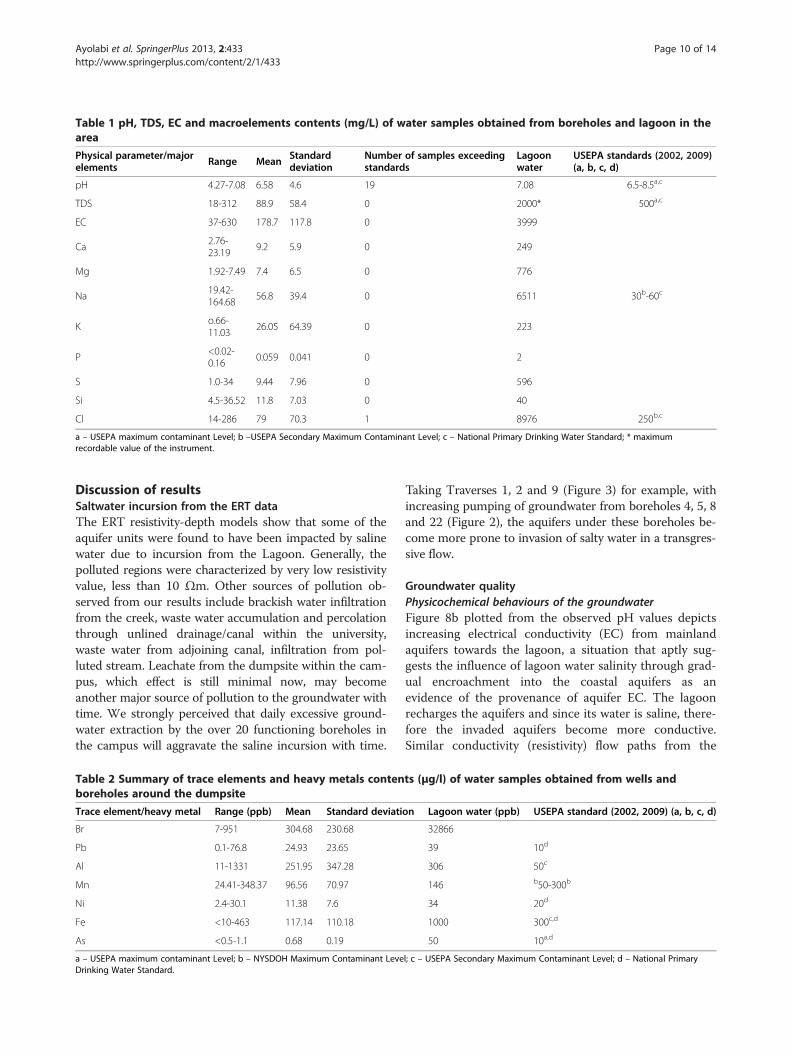
Table 1 pH, TDS, EC and macroelements contents (mg/L) of water samples obtained from boreholes and lagoon in thearea
Physical parameter/majorelements Range Mean Standard
deviationNumber of samples exceedingstandards
Lagoonwater
USEPA standards (2002, 2009)(a, b, c, d)
pH 4.27-7.08 6.58 4.6 19 7.08 6.5-8.5a,c
TDS 18-312 88.9 58.4 0 2000* 500a,c
EC 37-630 178.7 117.8 0 3999
Ca2.76-23.19
9.2 5.9 0 249
Mg 1.92-7.49 7.4 6.5 0 776
Na19.42-164.68
56.8 39.4 0 6511 30b-60c
Ko.66-11.03
26.05 64.39 0 223
P<0.02-0.16
0.059 0.041 0 2
S 1.0-34 9.44 7.96 0 596
Si 4.5-36.52 11.8 7.03 0 40
Cl 14-286 79 70.3 1 8976 250b,c
a – USEPA maximum contaminant Level; b –USEPA Secondary Maximum Contaminant Level; c – National Primary Drinking Water Standard; * maximumrecordable value of the instrument.
Ayolabi et al. SpringerPlus 2013, 2:433 Page 10 of 14http://www.springerplus.com/content/2/1/433
Discussion of resultsSaltwater incursion from the ERT dataThe ERT resistivity-depth models show that some of theaquifer units were found to have been impacted by salinewater due to incursion from the Lagoon. Generally, thepolluted regions were characterized by very low resistivityvalue, less than 10 Ωm. Other sources of pollution ob-served from our results include brackish water infiltrationfrom the creek, waste water accumulation and percolationthrough unlined drainage/canal within the university,waste water from adjoining canal, infiltration from pol-luted stream. Leachate from the dumpsite within the cam-pus, which effect is still minimal now, may becomeanother major source of pollution to the groundwater withtime. We strongly perceived that daily excessive ground-water extraction by the over 20 functioning boreholes inthe campus will aggravate the saline incursion with time.
Table 2 Summary of trace elements and heavy metals contenboreholes around the dumpsite
Trace element/heavy metal Range (ppb) Mean Standard deviati
Br 7-951 304.68 230.68
Pb 0.1-76.8 24.93 23.65
Al 11-1331 251.95 347.28
Mn 24.41-348.37 96.56 70.97
Ni 2.4-30.1 11.38 7.6
Fe <10-463 117.14 110.18
As <0.5-1.1 0.68 0.19
a – USEPA maximum contaminant Level; b – NYSDOH Maximum Contaminant LeveDrinking Water Standard.
Taking Traverses 1, 2 and 9 (Figure 3) for example, withincreasing pumping of groundwater from boreholes 4, 5, 8and 22 (Figure 2), the aquifers under these boreholes be-come more prone to invasion of salty water in a transgres-sive flow.
Groundwater qualityPhysicochemical behaviours of the groundwaterFigure 8b plotted from the observed pH values depictsincreasing electrical conductivity (EC) from mainlandaquifers towards the lagoon, a situation that aptly sug-gests the influence of lagoon water salinity through grad-ual encroachment into the coastal aquifers as anevidence of the provenance of aquifer EC. The lagoonrecharges the aquifers and since its water is saline, there-fore the invaded aquifers become more conductive.Similar conductivity (resistivity) flow paths from the
ts (μg/l) of water samples obtained from wells and
on Lagoon water (ppb) USEPA standard (2002, 2009) (a, b, c, d)
32866
39 10d
306 50c
146 b50-300b
34 20d
1000 300c,d
50 10a,d
l; c – USEPA Secondary Maximum Contaminant Level; d – National Primary
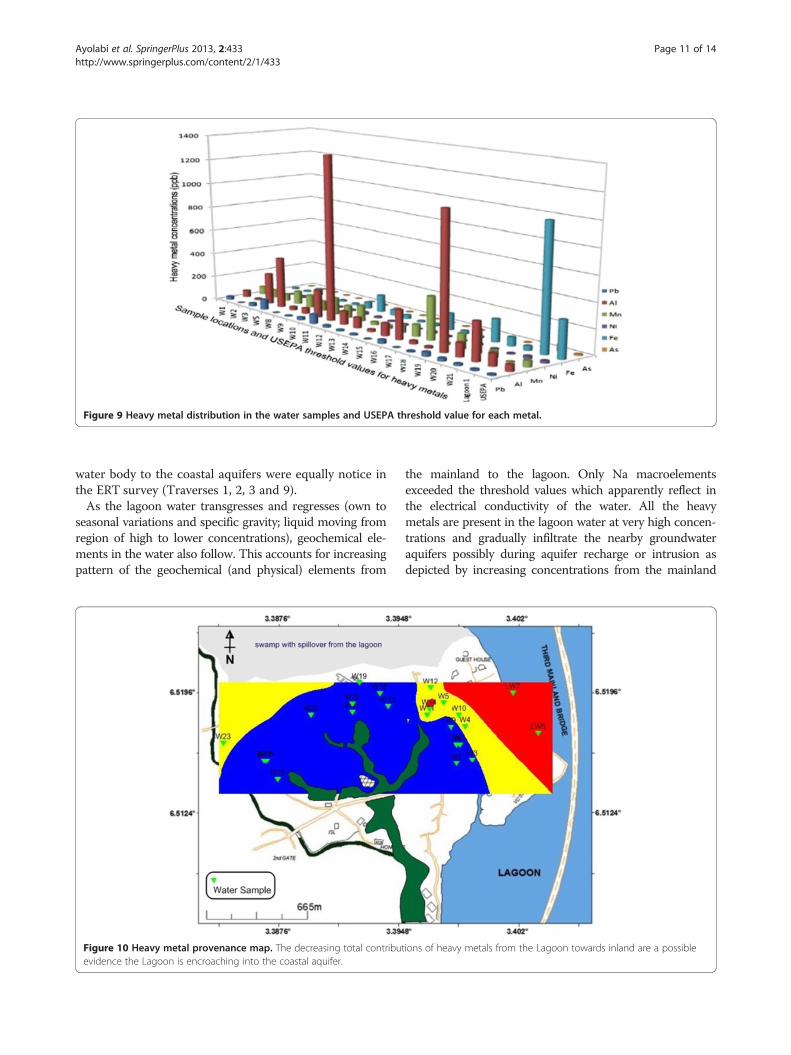
Figure 9 Heavy metal distribution in the water samples and USEPA threshold value for each metal.
Ayolabi et al. SpringerPlus 2013, 2:433 Page 11 of 14http://www.springerplus.com/content/2/1/433
water body to the coastal aquifers were equally notice inthe ERT survey (Traverses 1, 2, 3 and 9).As the lagoon water transgresses and regresses (own to
seasonal variations and specific gravity; liquid moving fromregion of high to lower concentrations), geochemical ele-ments in the water also follow. This accounts for increasingpattern of the geochemical (and physical) elements from
Figure 10 Heavy metal provenance map. The decreasing total contributevidence the Lagoon is encroaching into the coastal aquifer.
the mainland to the lagoon. Only Na macroelementsexceeded the threshold values which apparently reflect inthe electrical conductivity of the water. All the heavymetals are present in the lagoon water at very high concen-trations and gradually infiltrate the nearby groundwateraquifers possibly during aquifer recharge or intrusion asdepicted by increasing concentrations from the mainland
ions of heavy metals from the Lagoon towards inland are a possible
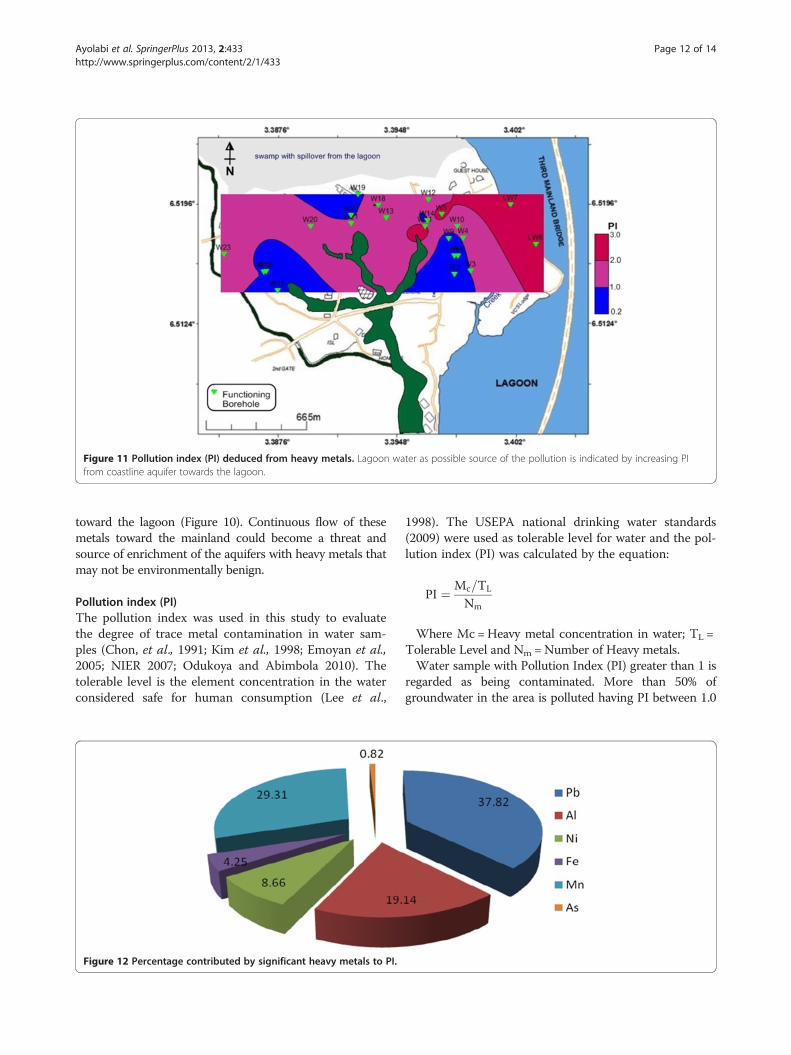
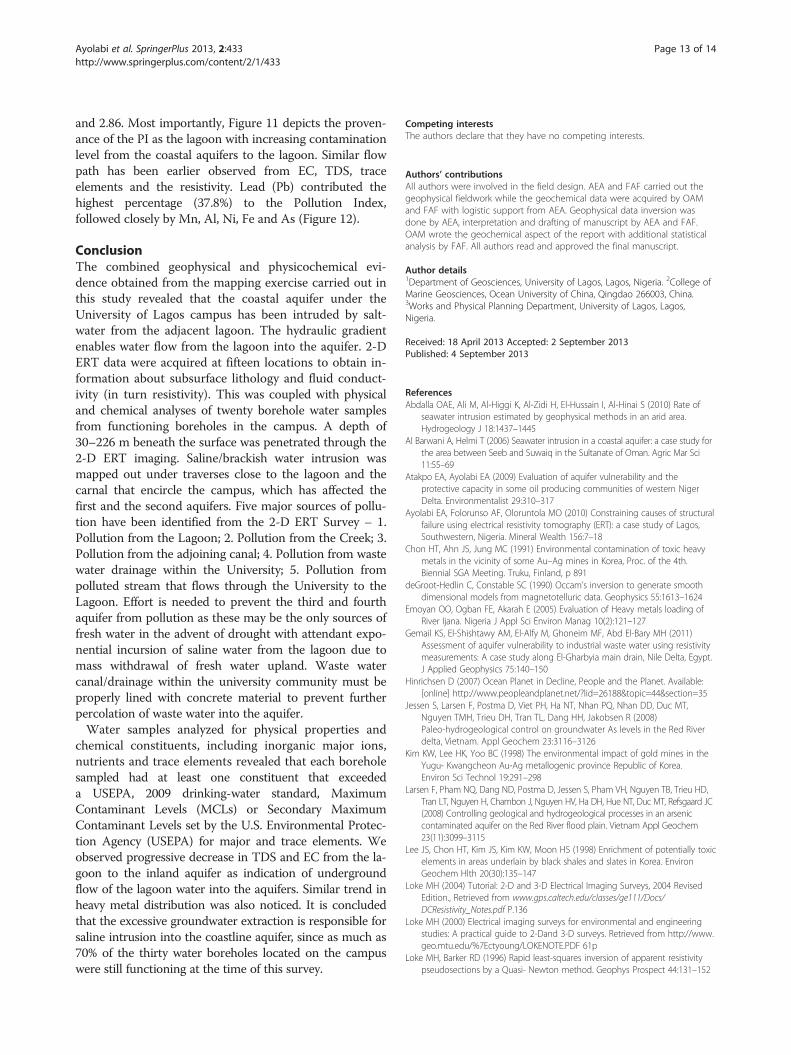
Figure 11 Pollution index (PI) deduced from heavy metals. Lagoon water as possible source of the pollution is indicated by increasing PIfrom coastline aquifer towards the lagoon.
Ayolabi et al. SpringerPlus 2013, 2:433 Page 12 of 14http://www.springerplus.com/content/2/1/433
toward the lagoon (Figure 10). Continuous flow of thesemetals toward the mainland could become a threat andsource of enrichment of the aquifers with heavy metals thatmay not be environmentally benign.
Pollution index (PI)The pollution index was used in this study to evaluatethe degree of trace metal contamination in water sam-ples (Chon, et al., 1991; Kim et al., 1998; Emoyan et al.,2005; NIER 2007; Odukoya and Abimbola 2010). Thetolerable level is the element concentration in the waterconsidered safe for human consumption (Lee et al.,
Figure 12 Percentage contributed by significant heavy metals to PI.
1998). The USEPA national drinking water standards(2009) were used as tolerable level for water and the pol-lution index (PI) was calculated by the equation:
PI ¼ Mc=TL
Nm
Where Mc =Heavy metal concentration in water; TL =Tolerable Level and Nm =Number of Heavy metals.Water sample with Pollution Index (PI) greater than 1 is
regarded as being contaminated. More than 50% ofgroundwater in the area is polluted having PI between 1.0
Ayolabi et al. SpringerPlus 2013, 2:433 Page 13 of 14http://www.springerplus.com/content/2/1/433
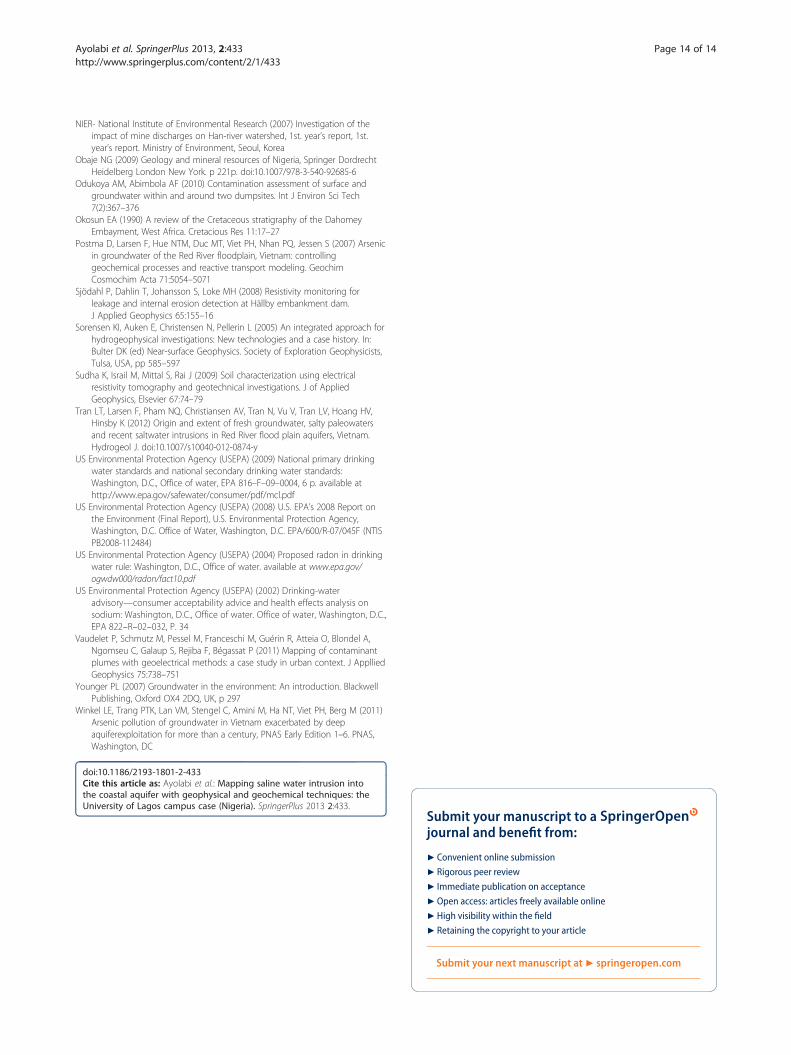
and 2.86. Most importantly, Figure 11 depicts the proven-ance of the PI as the lagoon with increasing contaminationlevel from the coastal aquifers to the lagoon. Similar flowpath has been earlier observed from EC, TDS, traceelements and the resistivity. Lead (Pb) contributed thehighest percentage (37.8%) to the Pollution Index,followed closely by Mn, Al, Ni, Fe and As (Figure 12).
ConclusionThe combined geophysical and physicochemical evi-dence obtained from the mapping exercise carried out inthis study revealed that the coastal aquifer under theUniversity of Lagos campus has been intruded by salt-water from the adjacent lagoon. The hydraulic gradientenables water flow from the lagoon into the aquifer. 2-DERT data were acquired at fifteen locations to obtain in-formation about subsurface lithology and fluid conduct-ivity (in turn resistivity). This was coupled with physicaland chemical analyses of twenty borehole water samplesfrom functioning boreholes in the campus. A depth of30–226 m beneath the surface was penetrated through the2-D ERT imaging. Saline/brackish water intrusion wasmapped out under traverses close to the lagoon and thecarnal that encircle the campus, which has affected thefirst and the second aquifers. Five major sources of pollu-tion have been identified from the 2-D ERT Survey – 1.Pollution from the Lagoon; 2. Pollution from the Creek; 3.Pollution from the adjoining canal; 4. Pollution from wastewater drainage within the University; 5. Pollution frompolluted stream that flows through the University to theLagoon. Effort is needed to prevent the third and fourthaquifer from pollution as these may be the only sources offresh water in the advent of drought with attendant expo-nential incursion of saline water from the lagoon due tomass withdrawal of fresh water upland. Waste watercanal/drainage within the university community must beproperly lined with concrete material to prevent furtherpercolation of waste water into the aquifer.Water samples analyzed for physical properties and
chemical constituents, including inorganic major ions,nutrients and trace elements revealed that each boreholesampled had at least one constituent that exceededa USEPA, 2009 drinking-water standard, MaximumContaminant Levels (MCLs) or Secondary MaximumContaminant Levels set by the U.S. Environmental Protec-tion Agency (USEPA) for major and trace elements. Weobserved progressive decrease in TDS and EC from the la-goon to the inland aquifer as indication of undergroundflow of the lagoon water into the aquifers. Similar trend inheavy metal distribution was also noticed. It is concludedthat the excessive groundwater extraction is responsible forsaline intrusion into the coastline aquifer, since as much as70% of the thirty water boreholes located on the campuswere still functioning at the time of this survey.
Competing interestsThe authors declare that they have no competing interests.
Authors’ contributionsAll authors were involved in the field design. AEA and FAF carried out thegeophysical fieldwork while the geochemical data were acquired by OAMand FAF with logistic support from AEA. Geophysical data inversion wasdone by AEA, interpretation and drafting of manuscript by AEA and FAF.OAM wrote the geochemical aspect of the report with additional statisticalanalysis by FAF. All authors read and approved the final manuscript.
Author details1Department of Geosciences, University of Lagos, Lagos, Nigeria. 2College ofMarine Geosciences, Ocean University of China, Qingdao 266003, China.3Works and Physical Planning Department, University of Lagos, Lagos,Nigeria.
Received: 18 April 2013 Accepted: 2 September 2013Published: 4 September 2013
ReferencesAbdalla OAE, Ali M, Al-Higgi K, Al-Zidi H, El-Hussain I, Al-Hinai S (2010) Rate of
seawater intrusion estimated by geophysical methods in an arid area.Hydrogeology J 18:1437–1445
Al Barwani A, Helmi T (2006) Seawater intrusion in a coastal aquifer: a case study forthe area between Seeb and Suwaiq in the Sultanate of Oman. Agric Mar Sci11:55–69
Atakpo EA, Ayolabi EA (2009) Evaluation of aquifer vulnerability and theprotective capacity in some oil producing communities of western NigerDelta. Environmentalist 29:310–317
Ayolabi EA, Folorunso AF, Oloruntola MO (2010) Constraining causes of structuralfailure using electrical resistivity tomography (ERT): a case study of Lagos,Southwestern, Nigeria. Mineral Wealth 156:7–18
Chon HT, Ahn JS, Jung MC (1991) Environmental contamination of toxic heavymetals in the vicinity of some Au–Ag mines in Korea, Proc. of the 4th.Biennial SGA Meeting. Truku, Finland, p 891
deGroot-Hedlin C, Constable SC (1990) Occam’s inversion to generate smoothdimensional models from magnetotelluric data. Geophysics 55:1613–1624
Emoyan OO, Ogban FE, Akarah E (2005) Evaluation of Heavy metals loading ofRiver Ijana. Nigeria J Appl Sci Environ Manag 10(2):121–127
Gemail KS, El-Shishtawy AM, El-Alfy M, Ghoneim MF, Abd El-Bary MH (2011)Assessment of aquifer vulnerability to industrial waste water using resistivitymeasurements: A case study along El-Gharbyia main drain, Nile Delta, Egypt.J Applied Geophysics 75:140–150
Hinrichsen D (2007) Ocean Planet in Decline, People and the Planet. Available:[online] http://www.peopleandplanet.net/?lid=26188&topic=44§ion=35
Jessen S, Larsen F, Postma D, Viet PH, Ha NT, Nhan PQ, Nhan DD, Duc MT,Nguyen TMH, Trieu DH, Tran TL, Dang HH, Jakobsen R (2008)Paleo-hydrogeological control on groundwater As levels in the Red Riverdelta, Vietnam. Appl Geochem 23:3116–3126
Kim KW, Lee HK, Yoo BC (1998) The environmental impact of gold mines in theYugu- Kwangcheon Au-Ag metallogenic province Republic of Korea.Environ Sci Technol 19:291–298
Larsen F, Pham NQ, Dang ND, Postma D, Jessen S, Pham VH, Nguyen TB, Trieu HD,Tran LT, Nguyen H, Chambon J, Nguyen HV, Ha DH, Hue NT, Duc MT, Refsgaard JC(2008) Controlling geological and hydrogeological processes in an arseniccontaminated aquifer on the Red River flood plain. Vietnam Appl Geochem23(11):3099–3115
Lee JS, Chon HT, Kim JS, Kim KW, Moon HS (1998) Enrichment of potentially toxicelements in areas underlain by black shales and slates in Korea. EnvironGeochem Hlth 20(30):135–147
Loke MH (2004) Tutorial: 2-D and 3-D Electrical Imaging Surveys, 2004 RevisedEdition., Retrieved from www.gps.caltech.edu/classes/ge111/Docs/DCResistivity_Notes.pdf P.136
Loke MH (2000) Electrical imaging surveys for environmental and engineeringstudies: A practical guide to 2-Dand 3-D surveys. Retrieved from http://www.geo.mtu.edu/%7Ectyoung/LOKENOTE.PDF 61p
Loke MH, Barker RD (1996) Rapid least-squares inversion of apparent resistivitypseudosections by a Quasi- Newton method. Geophys Prospect 44:131–152
Ayolabi et al. SpringerPlus 2013, 2:433 Page 14 of 14http://www.springerplus.com/content/2/1/433
NIER- National Institute of Environmental Research (2007) Investigation of theimpact of mine discharges on Han-river watershed, 1st. year’s report, 1st.year’s report. Ministry of Environment, Seoul, Korea
Obaje NG (2009) Geology and mineral resources of Nigeria, Springer DordrechtHeidelberg London New York. p 221p. doi:10.1007/978-3-540-92685-6
Odukoya AM, Abimbola AF (2010) Contamination assessment of surface andgroundwater within and around two dumpsites. Int J Environ Sci Tech7(2):367–376
Okosun EA (1990) A review of the Cretaceous stratigraphy of the DahomeyEmbayment, West Africa. Cretacious Res 11:17–27
Postma D, Larsen F, Hue NTM, Duc MT, Viet PH, Nhan PQ, Jessen S (2007) Arsenicin groundwater of the Red River floodplain, Vietnam: controllinggeochemical processes and reactive transport modeling. GeochimCosmochim Acta 71:5054–5071
Sjödahl P, Dahlin T, Johansson S, Loke MH (2008) Resistivity monitoring forleakage and internal erosion detection at Hällby embankment dam.J Applied Geophysics 65:155–16
Sorensen KI, Auken E, Christensen N, Pellerin L (2005) An integrated approach forhydrogeophysical investigations: New technologies and a case history. In:Bulter DK (ed) Near-surface Geophysics. Society of Exploration Geophysicists,Tulsa, USA, pp 585–597
Sudha K, Israil M, Mittal S, Rai J (2009) Soil characterization using electricalresistivity tomography and geotechnical investigations. J of AppliedGeophysics, Elsevier 67:74–79
Tran LT, Larsen F, Pham NQ, Christiansen AV, Tran N, Vu V, Tran LV, Hoang HV,Hinsby K (2012) Origin and extent of fresh groundwater, salty paleowatersand recent saltwater intrusions in Red River flood plain aquifers, Vietnam.Hydrogeol J. doi:10.1007/s10040-012-0874-y
US Environmental Protection Agency (USEPA) (2009) National primary drinkingwater standards and national secondary drinking water standards:Washington, D.C., Office of water, EPA 816–F–09–0004, 6 p. available athttp://www.epa.gov/safewater/consumer/pdf/mcl.pdf
US Environmental Protection Agency (USEPA) (2008) U.S. EPA’s 2008 Report onthe Environment (Final Report), U.S. Environmental Protection Agency,Washington, D.C. Office of Water, Washington, D.C. EPA/600/R-07/045F (NTISPB2008-112484)
US Environmental Protection Agency (USEPA) (2004) Proposed radon in drinkingwater rule: Washington, D.C., Office of water. available at www.epa.gov/ogwdw000/radon/fact10.pdf
US Environmental Protection Agency (USEPA) (2002) Drinking-wateradvisory—consumer acceptability advice and health effects analysis onsodium: Washington, D.C., Office of water. Office of water, Washington, D.C.,EPA 822–R–02–032, P. 34
Vaudelet P, Schmutz M, Pessel M, Franceschi M, Guérin R, Atteia O, Blondel A,Ngomseu C, Galaup S, Rejiba F, Bégassat P (2011) Mapping of contaminantplumes with geoelectrical methods: a case study in urban context. J ApplliedGeophysics 75:738–751
Younger PL (2007) Groundwater in the environment: An introduction. BlackwellPublishing, Oxford OX4 2DQ, UK, p 297
Winkel LE, Trang PTK, Lan VM, Stengel C, Amini M, Ha NT, Viet PH, Berg M (2011)Arsenic pollution of groundwater in Vietnam exacerbated by deepaquiferexploitation for more than a century, PNAS Early Edition 1–6. PNAS,Washington, DC
doi:10.1186/2193-1801-2-433Cite this article as: Ayolabi et al.: Mapping saline water intrusion intothe coastal aquifer with geophysical and geochemical techniques: theUniversity of Lagos campus case (Nigeria). SpringerPlus 2013 2:433.
Submit your manuscript to a journal and benefi t from:
7 Convenient online submission
7 Rigorous peer review
7 Immediate publication on acceptance
7 Open access: articles freely available online
7 High visibility within the fi eld
7 Retaining the copyright to your article
Submit your next manuscript at 7 springeropen.com