Embed Size (px)
Citation preview
62
Int. J. Struct. & Civil Engg. Res. 2014 Ranjitha J and Varshini K C A, 2014
FORCASTING, ANALYSIS AND DESIGN FOR
UPGRADING GUNJOOR-SARJAPUR ROAD VIA
MULLUR: A CASE STUDY
Ranjitha J1* and Varshini K C A2
Bangalore is one of the major cities of our country and growing very largely day by day. The cityexpansion is taking place in all the directions and connectivity to different parts of the city is amust as overall development of the city has to be achieved. The road network should be improvedto well connect the new layouts with the city center. Sarjapur is a major part of the city and hasto well be connected and easily reachable under high traffic volume conditions. So to ensure thefast movement, the Gunjoor-Mullur – Sarjapur Road development project has been taken up.Existing single lane is widened to double lane and single stretch is maintained at some locationby improving the shoulder conditions. The demand for future traffic is estimated by taking thepresent volume data and analyzing it for different parameters. The present study deals withtopographical survey of the area and site appreciation. And the collection of traffic data andanalysis to design the signal timings, junction turning characteristics. The horizontal and verticalcurves are improved. Realignment is done wherever necessary. Geotechnical investigationsare carried out wherever needed.
1 Department of Civil Engineering, DSCE, Bangalore, India.
2 Highway Technology, DSCE, Bangalore, India.
*Corresponding author:Ranjitha J � [email protected]
ISSN 2319 – 6009 www.ijscer.com
Vol. 3, No. 4, November 2014
© 2014 IJSCER. All Rights Reserved
Int. J. Struct. & Civil Engg. Res. 2014
Research Paper
Keywords: California Bearing Ratio, Distress, Pavement, Traffic forecasting
INTRODUCTION
Bangalore is the capital city of the southernIndian state of Karnataka. It is the seventhlargest city in India. It is also known as theGarden City because of its many beautifulgardens and parks. Though the origin ofBangalore is ancient, the present-day city wasfounded in the 16th century and has sincecontinued to be an important administrative
center. Because of the high concentration ofIT industry, it also called the Silicon Valley ofIndia. Bangalore is rated to one of the fastestgrowing cities in Asia with a current populationof more than 10 million. During the last coupleof decades, city has witnessed drasticincrease in population, change in land usepattern of the city, life style of the people andtheir commuting habits and the revolutionary
63
Int. J. Struct. & Civil Engg. Res. 2014 Ranjitha J and Varshini K C A, 2014
changes that has taken place in theautomobile industry. This has contributed to thegrowth of vehicular traffic in an enormous way.
The vehicle population in all cities in Indiastarted growing rapidly since later part of1980s. Bangalore is no exception. It hasalways had a reputation of having more twowheeler users. The liberalization policy of thecountry made availability of not only vehicles,but also loans for buying vehicles. With therapid growth of IT sector in Bangalore, theaffordability of larger segment of employeesincreased for ownership of vehicles, morespecially two wheelers. Coupled withinadequacy of comfortable and convenientpublic transport gave an impetus to more andmore commuters shifting to cars and twowheelers for their commuting in Bangalore. Thenumber of registered motor vehicles hascrossed 2.5 million in 2011-2012 and isgrowing at a rate of over 12% per annum. Thetwo wheelers, which constitute about 72% ofthe total registered vehicles, are growing at arate of about 13% per annum. Lately, cars havebeen growing even faster than two wheelers.Vehicle ownership has grown from 58 to 365per 1000 population. The trend is likely tocontinue. This will result in higher use ofpersonalized modes of transport particularlycars unless extensive and convenient publictransport system is provided.
The combined effect of all these on the roadnetwork of Bangalore is delay and congestionbeyond tolerable limits. Vehicular conflicts atthe intersections are being eliminated by trafficsignals but at the expense of delays and longqueues. The peak hour has spread over alonger period of time, since there are no
perceptible capacity augmentation / conflictreduction measures.
In view of the above facts, road commutersare experiencing inconvenience and increasedroad user cost due to increase in the followingfactors.
• Intra city commuting time.
• Traffic congestions.
• Number of junctions and intersections.
• Junction delays.
• And increased rate of accidents, healthhazards, etc.
Hence, there is an urgent necessity todecongest these roads and intersections.
As a comprehensive development programfor improvement of road network, the BruhathBangalore Mahanagara Palike (BBMP) hasplanned Improvements and Strengthening ofRoads, strengthening of pavement base andsub-base, improvement to pedestrianfacilities, improvements to Drainage Facility,etc., for Roads. This response is the answerto the severe strain on the urban infrastructure,which is inevitable due to the very rapid rate ofgrowth in traffic. Travel demands of passengershave increased many folds in the last twodecades. Unfortunately growth in theinfrastructure is not commensurate with thegrowing demands of traffic. There is an exigentneed to effectively manage the traffic andtransportation systems to optimize thesolutions with short term and long-termmeasures.
PROJECT LOCATION
The Project Corridor comes under BruhathBangalore Mahanagara Palike which is
64
Int. J. Struct. & Civil Engg. Res. 2014 Ranjitha J and Varshini K C A, 2014
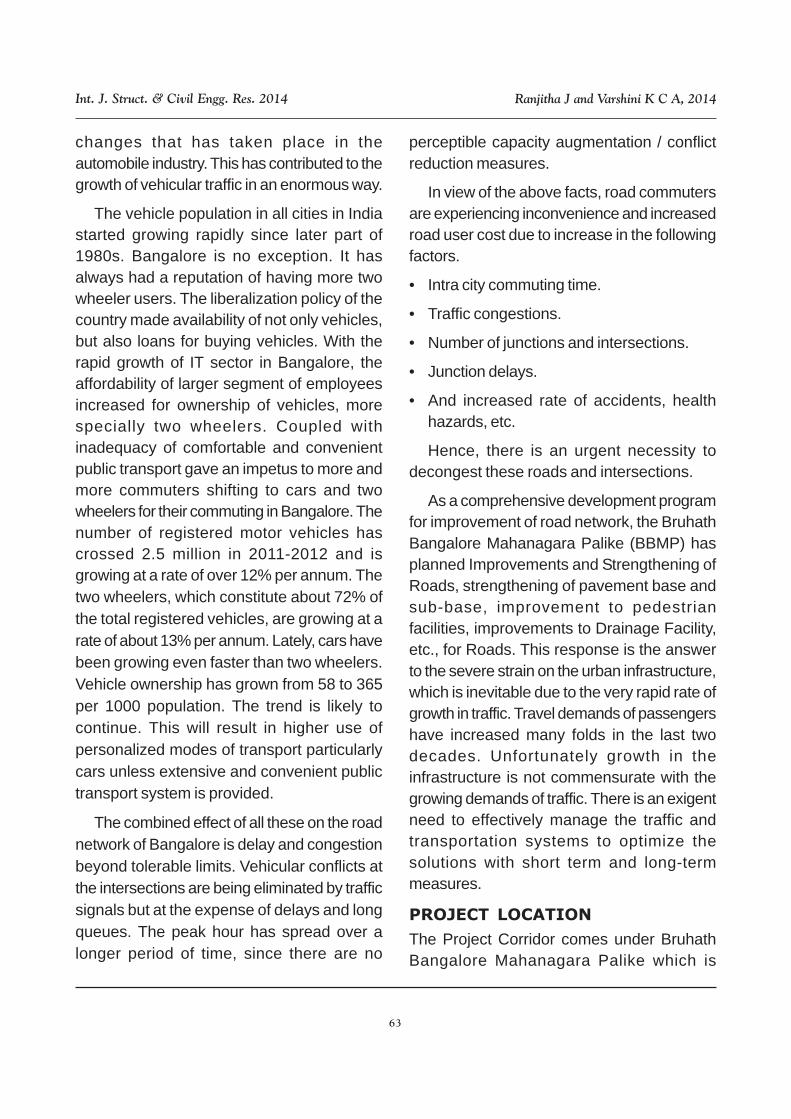
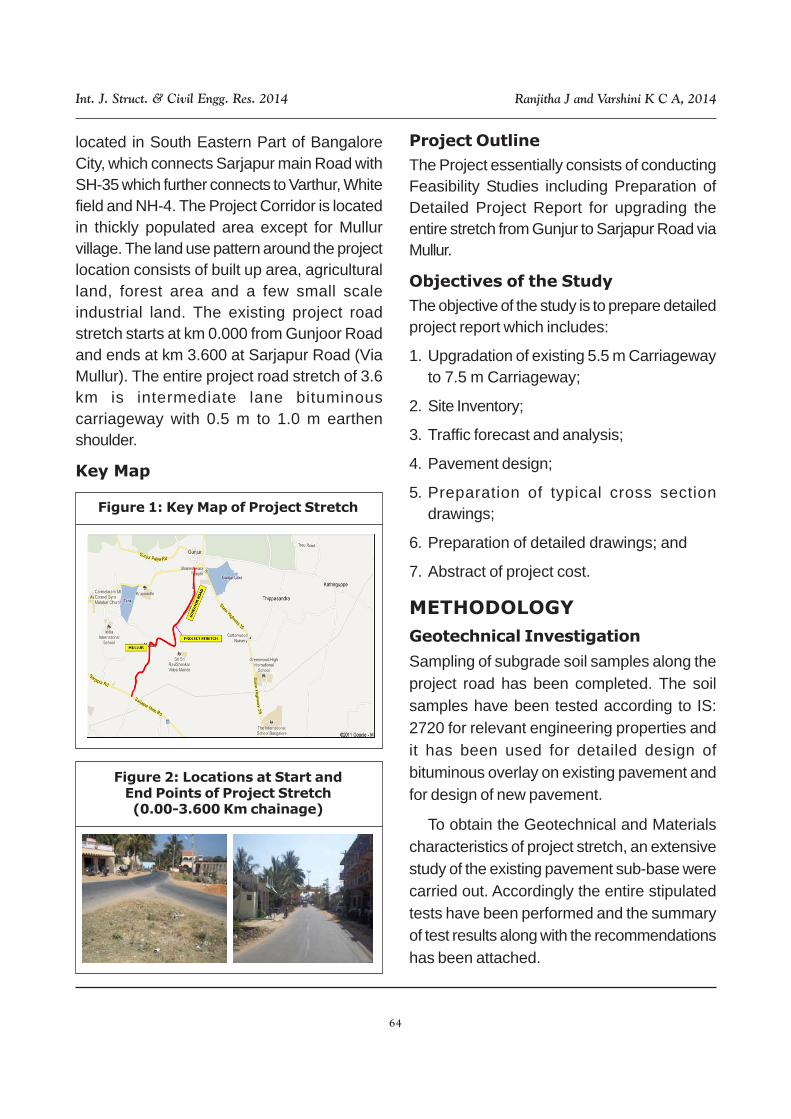
located in South Eastern Part of BangaloreCity, which connects Sarjapur main Road withSH-35 which further connects to Varthur, Whitefield and NH-4. The Project Corridor is locatedin thickly populated area except for Mullurvillage. The land use pattern around the projectlocation consists of built up area, agriculturalland, forest area and a few small scaleindustrial land. The existing project roadstretch starts at km 0.000 from Gunjoor Roadand ends at km 3.600 at Sarjapur Road (ViaMullur). The entire project road stretch of 3.6km is intermediate lane bituminouscarriageway with 0.5 m to 1.0 m earthenshoulder.
Key Map
Figure 1: Key Map of Project Stretch
Figure 2: Locations at Start andEnd Points of Project Stretch(0.00-3.600 Km chainage)
Project Outline
The Project essentially consists of conductingFeasibility Studies including Preparation ofDetailed Project Report for upgrading theentire stretch from Gunjur to Sarjapur Road viaMullur.
Objectives of the Study
The objective of the study is to prepare detailedproject report which includes:
1. Upgradation of existing 5.5 m Carriagewayto 7.5 m Carriageway;
2. Site Inventory;
3. Traffic forecast and analysis;
4. Pavement design;
5. Preparation of typical cross sectiondrawings;
6. Preparation of detailed drawings; and
7. Abstract of project cost.
METHODOLOGY
Geotechnical Investigation
Sampling of subgrade soil samples along theproject road has been completed. The soilsamples have been tested according to IS:2720 for relevant engineering properties andit has been used for detailed design ofbituminous overlay on existing pavement andfor design of new pavement.
To obtain the Geotechnical and Materialscharacteristics of project stretch, an extensivestudy of the existing pavement sub-base werecarried out. Accordingly the entire stipulatedtests have been performed and the summaryof test results along with the recommendationshas been attached.
65
Int. J. Struct. & Civil Engg. Res. 2014 Ranjitha J and Varshini K C A, 2014
• The soil type observed during investigationand test results is silty sand and clayey.
• The CBR value of existing sub grade variesbetween 4% and 8.0%.
Classified Traffic Volume Counts
Hourly traffic counts were conductedsimultaneously in both the directions at eachsurvey location to obtain data on the magnitudeof traffic flow and the traffic composition. Thesurvey was carried out by manual vehiclecounting and classifying the vehicles passingthe survey stations in both the directions, in 15min interval for 72 h. The counts were madeseparately for motorized and non-motorizedtraffic as per the vehicle classification systemrecommended by IRC. The classified trafficdata obtained is shown in Table 1.
Table 1: Classified Traffic Data
Vehicle type Traffic
2 wheeler 1262
Car/jeep/3wheeler 519
Bus 51
LCV 168
Single, 2-axle truck 19
Multi axle truck 0
Agricultural tractor &trailer 123
Cycle rickshaw 8
Animal drawn vehicle 0
Average Daily Traffic (ADT)
Hourly traffic data collected at the countstations for each day was totalled to obtain thedaily traffic volume. The three day traffic
volumes were then averaged to obtain theAverage Daily Traffic (ADT) at individualsurvey station.
The following observations are made fromthe analysis of traffic volume count surveys.
• A total of about 2150 vehicles (2170 PCU’s)pass in this stretch in both directions perday.
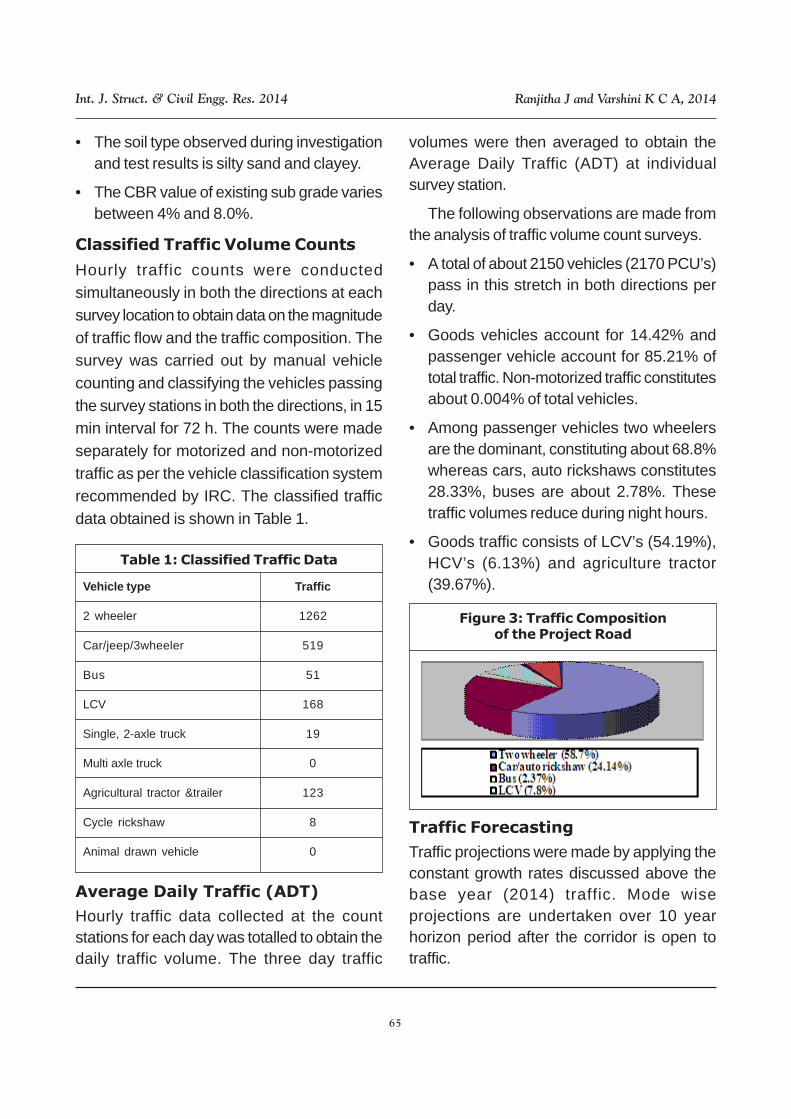
• Goods vehicles account for 14.42% andpassenger vehicle account for 85.21% oftotal traffic. Non-motorized traffic constitutesabout 0.004% of total vehicles.
• Among passenger vehicles two wheelersare the dominant, constituting about 68.8%whereas cars, auto rickshaws constitutes28.33%, buses are about 2.78%. Thesetraffic volumes reduce during night hours.
• Goods traffic consists of LCV’s (54.19%),HCV’s (6.13%) and agriculture tractor(39.67%).
Figure 3: Traffic Compositionof the Project Road
Traffic Forecasting
Traffic projections were made by applying theconstant growth rates discussed above thebase year (2014) traffic. Mode wiseprojections are undertaken over 10 yearhorizon period after the corridor is open totraffic.
66
Int. J. Struct. & Civil Engg. Res. 2014 Ranjitha J and Varshini K C A, 2014
Normal traffic comprises of traffic that ispresently observed on the project corridor andwill continue to use the project road in thefuture. Estimations and projections for eachof the above components are describedbelow.
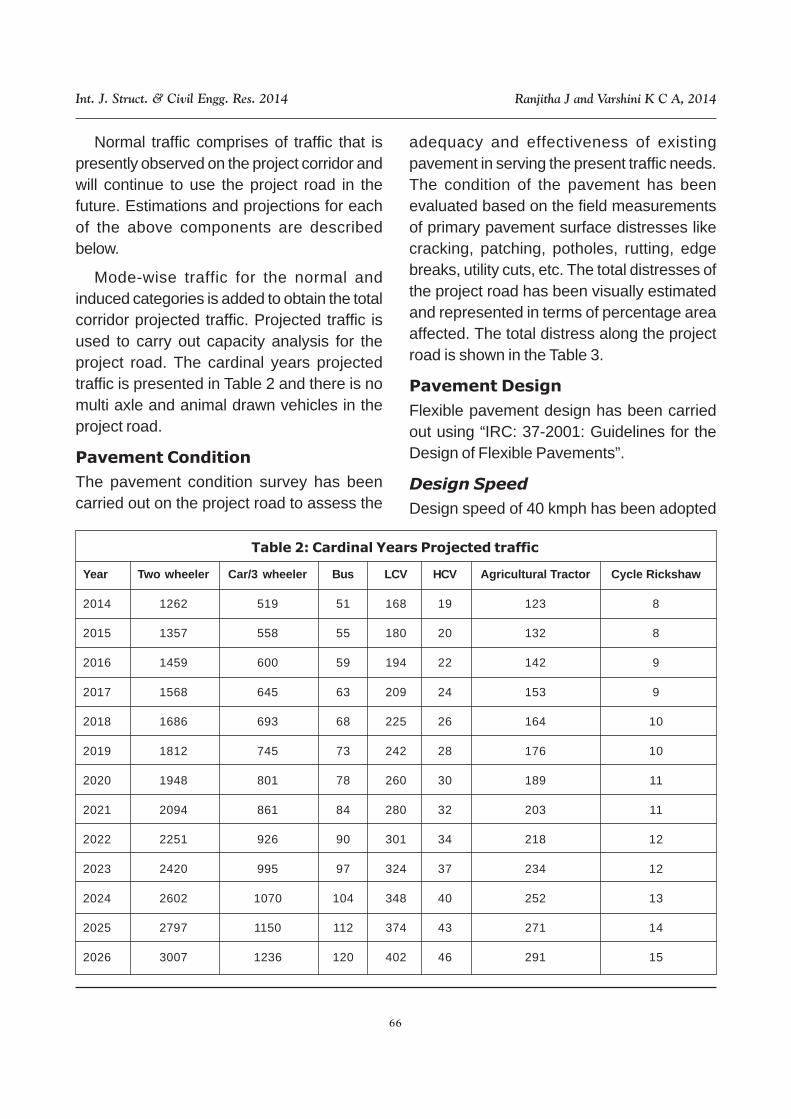
Mode-wise traffic for the normal andinduced categories is added to obtain the totalcorridor projected traffic. Projected traffic isused to carry out capacity analysis for theproject road. The cardinal years projectedtraffic is presented in Table 2 and there is nomulti axle and animal drawn vehicles in theproject road.
Pavement Condition
The pavement condition survey has beencarried out on the project road to assess the
Table 2: Cardinal Years Projected traffic
Year Two wheeler Car/3 wheeler Bus LCV HCV Agricultural Tractor Cycle Rickshaw
2014 1262 519 51 168 19 123 8
2015 1357 558 55 180 20 132 8
2016 1459 600 59 194 22 142 9
2017 1568 645 63 209 24 153 9
2018 1686 693 68 225 26 164 10
2019 1812 745 73 242 28 176 10
2020 1948 801 78 260 30 189 11
2021 2094 861 84 280 32 203 11
2022 2251 926 90 301 34 218 12
2023 2420 995 97 324 37 234 12
2024 2602 1070 104 348 40 252 13
2025 2797 1150 112 374 43 271 14
2026 3007 1236 120 402 46 291 15
adequacy and effectiveness of existingpavement in serving the present traffic needs.The condition of the pavement has beenevaluated based on the field measurementsof primary pavement surface distresses likecracking, patching, potholes, rutting, edgebreaks, utility cuts, etc. The total distresses ofthe project road has been visually estimatedand represented in terms of percentage areaaffected. The total distress along the projectroad is shown in the Table 3.
Pavement Design
Flexible pavement design has been carriedout using “IRC: 37-2001: Guidelines for theDesign of Flexible Pavements”.
Design Speed
Design speed of 40 kmph has been adopted
67
Int. J. Struct. & Civil Engg. Res. 2014 Ranjitha J and Varshini K C A, 2014
for the stretch from Sarjapur Road and GunjoorRoad via Mullur.
Carriageway Width
Width of the carriageway on the entire stretch
Table 3: Total Distress Alongthe Project Road
Total cracking (%) 0.04
Edge breaking (%) 0.9
Potholes (%) 0.01
Utility cuts (%) 0.05
Rutting (%) 0.19
varies from 5.0 m to 5.5 m. It is proposed towiden the existing carriageway to 2 lane bi-directional (7.5 m wide) with additionalunpaved shoulders of 1.45 m on either side.The entire stretch is widened to 12 m Right OfWay (ROW). Existing ROW varies from 9.0 mto 11.50 m.
Design Life
A 10-year design life has been used in thedesign of flexible pavement.
Traffic Considerations
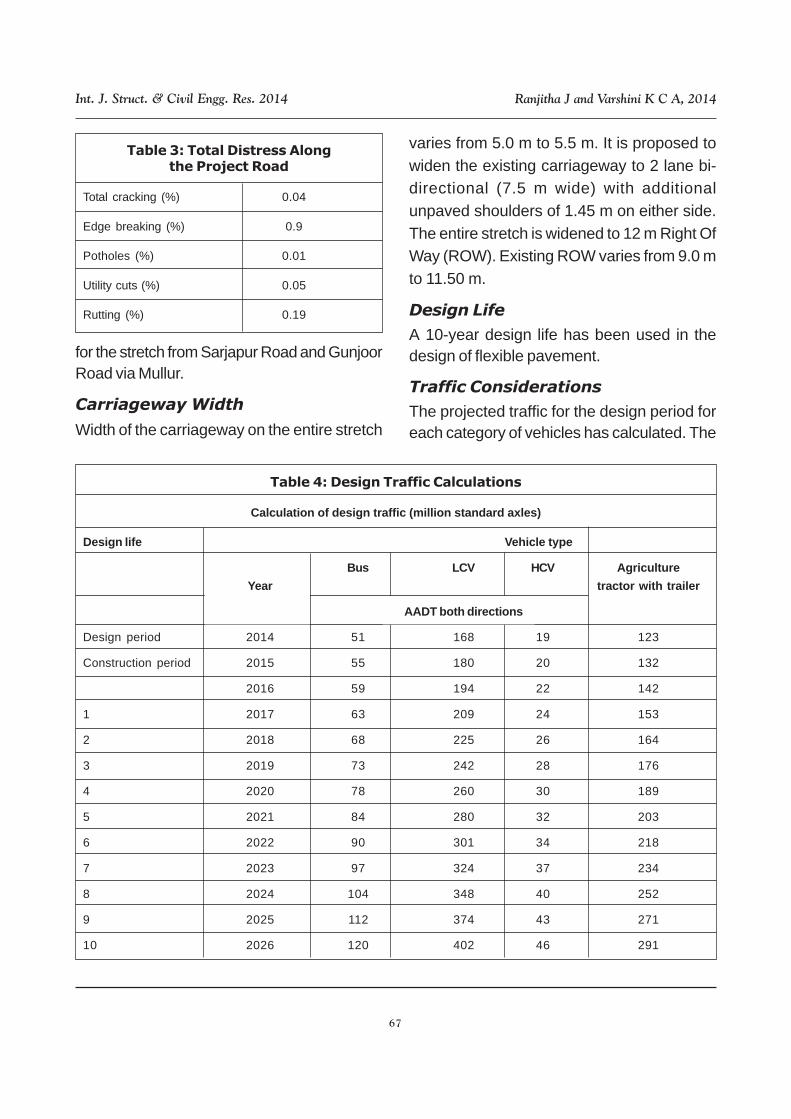
The projected traffic for the design period foreach category of vehicles has calculated. The
Table 4: Design Traffic Calculations
Calculation of design traffic (million standard axles)
Design life Vehicle type
Bus LCV HCV Agriculture
Year tractor with trailer
AADT both directions
Design period 2014 51 168 19 123
Construction period 2015 55 180 20 132
2016 59 194 22 142
1 2017 63 209 24 153
2 2018 68 225 26 164
3 2019 73 242 28 176
4 2020 78 260 30 189
5 2021 84 280 32 203
6 2022 90 301 34 218
7 2023 97 324 37 234
8 2024 104 348 40 252
9 2025 112 374 43 271
10 2026 120 402 46 291
68
Int. J. Struct. & Civil Engg. Res. 2014 Ranjitha J and Varshini K C A, 2014
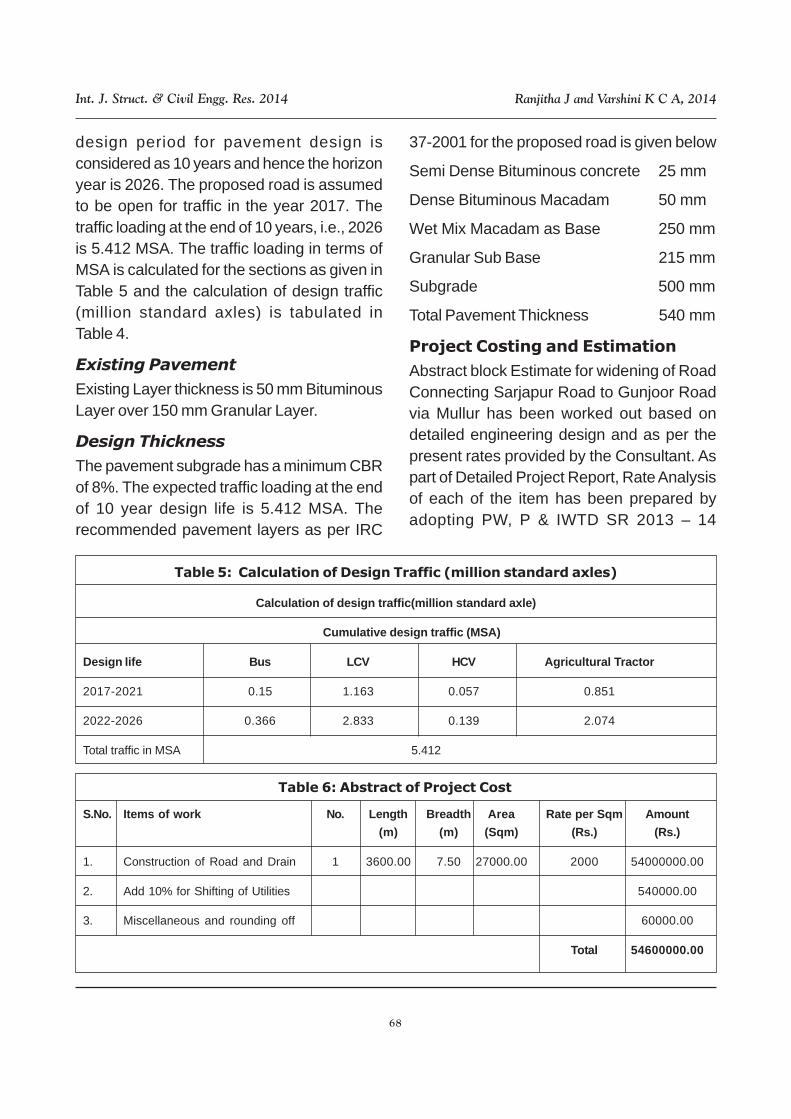
design period for pavement design isconsidered as 10 years and hence the horizonyear is 2026. The proposed road is assumedto be open for traffic in the year 2017. Thetraffic loading at the end of 10 years, i.e., 2026is 5.412 MSA. The traffic loading in terms ofMSA is calculated for the sections as given inTable 5 and the calculation of design traffic(million standard axles) is tabulated inTable 4.
Existing Pavement
Existing Layer thickness is 50 mm BituminousLayer over 150 mm Granular Layer.
Design Thickness
The pavement subgrade has a minimum CBRof 8%. The expected traffic loading at the endof 10 year design life is 5.412 MSA. Therecommended pavement layers as per IRC
Table 5: Calculation of Design Traffic (million standard axles)
Calculation of design traffic(million standard axle)
Cumulative design traffic (MSA)
Design life Bus LCV HCV Agricultural Tractor
2017-2021 0.15 1.163 0.057 0.851
2022-2026 0.366 2.833 0.139 2.074
Total traffic in MSA 5.412
37-2001 for the proposed road is given below
Semi Dense Bituminous concrete 25 mm
Dense Bituminous Macadam 50 mm
Wet Mix Macadam as Base 250 mm
Granular Sub Base 215 mm
Subgrade 500 mm
Total Pavement Thickness 540 mm
Project Costing and Estimation
Abstract block Estimate for widening of RoadConnecting Sarjapur Road to Gunjoor Roadvia Mullur has been worked out based ondetailed engineering design and as per thepresent rates provided by the Consultant. Aspart of Detailed Project Report, Rate Analysisof each of the item has been prepared byadopting PW, P & IWTD SR 2013 – 14
Table 6: Abstract of Project Cost
S.No. Items of work No. Length Breadth Area Rate per Sqm Amount
(m) (m) (Sqm) (Rs.) (Rs.)
1. Construction of Road and Drain 1 3600.00 7.50 27000.00 2000 54000000.00
2. Add 10% for Shifting of Utilities 540000.00
3. Miscellaneous and rounding off 60000.00
Total 54600000.00
69
Int. J. Struct. & Civil Engg. Res. 2014 Ranjitha J and Varshini K C A, 2014
Bangalore Circle and NHSR 2010 – 11,National Highways Circle, Bangalore.Provision of 10% of Construction cost is madein the cost estimate for raising and or shiftingelectric supply lines, telephone lines, OFC linesand other utilities.
CONCLUSION
The Project Corridor is located in SouthEastern Part of Bangalore City, whichconnects Sarjapur main Road with SH – 35which further connects to Varthur, White fieldand NH – 4. The Project Corridor is located inso thickly populated area except for Mullurvillage. Length of the project corridor is 3.6 km.The Study Area caters to considerable localand through amount of traffic commutingbetween Sarjapur Road and SH - 35. Further,the spurt in the development of SoftwareIndustries near Sarjapur Road and Whitefieldhas resulted in change of the Land UsePattern. Further, Bruhat BangaloreMahanagara Palike Government of Karnatakahas decided to take up the development ofvarious Arterial and Sub Arterial roads in andaround Bangalore city where the intensity oftraffic has increased significantly and there isa requirement for augmentation of capacity forsafe and efficient movement of traffic. Thisbeing the Background, the Bruhath BangaloreMahanagara Palike has proposed toupgrading the stretch from Gunjur to SarjapurRoad via Mullur for a total length of 3.6 km inorder to provide Uninterrupted, Seamless
Traffic Flow and to Increase Level of Servicealong the Corridor.
For the proposed Improvement Scheme,total Cost of the Project has been worked outas Rs. 5.46 cr.
REFERENCES
1. Bangalore Circle Schedule of Rates(BCSR) 2012-2013.
2. IRC: 37-2001: “Design of FlexiblePavements”.
3. IRC: 38-1988: “Design of HorizontalCurves for Highways and Design Tables”.
4. IRC: SP23-1983: “Vertical Curves forHighways”.
5. IRC: SP5-1998 (Standard Specificationsand Code of Practice for Road Bridges,Section-1, General Features of Design).
6. IRC106-1990: “Guidelines for Capacityof Urban Roads in Plain Areas.
7. IS:2720 “Methods of test for soil”.
8. Khanna S K and Justo C E G (2014),“Highway Engineering” New Chand &Bros.
9. Kadiyali L R and Lal N B (2005),Principles And Practices Of HighwayEngineering, Khanna Publishers.
10. Specifications For Road and BridgeWorks, (Fourfh Revision-2001), Ministryof Road Transport & Highways (MORTH).