Embed Size (px)
Citation preview

research papers
366 doi:10.1107/S0907444906055624 Acta Cryst. (2007). D63, 366–380
Acta Crystallographica Section D
BiologicalCrystallography
ISSN 0907-4449
On the routine use of soft X-rays in macromolecularcrystallography. Part IV. Efficient determination ofanomalous substructures in biomacromoleculesusing longer X-ray wavelengths
Christoph Mueller-Dieckmann,‡
Santosh Panjikar, Andrea
Schmidt, Simone Mueller, Jochen
Kuper, Arie Geerlof, Matthias
Wilmanns, Rajesh K. Singh,
Paul A. Tucker and Manfred S.
Weiss*
EMBL Hamburg Outstation, c/o DESY,
Notkestrasse 85, D-22603 Hamburg, Germany
‡ Present address: ESRF, 6 Rue Jules Horowitz,
BP220, F-38043 Grenoble CEDEX, France.
Correspondence e-mail:
# 2007 International Union of Crystallography
Printed in Denmark – all rights reserved
23 different crystal forms of 19 different biological macro-
molecules were examined with respect to their anomalously
scattering substructures using diffraction data collected at a
wavelength of 2.0 A (6.2 keV). In more than 90% of the cases
the substructure was found to contain more than just the
protein S atoms. The data presented suggest that chloride,
sulfate, phosphate or metal ions from the buffer or even from
the purification protocol are frequently bound to the protein
molecule and that these ions are often overlooked, especially
if they are not bound at full occupancy. Thus, in order to fully
describe the macromolecule under study, it seems desirable
that any structure determination be complemented with a
long-wavelength data set.
Received 12 October 2006
Accepted 20 December 2006
PDB References: anomalous
substructures of apoferritin,
2g4h, r2g4hsf; concanavalin
A, 2g4i, r2g4isf; glucose
isomerase, 2g4j, r2g4jsf;
human ADP-ribosylhydrolase
3, 2g4k, r2g4ksf; lysozyme,
pH 4.5, 2g4p, r2g4psf; pH
8.0, 2g4q, r2g4qsf; hydroxy-
nitrile lyase, 2g4l, r2g4lsf;
insulin, 2g4m, r2g4msf;
�-lactalbumin, 2g4n, r2g4nsf;
3-isopropylmalate dehydro-
genase, 2g4o, r2g4osf; MogA,
2g4p, r2g4psf; NBR1 PB1,
2g4s, r2g4ssf; porcine
pancreatic elastase, Na form,
2g4t, r2g4tsf; Ca form, 2g4u,
r2g4usf; proteinase K, 2g4v,
2g4vsf; ribonuclease A, C2,
2g4w, r2g4wsf; P3221, 2g4x,
r2g4xsf; thaumatin, 2g4y,
r2g4ysf; thermolysin, 2g4z,
r2g4zsf; titin-(A168-A169),
2ill, r2illsf; trypsin, P1, 2g51,
r2g51sf; P21, 2g52, r2g52sf;
P3121, 2g54, r2g55sf.
1. Introduction
The 1 August 2006 release of the Protein Data Bank (Berman
et al., 2000) contained 34 776 macromolecular crystal struc-
tures determined by X-ray crystallographic methods. A search
for prosthetic groups/ligands in these structures yielded the
result that 1066 of them (3.1%) were reported to contain one
or more phosphate ions (PDB ID PO4), 4050 (11.6%) sulfate
ions (PDB ID SO4), 1963 (5.6%) chloride ions (PDB ID CL),
848 (2.4%) potassium ions (PDB ID K) and 3295 (9.5%)
calcium ions (PDB ID CA). These numbers are surprisingly
low given the facts that NaCl or KCl are part of almost every
buffer used in protein crystallization and that ammonium
sulfate is one of the most widely used precipitants in protein
crystallization. A possible explanation for this may be that
partially occupied or partially disordered light-atom-
containing ions are often mistakenly interpreted as water
molecules. Since most protein structure refinements are based
on a diffraction data set collected at a rather short wavelength
of about 1.0 A, additional information in the form of anom-
alous differences originating from these atoms is typically not
available. Furthermore, diffraction data sets collected for
refinement purposes are typically collected with the strategy
of obtaining an as complete as possible set of structure-factor
amplitudes to the diffraction limit of the crystal. Compara-
tively little effort is spent on collecting good and complete
anomalous differences in such experiments.
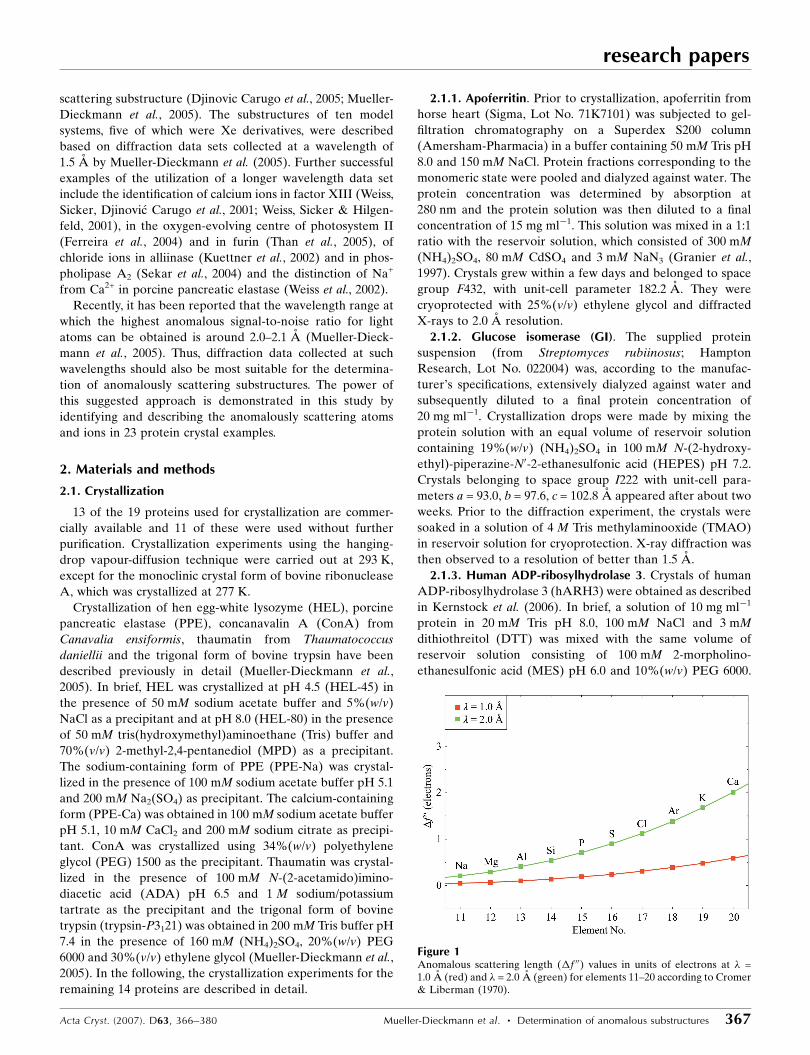
As can be seen from Fig. 1, the anomalous scattering lengths
of elements 11–20 are about three to four times larger at a
wavelength of 2.0 A than at 1.0 A. Thus, it has recently been
suggested that complementing a short-wavelength diffraction
data set, which is usually used for refinement, with a long-
wavelength data set can provide sufficient additional infor-
mation to unequivocally identify the complete anomalously
scattering substructure (Djinovic Carugo et al., 2005; Mueller-
Dieckmann et al., 2005). The substructures of ten model
systems, five of which were Xe derivatives, were described
based on diffraction data sets collected at a wavelength of
1.5 A by Mueller-Dieckmann et al. (2005). Further successful
examples of the utilization of a longer wavelength data set
include the identification of calcium ions in factor XIII (Weiss,
Sicker, Djinovic Carugo et al., 2001; Weiss, Sicker & Hilgen-
feld, 2001), in the oxygen-evolving centre of photosystem II
(Ferreira et al., 2004) and in furin (Than et al., 2005), of
chloride ions in alliinase (Kuettner et al., 2002) and in phos-
pholipase A2 (Sekar et al., 2004) and the distinction of Na+
from Ca2+ in porcine pancreatic elastase (Weiss et al., 2002).
Recently, it has been reported that the wavelength range at
which the highest anomalous signal-to-noise ratio for light
atoms can be obtained is around 2.0–2.1 A (Mueller-Dieck-
mann et al., 2005). Thus, diffraction data collected at such
wavelengths should also be most suitable for the determina-
tion of anomalously scattering substructures. The power of
this suggested approach is demonstrated in this study by
identifying and describing the anomalously scattering atoms
and ions in 23 protein crystal examples.
2. Materials and methods
2.1. Crystallization
13 of the 19 proteins used for crystallization are commer-
cially available and 11 of these were used without further
purification. Crystallization experiments using the hanging-
drop vapour-diffusion technique were carried out at 293 K,
except for the monoclinic crystal form of bovine ribonuclease
A, which was crystallized at 277 K.
Crystallization of hen egg-white lysozyme (HEL), porcine
pancreatic elastase (PPE), concanavalin A (ConA) from
Canavalia ensiformis, thaumatin from Thaumatococcus
daniellii and the trigonal form of bovine trypsin have been
described previously in detail (Mueller-Dieckmann et al.,
2005). In brief, HEL was crystallized at pH 4.5 (HEL-45) in
the presence of 50 mM sodium acetate buffer and 5%(w/v)
NaCl as a precipitant and at pH 8.0 (HEL-80) in the presence
of 50 mM tris(hydroxymethyl)aminoethane (Tris) buffer and
70%(v/v) 2-methyl-2,4-pentanediol (MPD) as a precipitant.
The sodium-containing form of PPE (PPE-Na) was crystal-
lized in the presence of 100 mM sodium acetate buffer pH 5.1
and 200 mM Na2(SO4) as precipitant. The calcium-containing
form (PPE-Ca) was obtained in 100 mM sodium acetate buffer
pH 5.1, 10 mM CaCl2 and 200 mM sodium citrate as precipi-
tant. ConA was crystallized using 34%(w/v) polyethylene
glycol (PEG) 1500 as the precipitant. Thaumatin was crystal-
lized in the presence of 100 mM N-(2-acetamido)imino-
diacetic acid (ADA) pH 6.5 and 1 M sodium/potassium
tartrate as the precipitant and the trigonal form of bovine
trypsin (trypsin-P3121) was obtained in 200 mM Tris buffer pH
7.4 in the presence of 160 mM (NH4)2SO4, 20%(w/v) PEG
6000 and 30%(v/v) ethylene glycol (Mueller-Dieckmann et al.,
2005). In the following, the crystallization experiments for the
remaining 14 proteins are described in detail.
2.1.1. Apoferritin. Prior to crystallization, apoferritin from
horse heart (Sigma, Lot No. 71K7101) was subjected to gel-
filtration chromatography on a Superdex S200 column
(Amersham-Pharmacia) in a buffer containing 50 mM Tris pH
8.0 and 150 mM NaCl. Protein fractions corresponding to the
monomeric state were pooled and dialyzed against water. The
protein concentration was determined by absorption at
280 nm and the protein solution was then diluted to a final
concentration of 15 mg ml�1. This solution was mixed in a 1:1
ratio with the reservoir solution, which consisted of 300 mM
(NH4)2SO4, 80 mM CdSO4 and 3 mM NaN3 (Granier et al.,
1997). Crystals grew within a few days and belonged to space
group F432, with unit-cell parameter 182.2 A. They were
cryoprotected with 25%(v/v) ethylene glycol and diffracted
X-rays to 2.0 A resolution.
2.1.2. Glucose isomerase (GI). The supplied protein
suspension (from Streptomyces rubiinosus; Hampton
Research, Lot No. 022004) was, according to the manufac-
turer’s specifications, extensively dialyzed against water and
subsequently diluted to a final protein concentration of
20 mg ml�1. Crystallization drops were made by mixing the
protein solution with an equal volume of reservoir solution
containing 19%(w/v) (NH4)2SO4 in 100 mM N-(2-hydroxy-
ethyl)-piperazine-N0-2-ethanesulfonic acid (HEPES) pH 7.2.
Crystals belonging to space group I222 with unit-cell para-
meters a = 93.0, b = 97.6, c = 102.8 A appeared after about two
weeks. Prior to the diffraction experiment, the crystals were
soaked in a solution of 4 M Tris methylaminooxide (TMAO)
in reservoir solution for cryoprotection. X-ray diffraction was
then observed to a resolution of better than 1.5 A.
2.1.3. Human ADP-ribosylhydrolase 3. Crystals of human
ADP-ribosylhydrolase 3 (hARH3) were obtained as described
in Kernstock et al. (2006). In brief, a solution of 10 mg ml�1
protein in 20 mM Tris pH 8.0, 100 mM NaCl and 3 mM
dithiothreitol (DTT) was mixed with the same volume of
reservoir solution consisting of 100 mM 2-morpholino-
ethanesulfonic acid (MES) pH 6.0 and 10%(w/v) PEG 6000.
research papers
Acta Cryst. (2007). D63, 366–380 Mueller-Dieckmann et al. � Determination of anomalous substructures 367
Figure 1Anomalous scattering length (�f 00) values in units of electrons at � =1.0 A (red) and � = 2.0 A (green) for elements 11–20 according to Cromer& Liberman (1970).

The crystals belong to the orthorhombic space group P212121,
with unit-cell parameters a = 57.3, b = 59.3, c = 98.7 A.
They were cryoprotected in dry paraffin oil (Riboldi-Tunni-
cliffe & Hilgenfeld, 1999) and diffracted X-rays to better than
1.7 A.
2.1.4. Hydroxynitrile lyase from Hevea brasiliensis.Hydroxynitrile lyase (HNL) was crystallized according to the
method of Wagner and coworkers (Wagner, Hasslacher et al.,
1996; Wagner, Schall et al., 1996) in the presence of Na HEPES
pH 7.0 as a buffer and (NH4)2SO4 and PEG 400 as precipi-
tants. Crystals belonged to space group C2221, with unit-cell
parameters a = 47.1, b = 106.1, c = 128.2 A. They were flash-
cooled in a solution of 20%(v/v) PEG 200 in reservoir solution
and diffracted X-rays to almost 1.0 A resolution (Gruber et al.,
1999).
2.1.5. Insulin. Zn-free bovine pancreatic insulin (Sigma, Lot
No. 033K1449) crystals were prepared by mixing protein
dissolved at a concentration of 18 mg ml�1 in 50 mM
Na2HPO4 pH 10.4 and 1 mM ethylenediaminetetraacetic acid
(EDTA) and reservoir solution containing 400 mM Na2HPO4
pH 10.4 and 10 mM EDTA in a 1:1 ratio (Nanao et al., 2005).
Crystals belonging to the cubic space group I213 with unit-cell
parameter a = 78.3 A grew within a few days. They were
cryoprotected in a 30%(v/v) solution of glycerol in water and
usually diffracted X-rays to better then 1.5 A resolution.
2.1.6. a-Lactalbumin. Crystals of bovine �-lactalbumin
(Sigma, Lot No. 063K7009) were grown according to the
method of Chrysina et al. (2000) by mixing equal amounts of a
protein solution (20 mg ml�1 in water) and reservoir [50 mM
KH2PO4 and 15%(w/v) PEG 8000]. Crystals grew within two
weeks and belonged to space group I222, with unit-cell para-
meters a = 61.6, b = 86.1, c = 88.5 A. They were cryoprotected
in a solution of 30%(v/v) glycerol in water and diffracted
X-rays to 2.4 A resolution.
2.1.7. 3-Isopropylmalate dehydrogenase (LeuB). Crystal-
lization of LeuB from Mycobacterium tuberculosis was
performed as described in Singh et al. (2005). Briefly, a protein
solution at a concentration of 10 mg ml�1 was mixed with
reservoir solution [100 mM HEPES pH 8.0, 2.0 M (NH4)2SO4
and 100 mM NaCl] in a 1.5:1 ratio. The crystals belong to space
group P212121, with unit-cell parameters a = 78.6, b = 98.6,
c = 184.0 A. After being cryoprotected in a solution of 2 M
TMAO in reservoir solution, the crystals diffracted X-rays to
about 2.0 A resolution.
2.1.8. Probable molybdopterin-binding domain (MogA).Crystals of MogA from M. tuberculosis were obtained by
mixing equal amounts of protein solution (10 mg ml�1 in Tris–
HCl pH 7.5 and 50 mM NaCl) and reservoir solution (100 mM
Tris pH 8.5 and 1 M trisodium citrate). Crystals appeared after
5 d and belonged to space group P21, with unit-cell parameters
a = 31.6, b = 97.8, c = 57.7 A, � = 105.0�. Crystals were flash-
cooled directly from their crystallization drops and diffracted
X-rays to about 1.9 A resolution.
2.1.9. NBR1 PB1 domain. Crystallization of the PB1
domain of the human scaffold protein NBR1 was performed
as described in Muller et al. (2006). In brief, crystals were
obtained using 100 mM sodium acetate pH 4.1 as a buffer and
1.6–2.2 M (NH4)2SO4 as the precipitant. Crystals belonging to
space group P6322 with unit-cell parameters a = 101.4,
c = 42.6 A diffracted X-rays to 2.15 A resolution after being
cryoprotected in dry paraffin oil.
2.1.10. Proteinase K. Proteinase K from Tritirachium album
(Merck, Lot No. VL255368) was dissolved at a concentration
of 20 mg ml�1 in 25 mM HEPES pH 7.0 with 1 mM phenyl-
methylsulfonylfluoride (PMSF) and mixed with an equal
amount of reservoir solution consisting of 25 mM HEPES pH
7.0, 1 mM PMSF and 400 mM sodium/potassium tartrate.
These crystallization conditions are somewhat different from
those reported by Betzel et al. (2001), who crystallized the
protein at pH 6.5 in the presence of NaNO3 as a precipitant.
Crystals belonging to space group P43212 with unit-cell para-
meters a = 67.8, c = 101.9 A were cryoprotected in a solution of
4 M TMAO in water. The diffraction limit was usually better
than 1.5 A resolution.
2.1.11. Ribonuclease A. Bovine ribonuclease A (RNase;
Sigma, Lot No. 063K7677) was crystallized in a monoclinic and
a trigonal crystal form. Monoclinic crystals were obtained
according to McPherson et al. (1986) by mixing equal amounts
of protein solution (20 mg ml�1 in water) with reservoir
solution [16%(w/v) PEG 4000]. Crystals belonging to space
group C2 with unit-cell parameters a = 100.1, b = 32.6,
c = 72.5 A, � = 90.6� grew within two months and could be
flash-cooled directly from the crystallization drops. They
diffracted X-rays to better than 1.5 A resolution. Trigonal
crystals were grown by mixing 10 mg ml�1 protein in 50 mM
sodium acetate pH 5.5 with the same volume of reservoir
solution consisting of 1.75 M (NH4)2SO4, 2 M NaCl and
100 mM sodium acetate pH 5.5 (Schultz et al., 1998). They
grew within a few days in space group P3221, with unit-cell
parameters a = 64.3, c = 63.7 A. They were flash-cooled in a
solution of 30%(v/v) glycerol in water and diffracted X-rays to
about 1.9 A resolution.
2.1.12. Thermolysin (TLN). Thermolysin (Calbiochem, Lot
No. B50060) from Bacillus thermoproteolyticus was dissolved
at a concentration of 100 mg ml�1 in 50 mM MES pH 6.0 and
45%(v/v) dimethylsulfoxide (DMSO) by gently shaking the
mixture for 1 h at room temperature. Undissolved particles
were then removed by centrifugation for 10 min at 15 000g.
Equal amounts of protein solution and a solution containing
50 mM MES, 1 M NaCl and 45%(v/v) DMSO were mixed and
equilibrated over a well of 35%(v/v) saturated (NH4)2SO4
solution. Crystals belonging to space group P6122 with unit-
cell parameters a = 92.5, c = 127.5 A usually appeared within a
few days. Prior to flash-cooling in a nitrogen stream at 100 K,
they were transferred into a solution of dry paraffin oil. They
typically diffract X-rays to better than 1.5 A resolution.
2.1.13. Titin-(A168-A169). A construct consisting of the
two immunoglobulin-like domains A168-A169 within the
A-band segment of human cardiac titin was produced and
crystallized as described in Mueller et al. (submitted). In brief,
crystals belonging to the orthorhombic space group I222 with
unit-cell parameters a = 69.3, b = 89.1, c = 103.6 A grew from a
cocktail containing 0.1 M bicine pH 9.2 and 1.4–1.6 M
ammonium sulfate. For data collection, they were cryocooled
research papers
368 Mueller-Dieckmann et al. � Determination of anomalous substructures Acta Cryst. (2007). D63, 366–380
in the presence of glycerol. They diffract X-rays to a resolution
of about 2.2 A.
2.1.14. Trypsin from Fusarium oxysporum. The crystal-
lization conditions for the monoclinic and triclinic crystal
research papers
Acta Cryst. (2007). D63, 366–380 Mueller-Dieckmann et al. � Determination of anomalous substructures 369
Table 1Data-collection and processing statistics for the 23 data sets.
n.d., not determined. Values in parentheses are for the highest resolution shell.
Data set ApoferritinConcana-valin A
Glucoseisomerase hARH3 HEL-45 HEL-80 HNL Insulin
�-Lact-albumin LeuB MogA NBR1 PB1
No. of crystals 1 1 1 1 1 1 1 1 1 1 1 1No. of images 1117 720 360 360 360 360 720 360 720 720 360 720�’ (�) 0.3 0.5 1 1 1 1 0.5 1 0.5 0.5 1 0.5Crystal-to-detector
distance (mm)65 80 50 50 50 50 50 50 80 60 50 80
Resolution limits (A) 99–2.00;(2.05–2.00)
99–2.40(2.46–2.40)
99–1.85(1.90–1.85)
99–1.82(1.87–1.82)
99–1.84(1.89–1.84)
99–1.84(1.89–1.84)
99–1.84(1.89–1.84)
99–1.80(1.85–1.80)
99–2.30(2.36–2.30)
99–2.00(2.05–2.00)
99–1.92(1.97–1.92)
99–2.15(2.00–2.15)
Space group F432 I222 I222 P212121 P43212 P43212 C2221 I213 P21212 P212121 P21 P6322Unit-cell parameters
a (A) 182.16 61.64 93.02 57.03 78.66 77.17 47.09 78.27 68.43 78.57 31.59 101.31b (A) 182.16 86.05 97.59 59.34 78.66 77.17 106.05 78.27 104.80 98.58 97.84 101.31c (A) 182.16 88.45 102.77 98.71 37.12 37.05 128.18 78.27 119.11 184.03 57.71 42.57� (�) 90 90 90 90 90 90 90 90 90 90 90 90� (�) 90 90 90 90 90 90 90 90 90 90 105.02 90� (�) 90 90 90 90 90 90 90 90 90 90 90 120
Mosaicity (�) 0.53 1.44 0.39 0.59 0.38 0.49 0.62 0.19 1.02 0.45 0.87 0.69Total No. of reflections 1318724 100146 500415 359216 253164 233948 329303 262194 429503 1168031 141449 253602Unique reflections 18063 9511 40126 29384 10599 10192 28327 7553 37220 97128 25783 7403Rejected reflections 166 9 60 27 9 2 32 6 468 38 1 17Redundancy 73.0 (70.7) 10.5 (9.0) 12.5 (9.9) 12.2 (9.5) 23.9 (22.4) 23.0 (17.8) 11.6 (10.1) 34.7 (15.6) 11.5 (10.5) 12.0 (11.1) 5.5 (4.0) 34.3 (26.0)Completeness (%) 99.9 (100) 99.9 (99.4) 99.8 (98.3) 95.7 (90.9) 99.9 (100) 99.9 (99.9) 100 (99.9) 99.9 (99.3) 96.4 (96.4) 99.9 (99.9) 99.6 (97.8) 99.9 (99.9)I/�(I) 81.9 (10.2) 28.4 (5.6) 19.5 (3.1) 30.7 (3.0) 59.0 (14.6) 49.8 (5.7) 26.9 (6.3) 52.3 (3.1) 15.0 (2.8) 24.3 (2.2) 17.4 (1.8) 50.4 (10.0)Rmerge (%) 6.2 (50.9) 6.7 (29.7) 14.1 (60.9) 6.0 (62.2) 5.0 (25.1) 5.3 (65.2) 7.0 (34.8) 6.3 (66.5) 10.4 (65.5) 6.9 (79.2) 7.1 (77.0) 6.4 (33.7)Rr.i.m. (%) 7.0 (51.1) 7.0 (31.5) 15.1 (66.5) 6.5 (68.7) 5.1 (25.7) 5.4 (67.2) 7.3 (36.6) 6.5 (70.8) 11.3 (77.2) 7.4 (86.8) 7.8 (82.4) 6.5 (34.3)Rp.i.m. (%) n.d. 2.1 (10.3) 4.2 (21.1) 1.8 (24.3) 1.0 (5.4) 1.1 (15.7) 2.1 (11.3) 1.1 (18.9) 3.3 (23.8) 2.1 (27.1) 3.3 (42.8) 1.1 (6.6)Ranom (%) 2.9 (1.7) 2.2 (11.2) 3.6 (21.3) 1.9 (22.9) 2.0 (4.9) 1.9 (12.0) 1.9 (9.9) 2.2 (27.6) 3.7 (21.5) 1.9 (25.9) 3.0 (39.6) 1.3 (5.9)B factor from Wilson
plot (A2)30.0 48.7 19.6 32.5 22.9 30.9 27.3 27.5 53.2 40.2 32.7 46.2
Optical resolution (A) 1.57 1.84 1.45 1.52 1.43 1.52 1.48 1.49 1.85 1.68 1.59 1.74
Data set PPE-Na PPE-CaProteinaseK
RNase A-C2
RNase A-P3221 Thaumatin Thermolysin
Titin-(A168-A169)
Trypsin-P1
Trypsin-P21
Trypsin-P3121
No. of crystals 1 1 1 1 1 1 1 1 1 1 1No. of images 360 360 360 360 360 720 720 360 360 360 360�’ (�) 1 1 1 1 1 0.5 0.5 1 1 1 1Crystal-to-detector
distance (mm)80 50 80 50 80 65 65 80 50 50 50
Resolution limits (A) 99–2.15(2.21–2.15)
99–1.84(1.89–1.84)
99–2.14(2.18–2.14)
99–1.84(1.89–1.84)
99–1.95(2.00–1.95)
99–1.98(2.03–1.98)
99–1.98(2.03–1.98)
99–2.20(2.26–2.20)
99–1.84(1.89–1.84)
99–1.84(1.89–1.84)
99–1.82(1.87–1.82)
Space group P212121 P212121 P43212 C2 P3221 P41212 P6122 I222 P1 P21 P3121Unit-cell parameters
a (A) 49.92 50.09 67.78 100.12 64.32 57.90 92.49 69.26 32.90 33.10 54.59b (A) 57.66 57.79 67.78 32.60 64.32 57.90 92.49 89.12 36.80 66.69 54.59c (A) 74.380 74.40 101.88 72.47 63.74 150.39 127.84 103.55 39.63 39.25 107.09� (�) 90 90 90 90 90 90 90 90 102.46 90 90� (�) 90 90 90 90.56 90 90 90 90 104.97 108.23 90� (�) 90 90 90 90 120 90 120 90 102.16 90 120
Mosaicity (�) 0.22 0.38 0.52 0.48 0.93 0.89 0.41 0.38 0.36 0.46 0.21Total No. of reflections 150747 233616 357530 115887 205614 465151 872807 194851 37406 77303 322233Unique reflections 12194 18269 13741 20368 11476 18685 23130 16486 12841 13012 17178Rejected reflections 11 1 21 22 56 266 51 3 0 3 13Redundancy 12.4 (10.7) 12.8 (12.3) 26.0 (20.6) 5.7 (5.3) 17.9 (16.2) 24.9 (21.2) 37.7 (32.1) 11.8 (10.3) 2.9 (2.8) 5.9 (5.7) 18.8 (16.6)Completeness (%) 99.9 (99.9) 94.8 (94.8) 100 (100) 98.4 (95.9) 99.9 (99.9) 99.9 (99.9) 99.9 (99.9) 99.0 (92.0) 88.0 (88.0) 92.5 (92.5) 99.9 (99.9)I/�(I) 60.6 (46.2) 44.7 (12.4) 71.3 (38.1) 21.6 (6.3) 24.5 (4.7) 34.8 (10.5) 51.7 (7.0) 34.1 (4.3) 28.2 (16.6) 32.1 (7.2) 44.8 (11.2)Rmerge (%) 4.3 (8.5) 4.5 (20.8) 5.3 (12.9) 7.6 (20.2) 12.3 (58.3) 8.6 (33.7) 6.7 (64.0) 5.7 (45.0) 3.1 (6.8) 4.0 (20.9) 5.7 (25.6)Rr.i.m. (%) 4.5 (9.0) 4.7 (21.8) 5.4 (13.3) 8.3 (22.3) 13.0 (61.2) 8.8 (34.5) 6.8 (65.1) 5.9 (47.3) 3.8 (8.4) 4.4 (23.1) 5.8 (26.5)Rp.i.m. (%) 1.3 (2.8) 1.3 (6.1) 1.1 (3.0) 3.4 (9.5) 3.0 (17.6) 1.7 (7.6) 1.1 (11.7) 1.7 (14.0) 2.2 (4.8) 1.8 (9.6) 1.3 (6.5)Ranom (%) 1.5 (2.3) 1.8 (5.6) 1.3 (2.6) 3.3 (7.9) 3.3 (12.4) 1.9 (5.5) 1.8 (9.6) 1.9 (15.4) 2.4 (4.7) 2.2 (10.1) 1.9 (5.9)B factor from Wilson
plot (A2)15.7 19.5 15.7 28.3 24.2 28.2 32.4 47.5 19.4 27.5 21.6
Optical resolution (A) 1.55 1.43 1.56 1.51 1.52 1.55 1.58 1.75 1.43 1.49 1.46

forms of trypsin from F. oxysporum were as described in
Rypniewski et al. (1993). Crystals belonging to space groups
P21 and P1 grew under identical conditions in the presence of
citrate as the buffering agent at pH 5.0 and of Na2SO4 as the
precipitant, with unit-cell parameters a = 33.1, b = 66.7,
c = 39.3 A, � = 108.2� and a = 32.9, b = 36.8, c = 39.6 A,
� = 102.5, �= 105.0, � = 102.2�, respectively. Both crystal forms
were cryoprotected in dry paraffin oil and diffracted X-rays to
better than 1.7 A resolution.
2.2. Diffraction data collection
Diffraction data sets were collected at the new energy-
tunable beamline X12 at the EMBL Hamburg Outstation
using a wavelength of 2.0 A (E = 6.199 keV) and a 225 mm
MAR Mosaic CCD detector. The relevant data-collection
parameters are given in Table 1. No special data-collection
strategy was employed. Since the plan was to collect 360� in
either 1, 0.5 or 0.3� images for each data set, the starting
spindle angle for the first data set was chosen randomly. For all
data sets, the 2� angle was kept at 0�. Together with the
minimum crystal-to-detector distance of 50 mm, this limited
the maximum resolution of the data sets to 1.80 A.
2.3. Data processing
All data sets were indexed and integrated using DENZO
(Otwinowski & Minor, 1997). The post-refinement procedure
in SCALEPACK (Otwinowski & Minor, 1997) was used to
refine the unit-cell parameters and the mosaicity for each data
set. Scaling and merging of the data was carried out using the
program SCALA (Collaborative Computational Project,
Number 4, 1994) and the scaling protocol SCALA-Sec as
described in Mueller-Dieckmann et al. (2004). The redun-
dancy-independent merging R factor Rr.i.m. as well as the
precision-indicating merging R factor Rp.i.m. (Weiss, 2001) were
calculated using the program RMERGE (available from http://
www.embl-hamburg.de/~msweiss/projects/msw_qual.html or
from MSW upon request).
2.4. Refinement
All 23 protein structures were refined using the program
REFMAC5 (Collaborative Computational Project, Number 4,
1994). Relevant refinement statistics are given in Table 2. The
refined coordinate files as well as the underlying structure-
factor amplitudes including anomalous differences were
deposited with the PDB (see Table 2 for PDB codes).
research papers
370 Mueller-Dieckmann et al. � Determination of anomalous substructures Acta Cryst. (2007). D63, 366–380
Table 2Refinement statistics and PDB codes for the 23 structures described.
Data set ApoferritinConcana-valin A
Glucoseisomerase hARH3 HEL-45 HEL-80 HNL Insulin
�-Lact-albumin LeuB MogA NBR1 PB1
Resolution limits (A) 30–2.00 30–2.40 30–1.85 30–1.82 30–1.84 30–1.84 30–1.84 30–1.80 30–2.30 30–2.00 30–1.92 30–2.15Total No. of reflections
In working set 17652 9332 39312 28683 10347 9949 27695 7364 34659 94983 25275 7223In test set 373 178 796 523 213 206 587 169 707 2002 474 164
Rcryst (%) 19.5 19.2 15.2 19.1 16.6 16.7 17.7 16.7 29.6 20.9 17.9 21.4Rfree (%) 21.8 26.0 17.7 24.7 21.4 20.6 19.7 22.3 35.9 26.0 24.1 32.3No. of protein atoms 1364 1809 3049 2607 1000 1001 2118 411 5856 10038 3180 691No. of water molecules 101 26 238 125 140 77 181 61 74 535 151 52No. of ions and other atoms 13 6 3 4 7 5 6 0 9 8 1 1Average B factor (A2)
All atoms 29.2 43.6 14.4 33.2 31.0 30.8 17.0 30.3 39.4 47.0 38.9 58.1Protein atoms 28.7 43.6 14.2 33.1 25.2 30.1 26.6 28.6 39.4 47.1 38.7 57.9Ions/other atoms 40.0 51.0 6.0 23.6 20.2 30.7 19.6 — 31.8 45.0 36.8 39.4
R.m.s.d. bond lengths (A) 0.017 0.018 0.019 0.025 0.025 0.020 0.018 0.025 0.029 0.020 0.019 0.016R.m.s.d. bond angles (�) 1.51 1.58 1.65 1.97 1.85 1.73 1.60 1.78 2.05 1.70 1.76 1.52PDB code 2g4h 2g4i 2g4j 2g4k 2g4p 2g4q 2g4l 2g4m 2g4n 2g4o 2g4r 2g4s
Data set PPE-Na PPE-CaProteinaseK
RNase A-C2
RNase A-P3221 Thaumatin Thermolysin
Titin-(A168-A169)
Trypsin-P1
Trypsin-P21
Trypsin-P3121
Resolution limits (A) 30–2.15 30–1.84 30–2.14 30–1.84 30–1.95 30–1.98 30–1.98 30–2.20 30–1.84 30–1.84 30–1.82Total No. of reflections
In working set 11927 17854 13399 19941 11206 18237 22604 16151 12570 12729 16825In test set 225 378 279 400 236 377 461 317 264 262 311
Rcryst (%) 15.6 14.3 16.3 21.3 17.5 19.4 19.0 21.2 16.0 15.4 15.8Rfree (%) 23.9 17.7 20.4 27.4 22.4 24.3 23.7 24.3 21.6 22.3 20.9No. of protein atoms 1831 1845 2031 1902 951 1557 2437 1532 1553 1551 1626No. of water molecules 146 200 131 87 88 100 92 95 139 153 130No. of ions and other atoms 3 2 5 2 5 1 12 2 3 2 4Average B factor (A2)All atoms 8.2 27.2 6.8 31.2 27.4 34.3 39.7 47.4 23.0 26.9 26.1Protein atoms 8.0 26.7 6.6 31.2 27.1 33.4 39.6 47.2 22.8 26.5 25.7Ions/other atoms 2.5 38.4 8.2 19.6 28.5 29.0 45.7 48.6 16.2 27.4 27.9R.m.s.d. bond lengths (A) 0.023 0.019 0.025 0.027 0.027 0.026 0.025 0.028 0.022 0.027 0.019R.m.s.d. bond angles (�) 1.79 1.59 1.79 2.31 2.13 1.97 1.90 2.22 1.81 2.16 1.68PDB code 2g4t 2g4u 2g4v 2g4w 2g4x 2g4y 2g4z 2ill 2g51 2g52 2g55
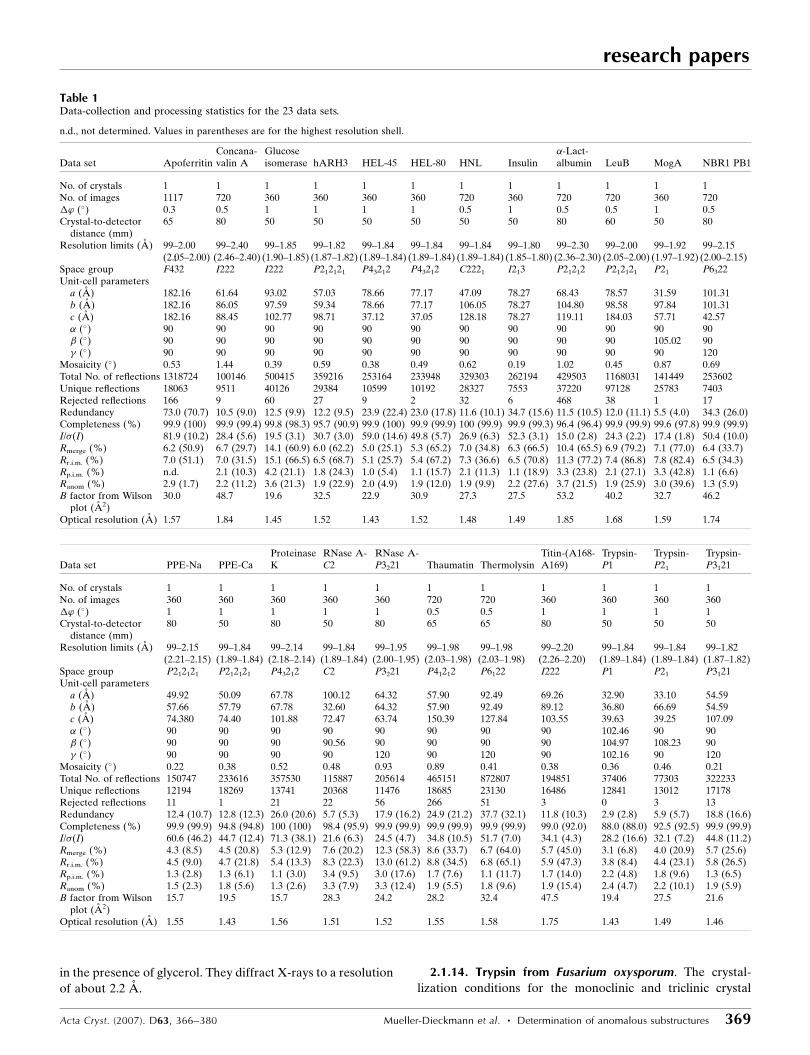
2.5. Identification and quantification of the anomaloussubstructures
Anomalously scattering atoms were identified as peaks in
anomalous difference Fourier syntheses (Table 3). In all cases,
the anomalous electron-density maps were based on all data to
the highest resolution collected without applying any cutoff to
either structure-factor amplitudes or anomalous differences.
Attempts to increase the signal in the maps by either limiting
the resolution or by applying a �-cutoff to the anomalous
differences failed (data not shown). Since it is impossible to
assign atom types based on anomalous differences collected at
just one wavelength, in some cases the chemical environment
was used to distinguish anions from cations. Occupancies of
the anomalously scattering substructure atoms were estimated
research papers
Acta Cryst. (2007). D63, 366–380 Mueller-Dieckmann et al. � Determination of anomalous substructures 371
Table 3Peak heights and ranks in the anomalous difference Fourier syntheses for the 23 structures described.
The maximum density �max and the minimum density �min are given in units of standard deviations �(�) above and below the mean value (set to 0.0) of the densitymap. The height of the lowest peak at which the analysis was stopped is also given. n.a., not assigned. The peak heights for the anomalously scattering atoms in�-lactalbumin were determined differently (see x2.5). Res. gives the resolution limits in A.
Data set ApoferritinConcana-valin A
Glucoseisomerase hARH3 HEL-45 HEL-80 HNL Insulin
�-Lact-albumin LeuB MogA
NBR1PB1
Res. 30–2.00 30–2.40 30–1.85 30–1.82 30–1.84 30–1.84 30–1.84 30–1.80 30–2.30 30–2.00 30–1.92 30–2.15�max 2.64 0.76 1.75 1.00 1.51 1.06 1.04 0.97 1.06 0.37 0.92 0.47�min �0.28 �0.16 �0.77 �0.30 �0.32 �0.33 �0.23 �0.22 �0.33 �0.17 �0.53 �0.11�(�) 0.037 0.035 0.165 0.063 0.074 0.063 0.045 0.048 0.060 0.032 0.113 0.024
Peak 1 71.5 (Cd) 21.4 (Ca) 10.6 (C305) 16.0 (C10) 20.5 (Cl) 16.8 (M12) 23.1 (C13) 20.3 (C19B) 17.0 (Ca) 12.3 (C245C) 8.1 (C117C) 20.1 (M80)Peak 2 26.2 (Cd) 5.9 (Mn) 9.5 (M306) 15.3 (M305) 18.2 (M105) 16.3 (C115) 21.1 (M171) 17.0 (C6A) 16.7 (Ca) 11.2 (M289A) 8.1 (C117A) 16.4 (M34)Peak 3 19.8 (Cd) 5.4 (Cl) 8.5 (M369) 15.2 (M84) 17.4 (C64) 15.8 (M105) 18.9 (C161) 16.5 (C11A) 15.1 (Ca) 10.1 (C245D) 7.5 (C117B) 14.3 (M70)Peak 4 18.1 (Cd) 5.2 (M129) 8.2 (M83) 14.8 (C267) 17.1 (C80) 14.3 (C30) 16.3 (C81) 15.9 (C20A) 15.1 (Ca) 9.8 (C245A) 6.9 (C24C) 5.0 (M1)Peak 5 16.9 (Cd) 4.7 (M42) 8.1 (M87) 14.4 (M139) 16.3 (M12) 14.3 (C80) 15.3 (SO4) 13.6 (C7A) 11.1 (Ca) 9.2 (M289C) 6.5 (C24A) 4.3 (Cl)Peak 6 12.4 (M148) 4.7 (Na) 7.6 (M222) 14.3 (C327) 15.5 (C30) 14.3 (C76) 12.8 (SO4) 12.8 (C7B) 10.8 (Ca) 9.0 (M289D) 4.7 (n.a.) 3.9 (n.a.)Peak 7 12.3 (Cl) 4.6 (Cl) 6.1 (M379) 14.0 (C19) 14.9 (Cl) 14.2 (C127) 12.2 (M122) 4.1 (n.a.) 8.3 (C73F) 8.1 (C245B) 4.7 (n.a.)Peak 8 11.0 (Cd) 4.5 (Cl) 5.8 (Ca) 12.6 (C271) 14.8 (C94) 14.0 (Cl) 9.6 (HEC)† 8.0 (C73E) 8.1 (C265C) 4.6 (C24B)Peak 9 10.6 (M72) 4.4 (n.a.) 5.4 (Cl) 12.6 (M203) 14.2 (Cl) 13.7 (C64) 7.2 (SO4) 8.0 (C77A) 8.0 (M265D) 4.5 (n.a.)Peak 10 9.4 (M100) 5.0 (M157) 12.4 (M65) 13.9 (C115) 12.3 (C94) 6.6 (HEC)† 7.8 (C91A) 7.8 (C217C) 4.5 (Cl)Peak 11 8.9 (C52) 5.0 (n.a.) 12.2 (M316) 13.8 (C76) 11.9 (Cl) 6.6 (HEC)† 7.7 (C61A) 7.8 (Cl) 4.4 (n.a.)Peak 12 8.5 (Cd) 4.6 (n.a.) 11.1 (M272) 13.3 (C6) 11.9 (C6) 6.4 (SO4) 7.3 (C77B) 7.3 (M217D)Peak 13 7.5 (Cl) 4.6 (n.a.) 10.8 (M1) 13.2 (Cl) 10.1 (Cl) 5.7 (Cl) 7.3 (C91B) 7.2 (C199D)Peak 14 7.1 (n.a.) 4.3 (Mg) 9.4 (C116) 13.1 (C127) 7.2 (Cl) 5.5 (SO4) 7.2 (C61C) 6.8 (M1D)Peak 15 7.1 (Cd) 4.3 (n.a.) 7.1 (Mg) 11.3 (Cl) 6.4 (Cl) 4.9 (C113) 7.2 (C91D) 6.5 (M217A)Peak 16 6.9 (C130) 6.4 (Cl) 7.7 (Cl) 5.0 (Cl) 4.8 (n.a.) 7.0 (C73C) 6.3 (SO4)Peak 17 6.8 (n.a.) 6.1 (Mg) 4.8 (Cl) 3.9 (n.a.) 4.8 (C113) 6.9 (C61D) 6.2 (M265B)Peak 18 6.7 (Cd) 5.3 (Cl) 4.6 (n.a.) 4.6 (n.a.) 6.9 (C73B) 6.2 (M265A)Peak 19 6.3 (n.a.) 5.3 (M221) 6.9 (C61B) 6.2 (M289B)Peak 20 4.8 (n.a.) 6.8 (C91C) 5.8 (M1C)Peak 21 6.8 (C111D) 5.8 (C199C)Peak 22 6.8 (C77F) 5.8 (SO4)Peak 23 6.7 (C77E) 5.7 (M265B)Peak 24 6.7 (C73A) 5.7 (Cl)Peak 25 6.6 (C111A) 5.7 (Cl)Peak 26 6.5 (C73D) 5.7 (C199B)Peak 27 6.4 (K) 5.4 (Cl)Peak 28 6.4 (C61E) 5.3 (Cl)Peak 29 6.4 (C61F) 5.2 (M265A)Peak 30 6.4 (C111B) 5.1 (n.a.)Peak 31 6.2 (C77D) 5.1 (n.a.)Peak 32 6.2 (C111C) 5.0 (n.a.)Peak 33 6.0 (C77C) 4.9 (n.a.)Peak 34 5.7 (K) 4.9 (n.a.)Peak 35 5.6 (C28D) 4.8 (Cl)Peak 36 5.5 (C6C) 4.8 (n.a.)Peak 37 5.4 (C111F) 4.8 (M217B)Peak 38 5.2 (C120D) 4.7 (n.a.)Peak 39 5.2 (C120C) 4.6 (C199A)Peak 40 5.2 (C91F) 4.6 (n.a.)Peak 41 5.1 (C111E)Peak 42 5.1 (C6B)Peak 43 4.9 (C6A)Peak 44 4.9 (C91E)Peak 45 4.8 (C28E)Peak 46 4.8 (C6D)Peak 47 4.8 (C28C)Peak 48 4.7 (C28A)Peak 49 4.7 (C28B)Peak 50 4.4 (C28F)

as described by Weiss et al. (2002) based on the relative peak
heights in the anomalous difference Fourier syntheses, with
the sulfur peaks serving as a reference. In the case of
�-lactalbumin, where the resolution of the data did not permit
resolution of the two S atoms of a disulfide bridge, the
anomalous electron-density height at the site of each anom-
alously scattering atom (Ca2+, K+, S) was calculated using the
program MAPMAN (Kleywegt & Jones, 1996). Uncertainties
in the occupancy values were estimated by comparing the
relative peak heights of the protein S atoms in the anomalous
difference Fourier syntheses and the corresponding peak
heights from a previous study (Mueller-Dieckmann et al.,
2005). As a semi-quantitative measure of the reliability of the
occupancy values, the correlation coefficients between the
peak heights for HEL-45 (ten S atoms), PPE-Ca (ten S atoms),
thaumatin (17 S-atoms) and trypsin-P3121 (14 S atoms) were
computed.
2.6. Phase-determination trials
In order to assess the usability of the anomalous signal for
phase determination, we conducted phasing experiments by
simply submitting all 23 data sets to the SAD protocol of the
AutoRickshaw pipeline (Panjikar et al., 2005). The quality of
the anomalous differences was assessed by whether the
anomalous substructure could be solved automatically and by
the map correlation coefficient between the density-modified
electron-density map and the (2Fobs � Fcalc, �calc) map, where
�calc are the model phases after refinement.
3. Results
3.1. Diffraction data collection and processing
Based on common standards, such as resolution, merging
statistics, completeness and redundancy values, all 23 diffrac-
tion data sets collected are of rather good quality (Table 1).
The maximum resolution ranges from 1.80 A for insulin to
2.40 A for concanavalin A; 11 of the 23 data sets exhibit
maximum resolutions of 1.80–1.90 A and 20 of the 23 exhibit
maximum resolutions equal or better than 2.15 A. The only
exceptions to this are the data sets for titin-(A168-A169),
�-lactalbumin and concanavalin A, with 2.20, 2.30 and 2.40 A
resolution, respectively. Also, the completeness values for all
but two of the data sets exceed 95% and in most cases (17 of
23) exceed 99%. The remaining two are the data sets of the
triclinic and monoclinic forms of trypsin from F. oxysporum,
which are only 89 and 93% complete, respectively. All data
sets could also be integrated and scaled very well as evidenced
by the merging statistics given in Table 1. The only exceptions
research papers
372 Mueller-Dieckmann et al. � Determination of anomalous substructures Acta Cryst. (2007). D63, 366–380
Data set PPE-Na PPE-CaProteinaseK
RNase A-C2
RNase A-P3221 Thaumatin Thermolysin
Titin-(A168-A169)
Trypsin-P1
Trypsin-P21
Trypsin-P3121
Res. 30–2.15 30–1.84 30–2.14 30–1.84 30–1.95 30–1.98 30–1.98 30–2.20 30–1.84 30–1.84 30–1.82�max 1.43 3.13 1.15 1.18 1.13 0.97 2.22 0.37 1.51 1.28 3.35�min �0.32 �0.49 �0.27 �0.39 �0.57 �0.25 �0.26 �0.13 �0.46 �0.36 �0.46�(�) 0.060 0.075 0.045 0.075 0.102 0.051 0.053 0.027 0.093 0.080 0.081
Peak 1 23.7 (M172) 41.7 (Ca) 24.4 (Ca) 15.7 (C72A) 11.2 (M13) 19.0 (M112) 42.3 (Ca) 13.4 (M109) 16.2 (C57) 15.6 (C41) 42.7 (Ca)Peak 2 21.5 (M41) 22.8 (M41) 20.4 (M55) 12.0 (C58B) 11.0 (C84) 17.5 (C149) 38.9 (Ca) 13.2 (C24) 14.3 (M178) 14.8 (C180) 21.0 (C31)Peak 3 20.1 (C194) 20.5 (M172) 20.3 (M225) 12.0 (C110B) 10.6 (M30) 17.4 (C77) 30.9 (Ca) 10.5 (C177) 14.2 (C165) 13.9 (C57) 20.9 (M166)Peak 4 20.0 (C30) 20.2 (C214) 20.2 (C34) 11.8 (C65A) 10.2 (C110) 17.4 (C145) 18.8 (Zn) 6.6 (M1) 14.2 (C180) 13.9 (C165) 20.1 (C47)Peak 5 19.9 (C214) 20.1 (C194) 20.0 (C123) 10.9 (C110A) 10.1 (M79) 17.2 (C9) 14.2 (M205) 5.7 (Cl) 11.7 (C41) 13.8 (M178) 18.5 (C189)Peak 6 18.6 (C127) 19.0 (C127) 19.5 (C178) 10.0 (C58A) 10.0 (Cl) 17.2 (C134) 12.2 (Cl) 4.7 (Cl) 11.3 (C216) 13.4 (C191) 17.1 (C216)Peak 7 18.3 (C46) 17.3 (C184) 18.7 (C249) 9.5 (M30A) 9.9 (C26) 16.6 (C56) 8.7 (Cl) 4.4 (n.a.) 10.8 (Cl) 10.7 (C216) 17.1 (C168)Peak 8 18.2 (C158) 17.2 (C30) 17.5 (M111) 9.4 (M30A) 9.7 (Cl) 16.5 (C204) 8.4 (Cl) 8.1 (C191) 5.7 (SO4) 16.9 (C13)Peak 9 17.9 (C184) 17.2 (C46) 17.3 (C73) 9.3 (M79B) 9.4 (M29) 16.4 (C66) 8.0 (M120) 5.1 (Cl) 5.6 (SO4) 16.9 (M92)Peak 10 17.2 (C174) 16.6 (C158) 17.1 (M154) 8.8 (C26B) 8.8 (Cl) 15.9 (C126) 7.7 (SO4) 5.0 (Cl) 5.4 (n.a.) 16.2 (C154)Peak 11 16.0 (SO4) 16.5 (C174) 16.1 (Ca) 8.6 (C65B) 7.7 (C58) 15.8 (C158) 7.1 (M120) 4.2 (n.a.) 16.0 (C115)Peak 12 9.5 (SO4) 4.2 (n.a.) 13.7 (M238) 8.5 (C84B) 7.7 (C40) 15.7 (C193) 6.4 (Cl) 15.3 (C143)Peak 13 8.0 (Na) 9.6 (K) 8.4 (M13B) 7.5 (C72) 15.1 (C121) 6.1 (Cl) 15.3 (C203)Peak 14 4.1 (n.a.) 8.3 (Cl) 8.3 (M79A) 6.6 (C95) 14.9 (C164) 5.0 (Cl) 15.0 (C122)Peak 15 5.0 (K) 7.8 (C72A) 6.3 (Cl) 14.3 (C177) 4.8 (Cl) 13.2 (C179)Peak 16 4.7 (n.a.) 7.5 (C40A) 6.2 (Cl) 12.1 (C71) 4.7 (n.a.) 8.3 (Cl)Peak 17 7.2 (M13A) 6.1 (C65) 8.6 (C159) 4.4 (Cl) 6.4 (Cl)Peak 18 7.1 (C26A) 6.0 (SO4) 4.2 (n.a.) 4.3 (n.a.) 5.4 (Cl)Peak 19 6.7 (M29B) 5.0 (n.a.) 4.2 (n.a.)Peak 20 6.5 (C84A)Peak 21 6.4 (SO4)Peak 22 6.4 (Cl)Peak 23 4.8 (M29A)Peak 24 4.5 (C95A)Peak 25 4.4 (n.a.)Peak 26 4.3 (n.a.)Peak 27 4.3 (C40B)Peak 28 4.2 (n.a.)
† HEC is denoted MEC in the corresponding deposited PDB file.
Table 3 (continued)

to this are the data sets of GI, �-lactalbumin and the trigonal
form of RNAse A. The reason why these data sets exhibit
somewhat poorer merging statistics is not clear, since the data
were collected in the same way as for the other systems.
Furthermore, all of the data sets exhibit a significant anom-
alous signal, which is manifested in the values of Ranom and the
ratio Ranom/Rp.i.m. (Table 1).
3.2. Refinement and anomalously scattering substructures
All model structures were well refined to good R and free R
factors and good geometrical parameters (Table 2), except for
�-lactalbumin, where the lower data quality probably
prevented the refinement from proceeding as smoothly as for
the other examples. Thus, the model phases derived from
these refinements are reliable and the corresponding anom-
alously scattering substructures, which were derived based on
the anomalous difference electron-density map using data
collected at � = 2.0 A in all cases, are also reliable. The
detailed compositions of the anomalously scattering
substructures are described below and shown in Fig. 2. For the
two model systems thaumatin (Fig. 2p) and insulin (Fig. 2r),
only protein S atoms were found to constitute the anomalously
scattering substructures. These two are thus not discussed any
further. In the following, the anomalously scattering
substructures of the remaining 21 systems are described in
detail.
3.2.1. Apoferritin. The substructure of apoferritin (Fig. 2a)
contains five S atoms, two partially occupied chloride ions
(occupancies q = 0.85 and 0.50) and nine partially occupied
cadmium ions (q = 0.50–0.05). Of the nine partially occupied
cadmium ions, three were found at previously reported posi-
tions (Hempstead et al., 1997), while the remaining six ion
positions did not coincide with the remaining three reported
Cd2+ positions. This also applies to the detected two Cl� ions.
None of them have been reported before.
3.2.2. Concanavalin A (ConA). In the case of ConA, the
substructure (Fig. 2d) contained two protein S atoms, one
manganese ion, one calcium ion, one sodium ion and three
partially occupied chloride ions (q = 0.85–0.65). The sodium
and the chloride ions constitute new features of this
substructure, while the positions of the manganese and
calcium ions are identical to those described previously
(Mueller-Dieckmann et al., 2005).
3.2.3. Glucose isomerase (GI). For GI, the substructure
(Fig. 2g) is composed of eight S atoms, one magnesium ion,
one calcium ion (q = 0.25) and one chloride ion (q = 0.40).
Whereas the positions of the magnesium and the calcium ions
are identical to those reported previously, the chloride posi-
tion identified here does not correspond to either of the two
chloride positions reported in PDB entry 1o1h (E. Nowak,
S. Panjikar & P. A. Tucker, unpublished work). Furthermore,
no anomalous signal could be detected for the two chloride
ions reported previously.
3.2.4. Human ADP-ribosylhydrolase 3 (hARH3). The
substructure for hARH3 (Fig. 2b) contains 15 protein S atoms,
two magnesium ions and two partially occupied chloride ions
(q = 0.45 and 0.35, respectively). The complete structure of
hARH3 has been reported elsewhere (Mueller-Dieckmann et
al., 2006).
3.2.5. Lysozyme (HEL-45 and HEL-80). The substructure
for HEL-45 (Fig. 2c), with ten protein S atoms and seven
partially occupied Cl� ions (q = 0.95–0.25), has been described
previously (PDB code 2a7d, Mueller-Dieckmann et al., 2005;
PDB code 1lz8, Dauter et al., 1999). The top four of the seven
Cl� ions found in our structure are identical to the previously
described top four chlorides. The fifth chloride position has
not been observed before, but the sixth and seventh chloride-
ion positions are in close proximity to those previously
described. In contrast, one of the previously reported posi-
tions could not be observed in our structure, probably owing
to low occupancy. The substructure for HEL-80 (Fig. 2f) also
contains all ten protein S atoms from the Cys and Met residues
and five partially occupied chloride ions (q = 0.7–0.2). Of the
two previously described chloride-ion positions (PDB code
1dpw; Weiss et al., 2000), one is among those found, whilst the
other was not found.
3.2.6. Hydroxynitrile lyase (HNL). The substructure
(Fig. 2h) is composed of six protein S atoms; two alternative
positions can be observed for Cys113 SG. In addition, the
substructure comprises three alternative sites for the one S
atom originating from an S,S-(2-hydroxyethyl)thiocysteine
(HEC) molecule, five partially occupied sulfate ions (q = 0.70–
0.25) and one partially occupied Cl� ion (q = 0.20). In the
1.90 A resolution structure of HNL (PDB code 1yas; Wagner,
Hasslacher et al., 1996; Wagner, Schall et al., 1996) one of the
sulfate ions was observed, whereas in a subsequent structure,
which was refined at 1.1 A resolution (Gruber et al., 1999),
three more sulfate ions were detected. Two of the four
previously reported sulfate positions are also part of the
anomalously scattering substructure reported here, while the
other two could not be detected. In contrast, three additional
sulfate positions as well as a Cl�-ion position were observed,
none of which have been reported before.
3.2.7. a-Lactalbumin. In hexameric �-lactalbumin, 42 of the
total 54 protein S atoms could be identified in the anomalous
difference Fourier map at a threshold of 4.0� above the mean
value of the map. In addition, six partially occupied (q = 0.85–
0.54) Ca2+ ions and two K+ ions (q = 0.40 and 0.37) could be
identified (Fig. 2j). While the Ca2+-ion positions have been
reported previously (Chrysina et al., 2000), none of the K+-ion
positions have been reported to our knowledge.
3.2.8. 3-Isopropylmalate dehydrogenase (LeuB). The
substructure of the protein, which can be described as a dimer
of dimers, consists of 22 of the totally occurring 24 protein S
atoms from the Cys and Met residues. In addition, Met165 SD
in both subunits A and B occurs in two alternative positions
(Fig. 2q). No anomalous signal was observed for the S atom of
Met1 SD of the two subunits A and B. Two partially occupied
SO2�4 ions (q = 0.50) and six partially occupied Cl�-ion posi-
tions (q = 0.50–0.35) were observed. Interestingly, the one
sulfate reported earlier (PDB code 1w0d; Singh et al., 2005)
was not observed in our substructure, although the crystals
were grown under identical conditions. However, the treat-
research papers
Acta Cryst. (2007). D63, 366–380 Mueller-Dieckmann et al. � Determination of anomalous substructures 373

research papers
374 Mueller-Dieckmann et al. � Determination of anomalous substructures Acta Cryst. (2007). D63, 366–380
Figure 2Anomalously scattering substructures for the 23 crystal systems. The proteins are depicted as C� representations with the respective Cys and Metresidues as ball-and-stick models. S atoms are shown in yellow, cations (Na+, K+, Mg2+, Ca2+, Cd2+, Zn2+, Mn2+) as blue spheres and anions (Cl�, SO2�
4 ) asred spheres. All displayed anomalous electron-density maps are shown at a 3.0� level and coloured yellow, red and blue according to the identity of thecorresponding anomalous scatterers. The views are chosen for best visibility of all substructure atoms and electron-density peaks. (a) Apoferritin. All fivesulfur positions (Cys52 SG, Met72 SD, Met100 SD, Cys130 SG and Met148 SD), two chloride and nine cadmium ions are shown with their anomalouselectron densities. (b) Human ADP-ribosylhydrolase 3 (hARH3). All 15 inherent sulfur positions (Met1 SD, Cys10 SG, Cys19 SG, Met65 SD, Met84 SD,Cys116 SG, Cys271 SG, Met139 SD, Met203 SD, Met221 SD, Cys267 SG, Met272 SD, Met305 SD, Met316 SD and Cys327 SG) along with twomagnesium and two chloride sites were identified within the anomalous substructure of the protein. (c) Hen egg-white lysozyme crystallized at pH 4.5(HEL-4.5). All ten inherent S atoms (Cys6 SG, Met12 SD, Cys30 SG, Cys64 SG, Cys76 SG, Cys80 SG, Cys94 SG, Met105 SD, Cys115 SG and Cys127 SG)could be identified plus seven chloride ions. (d) Concanavalin A. The two S atoms from the inherent methionine residues (Met42 SD and Met129 SD)along with one Mn2+, one Ca2+, one Na+ and three Cl� are represented with the corresponding anomalous electron densities. (e) Thermolysin. Inaddition to the two sulfur positions Met120 SD (which exists in two alternative positions) and Met205 SD, an anomalous signal was found for one Zn2+
ion, three Ca2+ ions, one sulfate ion and eight chloride ions. (f) Hen egg-white lysozyme crystallized at pH 8.0 (HEL-8.0). All ten inherent S atoms(Cys6 SG, Met12 SD, Cys30 SG, Cys64 SG, Cys76 SG, Cys80 SG, Cys94 SG, Met105 SD, Cys115 SG and Cys127 SG) were identified plus five chlorideions. (g) Glucose isomerase. Eight sulfur positions representing the seven methionine (Met83 SD, Met87 SD, Met157 SD, Met222 SD, Met306 SD,Met369 SD and Met379 SD) and the one cysteine (Cys305 SG) residues as well as one calcium, one magnesium and one chloride ion were identified aspart of the anomalous substructure. (h) Hydroxynitrile lyase (HNL). The substructure consists of 12 S atoms (six inherent sulfurs from Cys13 SG,Cys81 SG, Cys113 SG, Met122 SD, Cys161 SG and Met171 SD, five sulfate ions and one HEC molecule) and one chloride ion. For Cys113 SG twoalternative positions can be observed. (i) NBR1 PB1 domain. All of the four sulfur positions from Met1 SD, Met34 SD, Met70 SD and Met80 SD as wellas one chloride-ion position constitute the anomalous substructure.

research papers
Acta Cryst. (2007). D63, 366–380 Mueller-Dieckmann et al. � Determination of anomalous substructures 375
Figure 2 (continued)(j) �-Lactalbumin. One protomer (chain A) C� backbone is depicted in black and the other five protomer backbones (chains B–F) in blue. 42 of the 54protein S atoms (Cys6A/B/C/D SG, Cys28A/B/C/D/E/F SG, Cys61A/B/C/D/E/F SG, Cys73A/B/C/D/E/F SG, Cys77A/B/C/D/E/F SG, Cys91A/B/C/D/E/F SG, Cys111A/B/C/D/E/F SG and Cys120C/D SG) were identified along with six calcium and two potassium ions. (k) Titin-(A168-A169). Theanomalous substructure consists of the four S atoms from the inherent cysteine and methionine residues (Met1 SD, Cys24 SG, Met109 SD andCys177 SG) and two Cl� ions. (l) Probable molybdopterin-binding domain (MogA). In addition to the two inherent S atoms derived from Cys24 SG andCys117 SG, one additional chloride-ion position was identified to reside in the active site of the protein. (m) Ribonuclease A in the monoclinic crystalform (RNAse A-C2). In the two protomers (chains A and B) per asymmetric unit, 23 of the expected 24 inherent sulfur positions (Met13A/B SD,Cys26A/B SG, Met29A/B SD, Met30A/B SD, Cys40A/B SG, Cys58A/B SG, Cys65A/B SG, Cys72A/B SG, Met79A/B SD, Cys84A/B SG, Cys95A SG andCys110A/B SG) are above the noise level. Only the atom Cys95B SG exhibits an anomalous signal that is too low. One sulfate and one chloride ion werealso found. (n) Porcine pancreatic elastase in its sodium form (PPE-Na). All ten inherent S atoms (Cys30 SG, Met41 SD, Cys46 SG, Cys127 SG,Cys158 SG, Met172 SD, Cys174 SG, Cys184 SG, Cys194 SG and Cys214 SG) were present. Two sulfate ions and one sodium ion were also found. (o)Proteinase K. The anomalous substructure comprises the ten expected protein S atoms (Cys34 SG, Met55 SD, Cys73 SG, Met111 SD, Cys123 SG,Met154 SD, Cys178 SG, Met225 SD, Met238 SD and Cys249 SG), two potassium ions, two calcium ions and one chloride ion. (p) Thaumatin. All of the 17expected inherent sulfur positions (Cys9 SG, Cys56 SG, Cys66 SG, Cys71 SG, Cys77 SG, Met112 SD, Cys121 SG, Cys126 SG, Cys134 SG, Cys145 SG,Cys149 SG, Cys158 SG, Cys164 SG, Cys177 SG, Cys193 SG and Cys204 SG) could be found in the anomalous substructure and no additional ions werefound.

research papers
376 Mueller-Dieckmann et al. � Determination of anomalous substructures Acta Cryst. (2007). D63, 366–380
Figure 2 (continued)(q) 3-Isopropylmalate dehydrogenase (LeuB). One protomer of the protein that can be seen as a dimer of dimers is shown in black (chain A), whereasthe other three protomers (chains B–D) are in blue. 24 S atoms (the 22 protein S atoms from Met1C/D SD, Cys199A/B/C/D SG, Met217A/B/C/D SD,Cys245A/B/C/D SG, Met265A/B/C/D SD and Met289A/B/C/D SD and two sulfate ions) as well as six chloride-ion positions can be observed in theanomalous substructure. The Met165 SD atoms in both subunits A and B exist in two alternative positions. (r) Insulin. This substructure constitutes onlythe six S atoms from the inherent three disulfide bridges present in the two chains A and B (Cys6A SG, Cys7A SG, Cys7B SG, Cys11A SG, Cys19B SG,Cys20A SG). (s) Ribonuclease A in its trigonal crystal form (RNAse A-P3221). All 12 naturally occurring S atoms (Met13 SD, Cys26 SG, Met29 SD,Met30 SD, Cys40 SG, Cys58 SG, Cys65 SG, Cys72 SG, Met79 SD, Cys84 SG, Cys95 SG and Cys110 SG), one sulfate and five chloride ions constitute theanomalous substructure. (t) Porcine pancreatic elastase in its calcium form (PPE-Ca). All ten inherent S atoms (Cys30 SG, Met41 SD, Cys46 SG,Cys127 SG, Cys158 SG, Met172 SD, Cys174 SG, Cys184 SG, Cys194 SG and Cys214 SG) were present. In addition, one calcium ion was found in themetal-binding site of the protein. (u) and (v) Trypsin from F. oxysprum. The anomalous substructure of the triclinic crystal form consists of all sevennaturally occurring sulfur positions (Cys41 SG, Cys57 SG, Cys165 SG, Met178 SD, Cys180 SG, Cys191 SG and Cys216 SG) plus three chloride ions (u),whereas the substructure of the monoclinic crystal form (v) comprises the seven protein sulfur positions and two additional sulfate ions. For Cys41 SG, asecond position can be observed approximately 1.2 A away from its main position. (w) Bovine trypsin. Here, the anomalous substructure shows all of the14 protein sulfur positions (Cys13 SG, Cys31 SG, Cys47 SG, Met92 SD, Cys115 SG, Cys122 SG, Cys143 SG, Cys154 SG, Met166 SD, Met168 SD,Cys179 SG, Cys189 SG, Cys203 SG and Cys216 SG) and in addition one Ca2+ and three Cl� ions.

ment of the crystal for cryoprotection was different, which
may have led to the different substructure.
3.2.9. Probable molybdopterin-binding domain (MogA).All of the six protein S atoms of this homotrimeric protein
were visible in the anomalous difference Fourier synthesis. In
addition, a partially occupied Cl� ion (q = 0.5) was found to be
bound in the presumed phosphate-binding site of the protein
(Fig. 2l).
3.2.10. NBR1 PB1 domain. The substructure of the
NBR1 PB1 domain (Fig. 2i) contains all four protein sulfur
positions expected as well as one partially occupied Cl� ion
(q = 0.2) which has not been observed before (Muller et al.,
2006).
3.2.11. Porcine pancreatic elastase (PPE-Na and PPE-Ca).The substructures of PPE-Na with two partially occupied
SO2�4 ions (q = 0.7 and 0.4, respectively) and one fully occu-
pied Na+ ion (Fig. 2n) as well as of that of PPE-Ca (Fig. 2t)
with a partially occupied Ca2+ position (q = 0.85) have been
described previously (PDB codes 1lka and 1lkb; Weiss et al.,
2002). While a Cl� position was previously reported for PPE-
Na and PPE-Ca near the side chain of Ser14, this is not the
case here. The explanation of this may be a too low an occu-
pancy of the chloride in the case of PPE-Ca and the careful
omission of any chloride during buffer equilibration in the
case of PPE-Na.
3.2.12. Proteinase K. The anomalous substructure of
proteinase K (Fig. 2o) consists of all ten expected protein
sulfur positions, two calcium ions (q = 0.65 and 0.35), two
potassium ions (q = 0.30 and 0.15) and one chloride ion
(q = 0.40). Except for the calcium positions, none of the other
ions of the anomalous substructure have been reported in the
0.98 A resolution structure of proteinase K (PDB code 1ic6;
Betzel et al., 2001). This can be explained by the fact that the
crystal on which the 1ic6 structure is based was grown at pH
6.5 in the presence of NaNO3 as a precipitant, while the
crystals described here were grown at pH 7.0 using sodium/
potassium tartrate as the precipitant.
3.2.13. Ribonuclease A (RNase A). Of the 12 expected
sulfur positions per protomer derived from Cys and Met
residues, all 12 were observed in the trigonal crystal form,
which contains one protomer per asymmetric unit (Fig. 2s). In
addition to this, one partially occupied SO2�4 ion (q = 0.5) and
five chloride ions (q = 0.75 and 0.45) were detected. None of
these ions has been described in the published structure of
RNAse A in the trigonal form (PDB code 1fs3; Chatani et al.,
2002). In the case of the monoclinic crystal form, which
contains two protomers per asymmetric unit, only the anom-
alous signal of the S atoms of Cys95 SG in subunit B was at
3.7� below the set threshold (Fig. 2m). In addition to the
protein S atoms, one partially occupied SO2�4 ion (q = 0.4; not
at the same position as in the trigonal form) and one partially
occupied chloride ion (q = 0.3; corresponding to one Cl�
position in the trigonal form) were identified within the
monoclinic form of RNase. None of them had been described
previously (PDB code 1w4o; Jenkins et al., 2005). This is
interesting in so far as neither SO2�4 nor Cl� ions were present
in the crystallization cocktail. This can only be explained by
the fact that these ions must have remained bound to the
protein during protein preparation.
3.2.14. Thermolysin (TLN). In TLN (Fig. 2e), one Zn2+ ion
and three Ca2+ ions were found in addition to the two protein
S atoms (where Met120 SD occurs in two alternative posi-
tions), as well as one SO2�4 ion and eight partially occupied
chloride ions (q = 0.70–0.20). This substructure differs from
that previously reported (PDB code 2a7g; Mueller-Dieck-
mann et al., 2005). For the two DMSO molecules that had been
reported to bind to the surface of the protein, the explanation
may be that although DMSO was used during the crystal-
lization, it has been replaced by dry paraffin oil as cryo-
protectant. As a consequence, the two DMSO molecules may
have simply been washed off by the dry paraffin oil. The three
Ca2+ ions and the Zn2+ ion identified are located on identical
positions as reported previously. The other Ca2+ ions reported
previously are missing, but eight chloride ions have been
identified that had not been reported previously. One of the
chlorides occupies the position where an acetate ion has
previously been reported to bind. It is likely that the different
crystallization conditions caused this difference in the
substructure.
3.2.15. Titin-(A168-A169). The substructure of the two
immunoglobulin-like domains A168-A169 of human cardiac
titin (Fig. 2k) consists of all four protein S atoms and two
additional chloride ions (q = 0.35 and 0.30, respectively). The
complete structure of titin-(A168-A169) will be described
elsewhere (Muller et al., manuscript in preparation).
3.2.16. Trypsin from F. oxysporum. In the case of the
triclinic form of trypsin (Fig. 2u), all seven protein sulfur
positions could be detected in the anomalous difference
Fourier map. In addition, three partially occupied chloride
ions (q = 0.50–0.25) were found, one occupying the position
where a sulfate ion was reported to bind (PDB code 1pq5;
Schmidt et al., 2003). Because of the nearly spherical shape of
the corresponding peak in the (2Fobs � Fcalc, �calc) electron-
density map, as well as the distances to the surrounding
protein atoms of 2.6–3.9 A, the assignment of this ion as a
chloride seems to be most plausible. The other two sulfate ions
reported in PDB entry 1pq5 did not exhibit a detectable
anomalous signal, probably owing to occupancies that were
too low. The anomalous substructure of the monoclinic form
of trypsin (Fig. 2v) contains all seven protein sulfur positions
derived from Cys and Met residues and two partially occupied
sulfate ions (q = 0.35). A peak was detected in the anomalous
difference Fourier map approximately 1.2 A distant from the
SG atom of Cys41, indicating that the disulfide bridge Cys41–
Cys57 has been partially reduced during data collection.
However, owing to the extra peak being below the threshold
of 4.0�, a second conformation for Cys41 was not modelled.
Neither of the two sulfate positions coincided with the one
sulfate position previously described (PDB code 1ppz;
Schmidt et al., 2003).
3.2.17. Bovine trypsin. In the trigonal form of bovine
trypsin the substructure contains all 14 sulfurs from the
protein Cys and Met residues (Fig. 2w). Additionally, one fully
occupied Ca2+ ion as well as three partially occupied Cl� ions
research papers
Acta Cryst. (2007). D63, 366–380 Mueller-Dieckmann et al. � Determination of anomalous substructures 377

(q = 0.40–0.25) complement the protein part. Interestingly,
none of these three chloride positions coincide with the two
described previously (PDB code 2a7h; Mueller-Dieckmann et
al., 2005).
3.3. Uncertainties in occupancy values
The correlation coefficients between the peak heights of the
protein S atoms for the systems HEL-45, PPE-Ca, thaumatin
and trypsin-P3121 were 0.91, 0.83, 0.92 and 0.75, respectively,
when compared with data collected at a wavelength of 1.5 A
(8.26 keV) as reported in Mueller-Dieckmann et al. (2005).
Consequently, a safe estimate of the uncertainty in the occu-
pancy values is approximately 25% of the peak height of an S
atom. Expressed in units of electrons, this would be 0.23 e at
the wavelength used for collecting the diffraction data for this
study.
3.4. Usability of the anomalous signal for phasedetermination
11 of the 23 structures could be solved automatically using
the SAD protocol of the AutoRickshaw pipeline (Panjikar et
al., 2005). These include all high-symmetry examples (cubic,
hexagonal and tetragonal) except apoferritin. 50% of the
trigonal systems and 33% of the orthorhombic systems could
be solved, but none of the monoclinic and triclinic systems.
4. Discussion
4.1. Reliability of the substructures
The reliability of the presented anomalously scattering
substructures can best be gauged by looking at how many of
the protein S atoms that are known to be present show a
detectable signal in the anomalous difference Fourier map. In
nearly all of the presented cases practically all protein S atoms
could be observed, which lends a high degree of reliability to
the remainder of the substructure. The only real exception to
this was the case of �-lactalbumin, where only about 78% of
all protein S atoms show a strong enough signal (�4.0�) in the
anomalous difference Fourier synthesis. The reason for this
may be the relatively low resolution of the data set (2.30 A),
the relatively high overall temperature factor (�40 A2) and/or
the comparatively lower data quality. Other examples of
protein S atoms not being detected were the N-terminal Met
SDs in LeuB in two of the four subunits present in the
asymmetric unit. However, N-terminal Met residues are
notoriously flexible, so this observation is not surprising. A
second measure of the reliability of the substructure is the
noise in the anomalous electron-density map as expressed by
the peak height of the first spurious or unassigned peak in the
anomalous difference Fourier syntheses. With the sole
exception being apoferritin, all peaks above 5.0� could be
unambiguously assigned to a protein S atom or an ion bound
to the surface of the protein. Peaks between 4.0� and 5.0�could sometimes be assigned with the help of the known
protein structure or if the chemical environment permitted a
meaningful assignment. A more quantitative analysis of the
uncertainties in the occupancy values based on the correlation
coefficient between peak heights in two different data sets
from the same crystal system revealed that the error in the
peak heights is at most one quarter of the peak height of an S
atom. Consequently, the assignment of peaks to weakly bound
light-atom ions (phosphate, sulfate or chloride) with occu-
pancy values significantly below 0.25 has to be treated with
caution.
4.2. Alternative positions
In some of the cases, alternative positions could be clearly
observed for individual substructure atoms. In the case of Cys
residues which are involved in a disulfide bond, such as Cys41
in the monoclinic form of trypsin from F. oxysporum, this can
be attributed to the advent of radiation damage during data
collection. In the case of Met residues, for instance Met165 in
LeuB or Met120 in TLN, or of free Cys residues, such as
Cys113 in HNL, these alternative positions probably indicate
generic alternate side-chain conformations of the amino-acid
residues.
4.3. New features in substructures
In only two of the 23 cases studied (insulin and thaumatin)
does the anomalous substructure consist of protein S atoms
alone. This means that in more than 90% of all cases the
protein molecule binds light-atom ions such as chloride,
phosphate, sulfate, potassium calcium or others. This number
is in stark contrast to the findings in the PDB, where only
about 15% of all protein structures have other ions bound to
them. In our opinion, this can only mean that in most of the
macromolecular structures deposited in the PDB the anom-
alously scattering substructures are not completely defined.
We would therefore like to propose the collection of a long-
wavelength data set to complement and to complete any
macromolecular structure determination.
4.4. Malleability of the substructures
In some of the described cases, it was observed that
substructures may differ slightly even between crystals of the
same protein grown under identical conditions. In particular,
the ions bound to the macromolecule at low occupancy values
appear to be detectable in one experiment but not in another.
The reason for this may be that slight differences in crystal
handling may cause some alterations in the substructures. In
particular, the choice of the cryoprotectant may be crucial in
this respect. For instance, the use of paraffin oil to cryoprotect
TLN crystals may have led to the removal of surface-bound
DMSO molecules, whereas the surface-bound chloride ions
remained bound to the protein. In contrast, the use of DMSO/
glycerol as cryoprotectant apparently leads to the removal of
the surface-bound chloride ions (Mueller-Dieckmann et al.,
2005). It is typically the case, however, that the only parts of
the substructures that are affected by this are the weakly
bound compounds and ions, which exhibit low occupancy
values. Nevertheless, they are still capable of delivering some
information about the binding properties of the protein
research papers
378 Mueller-Dieckmann et al. � Determination of anomalous substructures Acta Cryst. (2007). D63, 366–380
surface, although they may just be bound to the protein
serendipitously.
4.5. Inferring function from ion binding
In some favourable cases it may be that bound ions identify
functionally important sites in the protein. For instance, the
bound chloride ion in MogA pinpoints the presumed phos-
phate-binding site and thus the active site of the protein. At
the least, careful examination of the substructure provides
additional information towards the analysis of the function of
the protein.
4.6. Usability of the anomalous signal for phasedetermination
The most obvious use of collecting good anomalous
differences in macromolecular crystallography is of course
phase determination. Although none of the data sets
described here were collected with this aim, it turned out that
11 of the 23 structures could be solved automatically based on
the anomalous differences collected. For all of the successful
cases the data redundancy was 18 or above, except for the
three successful examples belonging to the orthorhombic
crystal system [PPE-Na, PPE-Ca and titin-(A168-A169)]. It
must of course be expected that if higher redundancy data for
the lower symmetry systems were available, these structures
could also be solved. The only unsuccessful case at such high
data redundancy is apoferritin, but the reason for this example
failing in the automated structure determination is presently
not clear to us.
5. Summary and conclusions
From the results presented, it is clear that longer wavelength
data carefully collected to high redundancy and properly
processed and scaled can be very useful in establishing which
ions from the buffer or even from the purification protocol
might be bound to the protein molecule of interest. In parti-
cular, the positions and occupancies of phosphate, sulfate,
chloride, calcium etc. can be established reliably. In many cases
this information may turn out to be very important for eluci-
dating the function of a molecule. Thus, it would be desirable
that any macromolecular structure determination be comple-
mented with a long-wavelength data set.
We would like to acknowledge the support of this work by
the EC Sixth Framework Programme ‘Life Sciences, Geno-
mics and Biotechnology for Health’ (Integrated Research
project BIOXHIT, Contract No. LHSG-CT-2003-503420) as
well as by the Deutsche Forschungsgemeinschaft (DFG grant
WE2520/2 to MSW). All data described in this work, including
the diffraction images, are available to the scientific commu-
nity upon request.
References
Berman, H. M., Westbrook, J., Feng, Z., Gilliland, G., Bhat, T. N.,Weissig, H., Shindyalov, I. N. & Bourne, P. E. (2000). Nucleic AcidsRes. 28, 235–242.
Betzel, C., Gourinath, S., Kumar, P., Kau, P., Perbandt, M.,Eschenburg, S. & Singh, T. P. (2001). Biochemistry, 40, 3080–3088.
Chatani, E., Hayashi, R., Moriyama, H. & Ueki, T. (2002). Protein Sci.11, 72–81.
Chrysina, E. D., Brew, K. & Acharya, K. R. (2000). J. Biol. Chem. 275,37021–37029.
Collaborative Computational Project, Number 4 (1994). Acta Cryst.D50, 760–763.
Cromer, D. & Liberman, D. (1970). J. Chem. Phys. 53, 1891–1898.
Dauter, Z., Dauter, M., de La Fortelle, E., Bricogne, G. & Sheldrick,G. M. (1999). J. Mol. Biol. 289, 83–92.
Djinovic Carugo, K., Helliwell, J. R., Stuhrmann, H. & Weiss, M. S.(2005). J. Synchrotron Rad. 12, 410–419.
Ferreira, K. N., Iverson, T. M., Maghlaoui, K., Barber, J. & Iwata, S.(2004). Science, 303, 1831–1838.
Granier, T., Gallois, B., Dautant, A., Langlois d’Estaintot, B. &Precigoux, G. (1997). Acta Cryst. D53, 580–587.
Gruber, K., Gugganig, M., Wagner, U. G. & Kratky, C. (1999). Biol.Chem. 380, 993–1000.
Hempstead, P. D., Yewdall, S. J., Fernie, A. R., Lawson, D. M.,Artymiuk, P. J., Rice, D. W., Ford, G. C. & Harrison, P. M. (1997). J.Mol. Biol. 268, 424–448.
Jenkins, C. L., Thiyagarajan, N., Sweeney, R. Y., Guy, M. P., Kelemen,B. R., Acharya, K. R. & Raines, R. T. (2005). FEBS J. 272, 744–755.
Kernstock, S., Koch-Nolte, F., Mueller-Dieckmann, J., Weiss, M. S. &Mueller-Dieckmann, C. (2006). Acta Cryst. F62, 224–227.
Kleywegt, G. J. & Jones, T. A. (1996). Acta Cryst. D52, 826–828.
Kuettner, E. B., Hilgenfeld, R. & Weiss, M. S. (2002). J. Biol. Chem.277, 46402–46407.
McPherson, A., Brayer, G. D. & Morrison, R. D. (1986). J. Mol. Biol.189, 305–327.
Mueller-Dieckmann, C., Kernstock, S., Lisurek, M., von Kries, J. P.,Haag, F., Weiss, M. S. & Koch-Nolte, F. (2006). Proc. Natl Acad. Sci.USA, 103, 15026–15031.
Mueller-Dieckmann, C., Panjikar, S., Tucker, P. A. & Weiss, M. S.(2005). Acta Cryst. D61, 1263–1272.
Mueller-Dieckmann, C., Polentarutti, M., Djinovic-Carugo, K.,Panjikar, S., Tucker, P. A. & Weiss, M. S. (2004). Acta Cryst. D60,28–38.
Muller, S., Kursula, I., Zou, P. & Wilmanns, M. (2006). FEBS Lett. 580,341–344.
Nanao, M. H., Sheldrick, G. M. & Ravelli, R. B. G. (2005). Acta Cryst.D61, 1227–1237.
Otwinowski, Z. & Minor, W. (1997). Methods Enzymol. 276, 307–326.
Panjikar, S., Parthasarathy, V., Lamzin, V. S., Weiss, M. S. & Tucker,P. A. (2005). Acta Cryst. D61, 449–457.
Rypniewski, W. R., Hastrup, S., Betzel, C., Dauter, M., Dauter, Z.,Papendorf, G., Branner, S. & Wilson, K. S. (1993). Protein Eng. 6,341–348.
Schmidt, A., Jelsch, C., Rypniewski, W. & Lamzin, V. S. (2003). J. Biol.Chem. 278, 43357–43362.
Schultz, L. W., Hargraves, S. R., Klink, T. A. & Raines, R. T. (1998).Protein Sci. 7, 1620–1625.
Sekar, K., Rajakannan, V., Velmurugan, D., Yamane, T., Thirumur-ugan, R., Dauter, M. & Dauter, Z. (2004). Acta Cryst. D60, 1586–1590.
Singh, R. K., Kefala, G., Janowski, R., Mueller-Dieckmann, C. &Weiss, M. S. (2005). J. Mol. Biol. 346, 1–11.
research papers
Acta Cryst. (2007). D63, 366–380 Mueller-Dieckmann et al. � Determination of anomalous substructures 379
Riboldi-Tunnicliffe, A. & Hilgenfeld, R. (1999). J. Appl. Cryst. 32,1003–1005.
Than, M. E., Henrich, S., Bourenkov, G. P., Bartunik, H. D., Huber, R.& Bode, W. (2005). Acta Cryst. D61, 505–512.
Wagner, U. G., Hasslacher, M., Griengel, H., Schwab, H. & Kratky, C.(1996). Structure, 4, 811–822.
Wagner, U. G., Schall, M., Hasslacher, M., Hayn, M., Griengel, H.,Schwab, H. & Kratky, C. (1996). Acta Cryst. D52, 591–593.
Weiss, M. S. (2001). J. Appl. Cryst. 34, 130–135.Weiss, M. S., Palm, G. J. & Hilgenfeld, R. (2000). Acta Cryst. D56,
952–958.Weiss, M. S., Panjikar, S., Nowak, E. & Tucker, P. A. (2002). Acta
Cryst. D58, 1407–1412.Weiss, M. S., Sicker, T., Djinovic Carugo, K. & Hilgenfeld, R. (2001).
Acta Cryst. D57, 689–695.Weiss, M. S., Sicker, T. & Hilgenfeld, R. (2001). Structure, 9, 771–777.
research papers
380 Mueller-Dieckmann et al. � Determination of anomalous substructures Acta Cryst. (2007). D63, 366–380


![Anomalously Steep ReddeningLaw in Quasars ...1307.3305v1 [astro-ph.CO] 12 Jul 2013 Anomalously Steep ReddeningLaw in Quasars: AnExceptional Example Observed in IRAS14026+4341 Peng](https://img.pdfslide.net/doc/110x75/5abf8f7d7f8b9ac0598e86db/anomalously-steep-reddeninglaw-in-quasars-13073305v1-astro-phco-12-jul-2013.jpg)


![Interocean Exchange of Thermocline Wateragordon/publications/... · 2008-01-05 · a consequence of its anomalously high temperature relative to the atmosphere [Warren, 1983]. This](https://img.pdfslide.net/doc/110x75/5f9c011c350eda1d8a5582df/interocean-exchange-of-thermocline-water-agordonpublications-2008-01-05.jpg)