Embed Size (px)
Citation preview
Rationalisation of the structural capacity definition and quantification of roads based on falling weight deflectometer tests
May 2010
G. Salt Tonkin & Taylor Ltd T.F.P. Henning University of Auckland D. Stevens Tonkin & Taylor Ltd D.C. Roux MWH New Zealand Ltd
NZ Transport Agency research report 401

ISBN 978-0478-36408-8 (print)
ISBN 978-0478-36409-5 (electronic)
ISSN 1173 3756 (print)
ISSN 1173-3764 (electronic)
NZ Transport Agency
Private Bag 6995, Wellington 6141, New Zealand
Telephone 64 4 894 5400; facsimile 64 4 894 6100
www.nzta.govt.nz
Salt, G1, TFP Henning2, D Stevens1 and DC Roux3 (2010) Rationalisation of the structural capacity definition
and quantification of roads based on falling weight deflectometer tests. NZ Transport Agency research
report no.401. 56pp.
1 Tonkin & Taylor Ltd, www.tonkin.co.nz 2 Department of Civil and Environmental Engineering, University of Auckland, Private Bag 92019, Auckland 1142 3 MWH New Zealand Ltd, L 2, Bldg C, Millennium Centre, 600 Great Sth Rd, Greenlane, Auckland
This publication is copyright © NZ Transport Agency 2010. Material in it may be reproduced for personal
or in-house use without formal permission or charge, provided suitable acknowledgement is made to this
publication and the NZ Transport Agency as the source. Requests and enquiries about the reproduction of
material in this publication for any other purpose should be made to the Research Programme Manager,
Programmes, Funding and Assessment, National Office, NZ Transport Agency, Private Bag 6995,
Wellington 6141.
Keywords: Falling weight deflectometer (FWD), pavement life, pavement performance, pavement strength,
SNP, structural capacity, structural indices, structural numbers

An important note for the reader
The NZ Transport Agency is a Crown entity established under the Land Transport Management Act 2003.
The objective of the Agency is to undertake its functions in a way that contributes to an affordable,
integrated, safe, responsive and sustainable land transport system. Each year, the NZ Transport Agency
funds innovative and relevant research that contributes to this objective.
The views expressed in research reports are the outcomes of the independent research, and should not be
regarded as being the opinion or responsibility of the NZ Transport Agency. The material contained in the
reports should not be construed in any way as policy adopted by the NZ Transport Agency or indeed any
agency of the NZ Government. The reports may, however, be used by NZ Government agencies as a
reference in the development of policy.
While research reports are believed to be correct at the time of their preparation, the NZ Transport Agency
and agents involved in its preparation and publication do not accept any liability for use of the research.
People using the research, whether directly or indirectly, should apply and rely on their own skill and
judgement. They should not rely on the contents of the research reports in isolation from other sources of
advice and information. If necessary, they should seek appropriate legal or other expert advice.

Acknowledgements
The project team appreciate the contributions and input from the peer reviewers:
Mr David Alabaster NZTA
Dr Peter Kadar, ARRB Group Ltd
Mr Jim McQueen, Dunedin City Council
Abbreviations and acronyms
AADT Annual average daily traffic volume
AASHO American Association of State Highway Officials (until Dec 1973) AASHTO American Association of State Highway & Transportation Officials (1974 on)
AC Asphaltic concrete
ADT Average daily traffic
APT Accelerated pavement testing CAPTIF Canterbury Accelerated Pavement Testing Facility
dTIMS Deighton Total Infrastructure Management System
ESA Equivalent single axle
HDM Highway design and maintenance model (World Bank)
KPM Key performance measure
Land Transport NZ NZTA (from 2004)
LTPP Long-term pavement performance
MESA Millions of equivalent standard axles
NAASRA National Association of Australian State Roading Authorities
NCHRP National Cooperative Highway Research Program
OGPA Open-graded porous asphalt
PMS Pavement management systems
RAMM Road assessment and maintenance management system
SDC Southland District Council
SI Structural index
SIs Structural indices
SNP Adjusted structural number
Transit Transit New Zealand
Transfund Transfund New Zealand (to 2004)
VSD Vertical surface deformation
5
Contents
Executive summary ................................................................................................................................................... 7
Abstract .......................................................................................................................................................................... 9
1 Introduction...................................................................................................................................................11
1.1 Background........................................................................................................... 11
1.2 Problem statement ................................................................................................ 11
1.3 Objective of the research....................................................................................... 12
1.4 Scope of the research............................................................................................ 12
1.5 Concepts and definitions relevant to this research ................................................ 13
2 Limitations of the SNP concept.............................................................................................................15
2.1 Pavement distress modes...................................................................................... 15
2.2 Using structural number as an indicator of pavement capacity.............................. 15
2.3 NCHRP modelling of pavement strength................................................................ 17
2.4 Requirements for an improved pavement structural capacity model...................... 17
2.5 Inherent model limitations .................................................................................... 18
3 Development of improved parameters .............................................................................................20
3.1 Conceptual basis ................................................................................................... 20
3.2 Structural indices for specific distress modes........................................................ 22
3.2.1 Rutting........................................................................................................ 22
3.2.2 Roughness .................................................................................................. 24
3.2.3 Structural indices for other distress modes ................................................. 26
3.2.4 Flexure index .............................................................................................. 27
3.2.5 Shear index ................................................................................................. 27
3.3 Developing structural indices from a generic model format .................................. 27
3.4 Application to local roads...................................................................................... 29
4 Testing the indices at network level..................................................................................................30
4.1 Indices in the pavement deterioration models ....................................................... 30
4.1.1 Direct replacement of SNP with structural indices ....................................... 30
4.1.2 Redefining pavement deterioration models using the structural indices...... 33
4.2 Direct use of indices as maintenance decision tool................................................ 34
4.2.1 Network structural capacity composition..................................................... 34
4.2.2 Comparing indices with maintenance decisions .......................................... 36
4.3 Using the indices as an indicator of failure probability .......................................... 38
4.3.1 Defining failure risk for pavements ............................................................. 39
4.3.2 Theoretical approach towards developing failure probability....................... 39
4.3.3 Preliminary result on risk index development.............................................. 40
5 Findings and recommendations...........................................................................................................41
5.1 Further work required ........................................................................................... 41
6 References......................................................................................................................................................43
Appendix A: Best practice guidelines .............................................................................................................46
Appendix B: Interim APT-LTPP model of pavement performance ‒ principal elements
of the structural mechanistic model ...............................................................................................................54

6
7
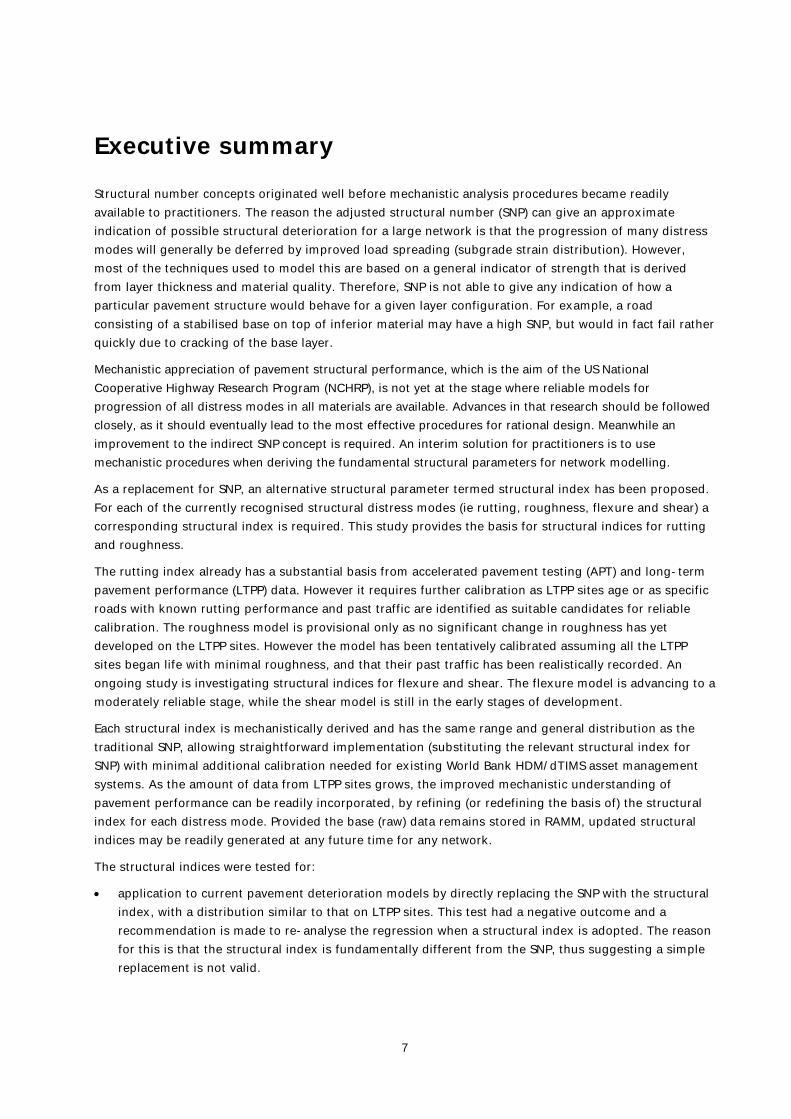
Executive summary
Structural number concepts originated well before mechanistic analysis procedures became readily
available to practitioners. The reason the adjusted structural number (SNP) can give an approximate
indication of possible structural deterioration for a large network is that the progression of many distress
modes will generally be deferred by improved load spreading (subgrade strain distribution). However,
most of the techniques used to model this are based on a general indicator of strength that is derived
from layer thickness and material quality. Therefore, SNP is not able to give any indication of how a
particular pavement structure would behave for a given layer configuration. For example, a road
consisting of a stabilised base on top of inferior material may have a high SNP, but would in fact fail rather
quickly due to cracking of the base layer.
Mechanistic appreciation of pavement structural performance, which is the aim of the US National
Cooperative Highway Research Program (NCHRP), is not yet at the stage where reliable models for
progression of all distress modes in all materials are available. Advances in that research should be followed
closely, as it should eventually lead to the most effective procedures for rational design. Meanwhile an
improvement to the indirect SNP concept is required. An interim solution for practitioners is to use
mechanistic procedures when deriving the fundamental structural parameters for network modelling.
As a replacement for SNP, an alternative structural parameter termed structural index has been proposed.
For each of the currently recognised structural distress modes (ie rutting, roughness, flexure and shear) a
corresponding structural index is required. This study provides the basis for structural indices for rutting
and roughness.
The rutting index already has a substantial basis from accelerated pavement testing (APT) and long-term
pavement performance (LTPP) data. However it requires further calibration as LTPP sites age or as specific
roads with known rutting performance and past traffic are identified as suitable candidates for reliable
calibration. The roughness model is provisional only as no significant change in roughness has yet
developed on the LTPP sites. However the model has been tentatively calibrated assuming all the LTPP
sites began life with minimal roughness, and that their past traffic has been realistically recorded. An
ongoing study is investigating structural indices for flexure and shear. The flexure model is advancing to a
moderately reliable stage, while the shear model is still in the early stages of development.
Each structural index is mechanistically derived and has the same range and general distribution as the
traditional SNP, allowing straightforward implementation (substituting the relevant structural index for
SNP) with minimal additional calibration needed for existing World Bank HDM/dTIMS asset management
systems. As the amount of data from LTPP sites grows, the improved mechanistic understanding of
pavement performance can be readily incorporated, by refining (or redefining the basis of) the structural
index for each distress mode. Provided the base (raw) data remains stored in RAMM, updated structural
indices may be readily generated at any future time for any network.
The structural indices were tested for:
application to current pavement deterioration models by directly replacing the SNP with the structural
index, with a distribution similar to that on LTPP sites. This test had a negative outcome and a
recommendation is made to re-analyse the regression when a structural index is adopted. The reason
for this is that the structural index is fundamentally different from the SNP, thus suggesting a simple
replacement is not valid.

Rationalisation of the structural capacity definition and quantification of roads based on FWD tests
8
application to pavement deterioration models, incorporating the index during the regressions of
model development stage. This test had a promising outcome showing that the indices are more
significant indicators than the SNP.
use as a direct indicator of maintenance needs. This test showed expected trends in the results.
However, it did not have a one-to-one relationship with the field decisions as it had not been part of
the field validation process. In reviewing the results, it was noted that the indices were extremely
helpful in making appropriate decisions. For example, the test highlighted that some scheduled
resurfacings were not appropriate given low indices for rutting and shoving, which suggested a need
for rehabilitation.
Further development and refinement work required are summarised in the table below.
Table 1 Further development and refinement work on indices
Item Description of further work required Data source/methodology
SIrutting Minor refinement. Calibrate to those
regions with subgrades known to perform
anomalously (eg Taranaki brown ash and
Central Plateau ashes
Roads or networks with well-known
performance (rutting distress and
known past equivalent single axle)
SIflexure Wider calibration particularly to different
surfacings: asphaltic concrete (AC) versus
open-graded porous asphalt versus
multiple seal layers
Project level testing of terminal sites
SIroughness
Major refinement, as this is an important
yet the most difficult parameter to
characterise
The challenge is to find roads that
have not been complicated by
unknown past maintenance or ‘non
traffic’ damage (eg service trenches)
SIShear
Separation of shear instability:
beneath AC surfacings
beneath thin seals on unbound basecourse
within multiple seal layers
Project level testing of terminal sites
Pavement prediction models This research has demonstrated that
pavement prediction models need to be
redeveloped/refined from first principles if
new indices are incorporated
LTPP and some limited network data
Network applicability Extend the range of the indices by
conducting more tests on other networks
Do this as part of the over-all
network testing programme
Pavement modelling Investigate further adoption of the indices
within the dTIMS system. For example, it
may well be utilised as triggers and
additional reporting measures within the
system
Deliver the structural indices to the
modelling community for further
investigation.
Risk index development The indices promise a significant value to
defining a risk index. Fundamental
development work needs to occur in this
area
Development needs to be based on
a combination of network, LTPP and
CAPTIF data
Appendix B of this report documents the recommended guidelines for FWD surveys and applications of
the structural indices. These guidelines should be viewed in their complete form and are therefore not
summarised in the executive summary.
Abstract
9
Abstract
Pavement performance modelling for New Zealand roading networks, currently relies on an adjusted
structural number (SNP) which is a single parameter intended to describe the performance of a multi-
layered pavement structure in terms of its rate of deterioration with respect to all structural distress
modes, as well as non-structural modes. This parameter had its origin in the AASHO road test in the late
1950s, before the advent of analytical methods. Hence refinement to keep abreast of current practice in
pavement engineering is overdue.
This research describes the basis for a new set of structural indices and how these can be used to obtain
improved prediction of pavement performance: both at network level and for project level rehabilitation of
individual roads. The results are (i) effective use of all the data contained in RAMM, (ii) more reliable
assignment of network forward work programmes, (iii) reduced cost through targeting only those sections
of each road that require treatment and (iv) more efficient design of pavement rehabilitation through
informed appreciation of the relevant distress mechanism that will govern the structural life of each
individual treatment length.

Rationalisation of the structural capacity definition and quantification of roads based on FWD tests
10
1 Introduction
11
1 Introduction
1.1 Background
The adjusted structural number (SNP) (previously used as modified structural number (SNC)) is the basis of
most prediction models such as the World Bank Highway Design and Maintenance (HDM) models and the
dTIMS maintenance planning system. It is an important measure of the pavement capacity of networks
(especially for performance-based networks). It is the only measure to date that tells asset managers how
much capacity/life can be expected from their networks. However, the SNP principle has its limitations
which include:
It can be measured and determined in different ways and these methods do not always correspond
(HTC 1999).
It is based on the American Association of State Highway and Transportation Officials (AASHTO)
design philosophy that aims to protect the subgrade – although in many cases New Zealand roads fail
due to the weakness of constructed layers. For example, a strong pavement with a high SNP may still
fail within the first year of construction due to a weak basecourse.
The original (most widely used) SNP derivation is based on the summation of empirical layer
coefficients, which are based on either test pits layer information or falling weight deflectometer
(FWD) tests. Current research, however, is showing that much greater predictive reliability can be
achieved by deriving SNP from a more fundamental relationship with permanent deformation and
supplementing the determination with other (non-destructive) parameters usually available in the
RAMM database: i) FWD; ii) high-speed data (rutting and roughness) and iii) past traffic (equivalent
single axles (ESA)). This advantage is now practical because of the availability of high-speed data
collected annually for the network.
SNP is a fundamental parameter for network analysis, and while it currently has deficiencies, it should be
retained because of its well-established role describing pavement performance in terms of a single
parameter. This report documents a process to rationalise the derivation of the parameter rather than
seek an entirely new prediction procedure.
1.2 Problem statement
Road asset management systems are generally based on the concept of assigning a single parameter that
relates to the characteristic structural capacity (sometimes loosely termed ‘strength’) of a defined segment
of pavement. These segments are intended to represent potential treatment lengths that are essentially
uniform in performance. The structural number concept was one of the most widely used parameters for
many decades and while significant changes have evolved (ie SNC and SNP) the original basic principal was
to provide a representation of the load-bearing ability of a pavement. Pavements are consequently ranked
according to the relative permanent deformation expected within the subgrade for a given number of
standard load repetitions.
The SNP can therefore be used as an approximate indicator for the structural life of pavements provided
that:
1 rutting is the governing distress mechanism, ie no other trigger for rehabilitation applies
2 the majority of the rutting occurs in the subgrade rather than within overlying layers
Rationalisation of the structural capacity definition and quantification of roads based on FWD tests
12
3 the treatment length is correctly defined and relates to a uniform sub-section
4 the appropriate percentile (rather than average) SNP is determined corresponding to the percentage of
road in a terminal condition which would trigger rehabilitation.
These four conditions must be satisfied before SNP can be used. The first condition, however, is
questionable for many roading networks (Henning et al 2006), indicating a substantial limitation to the SN
concept that needs to be addressed. In particular:
The governing distress mode (ie the distress mechanism that triggers rehabilitation of any given
treatment length) must be determined before any rational or reliable indicator of pavement
life/structural capacity can be calculated.
To determine the governing distress mode, deterioration models need to examine all potential
distress modes using relevant parameters for each one. For example, when predicting cracking, an
index should be used that reflects the pavement’s stiffness and fundamental tensile strain conditions.
1.3 Objective of the research
There are currently many decisions – with substantial cost consequences – being made about network
management that are based on an outdated parameter. These can be rationalised to provide a markedly
more robust prediction of long-term pavement performance (LTPP). The task is now to apply the results of
recent CAPTIF and interim LTPP research efforts to all NZTA and local authority sites and then to a variety
of NZTA and local authority networks. The results of this task will calibrate and substantiate a new
structural capacity derivation that will remedy the current limitations inherited from the SNP concept.
The objective of this research was to provide a method of deriving a structural measure that would deliver
a parameter based on fundamental principles relating directly to the performance of pavements that have
been closely monitored. Documentation on pavement performance dating back more than a decade is
available from CAPTIF as a result of annual monitoring since 1999 of national LTPP sites set up by NZTA
(formerly Transit NZ), and since 2003 of those set up by local authorities.
In order to achieve the above objective the following had to be undertaken:
Develop structural indices, on the basis of fundamental mechanistic principles, to quantify the
pavement structural capacity of road networks in New Zealand.
Test the new structural indices in terms of their applicability to pavement performance modelling,
maintenance decision processes and road network reporting.
Investigate the potential of these indices to forecast the risk of pavement failure.
With an improved structural capacity measure, the outcome should be a robust, statistically derived
sampling regime policy for FWD tests.
1.4 Scope of the research
The original objectives and scope of the research envisaged an outcome that would result in some
adjustment to the SNP/SNC concept. However, the research was successful in delivering a completely new
concept, which will significantly improve the usefulness and applicability of the structural number concept
for both asset management and maintenance design purposes.
This report discusses the delivery of the following outcomes:
1 Introduction
13
a framework for reporting pavement structural capacity/performance based on multiple structural
indices (SI), one for each distress mode including:
SIRutting
SIFlexure
SIRoughness
SIShear
successfully tested the applicability of these indices on network FWD data
demonstrated the significance of the indices as independent variables within the New Zealand
pavement predictions models.
1.5 Concepts and definitions relevant to this research
Given the nature of this research, there is a strong overlap between pavement design principles and
principles used for asset and network management. For example, both use the word ‘model’ to describe a
mathematical/statistical expression that forecasts the future ‘performance’ of the road pavement. This
section explains the difference between these approaches and defines the definitions applicable to this
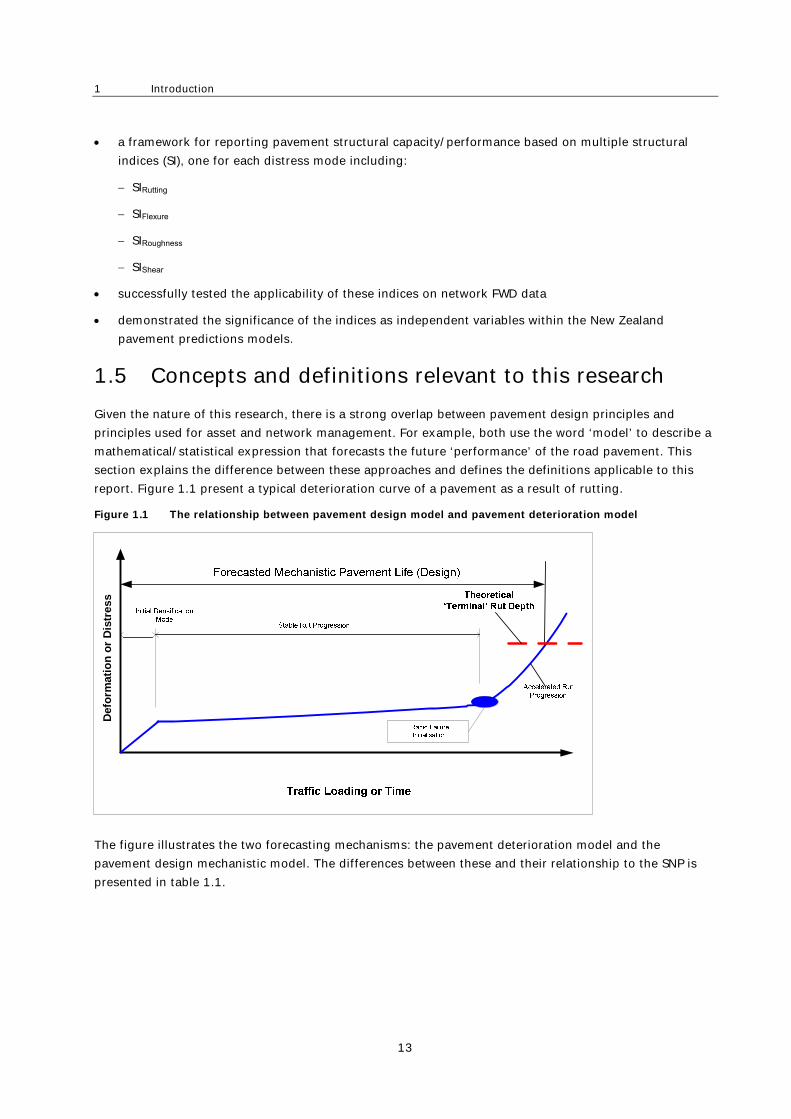
report. Figure 1.1 present a typical deterioration curve of a pavement as a result of rutting.
Figure 1.1 The relationship between pavement design model and pavement deterioration model
The figure illustrates the two forecasting mechanisms: the pavement deterioration model and the
pavement design mechanistic model. The differences between these and their relationship to the SNP is
presented in table 1.1.
Def
orm
atio
no
rD
istr
ess

Rationalisation of the structural capacity definition and quantification of roads based on FWD tests
14
Table 1.1 The relationship between SNP/SNC for respective applications
Application Description How the SNP/SNC relates
Pavement deterioration models eg:
initial rut depth
stable rut progression
probability of accelerated rutting
Most of the New Zealand-based
deterioration models consist of:
probabilistic empirical models,
which predict the initiation of a
defect or occurrence
empirical deterministic model,
which predicts the progression
of a defect.
Almost all the New Zealand and
HDM-4 models use SNP as an
indicator of pavement structural
capacity as an independent variable.
Mechanistic design models (eg
Austroads 2009)
These models use layered elastic
theory in order to model the
stresses and strains for given layers
and subgrade. Once the stresses
and strains are calculated/ modelled
for a standard load ESA, transfer
functions are used to calculate the
ultimate life/capacity of the
pavement.
In theory, there is not necessarily a
relationship with SNP/SNC. However,
through research, empirical
relationships have been developed
to relate SNP/SNC to in situ test
results such as the deflection bowl
from FWD (Salt 1999).
Structural indices:
SIRutting
SIFlexure
SIRoughness
SIShear
The structural indices consist of a
combination of the mechanistic
behaviour of the pavement as
measured with the FWD and
pavement condition.
One would not expect a one-to-one
relationship with the SNP as these
indices describe different failure
mechanisms. Later chapters in this
report contain more details.

2 Limitations of the SNP concept
15
2 Limitations of the SNP concept
2.1 Pavement distress modes
Dawson (2002) identified 23 distress modes in pavements, although some of these are consequential
manifestations of one or more of the other listed modes, and others are surfacing wear rather than
structural deterioration. The focus of the current study is to provide improved systems for structural life
prediction, based primarily on pavement data that are routinely measured in current practice, ie
information currently stored in RAMM.
If one excludes non-structural distress modes, those that are rarely encountered and those that refer to
unsealed roads, Dawson’s 23 modes can be reduced to the following:
Rutting – vertical surface deformation resulting primarily from one dimensional densification (compaction)
of the pavement layers and the subgrade. Some lateral movement may also take place in the early
life of the pavement but in the current classification for ‘rutting’ it is assumed lateral movement
rates will be minimal after the ‘bedding in’ phase.
Shear – lateral deformations or shoving within the pavement layers primarily related to shear. There will
be an associated increase in rut depth which is likely to increase rather than stabilise with ongoing
load repetitions. Shear instability will commonly lead quickly to subsequent defects such as
cracking of the surfacing, pumping and potholing.
Roughness – loss of shape longitudinally along each wheel path. There are two prominent causes of
roughness progression which include environmental effects and traffic load (Watanatada et al
1987). The load associated progression is primarily governed by structural non-uniformity
(longitudinally) leading to variations in rut depth. Roughness could also be a secondary effect of
shear instability and repaired defects such as crack sealing and pothole patches.
Flexure – the imposition of horizontal strains within the surfacing as a result of trafficking. Strain reversal
will occur as the deflection bowl passes along the wheel path: (compressive – tensile –
compressive) at the bottom of the surfacing and generally the reverse sequence at the top. The
tensile strains result in crack initiation within the surfacing, followed by water ingress, secondary
shear instability, pumping and potholing. This mode primarily affects the surfacing and usually
results in excessive maintenance costs. Additional surfacing may be sufficient for substantial life
extension if the existing surfacing is thin, but thick or aged surfacings suffering from excessive
flexure are likely to require replacement or other structural rehabilitation.
2.2 Using structural number as an indicator of pavement capacity
The empirical structural number concept has been widely used in American procedures. It had its origin in
the American Association of State Highway Officials (AASHO) road tests in the late 1950s, before
mechanistic design methods were in general use (AASHTO 1986). In the 1980s and 90s, structural number
became the structural backbone of the HDM III model (Watanatada et al 1987) and the AASHTO pavement
design guide (AASHTO 1986). However as AASHTO moved towards mechanistic design in the originally
planned 2002 release of its mechanistic pavement design guide (M-EPDG) (now under continuing
development as the NCHRP (Ullidtz and Larsen 1998)), the structural number concept was abandoned for
Rationalisation of the structural capacity definition and quantification of roads based on FWD tests
16
the purposes of project level assessments. However at the network level the HDM-4 model still retains the
concept as SNP.
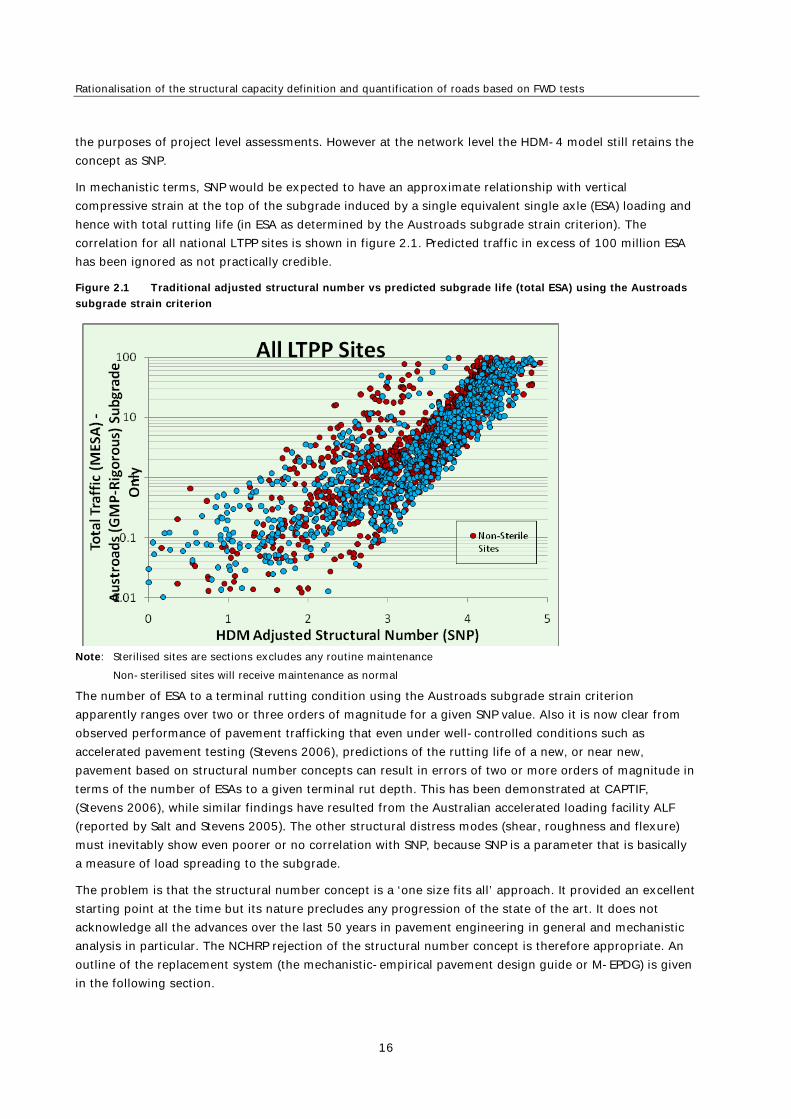
In mechanistic terms, SNP would be expected to have an approximate relationship with vertical
compressive strain at the top of the subgrade induced by a single equivalent single axle (ESA) loading and
hence with total rutting life (in ESA as determined by the Austroads subgrade strain criterion). The
correlation for all national LTPP sites is shown in figure 2.1. Predicted traffic in excess of 100 million ESA
has been ignored as not practically credible.
Figure 2.1 Traditional adjusted structural number vs predicted subgrade life (total ESA) using the Austroads
subgrade strain criterion
Note: Sterilised sites are sections excludes any routine maintenance
Non-sterilised sites will receive maintenance as normal
The number of ESA to a terminal rutting condition using the Austroads subgrade strain criterion
apparently ranges over two or three orders of magnitude for a given SNP value. Also it is now clear from
observed performance of pavement trafficking that even under well-controlled conditions such as
accelerated pavement testing (Stevens 2006), predictions of the rutting life of a new, or near new,
pavement based on structural number concepts can result in errors of two or more orders of magnitude in
terms of the number of ESAs to a given terminal rut depth. This has been demonstrated at CAPTIF,
(Stevens 2006), while similar findings have resulted from the Australian accelerated loading facility ALF
(reported by Salt and Stevens 2005). The other structural distress modes (shear, roughness and flexure)
must inevitably show even poorer or no correlation with SNP, because SNP is a parameter that is basically
a measure of load spreading to the subgrade.
The problem is that the structural number concept is a ‘one size fits all’ approach. It provided an excellent
starting point at the time but its nature precludes any progression of the state of the art. It does not
acknowledge all the advances over the last 50 years in pavement engineering in general and mechanistic
analysis in particular. The NCHRP rejection of the structural number concept is therefore appropriate. An
outline of the replacement system (the mechanistic-empirical pavement design guide or M-EPDG) is given
in the following section.

2 Limitations of the SNP concept
17
2.3 NCHRP modelling of pavement strength
With the 2002 pavement design guide (explained during the development stage by Tseng and Lytton
1989), the NCHRP has adopted a mechanistic-empirical pavement model, where all inputs are pavement
properties that define the response of pavement to traffic and climate loads, primarily by assessing the
moduli of the pavement materials and hence allowing determination of stress and strains throughout the
pavement under a standard axle load. Empirical criteria are then derived from observed performance to
complete the model.
Assessment of structural adequacy for an existing pavement is based upon:
load-related distress, trafficking spectra
material durability
back-calculated layer elastic moduli
visual examination of pavement cores
physical testing of samples to determine moduli and strength.
For the structural modelling of a pavement, critical stresses, strains and displacements (due to traffic
loading and climatic factors) are calculated over the total pavement thickness in a layered elastic model
using layered elastic theory. The M-EPDG uses either linear elastic or finite element methods for non-
linear materials. The pavement is modelled to accumulate monthly damage over the design period. This
‘incremental damage’ is then related to specific distress modes with calibrated empirical models relative
to pre-defined treatment criteria. The model for each distress mode incorporates only those physical
properties that current research has shown contribute to the mechanism of pavement failure. That is, it
requires fundamental pavement layer properties instead of conventional empirical parameters like SNP.
Since there is a large degree of uncertainty in the input data, much of the modelling utilises probability
distributions for the data, and the designer can then select the level of design reliability they wish to
proceed with. The model has been designed with the data available from the US LTPP sites. In particular
the enhanced integrated climatic model, EICM, uses a large body of climatic data collected alongside
structural and traffic data for pavements to give sound inputs for seasonal variation in pavement stresses.
Mechanistic modelling in the Austroads (2009) guide to pavement technology series is more simplistic,
but does not explicitly consider the same number of distress modes addressed by the M-EPDG. Ultimately
the M-EPDG is likely to provide an effective and comprehensive means of pavement design and
performance prediction. However, so far it has been poorly supported, apparently due to its complexity.
Many of its parameters are not currently available in the RAMM database; hence at this time it is
impractical for local practitioners. However, there is scope for a pavement capacity model which is
intermediate between NCHRP and Austroads procedures, limited solely to parameters currently contained
in RAMM.
2.4 Requirements for an improved pavement structural capacity model
The focus of this study has been to establish a practical system for improved prediction of pavement
structural capacity. The essential elements for the system are:
1 Rational modelling of all relevant structural distress modes using fundamental mechanistic concepts
including allowance for either linear elastic or non-linear materials as applicable.
Rationalisation of the structural capacity definition and quantification of roads based on FWD tests
18
2 Ensuring practical inputs, ie limiting to collected data (or data that can readily be collected).
3 Straightforward incorporation into existing asset management software (eg dTIMS) and pavement
deterioration models contained in the software.
4 Ease of incorporating improvements to pavement technology or data collection methods.
5 Ease of calibration to different networks or sub-networks where different materials or construction
practices apply.
The NCHRP model meets only the first of the above five criteria and hence at this stage has not been
regarded as suitable for inclusion in the study or for consideration by practitioners who need a system for
immediate application. It will, however, be important to continue to review the status and potential for
future application of this major research project.
Austroads principles apply to most of the five criteria. A key exception is that the Austroads principles do
not fully acknowledge non-linear (stress dependent) moduli. Many parts of Australia have materials that
are not saturated silts/clays and hence are essentially linear elastic, (D Mangan pers comm.). However
those in New Zealand are predominantly non-linear as shown in a study of New Zealand LTPP site
characteristics (Salt and Stevens 2006).
An interim measure for improved pavement modelling is a replacement of the SNP with mechanistically
derived and fundamental structural parameters for rational prediction of pavement behaviour. Separate
parameters are required for each structural distress mode under consideration. SNP is incorporated in
many pavement deterioration models used in management systems such as dTIMS. This report presents
the rutting and roughness parameters which have been developed based on observed performance from
both APT and national LTPP sites. Mechanistic analyses have been used to determine the moduli, stresses
and strains under a single ESA loading.
In order to establish the basis for pavement structural capacity models, it was necessary to first define all
the essential rules or characteristics that the model must acknowledge (and hence incorporate) in order to
be rational and then carry out the development in such a way that ensured the model remained as simple
as possible for practical purposes. As a result of the literature study and APT/LTPP data, about 20
essential elements for a pavement performance model were defined (see appendix A).
The reason for setting out the elements that need to be considered in the model (intended to reflect
current consensus) is so that the basis of the current model can be readily understood and critically
reviewed by other practitioners. Hence this process should facilitate future refinements or revisions of the
capacity model. The need for refinement will be indicated by better or more easily generated parameters
that show improved prediction. These parameters would be based on the steadily growing LTPP database.
2.5 Inherent model limitations
There are fundamental reasons why a high-precision model will never be obtained for pavement structural
deterioration. Some of the greatest influences on performance predictability are:
1 Subgrade: non-uniformity inherent with naturally formed strata.
2 Construction: in-service pavements will inevitably have some degree of variation in layer thickness,
compaction (laterally and vertically) and water-proofing (laterally).
3 Materials: granular pavements are composed of particulate materials, ie each layer comprises an
assemblage of discrete particles of varying sizes. Statistically, for any layer, the particle size
distribution will vary both laterally and vertically within the layer, even if 'practically uniform' mixing
2 Limitations of the SNP concept
19
has been achieved during construction. Consequently, the deformation characteristics will change
from point to point.
4 Environment: even along a short treatment length, environmental conditions will change due to
differences in drainage (both surface and subsurface) and exposure (aspect, shading etc).
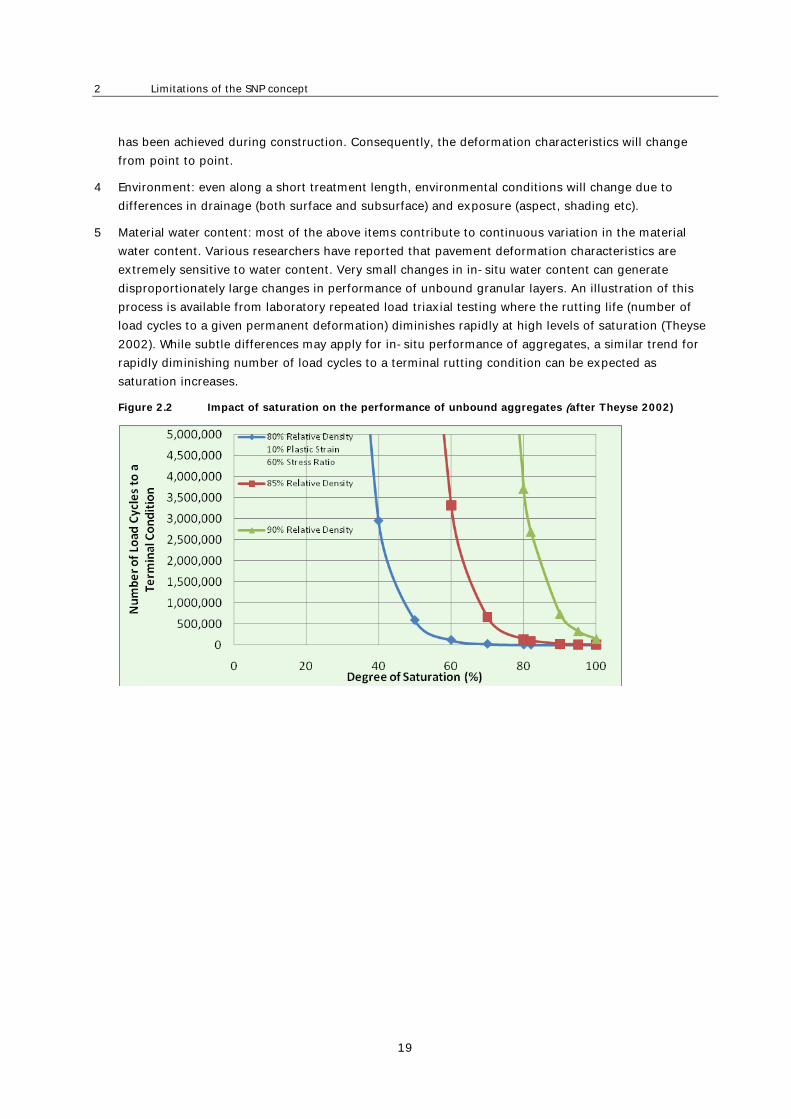
5 Material water content: most of the above items contribute to continuous variation in the material
water content. Various researchers have reported that pavement deformation characteristics are
extremely sensitive to water content. Very small changes in in-situ water content can generate
disproportionately large changes in performance of unbound granular layers. An illustration of this
process is available from laboratory repeated load triaxial testing where the rutting life (number of
load cycles to a given permanent deformation) diminishes rapidly at high levels of saturation (Theyse
2002). While subtle differences may apply for in-situ performance of aggregates, a similar trend for
rapidly diminishing number of load cycles to a terminal rutting condition can be expected as
saturation increases.
Figure 2.2 Impact of saturation on the performance of unbound aggregates (after Theyse 2002)
Rationalisation of the structural capacity definition and quantification of roads based on FWD tests
20
3 Development of improved parameters
3.1 Conceptual basis
SNP is traditionally used along with other parameters (notably past and future traffic) to predict pavement
structural capacity. The process uses observed performance and regression analyses to get the best fit of
predicted to observed performance.
In order to allow existing regression equations to be readily adapted or redefined, a set of additional
structural parameters has been established. To distinguish them from SNP, these have been termed
structural indices (SI), one for each distress mode.
Addressed in this study:
rutting: SIRutting
roughness progression: SIRoughness
Addressed in an ongoing, separate study:
flexure related distress: SIFlexure
Shear instability: SIShear
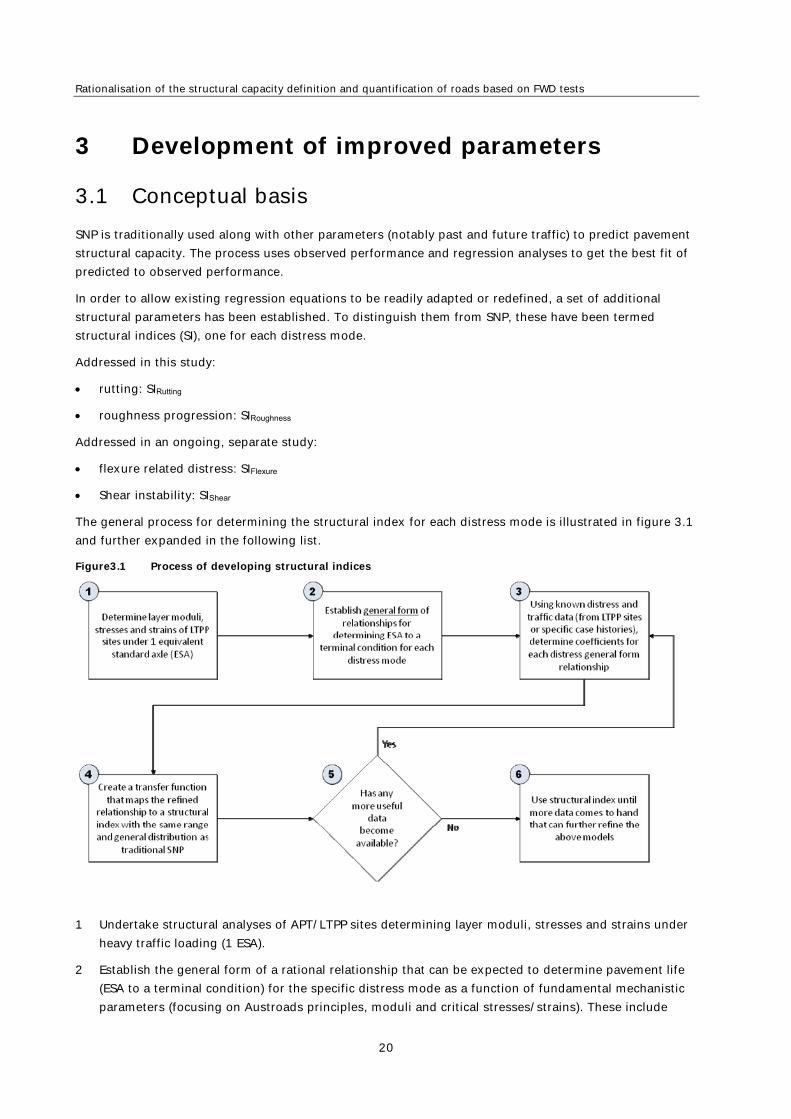
The general process for determining the structural index for each distress mode is illustrated in figure 3.1
and further expanded in the following list.
Figure3.1 Process of developing structural indices
1 Undertake structural analyses of APT/LTPP sites determining layer moduli, stresses and strains under
heavy traffic loading (1 ESA).
2 Establish the general form of a rational relationship that can be expected to determine pavement life
(ESA to a terminal condition) for the specific distress mode as a function of fundamental mechanistic
parameters (focusing on Austroads principles, moduli and critical stresses/strains). These include
3 Development of improved parameters
21
primarily parameters that are currently recorded in RAMM although any other readily available sources
should also be considered.
3 Using the observed distress at APT/LTPP sites, supplemented with other case histories of pavements
due for rehabilitation, generate a preliminary calibration for the general relationship established.
These are currently all the forms of an expected pavement life in terms of number of ESA (NMODE)
until a terminal condition is reached for the specific distress mode.
4 Determine a transfer function to convert the pavement life into a structural index (for that specific
distress mode) so that the structural index has the same range and general distribution as the
traditional SNP. By adopting the same range the adoption is simplified, promoting the acceptance and
understanding from the industry.
5 Repeat the above steps to further refine (or totally revise) the model as more data come to hand from
the LTPP sites and other sources.
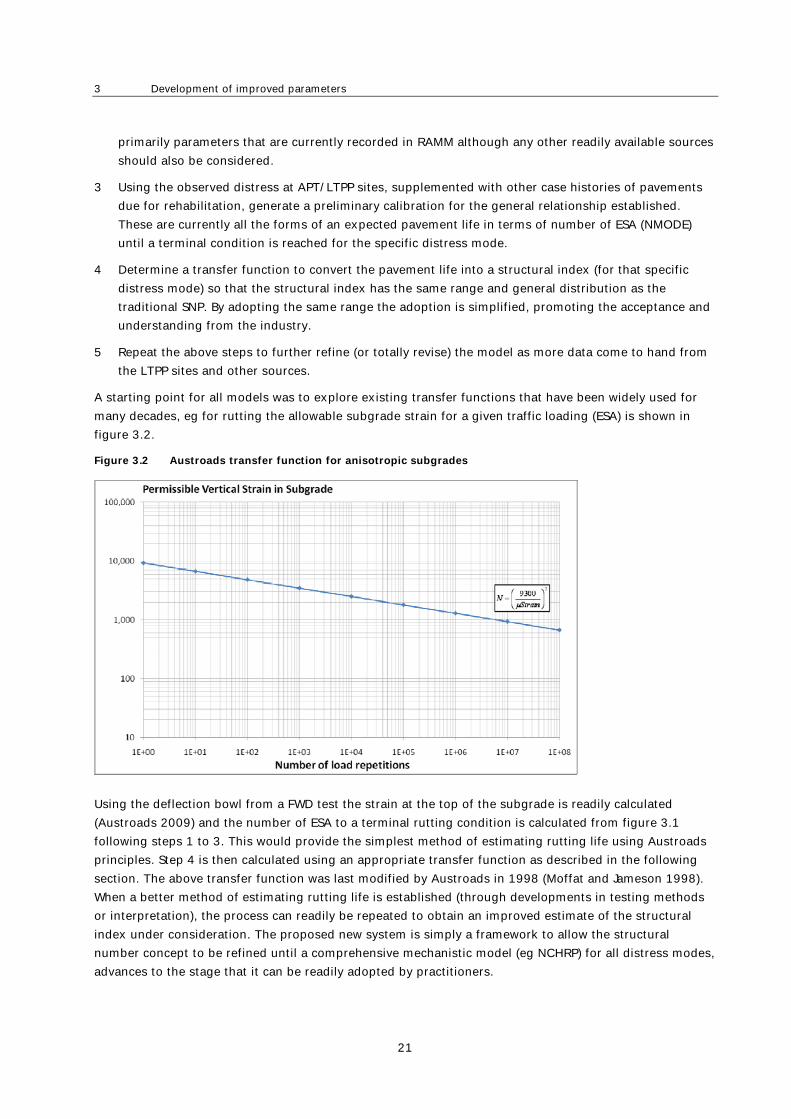
A starting point for all models was to explore existing transfer functions that have been widely used for
many decades, eg for rutting the allowable subgrade strain for a given traffic loading (ESA) is shown in
figure 3.2.
Figure 3.2 Austroads transfer function for anisotropic subgrades
Using the deflection bowl from a FWD test the strain at the top of the subgrade is readily calculated
(Austroads 2009) and the number of ESA to a terminal rutting condition is calculated from figure 3.1
following steps 1 to 3. This would provide the simplest method of estimating rutting life using Austroads
principles. Step 4 is then calculated using an appropriate transfer function as described in the following
section. The above transfer function was last modified by Austroads in 1998 (Moffat and Jameson 1998).
When a better method of estimating rutting life is established (through developments in testing methods
or interpretation), the process can readily be repeated to obtain an improved estimate of the structural
index under consideration. The proposed new system is simply a framework to allow the structural
number concept to be refined until a comprehensive mechanistic model (eg NCHRP) for all distress modes,
advances to the stage that it can be readily adopted by practitioners.
Rationalisation of the structural capacity definition and quantification of roads based on FWD tests
22
The structural indices generated are normalised to a similar range of SNP to minimise the effect on
existing regression relationships already obtained with the New Zealand LTPP programme (Henning 2008)
or HDM-4 (Hoque et al 2008).
The SNP or structural indices other than the one applicable for the specific distress mode under
consideration could prove significant in a new regression analysis which should be an indication that the
mechanistic basis of the pavement performance model needs closer examination.
3.2 Structural indices for specific distress modes
3.2.1 Rutting
The method of generating a structural index for rutting given in section 3.1 using only Austroads
principles and subgrade strain is now recognised as being an over-simplification. Strains in the overlying
layers clearly contribute to rutting also and quantification is relatively straightforward. The development of
an interim rutting model from existing APT and LTPP data is described in Tonkin & Taylor (2006a). The
model is based not only on the vertical compressive strain at the top of the subgrade (as standard for
Austroads procedures), but also the vertical compressive strains at the mid-depth of each pavement layer,
and the thicknesses of these layers.
The general form of the widely used subgrade strain criterion was adopted as the starting point for
evaluation:
Equation 3.1
where:
SG is the vertical strain at the top of the subgrade (microstrain)
NSG
is the number of load repetitions to reach a terminal condition
k and n are constants for the material
FWD testing and evaluation of national LTPP sites indicate that strains in any unbound basecourse or
subbase layer could be limited by a granular strain criterion of the same general form as that used for the
subgrade, namely:
Equation 3.2
where:
i is the vertical strain at the mid-depth of layer i (microstrain)
NGi is the number of load repetitions to cause a terminal condition in layer i
The procedure for design using strains in all layers is as follows:
1 Determine the number of load repetitions (NSG) expected to cause a terminal condition in the
subgrade
2 Determine the number of load repetitions (NGi) to cause a terminal condition in each of the granular
layers (1)
SGn
SG
SGSG
kN
G
i
n
i
GG
kN
3 Development of improved parameters
23
3 Sum the relative wear per repetition using a weighted average of the wear in the subgrade and
granular layers, and hence determine the total number ( TN ) of load repetitions to reach a terminal
condition from permanent deformation within the full depth of pavement
Using this process, the following relationship is implied:
- Equation 3.3
where:
ai and aSG are weighting functions determined from back analysis of the standard pavement
design chart for unbound granular pavements with further verification and calibration from LTPP
sites.
Equation 3.3 may be regarded as the pavement rutting life based on multi-layer strains. If the layers
overlying the subgrade have small permanent strains or if they are neglected then the first term in the
denominator vanishes and the expression reduces to the traditional subgrade strain equation. Further
details are given in Tonkin & Taylor (2007b).
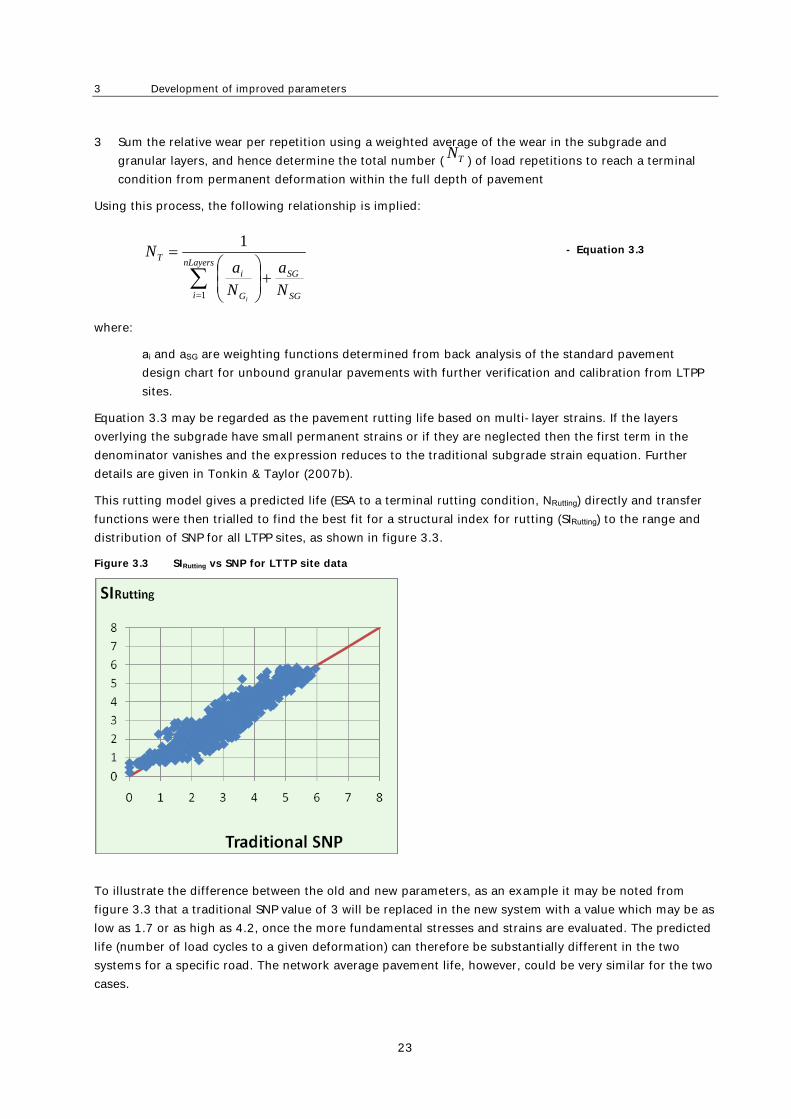
This rutting model gives a predicted life (ESA to a terminal rutting condition, NRutting) directly and transfer
functions were then trialled to find the best fit for a structural index for rutting (SIRutting) to the range and
distribution of SNP for all LTPP sites, as shown in figure 3.3.
Figure 3.3 SIRutting vs SNP for LTTP site data
To illustrate the difference between the old and new parameters, as an example it may be noted from
figure 3.3 that a traditional SNP value of 3 will be replaced in the new system with a value which may be as
low as 1.7 or as high as 4.2, once the more fundamental stresses and strains are evaluated. The predicted
life (number of load cycles to a given deformation) can therefore be substantially different in the two
systems for a specific road. The network average pavement life, however, could be very similar for the two
cases.
nLayers
i SG
SG
G
i
T
N
a
N
aN
i1
1
Rationalisation of the structural capacity definition and quantification of roads based on FWD tests
24
The current form of the transfer functions is explained in chapter 3, along with the inverse functions that
could also be used as a basis when a new regression is being explored. Note the constants given for the
functions in table 3.1 apply to state highways. If they are used for local authority networks (where the
thickness of pavements is likely to be lower), large calibration shifts may be needed. Further discussion on
local roads is given in section 3.4.
3.2.2 Roughness
All LTPP sites had been trafficked for many years prior to initiation of the LTPP study; hence the true start
of life condition for each site can only be assumed. So far, the change in roughness has been minimal at
all national LTPP sites over the period of monitoring, and measurement of roughness progression has
been necessarily limited in the relatively short lengths involved with local APT studies.
Therefore the only way to develop a model was to base it on the current roughness of the LTPP sites with
necessarily approximate assumptions on the original conditions (immediately after construction). It would
probably take several more years of observation of the LTPP sites before the roughness progression model
would have good reliability (Henning et al 2008). The interim model was based on a recently proposed
measure of pavement structural uniformity (based on variations in stiffness longitudinally in each lane),
together with the vertical compressive strains in all layers including the subgrade. Superimposed on this
was an annual roughness progression based on environmental impacts.
Roughness progression at the LTPP sites showed, as expected, a very approximate dependence on rut
depth and rut depth standard deviation. Note that the HDM-4 roughness progression model has rut depth
standard deviation as one of its variables (NDLI 1995). The roads least susceptible to roughness
progression appear to have progressed at a rate of about one NAASRA count per 1mm of rut depth, while
those most susceptible to roughness progressed at about five NAASRA counts per 1mm of rut. The reason
for different rates of roughness progression is likely to be due to differences in longitudinal non-
uniformity (variance) of each pavement structure, subgrade or construction quality of layers. Several
pavement structural parameters were investigated to determine any likely candidate as a measure of non-
uniformity. A quantitative key performance measure (KPM) for non-uniformity would also be a useful tool
in construction quality control.
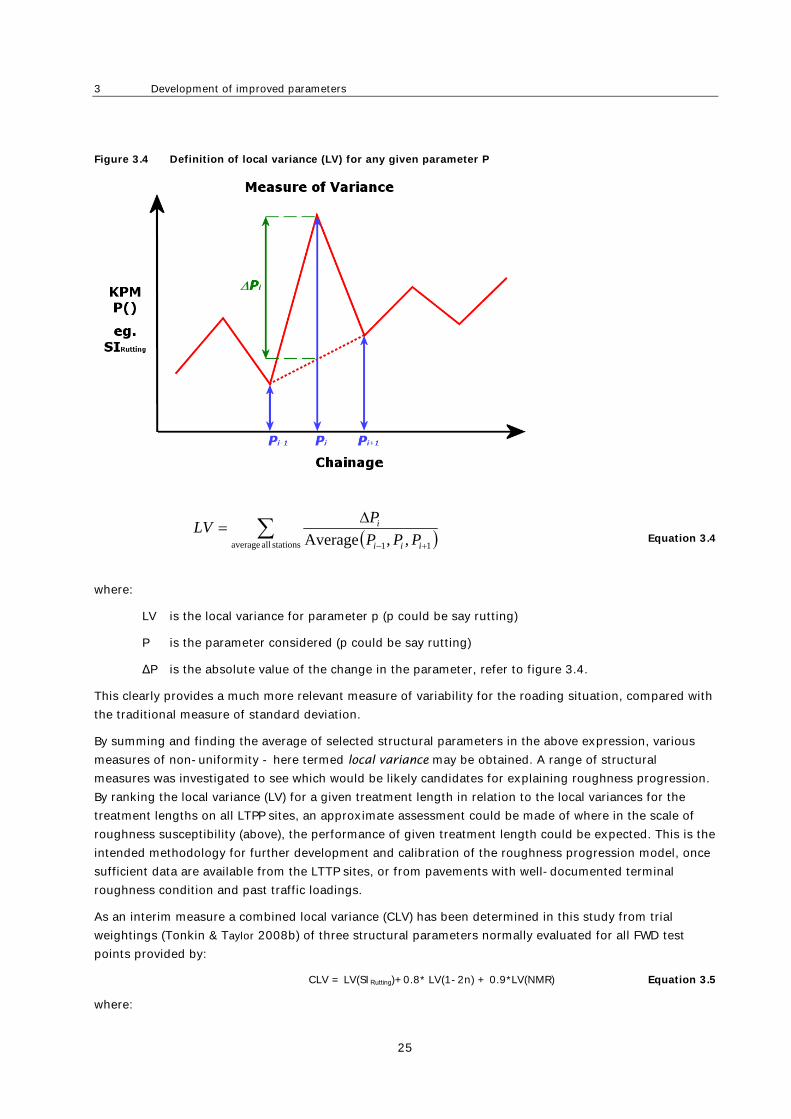
Note that it is the variation between immediately adjacent points on a road that governs roughness, ie the
common measure of standard deviation (used in the HDM-4 model) is not appropriate. The reason is that
a given treatment length may have a rut depth which increases constantly with distance (say from 0mm at
the start of the treatment length to 20mm at the end). The standard deviation of rutting would necessarily
be substantial over that treatment length but because the rut depth decreases so steadily, roughness
would be expected to be relatively low, compared with a treatment length where rut depth fluctuated
repeatedly up and down by 10mm over the full treatment length. The concept of the proposed measure is
illustrated in figure 3.4.
3 Development of improved parameters
25
Figure 3.4 Definition of local variance (LV) for any given parameter P
Equation 3.4
where:
LV is the local variance for parameter p (p could be say rutting)
P is the parameter considered (p could be say rutting)
ΔP is the absolute value of the change in the parameter, refer to figure 3.4.
This clearly provides a much more relevant measure of variability for the roading situation, compared with
the traditional measure of standard deviation.
By summing and finding the average of selected structural parameters in the above expression, various
measures of non-uniformity - here termed local variance may be obtained. A range of structural
measures was investigated to see which would be likely candidates for explaining roughness progression.
By ranking the local variance (LV) for a given treatment length in relation to the local variances for the
treatment lengths on all LTPP sites, an approximate assessment could be made of where in the scale of
roughness susceptibility (above), the performance of given treatment length could be expected. This is the
intended methodology for further development and calibration of the roughness progression model, once
sufficient data are available from the LTTP sites, or from pavements with well-documented terminal
roughness condition and past traffic loadings.
As an interim measure a combined local variance (CLV) has been determined in this study from trial
weightings (Tonkin & Taylor 2008b) of three structural parameters normally evaluated for all FWD test
points provided by:
CLV = LV(SI Rutting)+0.8* LV(1-2n) + 0.9*LV(NMR) Equation 3.5
where:
stations all average 11 ,, Average iii
i
PPP
PLV
Rationalisation of the structural capacity definition and quantification of roads based on FWD tests
26
SIRutting is the structural index for rutting
n is the subgrade modulus exponent for stress non-linearity (Ullidtz 1987)
NMR is the normalised modular ratio, ie. the ratio of moduli between successive granular layers
(Salt and Stevens 2007) compared with that expected by the Austroads guide (Austroads
2009)
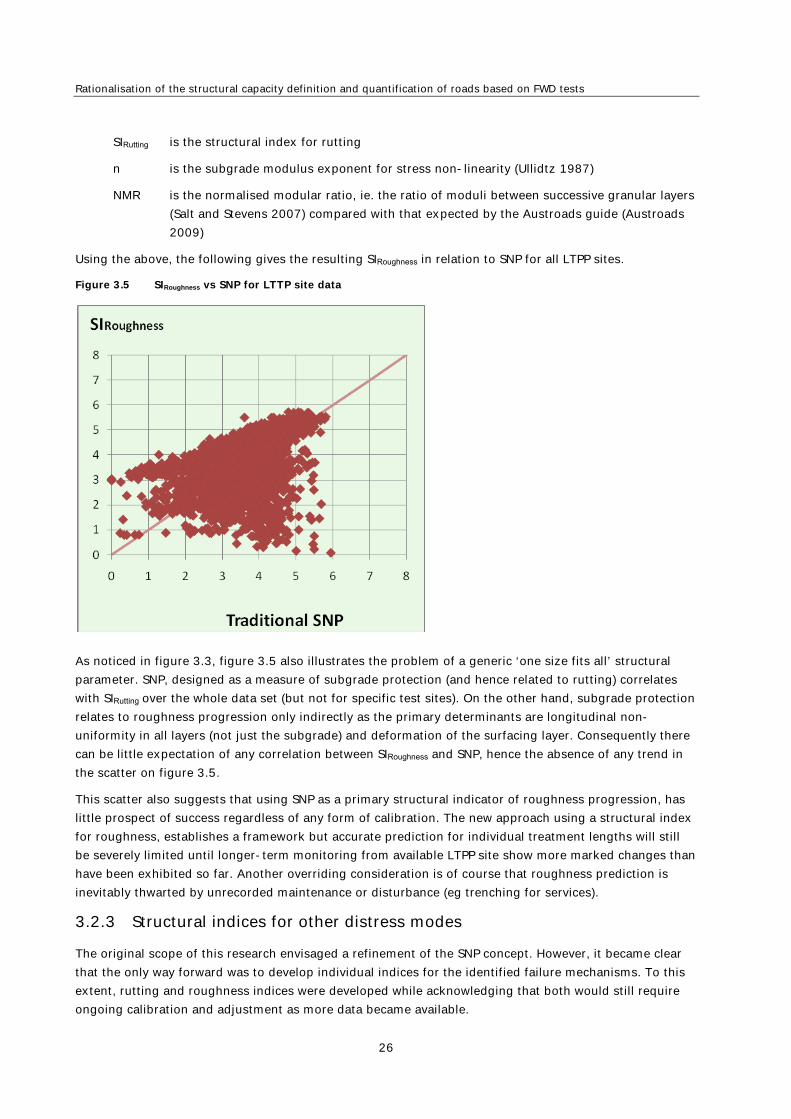
Using the above, the following gives the resulting SIRoughness in relation to SNP for all LTPP sites.
Figure 3.5 SIRoughness vs SNP for LTTP site data
As noticed in figure 3.3, figure 3.5 also illustrates the problem of a generic ‘one size fits all’ structural
parameter. SNP, designed as a measure of subgrade protection (and hence related to rutting) correlates
with SIRutting over the whole data set (but not for specific test sites). On the other hand, subgrade protection
relates to roughness progression only indirectly as the primary determinants are longitudinal non-
uniformity in all layers (not just the subgrade) and deformation of the surfacing layer. Consequently there
can be little expectation of any correlation between SIRoughness and SNP, hence the absence of any trend in
the scatter on figure 3.5.
This scatter also suggests that using SNP as a primary structural indicator of roughness progression, has
little prospect of success regardless of any form of calibration. The new approach using a structural index
for roughness, establishes a framework but accurate prediction for individual treatment lengths will still
be severely limited until longer-term monitoring from available LTPP site show more marked changes than
have been exhibited so far. Another overriding consideration is of course that roughness prediction is
inevitably thwarted by unrecorded maintenance or disturbance (eg trenching for services).
3.2.3 Structural indices for other distress modes
The original scope of this research envisaged a refinement of the SNP concept. However, it became clear
that the only way forward was to develop individual indices for the identified failure mechanisms. To this
extent, rutting and roughness indices were developed while acknowledging that both would still require
ongoing calibration and adjustment as more data became available.
3 Development of improved parameters
27
In addition, two additional indices for cracking (flexure) and shoving (shear) have been developed in
concept only. These indices were tested on network data and are documented in chapter 4. A brief
description of the potential make-up of these indices is provided in the subsequent sections. Significant
refinement on these indices will be required before they can be published.
3.2.4 Flexure index
A structural index for cracking is readily generated from the widely recognised fatigue criteria based on
tensile strain within any bound layers. Austroads (2009) defines these for both cement-bound materials
and asphaltic concrete, allowing the number of ESA to a terminal condition to be calculated directly after
back-analysis of FWD deflection bowls. Cracking is often followed quickly by entry of water to the granular
layers then potholing and is often reflected by increased maintenance costs. The overall process can,
however, be regarded as being initiated by flexure (tensile stresses in either the top or bottom of a bound
layer). The ESA deduced from the tensile fatigue criterion can then be ranked to a structural index for
flexure as discussed in section 3.1. Further information will shortly be available as a further stage of this
project.
3.2.5 Shear index
A structural index for shear instability (or shoving) in the uppermost unbound granular layer is under
investigation using a combination of in-situ measures obtained from FWD testing:
vertical compressive strain in the centre of the uppermost layer (from back calculated modulus)
dissipated energy in the layer (using energy lost during the FWD test)
residual deflection (permanent deformation) after the FWD impact
A testing programme is underway to investigate occurrences of shear, to refine these and other indicators
to give reliable methods for assessing shear potential. One aspect that is becoming clear is that shear
instability of pavements surfaced with thin asphaltic concrete is not as easily identified as shoving in a
chipseal pavement. The former is often manifested as localised alligator cracking in the wheeltrack (and
hence can potentially be confused with flexure) while the latter tends to form as accelerated rutting in the
wheelpath and adjacent heave in the shoulder.
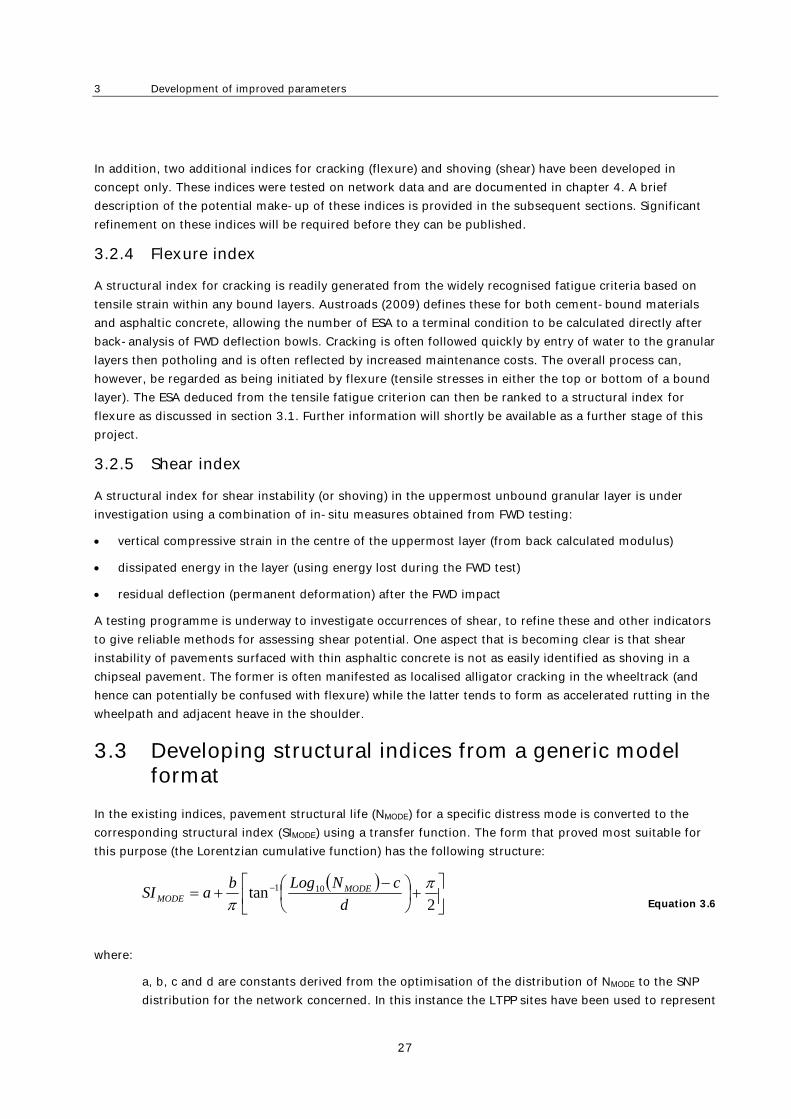
3.3 Developing structural indices from a generic model format
In the existing indices, pavement structural life (NMODE) for a specific distress mode is converted to the
corresponding structural index (SIMODE) using a transfer function. The form that proved most suitable for
this purpose (the Lorentzian cumulative function) has the following structure:
Equation 3.6
where:
a, b, c and d are constants derived from the optimisation of the distribution of NMODE to the SNP
distribution for the network concerned. In this instance the LTPP sites have been used to represent
2tan 101
d
cNLogbaSI MODE
MODE
Rationalisation of the structural capacity definition and quantification of roads based on FWD tests
28
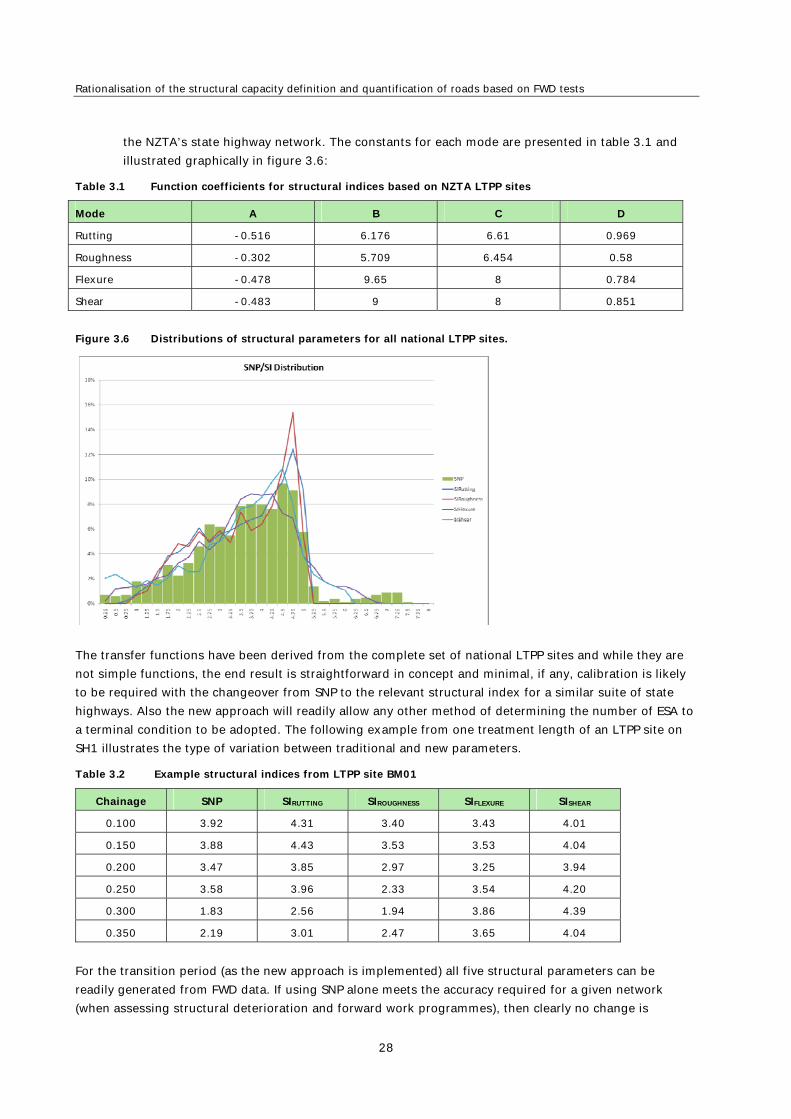
the NZTA’s state highway network. The constants for each mode are presented in table 3.1 and
illustrated graphically in figure 3.6:
Table 3.1 Function coefficients for structural indices based on NZTA LTPP sites
Mode A B C D
Rutting -0.516 6.176 6.61 0.969
Roughness -0.302 5.709 6.454 0.58
Flexure -0.478 9.65 8 0.784
Shear -0.483 9 8 0.851
Figure 3.6 Distributions of structural parameters for all national LTPP sites.
The transfer functions have been derived from the complete set of national LTPP sites and while they are
not simple functions, the end result is straightforward in concept and minimal, if any, calibration is likely
to be required with the changeover from SNP to the relevant structural index for a similar suite of state
highways. Also the new approach will readily allow any other method of determining the number of ESA to
a terminal condition to be adopted. The following example from one treatment length of an LTPP site on
SH1 illustrates the type of variation between traditional and new parameters.
Table 3.2 Example structural indices from LTPP site BM01
Chainage SNP SIRUTTING SIROUGHNESS SIFLEXURE SISHEAR
0.100 3.92 4.31 3.40 3.43 4.01
0.150 3.88 4.43 3.53 3.53 4.04
0.200 3.47 3.85 2.97 3.25 3.94
0.250 3.58 3.96 2.33 3.54 4.20
0.300 1.83 2.56 1.94 3.86 4.39
0.350 2.19 3.01 2.47 3.65 4.04
For the transition period (as the new approach is implemented) all five structural parameters can be
readily generated from FWD data. If using SNP alone meets the accuracy required for a given network
(when assessing structural deterioration and forward work programmes), then clearly no change is

3 Development of improved parameters
29
necessary. However, where the traditional approach is found to be limited, then the upgrade can be made
simply by substituting the relevant structural index in place of the SNP (provided appropriate coefficients
are use, as discussed in the following section)..
Equation 3.7 gives the inverse function for equation 3.6.:
Equation 3.7
This function could therefore be used to determine the remaining useful life for a pavement.
3.4 Application to local roads
It is important to note that the coefficients in table 3.1 apply for NZTA’s LTPP sites on state highways. As
local roads are likely to be structurally thinner on average, using table 3.1 would tend to over-estimate
the structural capacity, but the relative ranking will still apply, resulting in the need for substantial
calibration. However, it is a straightforward procedure to develop the coefficients for any network by
following the steps given in figure 3.1. At step 4 in that figure it is important that mapping is to an
appropriate SNP distribution for the network under consideration.
For standardisation there are four immediate options being examined through ongoing research:
1 mapping to the SNP distribution for all state highway LTPP sites
2 mapping to the SNP distribution for all local authority sites
3 mapping to the SNP combined distribution of all both highway and local LTPP sites
4 mapping to the SNP distribution of the network concerned.
The first three options will give standardisation between networks, but require recalibration, while the
fourth option would be expected to result in minimal or no recalibration
c
b
aSIdNLog MODE
MODE
2tan10

Rationalisation of the structural capacity definition and quantification of roads based on FWD tests
30
4 Testing the indices at network level
4.1 Indices in the pavement deterioration models
Henning et al (2008) demonstrated that the New Zealand pavement deterioration models correlated better
on sections where the primary failure mechanism and the respective model matched. For example, the
rutting model would be more accurate on sections where the predominant failure mode was rutting. This
was expected as the fundamental format of the models was developed on sections that failed according to
that particular defect mode.
It was therefore expected that the new structural indices would be more appropriate variables in the
pavement deterioration models, compared with the SNP. The following sections present the testing of the
structural index concepts for application on the pavement deterioration models. Two methods were used
for these tests: in the first test the SNP was directly replaced by the structural indices and in the second
the model was redeveloped using the structural indices as independent variables.
Two networks were used in the testing of the models, namely state highways on the West Waikato network
and local roads on the Southland District Council network.
4.1.1 Direct replacement of SNP with structural indices
The first test simply replaced the SNP in the pavement deterioration models with the new structural
indices. Two models were used namely the crack initiation and rutting models with the SIflexure and SIrutting
indices respectively. In both cases the variable and model format were retained but a regression analysis
was completed in order to get the variable coefficients and significance of the estimates.
4.1.1.1 Crack initiation
The crack initiation probability model (Henning et al 2006) had a similar outcome regardless of the
strength parameter used. The regression process indicated that SIflexure was not a significant factor in the
forecasting of crack initiation whereas the SNP was. The overall correlation of the model (containing
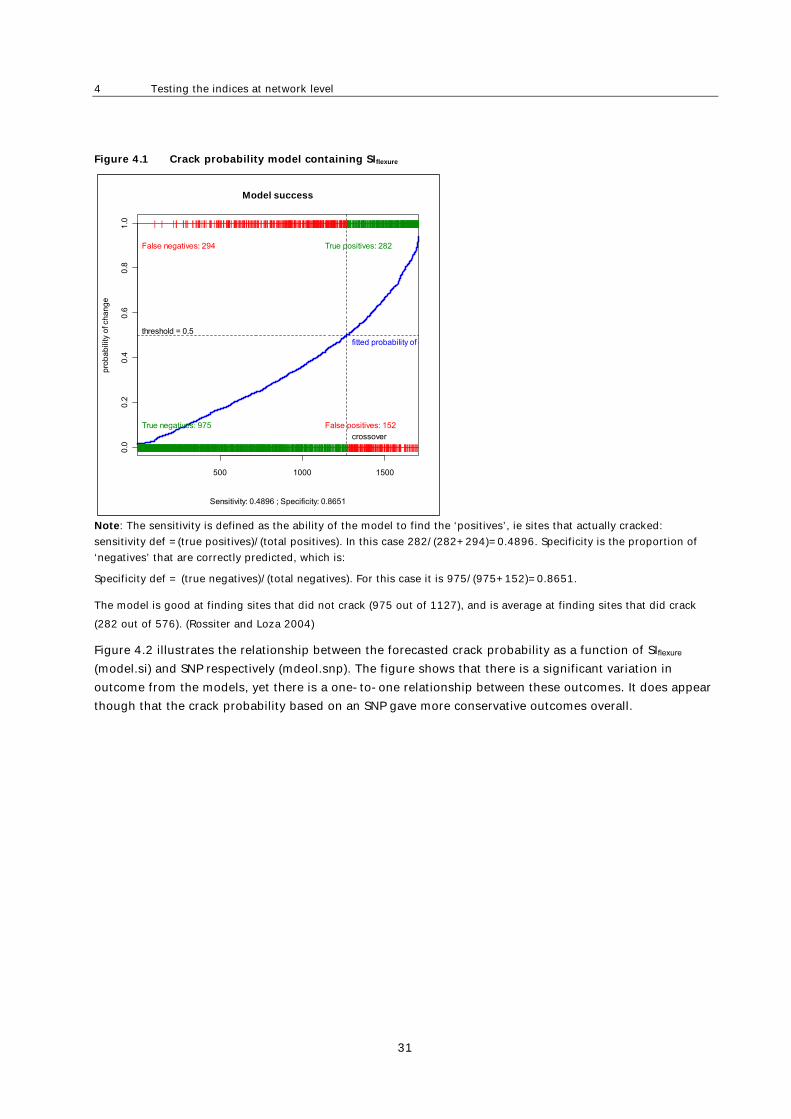
SIflexure) was 75% compared with the actual crack initiation. Figure 4.1 illustrates the model correlation on a
network level. Although the overall success of the model predictions seems high it was disappointing to
note that of all the cracked sections, only half of these were predicted to have cracked (true positives vs
false positives).
The green ticks represent outcomes where the predicted outcomes corresponded with the actual values
(true positives and true negatives).The red ticks represent errors: either false positives or false negatives.
The threshold value has been assumed as 0.5 (50%) and the ‘positives' are where the probability is above
the threshold (50%) and likewise the ‘negatives’ are where the probability is below the threshold (50%).
The fitted values have been sorted in ascending order and are indicated by the blue line on the graph. The
sample size is the sum of the positives (true and false) and the negatives (true and false). False positives
are negative cases that the model missed.
4 Testing the indices at network level
31
Figure 4.1 Crack probability model containing SIflexure
Note: The sensitivity is defined as the ability of the model to find the ‘positives’, ie sites that actually cracked:
sensitivity def =(true positives)/(total positives). In this case 282/(282+294)=0.4896. Specificity is the proportion of
‘negatives’ that are correctly predicted, which is:
Specificity def = (true negatives)/(total negatives). For this case it is 975/(975+152)=0.8651.
The model is good at finding sites that did not crack (975 out of 1127), and is average at finding sites that did crack
(282 out of 576). (Rossiter and Loza 2004)
Figure 4.2 illustrates the relationship between the forecasted crack probability as a function of SIflexure
(model.si) and SNP respectively (mdeol.snp). The figure shows that there is a significant variation in
outcome from the models, yet there is a one-to-one relationship between these outcomes. It does appear
though that the crack probability based on an SNP gave more conservative outcomes overall.
500 1000 1500
0.0
0.2
0.4
0.6
0.8
1.0
pro
ba
bili
ty o
f ch
an
ge
threshold = 0.5
crossover
fitted probability of c
||||||||||||||||||||||||||||||||||||||||||||||||||||||||||||||||||||||||||||||||||||||||||||||||||||||||
|
|||||||||||||||||||||||||||||||||||||||||||
|
||||||||||||||||||||||||||||||||||||||||||||||||||||||||||||||||||||
|
||||||||||||||||
|
|
|
||||||||||||||||||||||||||||||||||||||
|
|
|
||||||||||||||
|
||||
|
|||||
|
||||||||||||||||||||||||||||||
||
||||||||||||||||
|
||
|
|||||||||
|
|
|
|||
|
|
||
|||||||||
|
|||||||||||
|
||||||||
||
||||||
|
|||||||||||||||||||||||
|
|||
||
||||
|
||||||||||||||
|
||||||||||||||||
||
|
|
|||||
||
|
|
||
|
||||
|
|||
|
|
|
||||||||||||
|
|
|
||
|
|||||||||||||
|
|
||
||||
||
||
|||
||
|
|
|
||
|
|||||||
|
|||||||||||||||
|
|
||
||||
||
|
|
||||
|
||
|
|||||||
|
||||||
||
|||||
|
||
|
|||||||
|
|
||
||||
|
|
||
|
|
|||||||
|
|||
||
|||||||
|
||
|||
|||||||||||
|
|||
||
|||||
|
||
|
||||
|
||||
|||
||||||||
|
|
|
||
|
||||
||
|||||||||||||
|
|||
|
||||||||||||
|
||
|
|||||||
|
|
|||
|||||||
||
||||||||||||||
|
||
|||
|
|
|
|
|||
|
||||
|
||
|
|
|
||||
|
|||||||||||
||
||||
|
|||
|
|
||
||
|
|||||||
|
|||
|
|||
|
|
|
|||||
||
||||
|
|
|
||
||
|||
|
||
||
|
|
|
|
|||
||
|||
|||||
|||
|
|
|||
||
|
||
|||
||||||||||
|
|
|
|
|
|
||
||
|
|
|
||||||
|
||||
|
||
|
|||||
||
||||
|
|
|
|||||||||
|
||||
|||||
|||||||
|
|||
||
||||
||
||
||
|||
|
|
|||||
||||
|
|||
|
|||||
||
|
|
|||
|
|
||||
|
|
|
||
|
|
|
|||
|||
||||
||
|
||
||||||
||||
|
|
|
|||
|||||
|||
|
|
|
|||
|
|
||
|
||||
||||||
|
||||
|
|
||||
||
|
|
||
|||
||
|
|
|||
|
|
|
|
||
|
|
||
|||
||
||||
|||
|||
||
||||||
|
|
||
|
|
|
|||||
||
|
|
|||
|
|||||||
|
|
||||
|||
||||||
|||||||
||
||
||
|||
||||
|||
|
||
|
|
|||
|
|
|
|
|
|||||
||
|
|
|
|
|
|
|
|
|||
|
|
||||||
|
||
|
|
||||
|||
||
||||
||
|
|
||
|
||
||
|||
|
||
|||
|
|||||
|
|||
|||||
||
|
|
|
|||
|
||
|
||||||
|
||
||
|
|
||||
|||||
|
||
|||
|
|
||||
||
|||
|
|
||
||||
||||
||
|
|
|
|
|
|
|||||
||
|
|
|||||
|
|
|||
|||
|
||||
|
|||
|
|||||
|
|
|
|
|
||
|
|||
|||
|
||
||
|
||
|
||||||||
|||
||
||
|
|
||||||||
||
|
||
||
|
|
||
||
|
|
|
||||||||
|
|
|
||||
|
|||||
||||
|
|
||
|
||
|
|
|
|||
||
|
|
||||||||||
|
||||||
||||
|||
|
|
||
|||||||||||||||||||||
|
|||
||
||
||
||||||
|
|||
|
|||||||
|
|
|
|||
|
|||||
|
||||||
|
||
|
|||||
|
||
|
||||||
|
|||
|
|
|
||||||||
|
||||||
True negatives: 975 False positives: 152
True positives: 282False negatives: 294
Model success
Sensitivity: 0.4896 ; Specificity: 0.8651
Rationalisation of the structural capacity definition and quantification of roads based on FWD tests
32
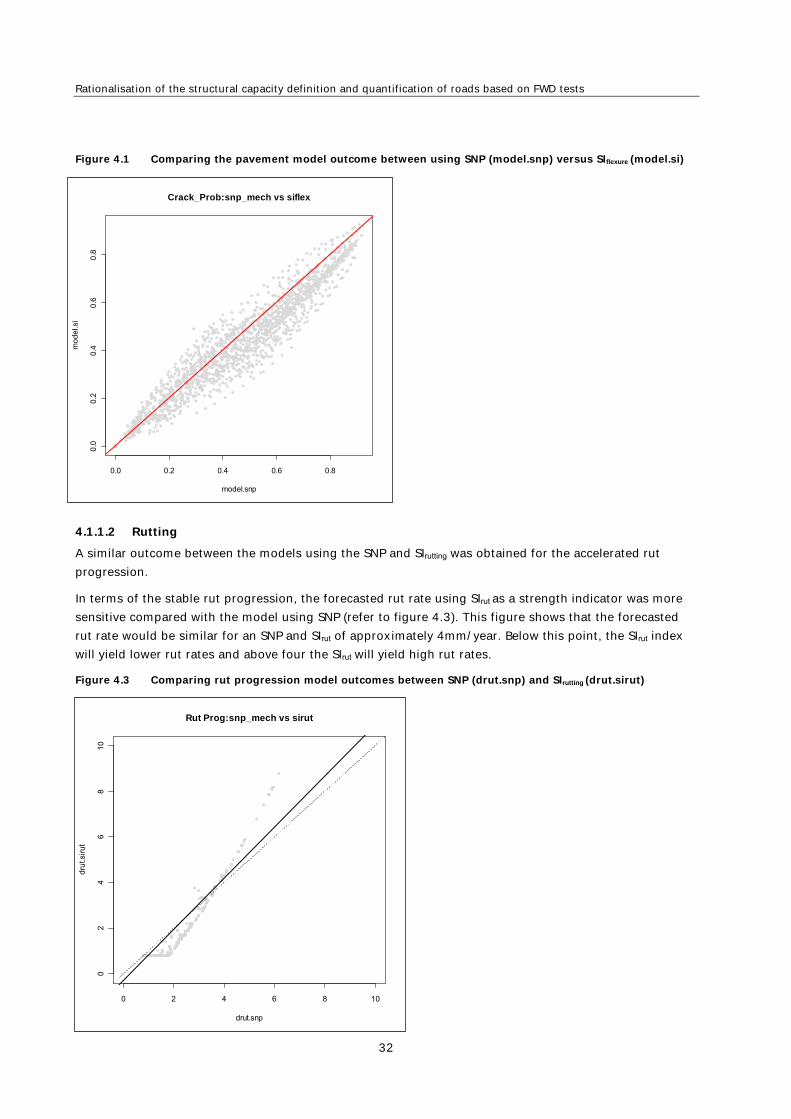
Figure 4.1 Comparing the pavement model outcome between using SNP (model.snp) versus SIflexure (model.si)
4.1.1.2 Rutting
A similar outcome between the models using the SNP and SIrutting was obtained for the accelerated rut
progression.
In terms of the stable rut progression, the forecasted rut rate using SIrut as a strength indicator was more
sensitive compared with the model using SNP (refer to figure 4.3). This figure shows that the forecasted
rut rate would be similar for an SNP and SIrut of approximately 4mm/year. Below this point, the SIrut index
will yield lower rut rates and above four the SIrut will yield high rut rates.
Figure 4.3 Comparing rut progression model outcomes between SNP (drut.snp) and SIrutting (drut.sirut)
0.0 0.2 0.4 0.6 0.8
0.0
0.2
0.4
0.6
0.8
Crack_Prob:snp_mech vs siflex
model.snp
mod
el.s
i
0 2 4 6 8 10
02
46
81
0
Rut Prog:snp_mech vs sirut
drut.snp
dru
t.sir
ut

4 Testing the indices at network level
33
Although some outcome was achieved from the tests on these two models, it is fair to say that the results
were inconclusive. For this reason it was decided to test the indices on models that were developed based
on first principles. The following section discusses these results.
Finding:
It has been demonstrated that the structural index values are significantly
different from the SNP. While the correlation between average structural indices
and SNP may be strong, the significant variance along the road makes this
correlation weak, hence the need for individual structural indices.
Based on this section, it is recommended that the SNP in performance models cannot simply be replaced
by the structural index. This replacement needs to include a full regression process which includes all
potential variables into a new expression.
4.1.2 Redefining pavement deterioration models using the structural indices
Based on the inconclusive nature of the first test, it was decided to use the new indices on a fundamental
model development process. This differed from the previous test in that the structural index was used on
an equal basis with all other independent variables, including SNP. Once the significant variables were
determined from a number of statistical processes the selected variables were used in a regression
analysis in order to determine the final make-up of the model.
This test was undertaken in addition to research work that developed pavement deterioration models for
asphalt pavements (Henning and Roux 2008). The aim of this research was to develop cracking, ravelling
and rutting models for asphalt-surfaced pavements in New Zealand. There were some constraints that
were relevant to the outcome including:
Due to the shortage of LTPP data for asphalt-surfaced pavements, network data had to be used.
Therefore the outcome is still subject to review. In addition, the model development for the rut
progression and accelerated rutting was not successful.
Given the status of the structural index development only the SIrutting was advanced enough to use for
the research, regardless of the model that was developed.
Despite the limitations mentioned the test had promising results. The research was successful in
delivering a robust model to forecast crack initiation for dense-graded asphalt concrete (AC) surfaces and
ravelling for open-graded porous asphalt surfaces (OGPA). In both cases the SIrutting was a significant factor
of the models. In the case of the AC crack initiation model, the SIrutting in combination with traffic loading
was significant to a 99% confidence level (refer to table 4.1). A similar result was obtained for the OGPA
crack initiation model whereas a lesser significance was found for SIrutting used in the OGPA ravelling model.
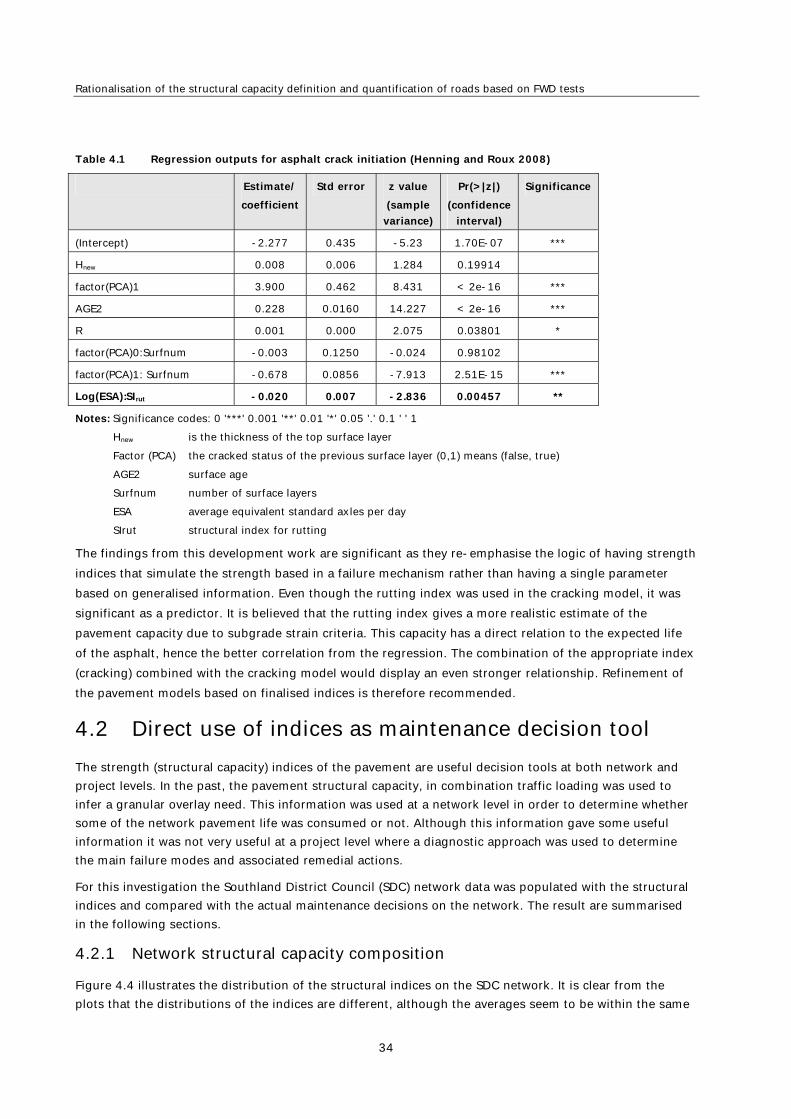
Rationalisation of the structural capacity definition and quantification of roads based on FWD tests
34
Table 4.1 Regression outputs for asphalt crack initiation (Henning and Roux 2008)
Estimate/
coefficient
Std error z value
(sample
variance)
Pr(>|z|)
(confidence
interval)
Significance
(Intercept) -2.277 0.435 -5.23 1.70E-07 ***
Hnew 0.008 0.006 1.284 0.19914
factor(PCA)1 3.900 0.462 8.431 < 2e-16 ***
AGE2 0.228 0.0160 14.227 < 2e-16 ***
R 0.001 0.000 2.075 0.03801 *
factor(PCA)0:Surfnum -0.003 0.1250 -0.024 0.98102
factor(PCA)1: Surfnum -0.678 0.0856 -7.913 2.51E-15 ***
Log(ESA):SIrut -0.020 0.007 -2.836 0.00457 **
Notes: Significance codes: 0 '***' 0.001 '**' 0.01 '*' 0.05 '.' 0.1 ' ' 1
Hnew is the thickness of the top surface layer
Factor (PCA) the cracked status of the previous surface layer (0,1) means (false, true)
AGE2 surface age
Surfnum number of surface layers
ESA average equivalent standard axles per day
SIrut structural index for rutting
The findings from this development work are significant as they re-emphasise the logic of having strength
indices that simulate the strength based in a failure mechanism rather than having a single parameter
based on generalised information. Even though the rutting index was used in the cracking model, it was
significant as a predictor. It is believed that the rutting index gives a more realistic estimate of the
pavement capacity due to subgrade strain criteria. This capacity has a direct relation to the expected life
of the asphalt, hence the better correlation from the regression. The combination of the appropriate index
(cracking) combined with the cracking model would display an even stronger relationship. Refinement of
the pavement models based on finalised indices is therefore recommended.
4.2 Direct use of indices as maintenance decision tool
The strength (structural capacity) indices of the pavement are useful decision tools at both network and
project levels. In the past, the pavement structural capacity, in combination traffic loading was used to
infer a granular overlay need. This information was used at a network level in order to determine whether
some of the network pavement life was consumed or not. Although this information gave some useful
information it was not very useful at a project level where a diagnostic approach was used to determine
the main failure modes and associated remedial actions.
For this investigation the Southland District Council (SDC) network data was populated with the structural
indices and compared with the actual maintenance decisions on the network. The result are summarised
in the following sections.
4.2.1 Network structural capacity composition
Figure 4.4 illustrates the distribution of the structural indices on the SDC network. It is clear from the
plots that the distributions of the indices are different, although the averages seem to be within the same
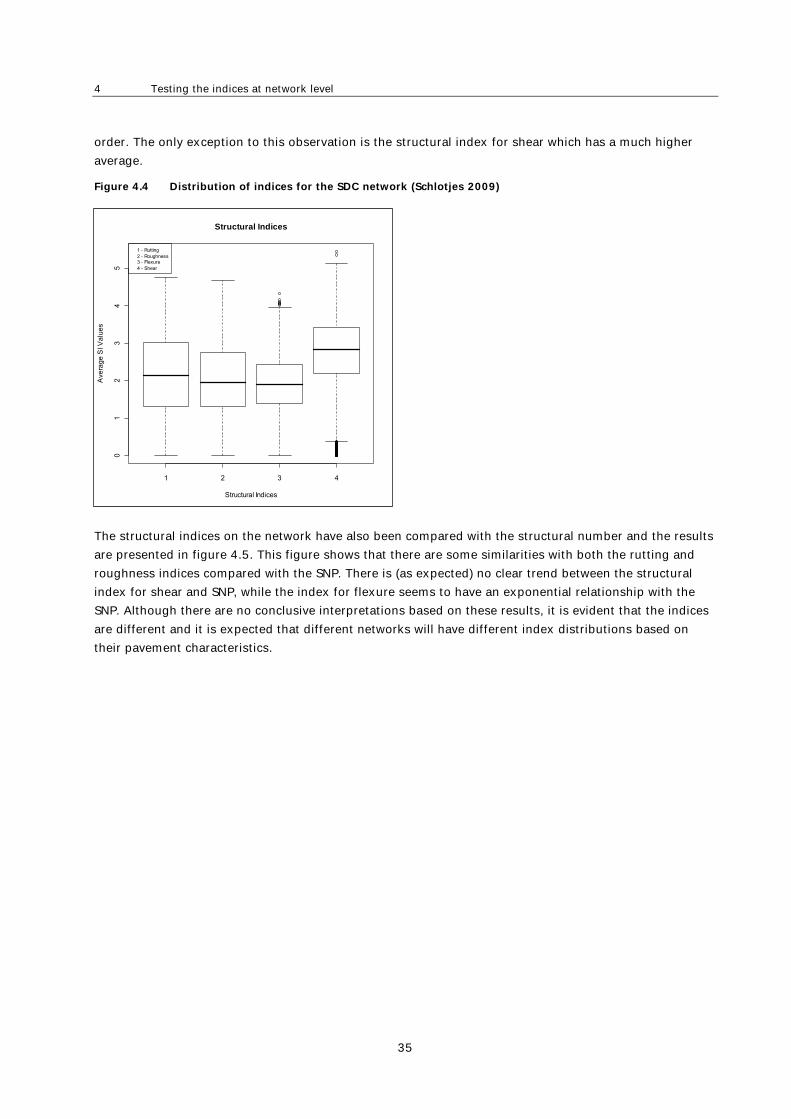
4 Testing the indices at network level
35
order. The only exception to this observation is the structural index for shear which has a much higher
average.
Figure 4.4 Distribution of indices for the SDC network (Schlotjes 2009)
The structural indices on the network have also been compared with the structural number and the results
are presented in figure 4.5. This figure shows that there are some similarities with both the rutting and
roughness indices compared with the SNP. There is (as expected) no clear trend between the structural
index for shear and SNP, while the index for flexure seems to have an exponential relationship with the
SNP. Although there are no conclusive interpretations based on these results, it is evident that the indices
are different and it is expected that different networks will have different index distributions based on
their pavement characteristics.
1 2 3 4
01
23
45
Structural Indices
Structural Indices
Ave
rag
e S
I Va
lue
s
1 - Rutting2 - Roughness3 - Flexure4 - Shear
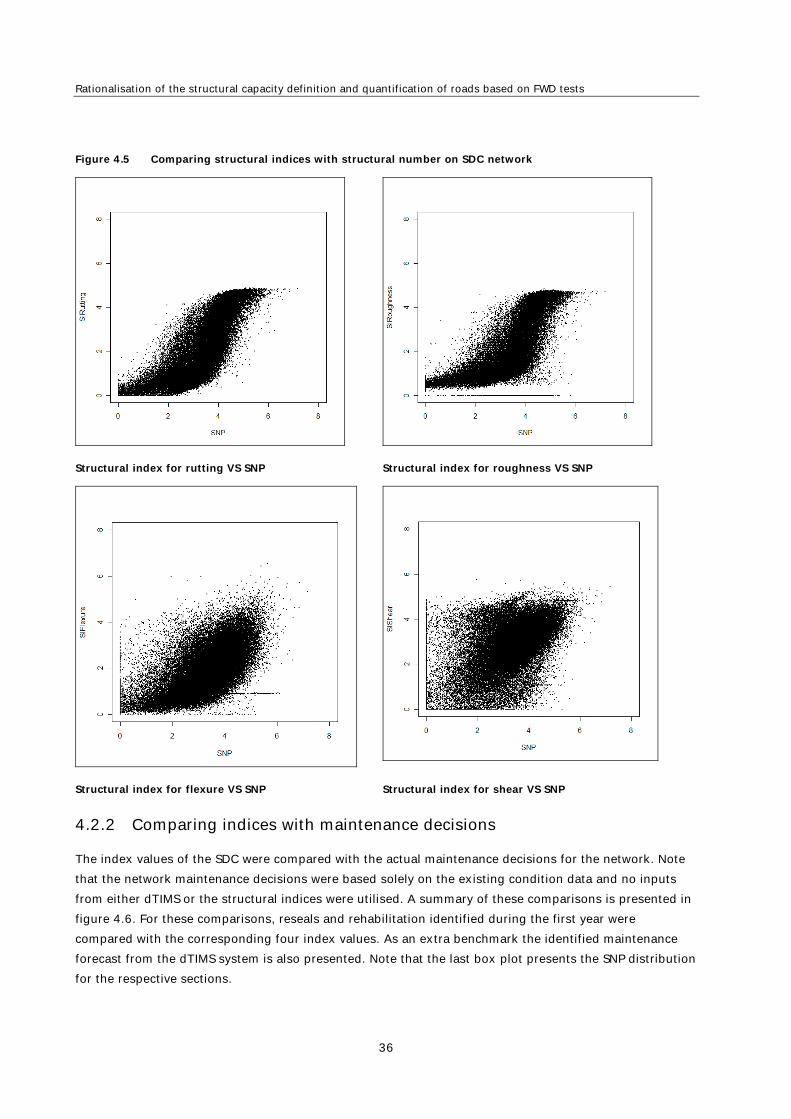
Rationalisation of the structural capacity definition and quantification of roads based on FWD tests
36
Figure 4.5 Comparing structural indices with structural number on SDC network
Structural index for rutting VS SNP Structural index for roughness VS SNP
Structural index for flexure VS SNP Structural index for shear VS SNP
4.2.2 Comparing indices with maintenance decisions
The index values of the SDC were compared with the actual maintenance decisions for the network. Note
that the network maintenance decisions were based solely on the existing condition data and no inputs
from either dTIMS or the structural indices were utilised. A summary of these comparisons is presented in
figure 4.6. For these comparisons, reseals and rehabilitation identified during the first year were
compared with the corresponding four index values. As an extra benchmark the identified maintenance
forecast from the dTIMS system is also presented. Note that the last box plot presents the SNP distribution
for the respective sections.
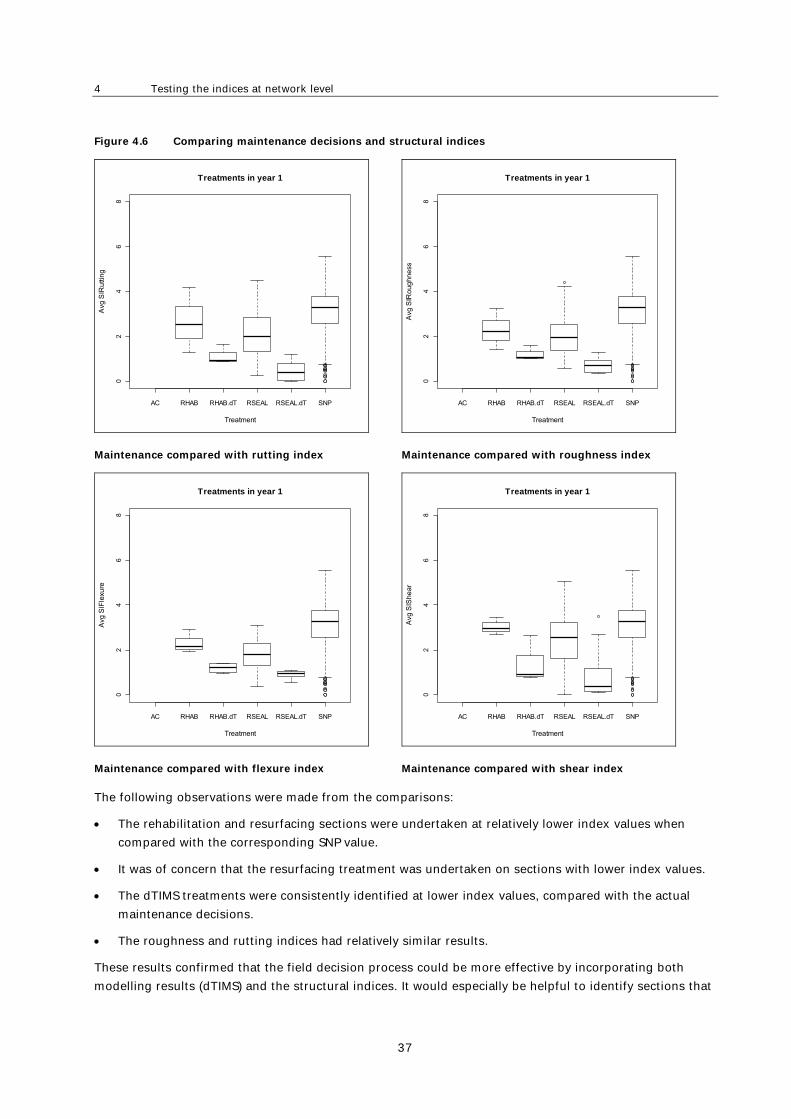
4 Testing the indices at network level
37
Figure 4.6 Comparing maintenance decisions and structural indices
AC RHAB RHAB.dT RSEAL RSEAL.dT SNP
02
46
8
Treatments in year 1
Treatment
Avg
SIR
utti
ng
AC RHAB RHAB.dT RSEAL RSEAL.dT SNP
02
46
8
Treatments in year 1
Treatment
Avg
SIR
ou
gh
ne
ss
Maintenance compared with rutting index Maintenance compared with roughness index
AC RHAB RHAB.dT RSEAL RSEAL.dT SNP
02
46
8
Treatments in year 1
Treatment
Avg
SIF
lexu
re
AC RHAB RHAB.dT RSEAL RSEAL.dT SNP
02
46
8
Treatments in year 1
Treatment
Avg
SIS
he
ar
Maintenance compared with flexure index Maintenance compared with shear index
The following observations were made from the comparisons:
The rehabilitation and resurfacing sections were undertaken at relatively lower index values when
compared with the corresponding SNP value.
It was of concern that the resurfacing treatment was undertaken on sections with lower index values.
The dTIMS treatments were consistently identified at lower index values, compared with the actual
maintenance decisions.
The roughness and rutting indices had relatively similar results.
These results confirmed that the field decision process could be more effective by incorporating both
modelling results (dTIMS) and the structural indices. It would especially be helpful to identify sections that
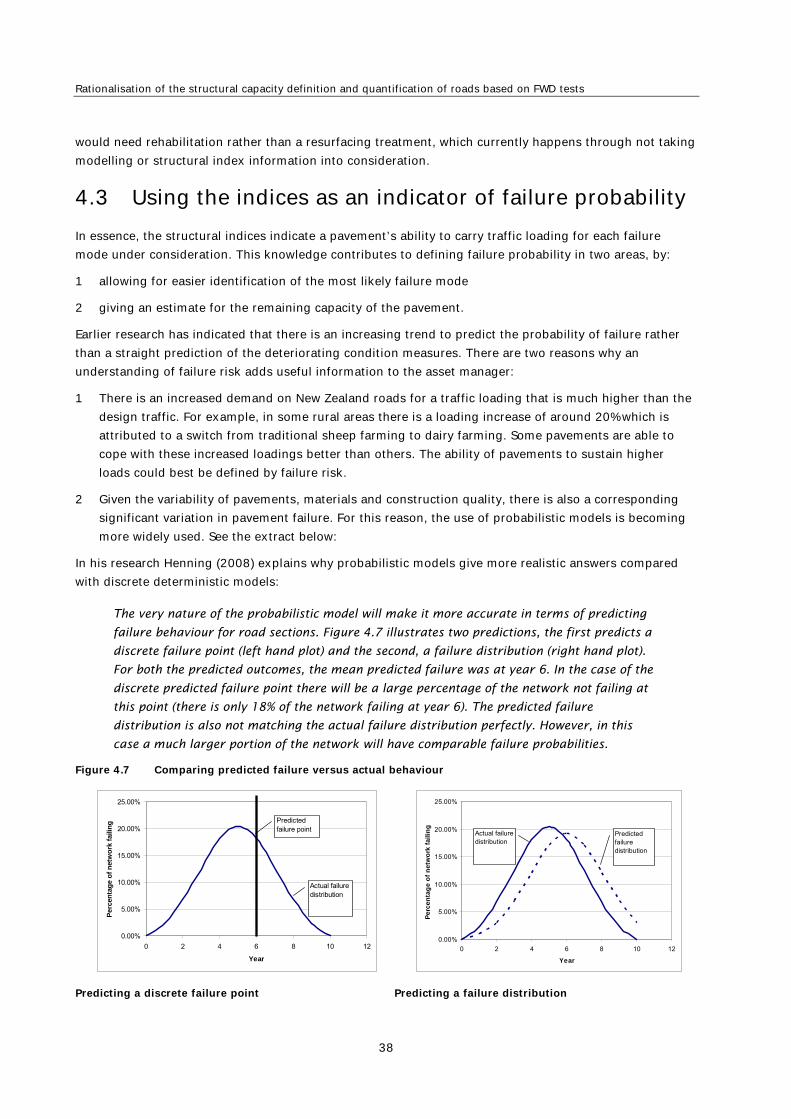
Rationalisation of the structural capacity definition and quantification of roads based on FWD tests
38
would need rehabilitation rather than a resurfacing treatment, which currently happens through not taking
modelling or structural index information into consideration.
4.3 Using the indices as an indicator of failure probability
In essence, the structural indices indicate a pavement’s ability to carry traffic loading for each failure
mode under consideration. This knowledge contributes to defining failure probability in two areas, by:
1 allowing for easier identification of the most likely failure mode
2 giving an estimate for the remaining capacity of the pavement.
Earlier research has indicated that there is an increasing trend to predict the probability of failure rather
than a straight prediction of the deteriorating condition measures. There are two reasons why an
understanding of failure risk adds useful information to the asset manager:
1 There is an increased demand on New Zealand roads for a traffic loading that is much higher than the
design traffic. For example, in some rural areas there is a loading increase of around 20% which is
attributed to a switch from traditional sheep farming to dairy farming. Some pavements are able to
cope with these increased loadings better than others. The ability of pavements to sustain higher
loads could best be defined by failure risk.
2 Given the variability of pavements, materials and construction quality, there is also a corresponding
significant variation in pavement failure. For this reason, the use of probabilistic models is becoming
more widely used. See the extract below:
In his research Henning (2008) explains why probabilistic models give more realistic answers compared
with discrete deterministic models:
The very nature of the probabilistic model will make it more accurate in terms of predicting
failure behaviour for road sections. Figure 4.7 illustrates two predictions, the first predicts a
discrete failure point (left hand plot) and the second, a failure distribution (right hand plot).
For both the predicted outcomes, the mean predicted failure was at year 6. In the case of the
discrete predicted failure point there will be a large percentage of the network not failing at
this point (there is only 18% of the network failing at year 6). The predicted failure
distribution is also not matching the actual failure distribution perfectly. However, in this
case a much larger portion of the network will have comparable failure probabilities.
Figure 4.7 Comparing predicted failure versus actual behaviour
0.00%
5.00%
10.00%
15.00%
20.00%
25.00%
0 2 4 6 8 10 12
Year
Per
cen
tag
e o
f n
etw
ork
fai
ling Predicted
failure point
Actual failure distribution
0.00%
5.00%
10.00%
15.00%
20.00%
25.00%
0 2 4 6 8 10 12
Year
Pe
rce
nta
ge
of
ne
two
rk f
ail
ing
Actual failure distribution
Predicted failure distribution
Predicting a discrete failure point Predicting a failure distribution
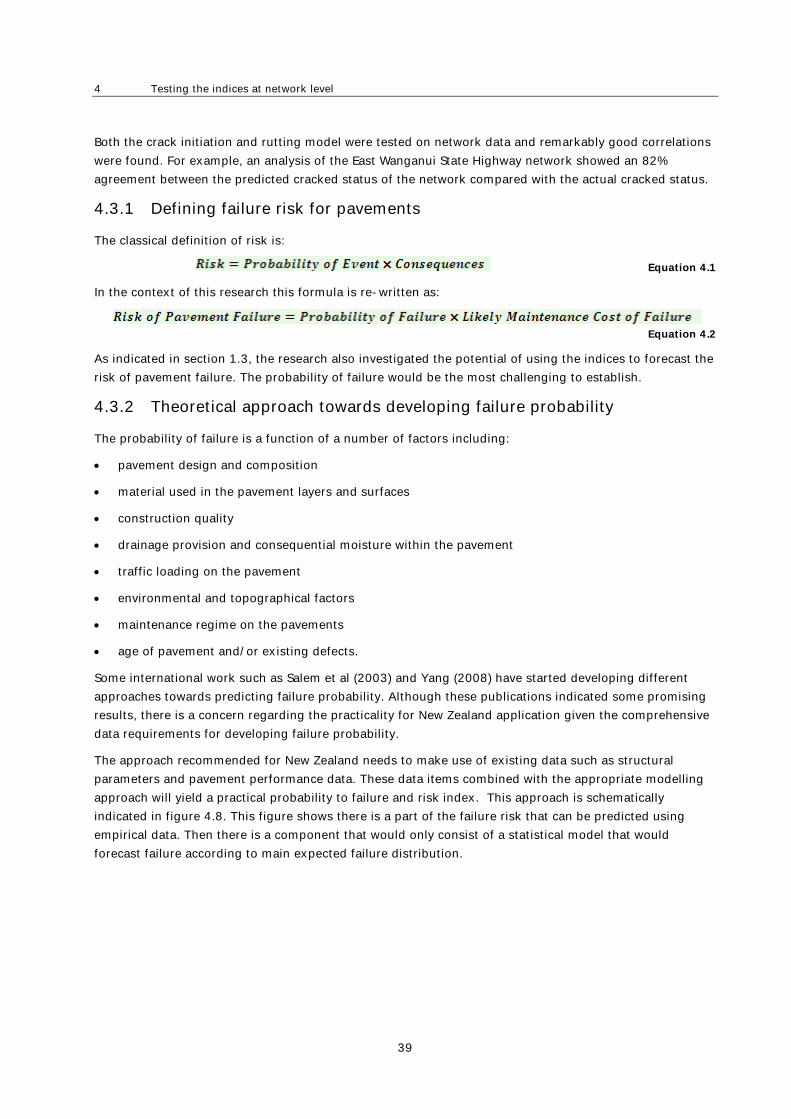
4 Testing the indices at network level
39
Both the crack initiation and rutting model were tested on network data and remarkably good correlations
were found. For example, an analysis of the East Wanganui State Highway network showed an 82%
agreement between the predicted cracked status of the network compared with the actual cracked status.
4.3.1 Defining failure risk for pavements
The classical definition of risk is:
Equation 4.1
In the context of this research this formula is re-written as:
Equation 4.2
As indicated in section 1.3, the research also investigated the potential of using the indices to forecast the
risk of pavement failure. The probability of failure would be the most challenging to establish.
4.3.2 Theoretical approach towards developing failure probability
The probability of failure is a function of a number of factors including:
pavement design and composition
material used in the pavement layers and surfaces
construction quality
drainage provision and consequential moisture within the pavement
traffic loading on the pavement
environmental and topographical factors
maintenance regime on the pavements
age of pavement and/or existing defects.
Some international work such as Salem et al (2003) and Yang (2008) have started developing different
approaches towards predicting failure probability. Although these publications indicated some promising
results, there is a concern regarding the practicality for New Zealand application given the comprehensive
data requirements for developing failure probability.
The approach recommended for New Zealand needs to make use of existing data such as structural
parameters and pavement performance data. These data items combined with the appropriate modelling
approach will yield a practical probability to failure and risk index. This approach is schematically
indicated in figure 4.8. This figure shows there is a part of the failure risk that can be predicted using
empirical data. Then there is a component that would only consist of a statistical model that would
forecast failure according to main expected failure distribution.
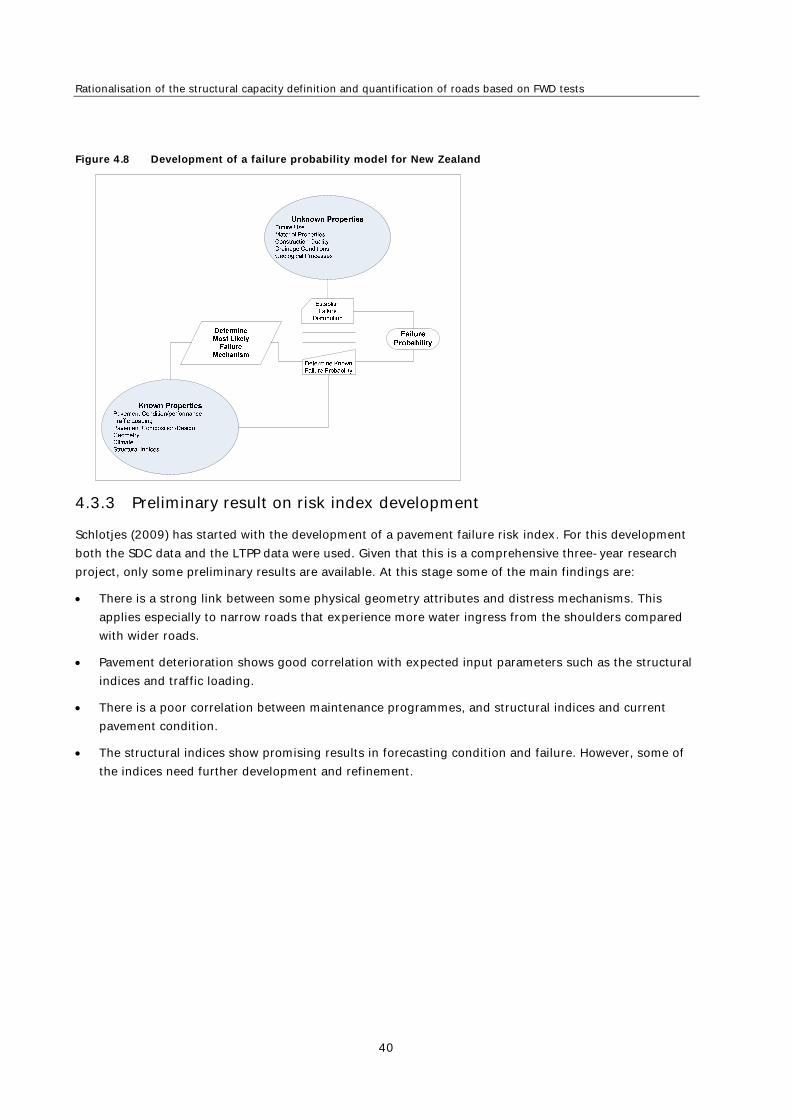
Rationalisation of the structural capacity definition and quantification of roads based on FWD tests
40
Figure 4.8 Development of a failure probability model for New Zealand
4.3.3 Preliminary result on risk index development
Schlotjes (2009) has started with the development of a pavement failure risk index. For this development
both the SDC data and the LTPP data were used. Given that this is a comprehensive three-year research
project, only some preliminary results are available. At this stage some of the main findings are:
There is a strong link between some physical geometry attributes and distress mechanisms. This
applies especially to narrow roads that experience more water ingress from the shoulders compared
with wider roads.
Pavement deterioration shows good correlation with expected input parameters such as the structural
indices and traffic loading.
There is a poor correlation between maintenance programmes, and structural indices and current
pavement condition.
The structural indices show promising results in forecasting condition and failure. However, some of
the indices need further development and refinement.
5 Findings and recommendations
41
5 Findings and recommendations
Structural number concepts originated well before mechanistic analysis procedures became readily
available to practitioners. The reason SNP can give an approximate indication of possible structural
deterioration for a large network is that the progression of many distress modes will generally be deferred
by improved load spreading (subgrade strain distribution). However, most of the techniques used to
model this are based on a general indicator of strength that is derived from layer thickness and material
quality. Therefore, SNP is not able to give any indication of how a particular pavement structure would
behave for a given layer configuration. For example, a road consisting of a stabilised base on top of
inferior material may have a high SNP, but would in fact fail rather quickly due to cracking of the base
layer.
Mechanistic appreciation of pavement structural performance, which is the aim of the American approach
(NCHRP), is not yet at the stage where reliable models for progression of all distress modes in all materials
are available. Advances in that research should be continuously followed, as that should eventually lead to
the most effective procedures for rational design. Meanwhile an improvement to the indirect SNP concept
is required. An interim solution for practitioners is to utilise mechanistic procedures when deriving the
fundamental structural parameters for network modelling.
As a replacement for SNP, an alternative structural parameter, termed structural index has been proposed.
For each of the currently recognised structural distress modes (ie rutting, roughness, flexure and shear) a
corresponding structural index is required. This study provides the basis for structural indices for rutting
and roughness.
The rutting index already has a substantial basis from APT and LTPP data. However it requires further
calibration as LTPP sites age, or as specific roads with known rutting performance and past traffic are
identified as suitable candidates for reliable calibration.
The roughness model is provisional only because no significant change in roughness has yet developed on
LTPP sites. However the model has been tentatively calibrated assuming all the LTPP sites began life with
minimal roughness, and that their past traffic has been realistically recorded. An ongoing study is
investigating structural indices for flexure and shear. The flexure model is advancing to a moderately
reliable stage, while the shear model is still in the early stages of development.
Each structural index is mechanistically derived and has the same range and general distribution as the
traditional SNP, allowing straightforward implementation (substituting the relevant structural index for
SNP) with minimal additional calibration needed for existing HDM/dTIMS asset management systems.
As the amount of data from LTPP sites grows, the improved mechanistic understanding of pavement
performance can be readily incorporated, by refining (or redefining the basis of) the structural index for
each distress mode. Provided the base (raw) data remains stored in RAMM, updated structural indices may
be readily generated at any future time for any network.
5.1 Further work required
Further development and refinement work required are summarised in table 5.1.

Rationalisation of the structural capacity definition and quantification of roads based on FWD tests
42
Table 5.1 Further development and refinement work on indices
Item Description of further work
required
Data source/methodology
SIrutting Minor refinement. Calibrate to those
regions with subgrades known to
perform anomalously (eg Taranaki
Brown Ash and Central Plateau
ashes.
Roads or networks with well known
performance (rutting distress and
known past ESA)
SIflexure Wider calibration particularly to
different surfacings (AC versus
OGPA versus multiple seal layers)
Project level testing of terminal sites
SIroughness Major refinement, as this is an
important yet the most difficult
parameter to characterise.
The challenge is to find roads that
have not been complicated by
unknown past maintenance or ‘non-
traffic’ damage (eg service trenches)
SIShear Separation of shear instability:
beneath AC surfacings
beneath thin seals on unbound
basecourse
within multiple seal layers
Project level testing of terminal sites
Pavement prediction models This research has demonstrated that
pavement prediction models need to
be re-developed/refined from first
principles if new indices are
incorporated
LTPP and some limited network
data.
Network applicability Extend the range of the indices by
conducting more tests on other
networks
Do this as part of the over-all
network testing programme
Pavement modelling Investigate further adoption of the
indices within the dTIMS system. For
example, it may well be utilised as
triggers and additional reporting
measures within the system
Deliver the structural indices to the
modelling community for further
investigation.
Risk index development The indices promise a significant
value to defining a risk index.
Fundamental development work
needs to occur in this area.
Development needs to be based on
a combination of network, LTPP and
CAPTIF data

6 References
43
6 References
AASHTO (1986) AASHTO guide for design of pavement structures. Washington, DC: American Association
of State Highway and Transport Officials.
AASHTO (1993) AASHTO guide for design of pavement structures. Washington, DC: American Association
of State Highway and Transport Officials.
ARA Inc and ERES Consultants Division (2004) Guide for mechanistic-empirical design of new and
rehabilitated pavement structures. National Cooperative Highway Research Program final report.
www.trb.org/mepdg/guide.htm
Austroads (1992) Pavement design: a guide to the structural design of road pavements. Sydney:
Austroads.
Austroads (2004) Pavement design: a guide to the structural design of road pavements. Sydney:
Austroads.
Austroads (2006) Investigation of the load damage exponent of unbound granular materials under
accelerated loading. Austroads technical report AP-T73/06.
Austroads (2009) Guide to pavement technology series. Sydney: Austroads.
Cochran, WC (1997) Sampling techniques. 3rd ed. New York: John Wiley.
Dawson, A (2002) The mechanistic design and evaluation of unsealed and chip-sealed pavements.
University of Canterbury workshop briefing paper. Accessed 25 April 2010.
www.pavementanalysis.com/papers/documents/pavementsworkshop02/briefing.pdf
Gray, W and G Hart (2003) Recycling of chip sealed pavements. Paper to PIARC World Road Conference,
Durban, South Africa. October 2003.
Henning, TFP (2008) The development of pavement deterioration models on the state highway network of
New Zealand. A thesis submitted in partial fulfilment of the requirements for the degree of Doctor of
Philosophy in Engineering, University of Auckland. Available from
http://researchspace.auckland.ac.nz/handle/2292/4236
Henning, TFP, WHRM Abeysekera, K Paudel and V Ramisheswar (2008) Understanding the long-term
performance of ACC’s asphalt surfaced sections. NZIHT Conference, Napier.
Henning, TFP, SB Costello, RCM Dunn, CC Parkman and G Hart (2004) The establishment of a long-term
pavement performance study on the New Zealand state highway network. ARRB Journal 13, no.2.
Henning, TFP, SB Costello and TG Watson (2006) A review of the HDM/dTIMS pavement models based on
calibration site data. Land Transport NZ research report no.303. 123pp.
Henning, TFP and DC Roux (2008) Pavement deterioration models for asphalt-surfaced pavements in New
Zealand. NZ Transport Agency research report no.367. 56pp.
Highway Research Board (1961) The AASHO road test: report 1, history and development of the project.
Special report 61A. Washington DC: National Academy of Sciences.
Hoque, Z, T Martin and L Choummanivong (2008) Development of HDM-4 road deterioration (RD) model
calibrations for sealed granular and asphalt roads. Austroads Project No. AT 1064.
HTC Infrastructure Management (1999) dTIMS technical reference manual. Volume I. Auckland: HTC.
Rationalisation of the structural capacity definition and quantification of roads based on FWD tests
44
Kerali, HGR (2000) Overview of HDM-4. Volume 1 of the Highway Development and Management Series.
Paris: PIARC and Washington: The World Bank.
Kancherla, A (2004) Resilient modulus and permanent deformation testing of unbound granular materials.
Master's thesis, Texas A&M University.
MHW New Zealand Ltd and Beca Carter Hollings & Ferner Ltd (2003) Safety related surface issues.
Wellington: Transit New Zealand.
Moffat, MA and GW Jameson (1998) Characterisation of granular material and development of a subgrade
strain criterion. ARRB Transport Research WD R98-005.
NDLI (1995) Modelling road deterioration and maintenance effects in HDM-4. Final Report ADB BETA 5549,
Vancouver, BC.
Opus International Consultants Ltd (2008) Pavement performance modelling dTIMS report. Auckland:
Manukau City Council.
Rada, GR (1996) SHRP ‒ LTPP monitoring data, 5-year report. SHRP-P-696. Washington: FWHA.
Rossiter, DG and A Loza (2004) Technical note: analysing land cover change with logistic regression in R.
1.3 ed. Enschede: International Institute for Geo-information Science & Earth Observation.
Salem, O, S AbouRizk and S Ariaratnam (2003) Risk-based life-cycle costing of infrastructure
rehabilitation and construction alternatives. Journal of Infrastructure Systems 9, no.1: 6–15.
Salt, G (1999) Determining the structural capacity of unbound granular pavements in New Zealand using
deflection testing. Report for Transfund NZ. Tonkin & Taylor Ltd, New Zealand.
Salt, G and D Stevens (2005) Performance based specifications for unbound granular pavements:
procedures for demonstrating achievement of design life. 7th Annual NZIHT/TRANSIT NZ Conference,
Christchurch.
Schlotjes, MR (2009) The risks associated with pavement failure in New Zealand. PhD Dissertation.
Unpublished. University of Auckland.
Stevens, D (2006) MET (ELMOD) strain criterion ‒ equivalent relationship for the Austroads (EFROMD2)
subgrade strain criterion.
www.tonkinandtaylor.com.au/documents/pavementsworkshop06/backanalysis.pdf
Theyse, HL (2002) Stiffness, strength and performance of unbound aggregate material: application of
South African HVS and laboratory results to California flexible pavements. California Partnered
Pavement Research Program Report. 86pp.
Tonkin & Taylor Ltd (2006a) Deflection trend study, SH1 RP 746. Transit New Zealand.
Tonkin & Taylor Ltd (2006b) Structural evaluation of Transit New Zealand's LTPP sites 1999‒2006. Draft
Report to Transit NZ.
Tonkin & Taylor Ltd (2007) Notes for the development of a rutting progression model for NZ unbound
granular pavements. Internal report 891045.2.
Tonkin & Taylor Ltd (2007a) Life prediction for unbound granular pavements using strain criteria for the
granular layers as well as the subgrade. Transit NZ LTPP study. Dunedin.
Tonkin & Taylor Ltd (2007b) Background to the development of a rutting progression model for NZ
unbound granular pavements. Transit NZ LTPP draft study. Dunedin.
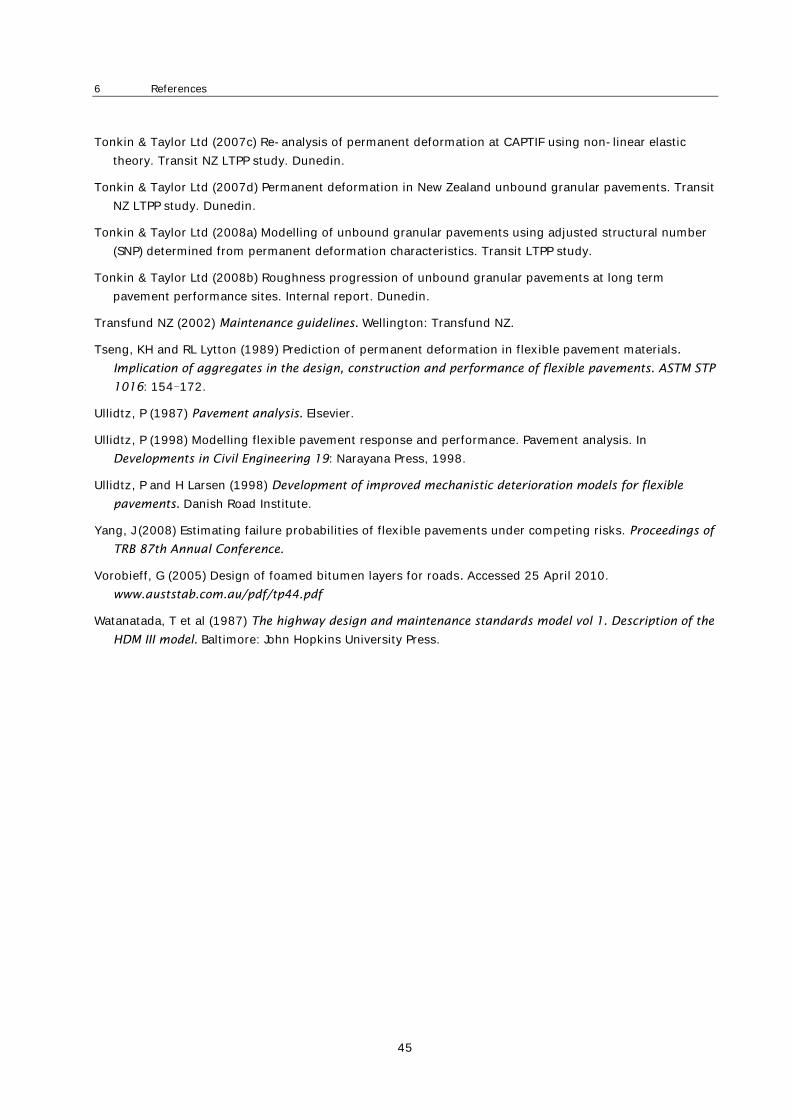
6 References
45
Tonkin & Taylor Ltd (2007c) Re-analysis of permanent deformation at CAPTIF using non-linear elastic
theory. Transit NZ LTPP study. Dunedin.
Tonkin & Taylor Ltd (2007d) Permanent deformation in New Zealand unbound granular pavements. Transit
NZ LTPP study. Dunedin.
Tonkin & Taylor Ltd (2008a) Modelling of unbound granular pavements using adjusted structural number
(SNP) determined from permanent deformation characteristics. Transit LTPP study.
Tonkin & Taylor Ltd (2008b) Roughness progression of unbound granular pavements at long term
pavement performance sites. Internal report. Dunedin.
Transfund NZ (2002) Maintenance guidelines. Wellington: Transfund NZ.
Tseng, KH and RL Lytton (1989) Prediction of permanent deformation in flexible pavement materials.
Implication of aggregates in the design, construction and performance of flexible pavements. ASTM STP
1016: 154‒172.
Ullidtz, P (1987) Pavement analysis. Elsevier.
Ullidtz, P (1998) Modelling flexible pavement response and performance. Pavement analysis. In
Developments in Civil Engineering 19: Narayana Press, 1998.
Ullidtz, P and H Larsen (1998) Development of improved mechanistic deterioration models for flexible
pavements. Danish Road Institute.
Yang, J (2008) Estimating failure probabilities of flexible pavements under competing risks. Proceedings of
TRB 87th Annual Conference.
Vorobieff, G (2005) Design of foamed bitumen layers for roads. Accessed 25 April 2010.
www.auststab.com.au/pdf/tp44.pdf
Watanatada, T et al (1987) The highway design and maintenance standards model vol 1. Description of the
HDM III model. Baltimore: John Hopkins University Press.

Rationalisation of the structural capacity definition and quantification of roads based on FWD tests
46
Appendix A: Best practice guidelines
FWD surveys – sampling techniques
How much is enough data?
Although some authorities are in a position to conduct a falling weight deflectometer (FWD) survey of their
entire network, it is not possible for others. Two questions arise:
How much of my network should be surveyed, ie what length of the network needs to be covered?
Once the length to be sampled has been established, what sampling frequency will be required on
each road section?
Unfortunately, there are no right or wrong answers to the questions above since they largely depend on a
number of factors including:
The ultimate use of the data. For example, for asset management purposes a less frequent sampling
on certain parts of the network may be acceptable, whereas for design purposes we need detailed
sampling for each road.
The existing knowledge of the network. Some authorities are privileged to have skilled and
experienced maintenance engineers. Although these engineers utilise applications in order to do
optimal maintenance planning, they know the performance of their network and associated issues
very well. Utilising this knowledge may allow a more targeted sampling process that could drastically
reduce the overall sampling size.
The extent of the current network, plus how much of it has been sampled before.
The availability of funding. Obviously, more available funds will allow more sampling and better
information may result from it. However, in most cases, asset managers have to do the best they can
within the funding levels.
Sophistication of use. Some authorities already have good quality data for other items and use FWD
results with vigour including a dTIMS modelling process. For these authorities a more comprehensive
sample is advisable, whereas authorities still basing their evaluations on simplified methods may not
need such a comprehensive survey.
The following section recommends a process for selecting the appropriate sampling regime for different
situations.
Selecting the appropriate sample for a network
The factors mentioned in the previous section will determine the overall sampling size of the network.
This may result in say 5%, 10%, 20% or 50% FWD test coverage of the whole network. A decision also has
to be made on which sampling technique to use for a FWD survey. Some of these techniques include
(Cochran 1997):
Random sampling - a number of roads or the length of the network are selected for FWD testing
without any pre-defined considerations.
Systematic sampling – a number of roads are selected according to a set process. For example, we
may select all roads with even road IDs. This method was used in the past when all roads with AADT

Appendix A
47
above 2500 were surveyed. This approach was adopted since the HDM-III models used at that stage
were sensitive only to those traffic volumes.
Clustering sampling –a network may be surveyed based on, for example, historical wards or barrows.
Stratified sampling – the entire network is classified according to given factors such as traffic loading,
hierarchy, geology type, or development history. Once the network is classified into the defined matrix
a random sample is taken from each cell of the matrix.
The most effective method of sampling New Zealand roads would be to use the stratified method
combined with either random or systematic approaches for the final road selection. This method is to be
used according to the following steps:
Step 1: Understanding performance of your network
Either through detailed statistical analysis of the network or by utilising existing knowledge of the network
you can define a number of factors that drive the performance and maintenance planning of the network.
Some of these factors may include:
geological make-up of the network
topography
historical development of the network (for example there may be parts of the network which were
built according to a different design or construction approach)
in-situ subgrade conditions
rainfall
traffic loading
pavement types
dominant failure patterns.
The secret of this step is to choose three to five factors that have the greatest effect on the behaviour of
pavements and consequential maintenance decisions.
Step 2: Stratify the network according to chosen factors
At this stage it may be useful to start using a map (preferably a GIS map) and colour code the roads
according to the chosen factors. Once this process is completed the resulting length for each cell should
be calculated. Figure A.1 gives an example outcome for this approach.
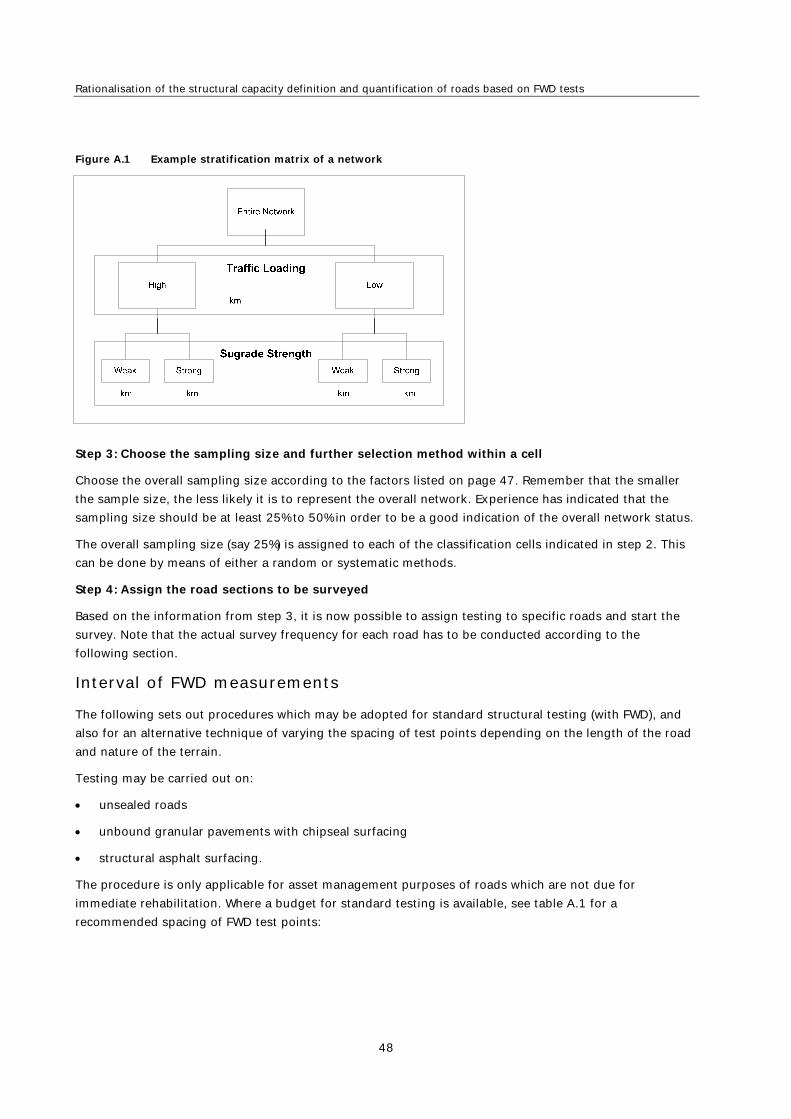
Rationalisation of the structural capacity definition and quantification of roads based on FWD tests
48
Figure A.1 Example stratification matrix of a network
Step 3: Choose the sampling size and further selection method within a cell
Choose the overall sampling size according to the factors listed on page 47. Remember that the smaller
the sample size, the less likely it is to represent the overall network. Experience has indicated that the
sampling size should be at least 25% to 50% in order to be a good indication of the overall network status.
The overall sampling size (say 25%) is assigned to each of the classification cells indicated in step 2. This
can be done by means of either a random or systematic methods.
Step 4: Assign the road sections to be surveyed
Based on the information from step 3, it is now possible to assign testing to specific roads and start the
survey. Note that the actual survey frequency for each road has to be conducted according to the
following section.
Interval of FWD measurements
The following sets out procedures which may be adopted for standard structural testing (with FWD), and
also for an alternative technique of varying the spacing of test points depending on the length of the road
and nature of the terrain.
Testing may be carried out on:
unsealed roads
unbound granular pavements with chipseal surfacing
structural asphalt surfacing.
The procedure is only applicable for asset management purposes of roads which are not due for
immediate rehabilitation. Where a budget for standard testing is available, see table A.1 for a
recommended spacing of FWD test points:

Appendix A
49
Table A.1 Recommended frequency of measurements for FWD surveys
Centreline length of 2-lane road FWD test spacing
0-200 5 tests (3 IRP lane, 2 DRP lane)
200-500 100m intervals in each lane
500-2000 10 tests in each lane
>2000 200m intervals in each lane
Data storage, processing and reporting
The additional storage now required in RAMM is the four additional fields for the structural indices.
Customarily, much of the data stored for FWD testing has been limited to peak stress and deflections. The
remainder of the full-time history captured at the time of the test has been discarded. There is no extra
effort required to store the raw data (known in the industry as the ‘full-time history’. This file gives the
full wave pattern induced by the loading and there are ‘signatures’ within it that are now becoming
recognised as being distinctive of shear instability. For this reason all requests for FWD testing should
include a requirement for provision of the full-time history record. However the files are large and at
present there is little need to store other than the peak data in RAMM as the fields for date of collection
and testing contractor can be used to source the raw data, should the structural indices need to be re-
evaluated. In practice, there is no significant technical reason to store the peak data in raw form as
opposed to standardised form (corrected for a plate stress of 575kPa), as suits the data manager.
Processing to generate the indices simply requires a recognised transfer function as described in
section 3.1 and it is important to appreciate that regions and network around the country are
demonstrably different (particularly in relation to rutting behaviour which is controlled by the different
types of natural subgrades).
Reporting needs to state the basis of derivation, eg if other than the Austroads subgrade strain transfer
function is used for the rutting model then that should be supplied. In this way future revisions can either
adopt the status quo, or seek a more appropriate relationship, once more regional data become available
for calibration.
Application of structural capacity parameters
Based on the findings of this report the recommended application areas for the structural indices are
discussed in the following sections.
Network level rehabilitation diagnostics
The original intention in developing the structural indices was to provide a structural capacity parameter
that could be used in asset management processes. One of the significant outcomes of this research was
the framework for having four separate indices that represented the four main failure mechanisms of
New Zealand flexible roads. This allows the indices to be used intensively for making more informed
decisions on the maintenance regime for given road sections. Table A.2 contains the decision framework
for using the structural indices.

Rationalisation of the structural capacity definition and quantification of roads based on FWD tests
50
Table A.2 Using the structural indices to Identify appropriate maintenance actions
Index/indices Possible mechanism/extra
information
Potential remedial action
For low values of individual index
SIrutting There is a possibility that the
subgrade may be overstressed or
that the compaction of the layers
are not sufficient. Also consider
actual defect data including rutting
and cracking information.
The pavement needs to be
strengthened. Options include:
overlay
recycle existing material
(preferably adding some
additional depth).
SIflexure There is potential for layers with
tensile capacity in the pavement to
become distressed. This may lead to
further defects. If the pavement
does not contain layers with tensile
capacity, further investigations are
needed to find the cause of the
problem.
With sufficient strength in the
pavement, a resurfacing may be
considered to keep the pavement
watertight.
For distressed bound layers in situ,
stabilisation may be considered.
Make sure that the lower pavement
layers provide sufficient support for
stabilised layers.
SIroughness There is significant variation in
structural parameters taken along
the length of road. This variation
may result from consolidation of the
pavement layers or some in-situ soil
variations of the subgrade.
Only when the roughness gets
above recommended levels, should
any maintenance be considered.
Therefore monitor roughness
progression and fix any local
unevenness using normal routine
maintenance practices.
SIShear The base layer displays shear issues.
It is expected that localised distress
such as cracking, shoving and
potholes will start forming.
Monitor actual occurrence of
defects. Once maintenance cost
increases, rehabilitation needs to be
considered. This may include in-situ
recycling and/or overlays
Combined indices with low values
SIflexure & SIrutting
&/or SIroughness The pavement is at an advanced
stage of failure. The subgrade is
over-stressed and some of the
layers are starting to show distress
also.
Full rehabilitation options
SIflexure &
SIShear&/or SIroughness The base layer is at an advanced
stage of distress
Repair base layer - more detailed
testing and investigation may be
needed to determine whether the
material in the base layer can be
utilised in some form or other.
Pavement modelling and network reporting
It has been demonstrated that the introduction of structural indices to the pavement deterioration models
would improve the overall status and usefulness of the models. However, it is recommended that the
structural indices are further explored to judge their usefulness for:

Appendix A
51
use as intervention/trigger mechanisms
additional reporting measures to give an indication of network pavement capacity. For example, the
current system contains a granular overlay need which is a function of the SNP and the traffic loading.
Something similar could be developed for the structural indices.
The last point is also of interest to overall network performance monitoring and reporting. According to
theoretical definition, the SNP does not change over time. However, the deflection results of roads do
change over time, which may lead to a change in SNP.
The structural indices differ fundamentally from this approach. It is expected that the structural indices
will change over the life of the pavement as it is a function of the failure mechanism assumed during the
design. Therefore, the structural indices would be an excellent indication of the structural capacity of the
network and how it changes over time. It is further recommended that the four indices are reported
separately as each will convey a different aspect of the network performance.
A process of refining the strength indices
The key to refining the strength indices is to first test the concept at project rather than network level.
That is, finding specific treatment lengths that have each reached a terminal condition, and then testing
the indices to see how well the predictions for individual distress modes fit with observed performance.
The recommended process for this is:
1 Identify a treatment length in a terminal condition that (a) has comprehensive condition data
contained in RAMM (including HSD rutting/roughness and deflection data), and also (b) can be
discussed with a pavements engineer who is closely familiar with its historic performance and any
intervention taken since first construction.
2 Assume (if necessary) reasonably expected values for initial rutting and roughness.
3 Use the current fatigue criteria (or other parameters) to find predicted life for each distress mode.
4 Review the predicted with the observed condition together with the pavement engineer familiar with
its historic performance.
After applying intensive test data to a series of project sites, validate or refine the indices to ensure
consistency of observed performance with the structural index.
As an example, figure A.2 shows the expected total life (in terms of millions of equivalent standard axles
(MESAs)) for a pavement using the structural index modelling. This is a recent case history of premature
failure on a section of SH2. Each of the four failure modes is shown, but clearly it is only the lowest of
these graphs that is relevant, and would need to be discussed with the local pavement engineer to
ascertain a full picture. This would include determination of whether the predictions are accurate in
absolute terms (should any graph be translated up or down), and in relative terms (ie do the chainages
where greater severity of distress is expected, coincide with actual observed performance), and also allow
consideration of historic knowledge that may not be included in specific data collected.
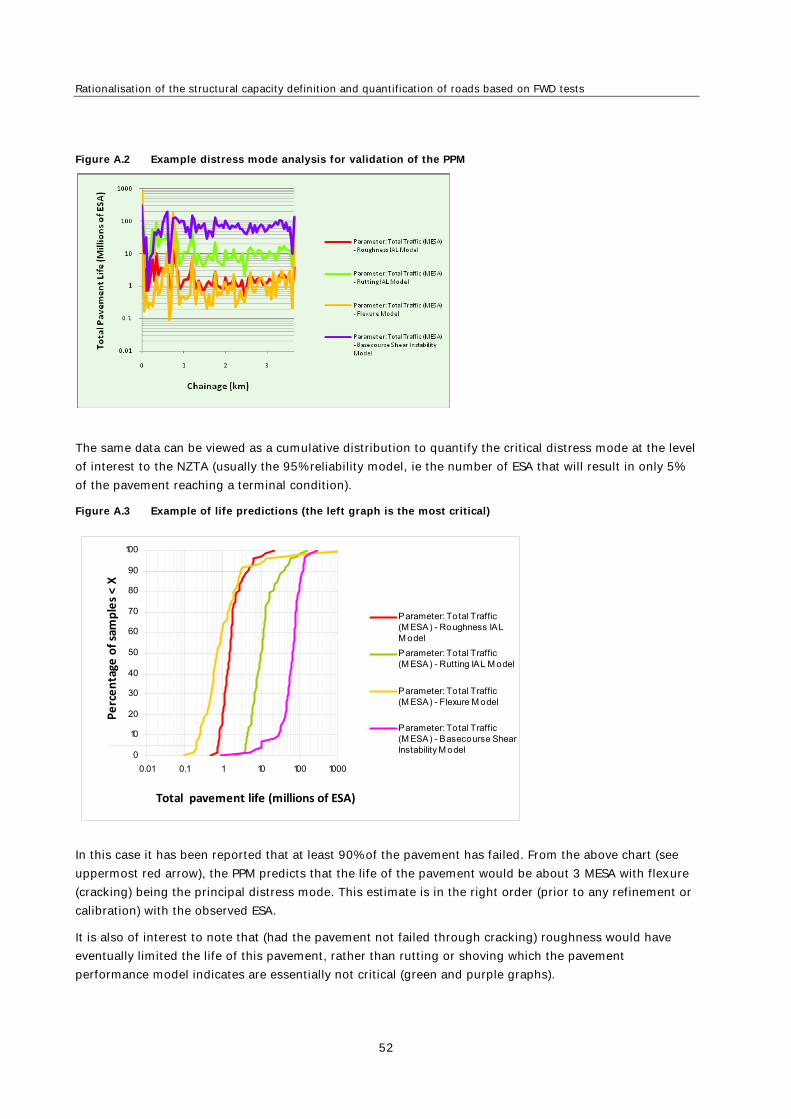
Rationalisation of the structural capacity definition and quantification of roads based on FWD tests
52
Figure A.2 Example distress mode analysis for validation of the PPM
The same data can be viewed as a cumulative distribution to quantify the critical distress mode at the level
of interest to the NZTA (usually the 95% reliability model, ie the number of ESA that will result in only 5%
of the pavement reaching a terminal condition).
Figure A.3 Example of life predictions (the left graph is the most critical)
In this case it has been reported that at least 90% of the pavement has failed. From the above chart (see
uppermost red arrow), the PPM predicts that the life of the pavement would be about 3 MESA with flexure
(cracking) being the principal distress mode. This estimate is in the right order (prior to any refinement or
calibration) with the observed ESA.
It is also of interest to note that (had the pavement not failed through cracking) roughness would have
eventually limited the life of this pavement, rather than rutting or shoving which the pavement
performance model indicates are essentially not critical (green and purple graphs).
0
10
20
30
40
50
60
70
80
90
100
0.01 0.1 1 10 100 1000
Total pavement life (millions of ESA)
Percentage
of samples < X
Parameter: Total Traffic(M ESA) - Roughness IALM odel
Parameter: Total Traffic(M ESA) - Rutting IAL M odel
Parameter: Total Traffic(M ESA) - Flexure M odel
Parameter: Total Traffic(M ESA) - Basecourse ShearInstability M odel

Appendix A
53
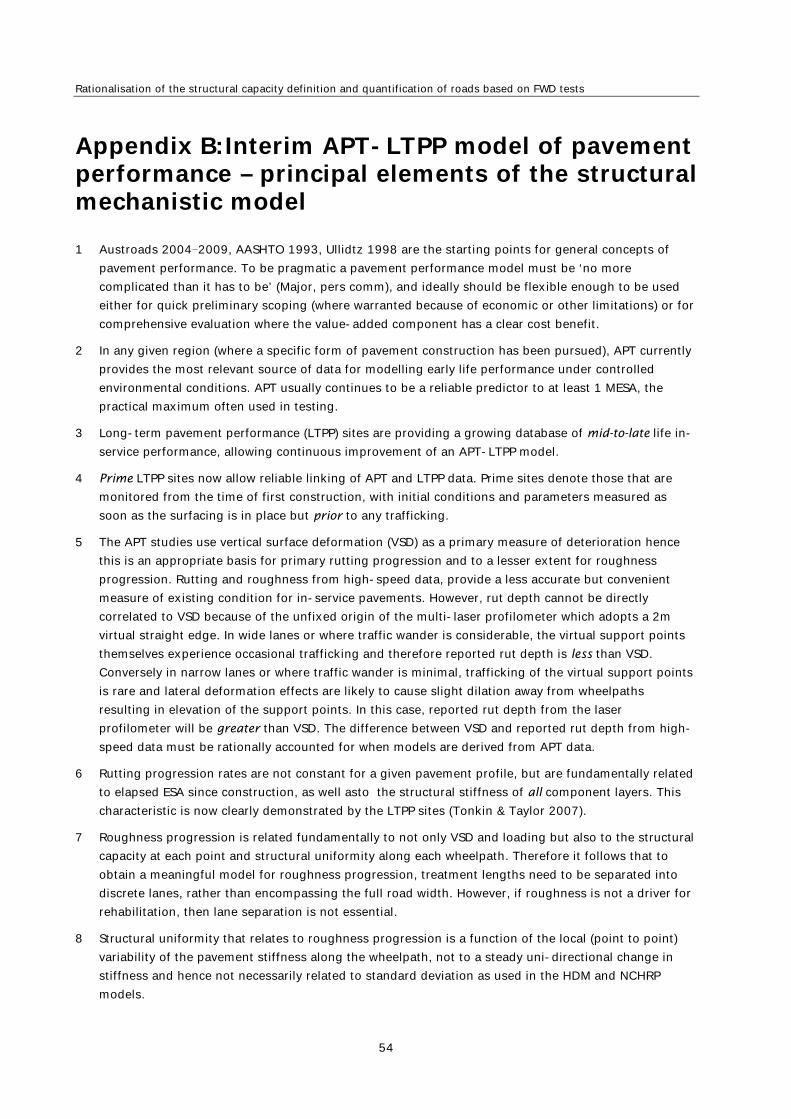
Rationalisation of the structural capacity definition and quantification of roads based on FWD tests
54
Appendix B: Interim APT-LTPP model of pavement performance – principal elements of the structural mechanistic model
1 Austroads 2004‒2009, AASHTO 1993, Ullidtz 1998 are the starting points for general concepts of
pavement performance. To be pragmatic a pavement performance model must be ‘no more
complicated than it has to be’ (Major, pers comm), and ideally should be flexible enough to be used
either for quick preliminary scoping (where warranted because of economic or other limitations) or for
comprehensive evaluation where the value-added component has a clear cost benefit.
2 In any given region (where a specific form of pavement construction has been pursued), APT currently
provides the most relevant source of data for modelling early life performance under controlled
environmental conditions. APT usually continues to be a reliable predictor to at least 1 MESA, the
practical maximum often used in testing.
3 Long-term pavement performance (LTPP) sites are providing a growing database of mid-to-late life in-
service performance, allowing continuous improvement of an APT-LTPP model.
4 Prime LTPP sites now allow reliable linking of APT and LTPP data. Prime sites denote those that are
monitored from the time of first construction, with initial conditions and parameters measured as
soon as the surfacing is in place but prior to any trafficking.
5 The APT studies use vertical surface deformation (VSD) as a primary measure of deterioration hence
this is an appropriate basis for primary rutting progression and to a lesser extent for roughness
progression. Rutting and roughness from high-speed data, provide a less accurate but convenient
measure of existing condition for in-service pavements. However, rut depth cannot be directly
correlated to VSD because of the unfixed origin of the multi-laser profilometer which adopts a 2m
virtual straight edge. In wide lanes or where traffic wander is considerable, the virtual support points
themselves experience occasional trafficking and therefore reported rut depth is less than VSD.
Conversely in narrow lanes or where traffic wander is minimal, trafficking of the virtual support points
is rare and lateral deformation effects are likely to cause slight dilation away from wheelpaths
resulting in elevation of the support points. In this case, reported rut depth from the laser
profilometer will be greater than VSD. The difference between VSD and reported rut depth from high-
speed data must be rationally accounted for when models are derived from APT data. 6 Rutting progression rates are not constant for a given pavement profile, but are fundamentally related
to elapsed ESA since construction, as well asto the structural stiffness of all component layers. This
characteristic is now clearly demonstrated by the LTPP sites (Tonkin & Taylor 2007).
7 Roughness progression is related fundamentally to not only VSD and loading but also to the structural
capacity at each point and structural uniformity along each wheelpath. Therefore it follows that to
obtain a meaningful model for roughness progression, treatment lengths need to be separated into
discrete lanes, rather than encompassing the full road width. However, if roughness is not a driver for
rehabilitation, then lane separation is not essential.
8 Structural uniformity that relates to roughness progression is a function of the local (point to point)
variability of the pavement stiffness along the wheelpath, not to a steady uni-directional change in
stiffness and hence not necessarily related to standard deviation as used in the HDM and NCHRP
models.
Appendix B
55
9 It is important to note that more than 60% of LTPP sites have subgrade moduli that cannot be sensibly
modelled as linear elastic. It is now widely recognised that unbound pavement materials, particularly
subgrades with CBR< 7, have non-linear moduli, ie they may exhibit strain-dependent behaviour
(stress hardening or stress softening) and such characteristics must be correctly modelled or both
back-calculated and forward-calculated parameters will be invalid. Approximating non-linear moduli
by attempting to use a linear elastic model with sub-layering will give not give a realistic pavement
model (Ullidtz 1999).
10 There is no practical measurement procedure to determine anisotropy of in-service pavements.
Worldwide, the majority of pavement models (including HDM-4) are based on isotropic moduli.
Therefore to be able to be able to draw on other international research, the most pragmatic approach
(keeping the model ‘no more complicated than it has to be’) is to retain the concept of isotropic
moduli. Anisotropy promoted by Austroads is counter-productive, but the overriding consideration is
that it is needlessly out of step with worldwide practice.
11 Pavement structural life is governed not only by strains at the top of the subgrade but also by strains
at depth within the subgrade and within each pavement layer. Observations from APT confirm that
reliance on a subgrade criterion alone, can give errors of over two orders of magnitude if predicting
the number of ESA to a terminal rutting condition. An extended compressive vertical strain criterion
can be readily adopted that includes both the standard subgrade strain criterion and, based on LTPP
data, suitable strain criteria from all individual pavement layers.
12 A pavement design chart (eg Austroads 2004, figure 8.4) that has provided reliable empirical design in
the past should be a reliable basis for back-analysing an appropriate subgrade strain criterion. This
process is also applicable for determining appropriate strain criteria for the overlying layers, provided
proven modular ratios (as promoted by Austroads) are used for unbound granular materials. Back-
analysis results can be unconservative, hence for all cases checks need to be made with respect to
LTPP sites that exhibit substantial wear and have reliable estimates of past traffic (ESA).
13 Flexure under traffic loading and its associated horizontal tensile strains require consideration for all
bound structural layers, including layers that are often regarded as non-structural such as porous
asphalt and sprayed seals where the maximum tensile strains are often found to be at the top of the
layer (if it is thin), as opposed to the case of thick structural asphalt when the maximum tensile strain
is invariably at the bottom of the bound layer.
14 The inclination of the road, speed of traffic and braking/cornering stresses require consideration
when assessing flexural life of thin asphalt or sprayed seal layers. The standard 1ESA loading should
in this case include the relevant tractive horizontal shear stresses as well as the normal vertical
loading. Flexural life of porous asphalt is generally dictated by ravelling which is considered to be
related to both traction and flexure.
15 Where unbound basecourse forms the top layer and is not protected by structural asphalt, life will be
limited by degradation of the aggregate which will eventually lead to shear instability.
16 Newly constructed unbound granular pavement layers compacted using best practice to accepted
standards, will increase in stiffness markedly during early life trafficking, particularly in the first year
or at least the first 20,000 ESA. The degree of stiffness improvement and early life rutting may be
predicted from the ratios of layer moduli (relative to Austroads expectations) measured at the time of
construction.
17 Unless subject to variable watertable levels that come close to the top of a fine-grained subgrade,
pavements that are adequately protected by watertight surfacings soon tend to reach an equilibrium
Rationalisation of the structural capacity definition and quantification of roads based on FWD tests
56
condition as far as stiffness is concerned. Subsequent changes in stiffness due to seasonal changes
then tend to be minimal. Until either shear instability develops or cracking is initiated, the structural
stiffness of all pavement layers will not reduce markedly even with prolonged trafficking.
18 A small change in equilibrium water content of an unbound granular layer will induce a large change
in the rate of progression of permanent deformation. In particular, from laboratory repeated load
triaxial testing, an increase of just 1% in water content (above the optimum) in a basecourse can
increase the rutting rate (per load cycle) in that layer by an order of magnitude. Similar sensitivity is
inferred from in-service pavements. For this reason a relevant environmental parameter is
fundamental for any pavement deterioration model and also for reaching conclusions regarding the
potential in-service performance after repeated load testing of non-standard aggregates. Adoption of
the Thornthwaite Index as promoted in both New Zealand and Australia appears the most promising
parameter at present. Equilibrium water content fluctuation is, and is likely to remain, the primary
reason for the inherent difficulty in predicting pavement performance. Repeated load triaxial testing
has its value in the assessment of the relative performance of materials in the laboratory, but results
must be used with caution when assessing absolute performance or parameters for in-service
pavements.
19 Pavement material parameters seldom exhibit a normal (Gaussian) distribution. Adopting relevant
percentiles for characterising design parameters avoids the need to assume any particular distribution
and is therefore a practical course.
20 Appropriate selection of treatment lengths on the basis of structural homogeneity is critical for
rational prediction of deterioration and forward work programmes. Initial treatment lengths chosen on
the bases of surfacing type must subsequently be refined by sub-sectioning on the basis of structural
uniformity (as required by the NZTA, but seldom found in practice).

Appendix B
57