Embed Size (px)
Citation preview
1
Centre for Transport & Society School of Health & Social Care
RESEARCH REPORT
AN INVESTIGATION OF FACTORS INFLUENCING THE RESUMPTION OF DRIVING BY PATIENTS WITH ONE FOREARM IMMOBILISED IN A BELOW-ELBOW CAST
Authors Calcraft MJ, Clinical Specialist Physiotherapist, North Bristol NHS Trust Fox R, Trauma Research Co-ordinator, North Bristol NHS Trust Musselwhite CM, Associate Professor of Gerontology, College of Human and Health Sciences, Swansea University Swinkels A, Research Fellow, Faculty of Health and Life Sciences, University of the West of England, Bristol Young S, Participant Partner, Bristol Turton P, Senior Lecturer, Faculty of Health and Life Sciences, University of the West of England, Bristol Author for Correspondence Pat Turton, Senior Lecturer, Faculty of Health and Applied Science University of the West of England Glenside Campus Blackberry Hill, Stapleton Bristol BS6 7BX Tel: 0117 3288848 E mail: [email protected] Declarations There are no known conflicts of interest in relation to this paper. Funded by a British Association of Hand Therapists (BAHT) research grant.
2
Contents Executive summary
Page 3
Chapter 1 – Introduction
Page 14
Chapter 2 – Objectives
Page 15
Chapter 3 -Literature review
Page 16
Chapter 4 – Methodology
Page 25
Chapter 5 – Findings
Page 32
Chapter 6 – Discussion
Page 48
Chapter 7 – Conclusion
Page 51
Chapter 8 – Recommendations
Page 52
References
Page 53
Appendix 1 – Questionnaire
Page 56
3
Executive Summary
AN INVESTIGATION OF FACTORS INFLUENCING THE RESUMPTION OF DRIVING BY
PATIENTS WITH ONE FOREARM IMMOBILISED IN A BELOW-ELBOW CAST
Introduction
The National Travel Survey (2012) indicates that, in the United Kingdom (UK), 36 million people hold
driving licences, making on average 610 car trips over a distance of 5,219 miles per person per year
(Department for Transport (DfTa, 2013). Driving is, however, a hazardous activity and, in the year up to
March 2013, there were 195,723 road casualties with 119,708 car occupant casualties, of whom 801
people were killed (DfTb, 2013). Driver error is believed to be either a sole or a contributing factor in
95% of all road traffic accidents (DfTb, 2013).
The Highway Code states that individual drivers are responsible for “making sure they are fit to drive”
and that they “MUST [sic] report to the Driver Vehicle Licensing Agency (DVLA) any health condition
likely to affect driving”. However the DVLA do not identify that temporarily wearing a cast to immobilise
a fracture is a notifiable condition and drivers are not required to disclose short term disabilities, such
as this, of less than 3 months duration. In apparent contradiction, the Crown Prosecution Service
publication, “Policy for Prosecuting Cases of Bad Driving” (Crown Prosecution Service, 2014), lists
driving with impaired ability “such as having an arm or leg in plaster” as an example of driving
dangerously/carelessly. Therefore, in theory, cast-wearing drivers could be prosecuted following a road
traffic incident. There is evidence to suggest that patients do drive in their upper limb casts and whilst
not illegal in Britain there is debate about whether an arm in a cast affects driver reactions. There is
also discussion about what is the best advice to give these patients from a medico-legal perspective.
Literature review
Primary literature was identified through searches carried out using the search terms “wrist or distal
radial” and “fracture”, “driving or drive”, “cast or plaster” and “immobilisation”. Five current areas of
research were identified; (1) the prevalence of driving in a cast, (2) the effect of a cast on driver
performance, (3) the advice offered to patients in a cast, (4) current driving regulations with regard to
driving in a cast and (5) factors that influence driving behaviour.
4
The literature indicates that patients do choose to drive in their plaster casts, however, the reported
extent of this varies from 9% to 50%. This range of prevalence reflects a number of factors including
the heterogeneity of study designs, the influence of variables such as the country, driving environment,
population differences, treatment differences and advice given. In addition, the extent to which having
an arm in a cast affects driver performance is unclear. Several studies indicate that the presence of a
forearm cast on healthy volunteers does affect driving performance, however, no studies were found to
have investigated fracture patients where additional factors such pain, muscle deconditioning,
secondary stiffness, anxiety and the effects of treatments such as analgesia could potentially impact on
driving.
Driving a motorised vehicle, even without a cast, is inherently hazardous and drivers must accept a
degree of risk. Research investigating driver risk behaviour shows that drivers exhibit two forms of
aberrant driving behaviour, namely errors and violations. Errors can be split into two distinct
psychological types, slips and lapses. Violations are defined as being deliberate, rather than a slip or a
lapse. There is no research yet that investigates whether these identified driving behaviours are altered
by the presence of a forearm cast.
A consequence of the lack of patient-based research evidence and ambiguous official advice is that it is
difficult for healthcare professionals to know exactly what to advise patients. Regulations are not
definitive and there is no consensus on standard return-to-driving recommendations as indicated by
numerous studies from around the world. In addition to official sources, cast wearers may access
information outside their immediate healthcare setting, such as from family, friends and the internet. A
search of the internet reveals many sites such as chat rooms, discussion forums, condition specific
websites, patient leaflets and medical papers; however these also give conflicting advice.
Study Aims
This research aimed to explore the factors that influence the resumption of driving following
immobilisation in a below–elbow cast for a distal radial fracture and to explain these influences in order
to inform the development of standardised advice that may guard against risk taking driving behaviours.
5
Methodology
A mixed methods design was chosen involving a composite questionnaire (Appendix 1) involving all
participants and semi-structured telephone interviews with an emergent sample of participants.
The questionnaire had 8 parts including separate sections on driving habits, attitude to risk, advice
given and driving while wearing a cast. It was developed from review of the literature, the experience of
the research steering group and feedback from the Trust’s Patient Information/Questionnaire
development team. Participants who met inclusion criteria for the study were identified from a non-
probability sample of fracture patients recruited from an orthopaedic trauma clinic of a large teaching
hospital.
An emergent sample of study participants, identified on the basis of gender, age, handedness,
mechanism of injury, car transmission type and driving status, was interviewed by telephone. The
format of telephone interviews was developed by review of the literature, and discussion among the
research team (an experienced hand therapist, an experienced driving researcher, experienced
researchers from university and healthcare environments and lay participant).
All potential interview participants (i.e. those who had returned the questionnaire) were initially
contacted by telephone to answer any questions about the research, to check that they fitted the
inclusion criteria, to screen for emergent sampling categories and to obtain informed verbal consent.
Consenting participants selected for telephone interview were subsequently contacted, at a pre-
arranged time, and interviewed using a thematic semi-structured format lasting 30-60 minutes. These
telephone interviews, which were audio taped, aimed to gather information about the actualities of
patients’ resumption of their driving experience.
Field notes were also kept by the researcher throughout the research study. These notes were collated
and coded and used to develop the themes identified throughout data analysis.
Data Analysis
Descriptive statistics were used to explore background information about the sample, including how
breaking an arm and having it in a cast effected travel behaviour. Inferential analysis was conducted to
identify the characteristics of those who drove compared to those that did not drive with their arm in a
6
cast. Qualitative analysis was undertaken of the free text questions in the questionnaire to elicit
common themes and unique comments.
Telephone interview data was subjected to qualitative analysis through individual reading of the
transcribed interviews for key subject areas to be identified; paired reading and identification of
common themes; research team group reading of themes and identification of key concepts; researcher
identification of supporting quotes for each concept and research team group discussion of final
selections.
Findings
Participant Characteristics
A total of 111 questionnaires were completed, 87 female, 24 male. The average age of the sample was
57.08 years and was normally distributed. Females were slightly older (mean 58.38 years) in
comparison to males (mean 52.38 years). In relation to handedness 97 (87.39%) were right handed, 10
(9%) left handed and 4 (3.6%) were ambidextrous.
The majority of patients (77) were injured in a fall from, or lower than, standing height and 17 were
injured in a fall from greater than standing height. Other mechanisms of injury included 10 from sporting
activity, 2 from road traffic accidents and 5 were from other causes (dancing, work, pushed over, not
specified). The left hand was most commonly injured (n=66; 59.46%). The right hand was injured 43
times (38.74%) and 2 patients injured both hands (1.81%). Participants had their casts on for between
one and twelve weeks with the median time being 6 weeks.
The majority of participants had manual cars (97) while 14 had an automatic car. All but one participant
had right hand drive cars. The most common reason stated for using their car was domestic/social
reasons (63) with work cited second (45). A total of 19 participants did not indicate the primary use of
their car selecting either “other” but not specifying, or selecting “all”.
Participants had held a driver licence for an average of 32.62 years and drove an average of 82.62
miles in a typical week, though distribution was skewed more to the lower number of miles. Males drove
significantly more miles (139.58 miles/week) on average per week in comparison with females (67.72
7
miles/week) (t(109)=3.57; p<0.01). There was a significant negative correlation between age and miles
driven per typical week (r=-190; n=111; p<0.05), with younger drivers driving more miles.
Twenty-one participants chose to drive while in their cast representing 18% of the study population.
These twenty-one included the youngest participant (21 years) and the oldest participant (85 years).
Twelve drivers were female and 9 were male, indicating the men 9 of the 24 (37.5%) male participants
drove, compared to only 12 of the 87 (13.8%) female participants. A chi-squared test shows this is a
significant difference; males are significantly more likely than females to drive in a below-elbow plaster
cast (x2=6.89; p<0.01). The average age of participants who drove with a cast on was slightly younger
(53.38 years) compared to those who did not drive (57.94 years), though the difference was not
significant (t (25.22) =1.11; p>0.05). Those who chose to drive with their cast typically drove more
miles (mean 104.05 miles) than those who chose not to wear a cast (mean 78.41 miles), but again this
was not statistically significant (t (24.01) = -0.88; p>0.05).
Drivers were mainly right handed (17 right, 80.95%; 4 left, 19.05%) and the left hand was most
frequently injured (8 right, 38.1%; 13 left, 61.9%). Fifteen of the drivers had a manual car and 6 had an
automatic car. All drivers had right hand drive cars. Eleven drivers cited domestic and social reasons for
their primary use of the car while ten drivers cited work as the primary reason for car use. The majority
of participants drove less often than normal wearing a cast but 5 continued to drive with their usual
frequency and one person drove more frequently.
Of the 21 who drove in their cast, the majority felt that driving in a cast did not make a large difference
to their driving behaviour. On the whole, people who drove with a cast tended to state they thought it
was safe to do so, and though there was greater admittance to feeling uncomfortable about it, this did
not seem to hamper their perceived observation, skills or safety. It was also common for drivers to use
compensatory behaviours to help them drive with their arm in a cast.
Driving habit and risk characteristics of participants were components of the questionnaire. Of the 21
drivers, 16 (76.19%) belonged to habit group 1 (high affect) and 5 (23.81%) to habit group 2 (low
affect); 17 (80.95%) to risk group 1 (low risk) and 4 (19.05%) to risk group 2 (high risk). Findings show
that participants in the high affect and/or high risk taker categories were more likely to drive in their cast
than someone in the other categories (but still more likely not to drive).
8
Advice
The majority of participants were not offered any advice during their time in the study, however, where
advice was offered (26 participants), it could come from multiple sources. Some participants actively
sought information on whether they could drive (45 participants). The information given to these
participants varied and, overall, made little difference to whether they drove or not. Advice “not to drive”
from a doctor or plaster technician also seemed more influential in decisions not to drive, however, the
small sample size makes these conclusions tentative.
Just over half the participants (57) were unsure about the legality of driving in a cast with 17 being sure
it was legal and 37 being sure it was illegal. A similar pattern was found with regard to whether driving in
a cast was allowed by their insurance provider with 65 being unsure about this, 8 believing it was
allowed and 38 believing it was not allowed.
Driving Habits
The Driving Habits component of the questionnaire demonstrated two points of note, namely that older
participants significantly felt that driving helped to keep their mind active compared to younger
participants (t (107) =2.21; p<0.05) and that males were more likely to feel attached to driving (t (33)
=2.11; p<0.05).
Driver Risk
On the whole participants tended to show safe driver behaviour. The most frequently reported risky
behaviour being the realisation that they were driving faster than they thought and slowing down as a
result. There were significant differences between males and females; males were more likely to report
frequently engaging in risky behaviour with regards to feeling a 30mph speed limit should be 40mph
(t(35)=2.43; p<0.05), performing fast acceleration and deceleration if late for their destination
(t(109)=2.47; p<0.05) and risky overtaking in timely conditions (t(109)=3.58; p<0.01) and if late
(t(109)=1.43; p<0.05). Utilising a cluster analysis with squared Euclidean distance, two groups clearly
emerged amongst the participants. Group 1 (n=98) were a group who drove relatively safely and took
few risks; Group 2 (n=13), by contrast, were a relatively high risk group.
There were no significant differences between the variables on the Driver Risk Survey and whether
participants drove or not. However, using the groups generated by the cluster analysis, high risk takers
9
and drivers with high affect are much more likely to drive with their arm in a cast than would be found by
chance.
Effect of having an arm in a cast on travel behaviour
Participants reported that breaking their arm and having it in a cast reduced the miles they drove and
had some effect on reducing their cycling mileage (for those who cycled in a cast). There were large
increases in the use of trains, buses and walking, with some increase in taking lifts from friends and
family.
Questionnaires – Free Text Analysis
Free text in questionnaires was analysed for common themes. In the section ‘Why Drive?, five
categories were identified; the significance of their car, freedom from physical symptoms, the car as
essential (especially for daily responsibilities), deciding when it is safe to drive and making adjustments
to be able to drive. Participant’s reasons for not driving, fell into six categories; hindrance by physical
symptoms, being prevented by the cast in manoeuvring the controls, not really needing the car, being
told they should not drive, thinking it was illegal and feeling unsafe or not prepared to take the risk to
drive in a cast.
Qualitative Analysis of Interviews
Fourteen telephone interviews were transcribed and subject to a three tier process of analysis
comprising individual reviews, paired reviews and, finally, team reviews. The five themes identified by
this process were similar to the themes identified in the free text section of the questionnaire; the
significance of the car to the participant, reasons for driving or not driving, the availability of alternative
transport and the influence of any advice given. Participants also mentioned the influence of expense,
such as the cost of taxis.
10
DISCUSSION
Gender, age, hand injured and mechanism of injury
Our female to male ratio was 3.6:1.Postmenopausal women were found to be two to three times more
likely to sustain a fracture of the distal radius than men reaching a maximum incidence between 60 and
70 years. The age specific incidence in our study, however, does not reflect the typical bimodal
distribution of younger men and older women, possibly because our focus is on adults who are drivers,
and this excludes younger men (15-17 years) who are a key group in the incidence of distal radial
fracture. We found that the left hand was most commonly injured (66) with the right hand injured 43
times and 2 patients injured both hands. Seventy percent of participants sustained their injury from a
standing height or less.
Prevalence
18% of participants drove in their cast. Previous European studies report a prevalence of between 9
and 15% and, although our finding is slightly higher, it accords with other European studies, in
comparison with the high prevalence, 50%, of patients who drove in their cast in an Australian study
(Kalamaris et al. 2006).
Drivers
We found that males were significantly more likely to drive in a plaster cast than females and drove
more miles on average per week. Other factors such as age, duration of licence and miles driven were
all increased in our driving population compared with non-drivers but the difference was not significant.
Altered driving behaviour
Several authors have assessed driver performance in a cast and found varying degrees of effect. The
quality of this research is variable as indicated in the literature review. Most of our driving participants
stated that they did not feel that the cast made a difference to their driving behaviour and tended to
state they thought it was safe to drive in a cast. Despite admittance to feeling uncomfortable, this was
not perceived as hampering their observation, skills or safety. Compensatory behaviours occurred,
11
such as switching to an automatic car or choosing a route to avoid difficult turns. Non-drivers perceived
that their performance would be altered, due to the cast impairing adequate grip or because of pain,
and therefore chose not to drive.
Advice
The low level of advice being either offered or sought in this study shows that driving advice is not a
routine part of practice in the orthopaedic setting or the patients’ prime concern in the clinic. Where it
was offered, our study showed high adherence to the advice offered by doctors and plaster technicians.
Therefore, if advice is provided by healthcare professionals, it needs to be consistent, truthful and
timely, otherwise patients could be making a choice based on insufficient information.
Despite being given advice, some participants chose to ignore it and eight participants drove even
though they were advised not to. Not all participants subsequently felt that they had made the right
decision. Timely advice by healthcare professionals could prevent patients regretting decisions made
and facilitate informed decision making.
Legality and insurance
Since it is not illegal to drive in a cast in Britain, an unqualified “just say no” response from healthcare
professionals means that some patients who could be driving are prevented from doing so. Our
participants showed a lack of knowledge about insurance and driving in a cast. Twenty-one participants
were driving, so some of these were unclear about their insurance cover, which could have made them
illegal. When seeking their insurer’s permission, however, patients can get caught in a loop where
insurers ask for the doctors’ permission and doctors ask for the insurer’s permission.
In general healthcare professionals are not trained to assess patient’s driving ability and this means
driving advice should be restricted to the parameters of the professionals practice such as medical and
biomechanical concerns only.
In view of the possible liability issues, it seems reasonable to suggest that any driving advice given
should be recorded in the patients’ notes. To ensure driving advice is consistent, truthful and timely
some form of printed advice could be provided.
12
CONCLUSION
We found that 18% of participants with below-elbow casts for distal radial fracture drove in their cast,
and that men were significantly more likely to do so. These drivers were more likely to be in high affect
and high risk taker groups and took compensatory action when driving, such as driving less often than
normal, switching to an automatic car or using an alternative route. Our drivers chose to drive because
they felt their car use was essential to their daily functioning in areas such as work or fulfilling their
personal and social responsibilities. Non-drivers perceived that their performance would be affected by
either physical symptoms or lack of flexibility such as the mechanical blockage of the cast on their grip.
Drivers and non-drivers perceived that using alternative transport had both beneficial and negative
connotations. When advice was given, doctors and plaster technicians in particular had a high advice
adherence rate, if they told participants not to drive then it was more likely that they would not.
RECOMMENDATIONS FOR PRACTICE
Several recommendations for practice emerge.
Healthcare professionals should:
Indicate medical reasons for not driving, such as medication or pain effects, weakness and
restricted motion of the wrist or upper limb.
Indicate technical reasons for not driving such a mechanical blockage to grip on the steering wheel
or gears, or loss of secondary positional adjustment of the arm by the proximity of the door.
Only give advice within their scope of practice.
Point out that driving in a cast, while not always illegal, is not necessarily wise, as driver response
to hazards is affected and the presence of a cast could be considered by the Crown Prosecution
Service as contributing to dangerous driving.
Instruct their patients to inform their insurance company if they intend to drive in their cast as
driving without valid insurance is illegal in Great Britain.
Give consistent, truthful and timely advice to all patients as, in the interests of informed practice, all
patients should receive evidence based driving advice.
Document any driving advice given, as all aspects of a patient’s management should be recorded
for medico-legal reasons.

13
In addition, healthcare professionals could indicate local alternatives to driving, such as local resources
for buses, trains, car sharing etc. This would require healthcare staff having knowledge of such services
and provision.
14
Chapter 1
1.0 INTRODUCTION
The National Travel Survey (2012) indicates that, in the United Kingdom (UK), 36 million people hold
driving licences, making on average 610 car trips and covering a distance of 5,219 miles per person per
year (Department for Transport (DfTa, 2013). Driving is, however, a hazardous activity and, in the year
up to March 2013, there were 195,723 road casualties with 119,708 car occupant casualties, of whom
801 people were killed (DfTb, 2013). Driver error is believed to be either a sole or a contributing factor
in 95% of all road traffic accidents (DfTb, 2013).
The Highway Code (DfT, 2014) states that individual drivers are responsible for “making sure they are
fit to drive” and that they “MUST [sic] report to the Driver Vehicle Licensing Agency (DVLA) any health
condition likely to affect driving” (DfT, 2014, section 89-102). However the DVLA do not identify the
presence of a cast as a notifiable condition and drivers are not required to disclose disabilities of less
than 3 months duration (DVLAa, 2014). If a person is unsure about their fitness to drive, they can
telephone the DVLA’s Drivers Medical Group for advice (DVLAb, 2014). The Crown Prosecution
Service publication, “Policy for Prosecuting Cases of Bad Driving,” however, lists driving with impaired
ability “such as having an arm or leg in plaster” (Crown Prosecution Service, 2014), as an example of
driving dangerously/carelessly and therefore cast wearing drivers could be prosecuted following a road
traffic incident. There is evidence to suggest that patients do drive in their upper limb casts (Kennedy et
al, 2006; Kalamaras et al, 2006; Edwards et al, 2009), and while not illegal in Britain there is debate
about whether an arm in a cast affects driver reactions (Blair et al, 2002; Kalamaras et al, 2006;
Gregory et al, 2009; Chong et al, 2010) and there is also discussion about what is the best advice to
give patients from a medico-legal perspective (Nunez and Giddins, 2004; Von Arx et al, 2004).
15
Chapter 2
2.0 OBJECTIVES
This research sets out to explore the factors that influence the resumption of driving following
immobilisation in a below–elbow cast for a distal radial fracture and to explain these influences both
conceptually and contextually. This is so that the actuality of patient’s practice and choices can inform
the development of standardised advice that may guard against risk taking driving behaviours.
Our objectives are to:
Understand the actuality of the driving experience for patients with below-elbow casts
Explore motivational factors for driving in a below-elbow cast and drivers conceptualisation of
associated risk taking
16
Chapter 3
3.0 LITERATURE REVIEW
3.1 Literature Search
Primary literature was identified through exploration of the following databases; AMED, BNI, CINAHL,
Medline and PsycInfo. Searches were carried out using the search terms “wrist or distal radial” and
“fracture”, “driving or drive”, “cast or plaster”, “immobilisation”. Combining searches and removing
duplicates identified 16 papers in the English language, published between 1992 and 2010. Five areas
of current research was identified namely; (1) the prevalence of driving in a cast, (2) the effect of a cast
on driver performance, (3) the advice offered to patients in a cast, (4) current driving regulations with
regard to driving in a cast and (5) factors that influence driving behaviour
3.2 Literature Review
3.2.1. Prevalence
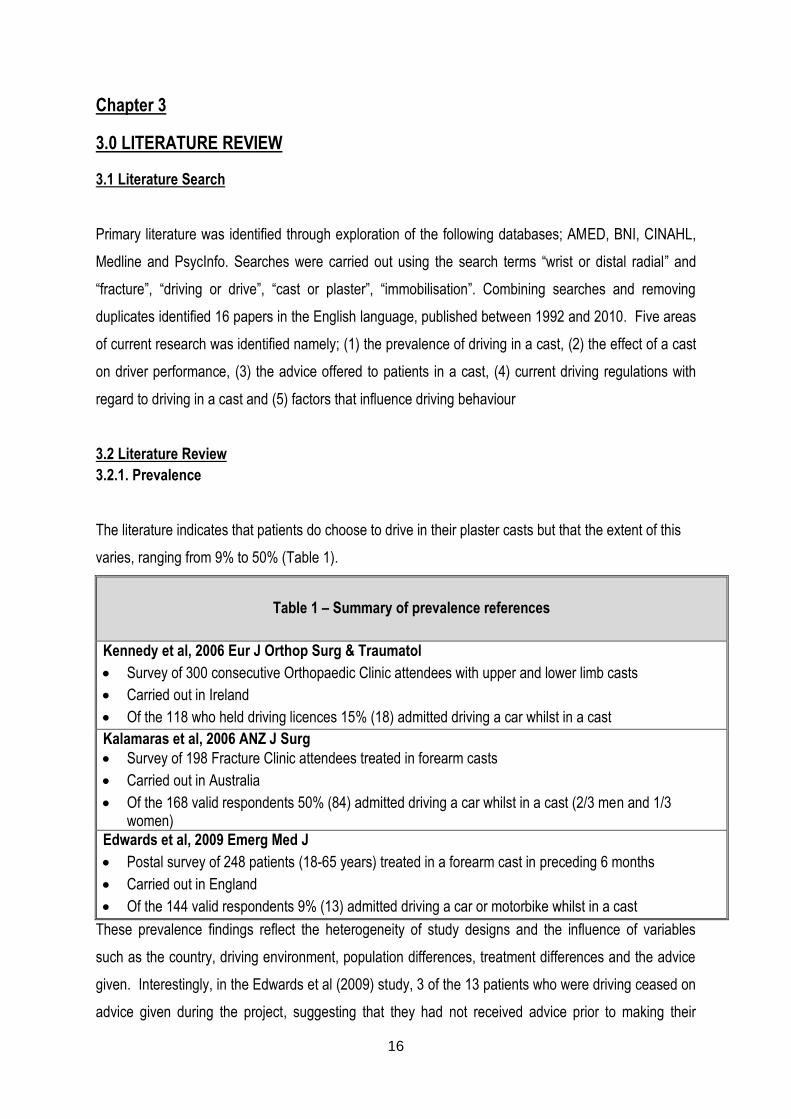
The literature indicates that patients do choose to drive in their plaster casts but that the extent of this
varies, ranging from 9% to 50% (Table 1).
Table 1 – Summary of prevalence references
Kennedy et al, 2006 Eur J Orthop Surg & Traumatol
Survey of 300 consecutive Orthopaedic Clinic attendees with upper and lower limb casts
Carried out in Ireland
Of the 118 who held driving licences 15% (18) admitted driving a car whilst in a cast
Kalamaras et al, 2006 ANZ J Surg
Survey of 198 Fracture Clinic attendees treated in forearm casts
Carried out in Australia
Of the 168 valid respondents 50% (84) admitted driving a car whilst in a cast (2/3 men and 1/3 women)
Edwards et al, 2009 Emerg Med J
Postal survey of 248 patients (18-65 years) treated in a forearm cast in preceding 6 months
Carried out in England
Of the 144 valid respondents 9% (13) admitted driving a car or motorbike whilst in a cast
These prevalence findings reflect the heterogeneity of study designs and the influence of variables
such as the country, driving environment, population differences, treatment differences and the advice
given. Interestingly, in the Edwards et al (2009) study, 3 of the 13 patients who were driving ceased on
advice given during the project, suggesting that they had not received advice prior to making their
17
return to driving decision. The east coast Australian study by Kalamaras et al (2006) found that the two
largest groups of drivers were men aged 17-25 years (30%) and women aged 56-65 years (9%). This
reflects the incidence of upper limb trauma in younger men and older women (O’Neill et al, 2001). The
large number of patients driving in this study in comparison to the other two studies may reflect cultural,
regional and socioeconomic differences in the west coast Australian population.
3.2.2. Performance
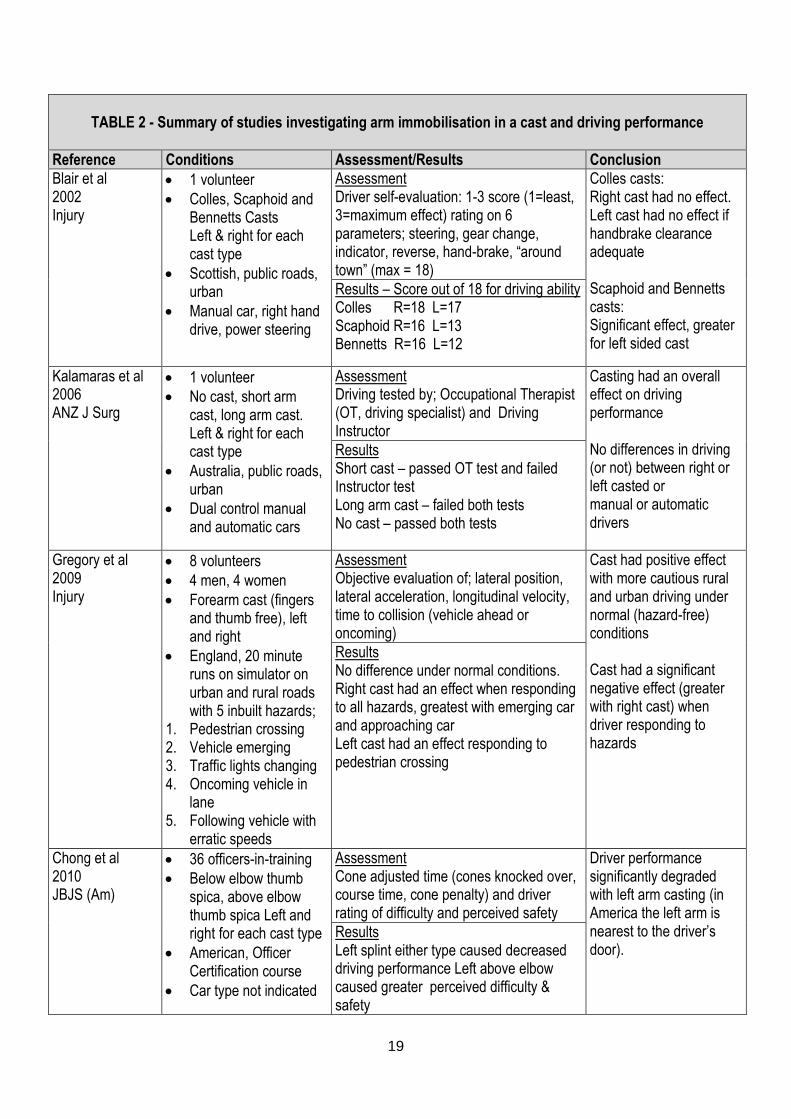
The extent to which having an arm in a cast affects driver performance is unclear. As shown in Table 2
(p.6) several studies indicate that the presence of forearm casts on healthy volunteers does affect
driving performance (Blair et al, 2002; Kalamaras et al, 2006; Gregory et al 2009; Chong et al, 2010).
No studies were found to have investigated patient participants, so the effects of pain, secondary
stiffness, or confidence after injury have not been evaluated. Once again, the heterogeneity of the
studies in terms of participants, casts used, performance conditions and the methods of evaluation of
driver performance, challenge direct cross comparison of the data.
The study by Blair et al, 2002 is limited by various forms of bias because a single driver subjectively
assessed their own skill as they carried out all the tests thus becoming progressively more familiar with
driving in a cast and preventing any order variation in the type of cast or side of limb tested. The
authors conclude that the Bennett’s and Scaphoid casts had a “significant effect on driving ability” while
the Colles cast did not. Review of the results, however, shows that the effect of Bennett’s and
Scaphoid casts was only apparent on the left hand. The right hand scores vary by only two points and
there is no indication how this differentiates between ‘no effect’ and a ‘significant effect’.
In a more comprehensive study, Kalamaras et al (2006) found that without a cast the volunteer driver
passed all driving tests, but that with casts the driver failed all or some of the tests depending on the
assessor. Instructor fail was due to their requirement that both hands are kept on the steering wheel
unless changing gear which was impossible when in a cast. The evaluation was according to driving
test standards which make the results more reliable than Blair et al (2002) though these are not
presented or subject to analysis. There may also have been subjective bias due to the two driving
assessors’ different backgrounds; the Occupational Therapist being more used to evaluating disability
and the driving instructor more focused on driving technique. There is still the problem of having only
one participant with the inherent issues of learning effects with each subsequent plaster type.
18
Gregory et al (2009) found that forearm immobilisation led to more cautious driving under normal
conditions in terms of driving more slowly, adjusting speed and lateral road position. This may be due to
the drivers perceiving the cast as an applied risk to their normal driving risk behaviour and their taking
compensatory action. On responding to the 5 hazards included there were significantly less effective
driving responses in terms of distance from the kerb, rate of change in lane position, speed, rate of
speed change and proximity to obstacles in the driver’s own or oncoming lane. These effects were
more apparent with right arm immobilisation. Gregory et al (2009) propose two theories to explain this
right sided effect. Firstly, they suggest that right handed drivers driving a right hand vehicle will
experience greater disruption to their learned automatic driving responses. Alternatively, they suggest
this may be due to the different roles of the cerebral hemispheres so that the effect will be more
apparent on one side of the body.
The study by Chong et al (2010) had both objective and subjective assessment criteria. The main
weakness of this study is that it does not reflect normal driving conditions or normal drivers (in terms of
standard driving training) and hence the validity and transferability to real-life is low. There is also no
control condition to determine what driver behaviour was like with no immobilisation.
All these studies involved healthy young volunteers. Recommendations for advice for patients in casts
would therefore need to consider the additional effects of injury. These include pain, muscle
deconditioning, secondary stiffness, anxiety, the effects of treatments such as analgesia as well as the
compounding effects of aging, such as slowed motor function, altered proprioception, weakness,
decreased endurance, visual disturbance and associated medical conditions. There is some evidence
that the steering wheel hand is the most effected by cast immobilisation. Chong et al (2010) postulate
that this is because the steering wheel hand is also nearest to the driver’s door and therefore has less
space to make proximal positional compensations for distal immobilisation.
19
TABLE 2 - Summary of studies investigating arm immobilisation in a cast and driving performance
Reference Conditions Assessment/Results Conclusion
Blair et al 2002 Injury
1 volunteer
Colles, Scaphoid and Bennetts Casts Left & right for each cast type
Scottish, public roads, urban
Manual car, right hand drive, power steering
Assessment Driver self-evaluation: 1-3 score (1=least, 3=maximum effect) rating on 6 parameters; steering, gear change, indicator, reverse, hand-brake, “around town” (max = 18)
Colles casts: Right cast had no effect. Left cast had no effect if handbrake clearance adequate Scaphoid and Bennetts casts: Significant effect, greater for left sided cast
Results – Score out of 18 for driving ability Colles R=18 L=17 Scaphoid R=16 L=13 Bennetts R=16 L=12
Kalamaras et al 2006 ANZ J Surg
1 volunteer
No cast, short arm cast, long arm cast. Left & right for each cast type
Australia, public roads, urban
Dual control manual and automatic cars
Assessment Driving tested by; Occupational Therapist (OT, driving specialist) and Driving Instructor
Casting had an overall effect on driving performance No differences in driving (or not) between right or left casted or manual or automatic drivers
Results Short cast – passed OT test and failed Instructor test Long arm cast – failed both tests No cast – passed both tests
Gregory et al 2009 Injury
8 volunteers
4 men, 4 women
Forearm cast (fingers and thumb free), left and right
England, 20 minute runs on simulator on urban and rural roads with 5 inbuilt hazards;
1. Pedestrian crossing 2. Vehicle emerging 3. Traffic lights changing 4. Oncoming vehicle in
lane 5. Following vehicle with
erratic speeds
Assessment Objective evaluation of; lateral position, lateral acceleration, longitudinal velocity, time to collision (vehicle ahead or oncoming)
Cast had positive effect with more cautious rural and urban driving under normal (hazard-free) conditions Cast had a significant negative effect (greater with right cast) when driver responding to hazards
Results No difference under normal conditions. Right cast had an effect when responding to all hazards, greatest with emerging car and approaching car Left cast had an effect responding to pedestrian crossing
Chong et al 2010 JBJS (Am)
36 officers-in-training
Below elbow thumb spica, above elbow thumb spica Left and right for each cast type
American, Officer Certification course
Car type not indicated
Assessment Cone adjusted time (cones knocked over, course time, cone penalty) and driver rating of difficulty and perceived safety
Driver performance significantly degraded with left arm casting (in America the left arm is nearest to the driver’s door).
Results Left splint either type caused decreased driving performance Left above elbow caused greater perceived difficulty & safety
20
3.2.3. Advice
It would seem that driving advice is desired by patients. Edwards et al (2009) found that 98% of
patients with wrist fractures wanted written advice from the fracture clinic. However, it is difficult for
healthcare staff to know what to advise patients, firstly because the regulations are not definitive, and
secondly because there is no consensus on standard return-to-driving recommendations as indicated
by numerous studies from around the world; UK (King et al,1992; Nunez and Giddins, 2004; Von Arx et
al, 2004; Edwards et al, 2009); USA (Chen et al, 2008; Chong, 2010); Australia (Kalamaras et al,2006);
and Ireland (Kennedy et al, 2006).
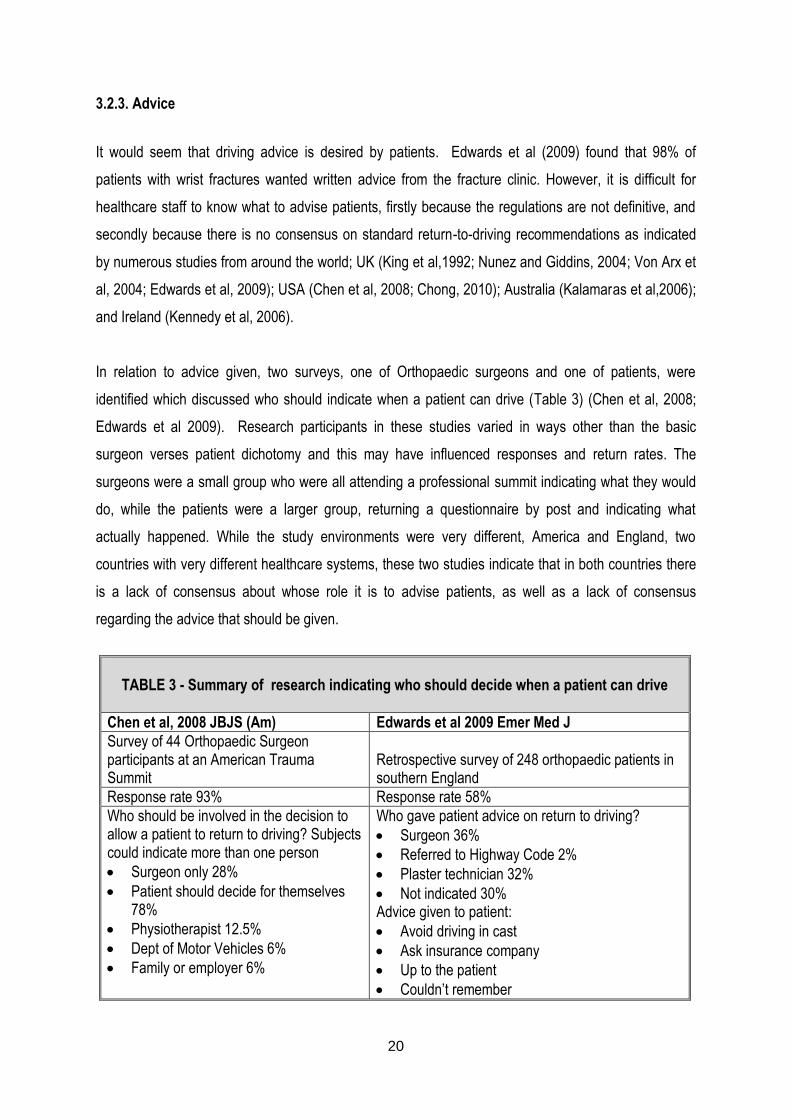
In relation to advice given, two surveys, one of Orthopaedic surgeons and one of patients, were
identified which discussed who should indicate when a patient can drive (Table 3) (Chen et al, 2008;
Edwards et al 2009). Research participants in these studies varied in ways other than the basic
surgeon verses patient dichotomy and this may have influenced responses and return rates. The
surgeons were a small group who were all attending a professional summit indicating what they would
do, while the patients were a larger group, returning a questionnaire by post and indicating what
actually happened. While the study environments were very different, America and England, two
countries with very different healthcare systems, these two studies indicate that in both countries there
is a lack of consensus about whose role it is to advise patients, as well as a lack of consensus
regarding the advice that should be given.
TABLE 3 - Summary of research indicating who should decide when a patient can drive
Chen et al, 2008 JBJS (Am) Edwards et al 2009 Emer Med J
Survey of 44 Orthopaedic Surgeon participants at an American Trauma Summit
Retrospective survey of 248 orthopaedic patients in southern England
Response rate 93% Response rate 58%
Who should be involved in the decision to allow a patient to return to driving? Subjects could indicate more than one person
Surgeon only 28%
Patient should decide for themselves 78%
Physiotherapist 12.5%
Dept of Motor Vehicles 6%
Family or employer 6%
Who gave patient advice on return to driving?
Surgeon 36%
Referred to Highway Code 2%
Plaster technician 32%
Not indicated 30% Advice given to patient:
Avoid driving in cast
Ask insurance company
Up to the patient
Couldn’t remember
21
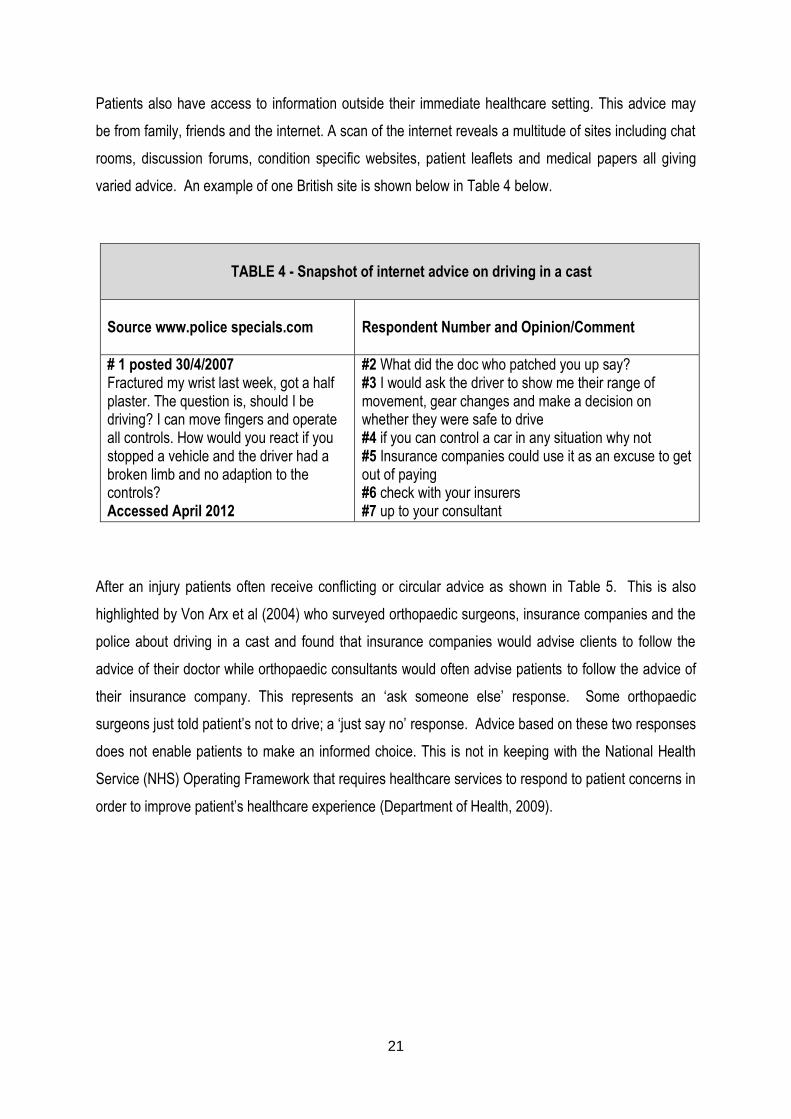
Patients also have access to information outside their immediate healthcare setting. This advice may
be from family, friends and the internet. A scan of the internet reveals a multitude of sites including chat
rooms, discussion forums, condition specific websites, patient leaflets and medical papers all giving
varied advice. An example of one British site is shown below in Table 4 below.
TABLE 4 - Snapshot of internet advice on driving in a cast
Source www.police specials.com
Respondent Number and Opinion/Comment
# 1 posted 30/4/2007 Fractured my wrist last week, got a half plaster. The question is, should I be driving? I can move fingers and operate all controls. How would you react if you stopped a vehicle and the driver had a broken limb and no adaption to the controls? Accessed April 2012
#2 What did the doc who patched you up say? #3 I would ask the driver to show me their range of movement, gear changes and make a decision on whether they were safe to drive #4 if you can control a car in any situation why not #5 Insurance companies could use it as an excuse to get out of paying #6 check with your insurers #7 up to your consultant
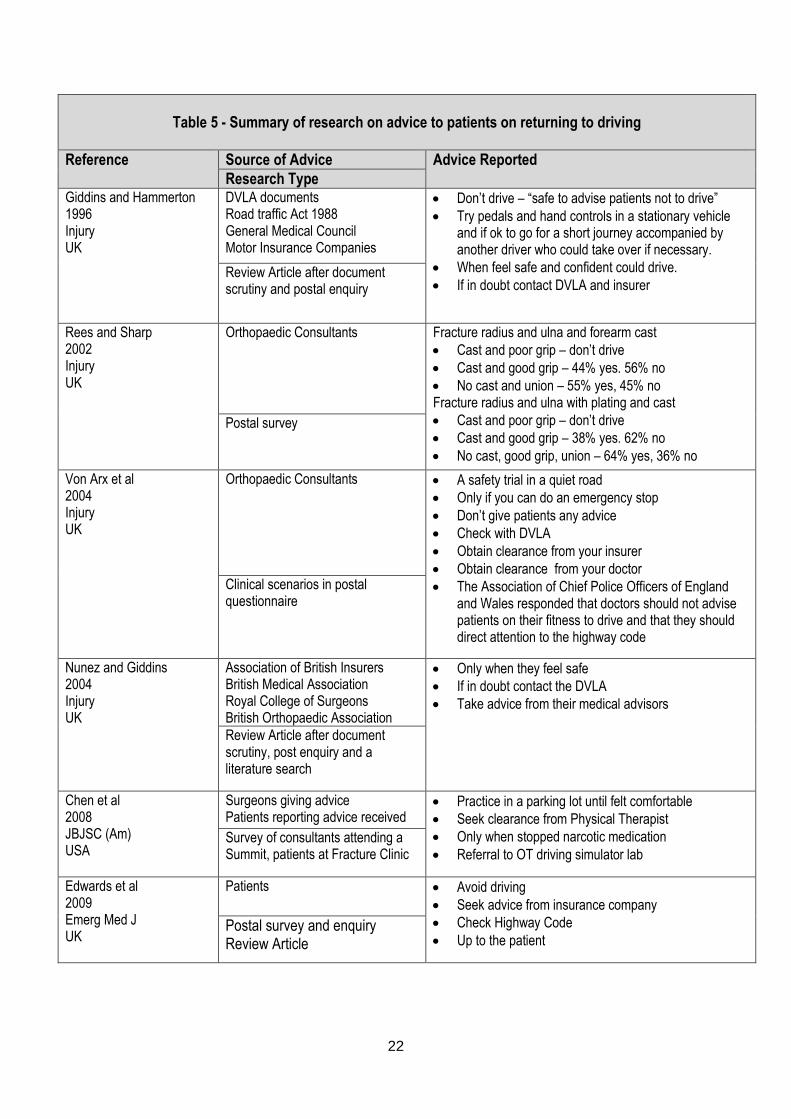
After an injury patients often receive conflicting or circular advice as shown in Table 5. This is also
highlighted by Von Arx et al (2004) who surveyed orthopaedic surgeons, insurance companies and the
police about driving in a cast and found that insurance companies would advise clients to follow the
advice of their doctor while orthopaedic consultants would often advise patients to follow the advice of
their insurance company. This represents an ‘ask someone else’ response. Some orthopaedic
surgeons just told patient’s not to drive; a ‘just say no’ response. Advice based on these two responses
does not enable patients to make an informed choice. This is not in keeping with the National Health
Service (NHS) Operating Framework that requires healthcare services to respond to patient concerns in
order to improve patient’s healthcare experience (Department of Health, 2009).
22
Table 5 - Summary of research on advice to patients on returning to driving
Reference Source of Advice Advice Reported
Research Type Giddins and Hammerton 1996 Injury UK
DVLA documents Road traffic Act 1988 General Medical Council Motor Insurance Companies
Don’t drive – “safe to advise patients not to drive”
Try pedals and hand controls in a stationary vehicle and if ok to go for a short journey accompanied by another driver who could take over if necessary.
When feel safe and confident could drive.
If in doubt contact DVLA and insurer Review Article after document scrutiny and postal enquiry
Rees and Sharp 2002 Injury UK
Orthopaedic Consultants Fracture radius and ulna and forearm cast
Cast and poor grip – don’t drive
Cast and good grip – 44% yes. 56% no
No cast and union – 55% yes, 45% no Fracture radius and ulna with plating and cast
Cast and poor grip – don’t drive
Cast and good grip – 38% yes. 62% no
No cast, good grip, union – 64% yes, 36% no
Postal survey
Von Arx et al 2004 Injury UK
Orthopaedic Consultants A safety trial in a quiet road
Only if you can do an emergency stop
Don’t give patients any advice
Check with DVLA
Obtain clearance from your insurer
Obtain clearance from your doctor
The Association of Chief Police Officers of England and Wales responded that doctors should not advise patients on their fitness to drive and that they should direct attention to the highway code
Clinical scenarios in postal questionnaire
Nunez and Giddins 2004 Injury UK
Association of British Insurers British Medical Association Royal College of Surgeons British Orthopaedic Association
Only when they feel safe
If in doubt contact the DVLA
Take advice from their medical advisors
Review Article after document scrutiny, post enquiry and a literature search
Chen et al 2008 JBJSC (Am) USA
Surgeons giving advice Patients reporting advice received
Practice in a parking lot until felt comfortable
Seek clearance from Physical Therapist
Only when stopped narcotic medication
Referral to OT driving simulator lab Survey of consultants attending a Summit, patients at Fracture Clinic
Edwards et al 2009 Emerg Med J UK
Patients Avoid driving
Seek advice from insurance company
Check Highway Code
Up to the patient Postal survey and enquiry Review Article
23
The police response suggests that healthcare staff should be cautious about giving advice as “ it would
be difficult to be accurate as to their driving competency without personal knowledge of the patient’s
vehicle and their respective driving skills” and they conclude “you should limit your advice to referring
your patients to the Highway Code for direction and that should any patient be in doubt, that they
should contact their insurance company and take their advice regarding that liability” (Von Arx et al,
2004, p. 885). In conclusion, Von Arx et al (2004) state that it is “for the patient to decide whether they
are capable and the doctor should not advise” (p. 885). They also state that insurance companies
should not “seek clarification from the doctor as to whether the patient is fit to drive” (p. 886).
In a review article, Giddins and Hammerton (1996) identify four issues when attempting to clarify the
medical and legal implications of advice on driving after injury or operation:
1. The driver’s duty in law; where drivers are required to inform the relevant authority of any “relevant
or progressive disability”
2. The driver’s duty to notify their insurers; depending on their insurance policy terms
3. The doctor’s duty in law; to inform patients if they need to report a relevant disability
4. The doctor’s duty to the patient; to indicate to the patient whether driving would be detrimental to
their recovery
Nunez and Giddins (2004) reviewed and updated this work. They conclude that all drivers suffering
from any disability should contact the DVLA and that any driving advice should be recorded in patients’
notes. They counsel patients to try out the pedals, gears and steering in a stationary vehicle and then to
take the car on a short journey accompanied by another driver who could, if necessary, swap places
and take over the driving.
Several authors revealed that some patients do not seek advice before starting to drive. Edwards et al
(2009) found that 76% (10/13) of patients informed no one of their intention to drive. Chen et al (2007)
likewise identified that 36% did not consult with their doctor before starting to drive and that of the
patients not yet driving 18% did not intend to ask before starting to drive. The reason why patients did
not seek advice is not clear. Perhaps they either did not know they could ask, or they already knew
return to driving was their decision. Edwards et al (2009) found that 78% of survey respondents
(patients) thought it should be “illegal to drive any motorised vehicle whist in a plaster cast”, indeed, 3 of
the 13 respondents who drove in their forearm cast, thought it should be illegal. Some patients did not
want to take ‘no’ for an answer. Chen et al identified that 5% of patients felt that they had convinced
24
their physician to allow them to drive earlier than the physician would have preferred and 8% started
driving despite the opposition of their family or friends.
3.2.4. Regulations
Despite the fact that a cast appears to detrimentally effect driver performance, driving in a cast is not
illegal in Britain. The Criminal Prosecution Service (CPS) policy document on Cases of Dangerous
Driving however, lists driving with impaired ability, “such as having an arm or leg in plaster”, as an
example of driving dangerously/carelessly and states that a driver could therefore be prosecuted
following a road traffic incident (CPS, 2014). Rule 90 of the Highway Code states that a driver “must
make sure they are fit to drive” and that they “MUST [sic] report to the Driver Vehicle Licensing Agency
(DVLA) any health condition likely to affect driving” (DfT, 2014, section 89-102). The DVLA, however,
does not identify the presence of a cast as a notifiable condition and drivers do not have to disclose
disabilities of less than 3 months (DVLAa, 2014). If a person is unsure about their fitness to drive, they
can telephone the DVLA’s Drivers Medical Group who may respond immediately or suggest a formal
application and following due process a driver can expect a reply within 15 working days (DVLAb,
2014).
3.2.5. Driver Behaviour
Driving a motorised vehicle, even without a cast, is inherently hazardous and drivers must accept a
degree of risk (Musselwhite, 2006). Reason et al (1990) investigated driver risk behaviour and showed
that drivers exhibit two forms of aberrant driving behaviour, namely errors and violations. Errors were
defined as “the failure of planned actions to achieve their intended consequences” (Reason et al, 1990;
p. 1315) and can be split into two distinct psychological types, slips and lapses. Slips are defined as
“the unwitting deviation of action from intention” and lapses are defined as “departure of planned action
from some satisfactory path towards a desired goal” both of which are forms of attention and memory
failures that are embarrassing but do not impact driving safety (Reason et al, 1990; pp. 1315-6).
Violations are defined as “deliberate deviations from those practices believed necessary to maintain the
safe operation of a potentially hazardous system” (Reason et al, 1990; p. 1316). Lawton et al (1997)
extended the violations category by splitting it into two groups, aggressive violations and ordinary
violations, where ordinary violations are deliberate deviations from safe driving but without a specifically
aggressive aim. There is no research yet that investigates whether this identified driving behaviour is
altered by the presence of a forearm cast.
25
Chapter 4
4.0 METHODOLOGY
4.1. Purpose
The purpose of this study was to explore the factors influencing a patient when deciding whether or not
to drive in a below-elbow cast so that the actuality of patient’s practice and choices can be identified.
4.2 Research Design
A mixed methodological design was chosen and this involved;
(1) A battery of questionnaires (quantitative and qualitative components) with all participants
(2) Semi-structured interviews (qualitative) with an emergent sample of the participants
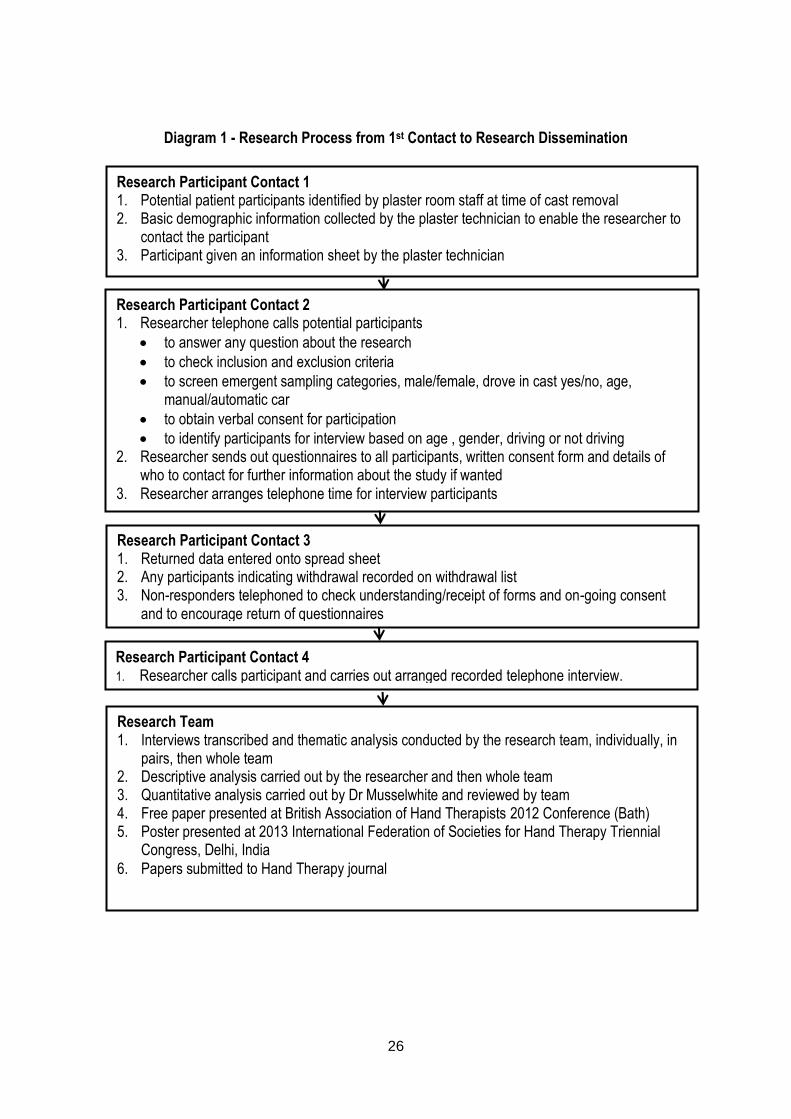
This design was used as the purpose of the research was to explore, with no preconceived hypothesis,
the factors influencing the resumption of driving by the participants. Diagram 1 (p. 13) outlines the
research process. This design did not alter the participants’ progression through the Trauma Clinic.
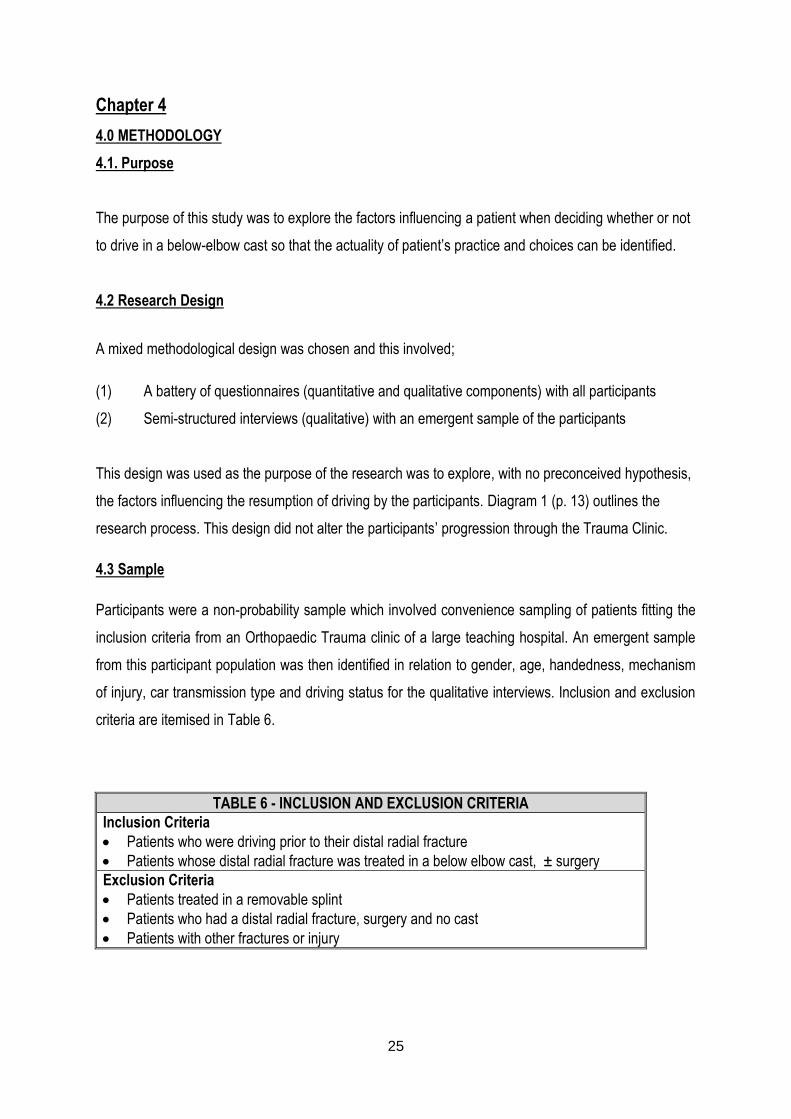
4.3 Sample
Participants were a non-probability sample which involved convenience sampling of patients fitting the
inclusion criteria from an Orthopaedic Trauma clinic of a large teaching hospital. An emergent sample
from this participant population was then identified in relation to gender, age, handedness, mechanism
of injury, car transmission type and driving status for the qualitative interviews. Inclusion and exclusion
criteria are itemised in Table 6.
TABLE 6 - INCLUSION AND EXCLUSION CRITERIA
Inclusion Criteria
Patients who were driving prior to their distal radial fracture
Patients whose distal radial fracture was treated in a below elbow cast, ± surgery
Exclusion Criteria
Patients treated in a removable splint
Patients who had a distal radial fracture, surgery and no cast
Patients with other fractures or injury
26
Diagram 1 - Research Process from 1st Contact to Research Dissemination
Research Participant Contact 1 1. Potential patient participants identified by plaster room staff at time of cast removal 2. Basic demographic information collected by the plaster technician to enable the researcher to
contact the participant 3. Participant given an information sheet by the plaster technician
Research Team 1. Interviews transcribed and thematic analysis conducted by the research team, individually, in
pairs, then whole team 2. Descriptive analysis carried out by the researcher and then whole team 3. Quantitative analysis carried out by Dr Musselwhite and reviewed by team 4. Free paper presented at British Association of Hand Therapists 2012 Conference (Bath) 5. Poster presented at 2013 International Federation of Societies for Hand Therapy Triennial
Congress, Delhi, India
6. Papers submitted to Hand Therapy journal
Research Participant Contact 2 1. Researcher telephone calls potential participants
to answer any question about the research
to check inclusion and exclusion criteria
to screen emergent sampling categories, male/female, drove in cast yes/no, age, manual/automatic car
to obtain verbal consent for participation
to identify participants for interview based on age , gender, driving or not driving 2. Researcher sends out questionnaires to all participants, written consent form and details of
who to contact for further information about the study if wanted 3. Researcher arranges telephone time for interview participants
Research Participant Contact 3 1. Returned data entered onto spread sheet 2. Any participants indicating withdrawal recorded on withdrawal list 3. Non-responders telephoned to check understanding/receipt of forms and on-going consent
and to encourage return of questionnaires
Participant given an information sheet Research Participant Contact 4 1. Researcher calls participant and carries out arranged recorded telephone interview.
27
4.4 Procedure and Tools
This study used combined methods; questionnaires, telephone interviews and field notes.
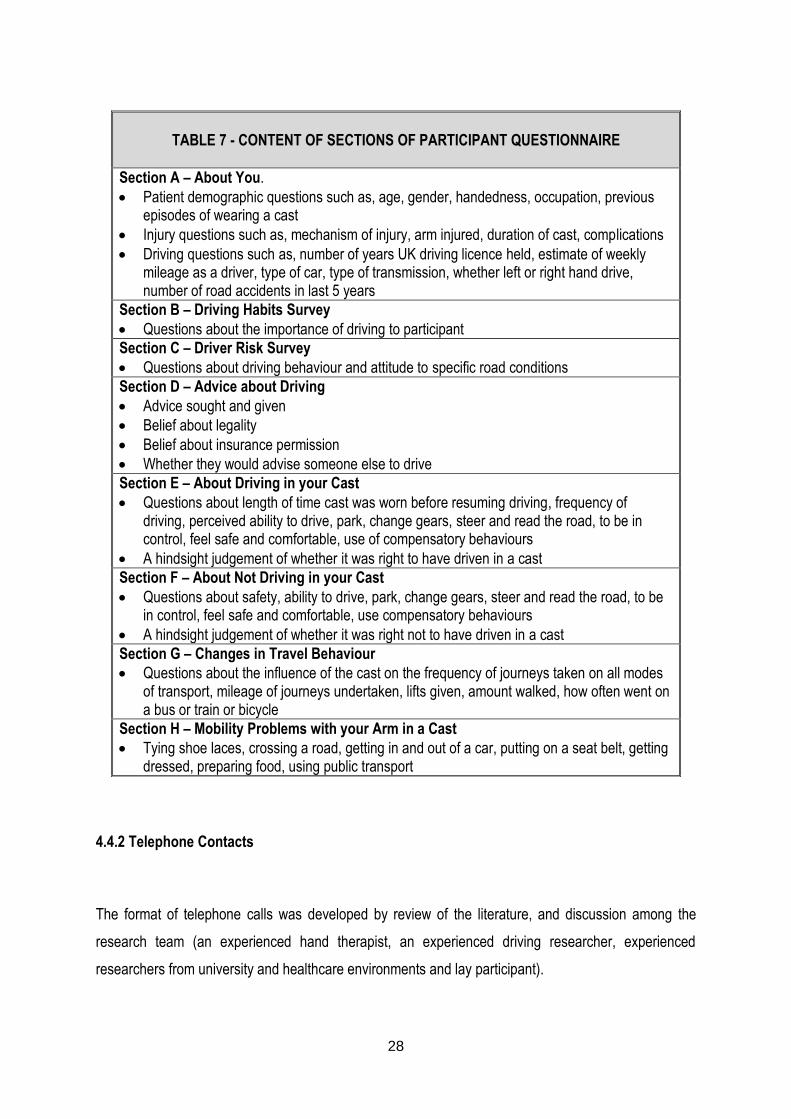
4.4.1 Questionnaire
The questionnaire had 8 sections (A-H as shown in Table 7; see Appendix 1 for complete
questionnaire) and was developed from review of the literature, the experience of the research steering
group and feedback from the Trust’s Patient Information/Questionnaire development team.
Questionnaire validity was enhanced by:
Developing the questionnaire from literature and research Steering Group experience
Approval by the Trust’s Patient Information Group
Pre-testing with 5 participants and making modifications on feedback
Desirability bias was avoided by reassurance that choosing to drive in a cast or choosing not to
drive in a cast was acceptable behaviour in order to encourage reporting of both behaviours
Supporting questionnaire trustworthiness by having the participants complete the questionnaire in
the environment where their choices were made, and where they were not face-to-face with the
interviewer
Supporting questionnaire return by provision of a stamped addressed envelope
28
4.4.2 Telephone Contacts
The format of telephone calls was developed by review of the literature, and discussion among the
research team (an experienced hand therapist, an experienced driving researcher, experienced
researchers from university and healthcare environments and lay participant).
TABLE 7 - CONTENT OF SECTIONS OF PARTICIPANT QUESTIONNAIRE
Section A – About You.
Patient demographic questions such as, age, gender, handedness, occupation, previous episodes of wearing a cast
Injury questions such as, mechanism of injury, arm injured, duration of cast, complications
Driving questions such as, number of years UK driving licence held, estimate of weekly mileage as a driver, type of car, type of transmission, whether left or right hand drive, number of road accidents in last 5 years
Section B – Driving Habits Survey
Questions about the importance of driving to participant
Section C – Driver Risk Survey
Questions about driving behaviour and attitude to specific road conditions
Section D – Advice about Driving
Advice sought and given
Belief about legality
Belief about insurance permission
Whether they would advise someone else to drive
Section E – About Driving in your Cast
Questions about length of time cast was worn before resuming driving, frequency of driving, perceived ability to drive, park, change gears, steer and read the road, to be in control, feel safe and comfortable, use of compensatory behaviours
A hindsight judgement of whether it was right to have driven in a cast
Section F – About Not Driving in your Cast
Questions about safety, ability to drive, park, change gears, steer and read the road, to be in control, feel safe and comfortable, use compensatory behaviours
A hindsight judgement of whether it was right not to have driven in a cast
Section G – Changes in Travel Behaviour
Questions about the influence of the cast on the frequency of journeys taken on all modes of transport, mileage of journeys undertaken, lifts given, amount walked, how often went on a bus or train or bicycle
Section H – Mobility Problems with your Arm in a Cast
Tying shoe laces, crossing a road, getting in and out of a car, putting on a seat belt, getting dressed, preparing food, using public transport
29
All participants were contacted by telephone at participant Contact 2 as shown in Diagram 1. The
telephone call followed a semi-structured format lasting 5-10 minutes. The purpose of Contact 2 was to
answer any questions about the research, check that participants fitted the inclusion criteria, screen for
emergent sampling categories, and obtain verbal consent.
Participants selected for a telephone interview were contacted as participant Contact 4 as shown in
Diagram 1. The call followed a thematic semi-structured format lasting 30-60 minutes. The purpose of
these telephone interviews was to gather information about the actualities of patients’ resumption of
their driving experience.
Interview validity was enhanced by:
Piloting the interview schedule with 5 participants and redrafting through two cycles
Emergent sampling of the interview participants to ensure both population uniformity and diversity.
Feedback from the screening call (Contact 2) was used to identify the interview participants. Notes
were taken during the call and they were recorded by the researcher on the participants’ ‘Ist Call’
form and retained
Ensuring the temporal stability of the data by taping the telephone interviews
Enhancing self-report accuracy by timing the interviews to the first 4 weeks after cast removal. This
enabled accurate recall. Feedback from the screening and consent call enabled the researcher to
book the interview call with the participant. Participants who drove in a cast were interviewed within
a week and participants not yet driving were called within the next three weeks.
Desirability bias was avoided by the researchers being independent of the participants clinical team
and by reassurance that choosing to drive in a cast or choosing not to drive in a cast was
acceptable behaviour
Interviewees were in their own environment and were not face-to-face with the interviewer in order
to encourage reporting of potentially risky behaviour
Reporting of potentially risky behaviour was encouraged by the use of retrospective self-report
4.4.3 Field Notes
Field notes were kept by the researcher in several locations which included:
The first call sheet used during participant Contact 2
The telephone interview sheet used during Contact 4
30
In a research note book where comments or discussions about the research were documented
retrospectively
These notes were collated and coded. The initials FN are attached to all field note evidence used to
support the themes identified through data analysis.
4.5 Data Analysis
This research produced both qualitative and quantitative data as a result of the mixed methods design.
Thus analysis comprised descriptive analysis, statistical analysis and thematic analysis.
4.5.1 Identification of data
Questionnaire data was entered onto the master spread sheet under each participant’s unique
identifier
Transcription of the interviews with coding of each speaker and of discussion
Collation of the field notes with coding of source and comments made
4.5.2 Descriptive analysis of questionnaire data
Excel spread sheet formulas were used to count factual data in the questionnaires
4.5.3 Quantitative analysis of questionnaire data
Descriptive statistics were used to explore background information about the sample, including
how breaking an arm and having it in a cast effected travel behaviour
Inferential analysis was conducted to identify the characteristics of those who drove compared to
those that did not drive with their arm in a cast. This included examining risk taking behaviour
using Musselwhite’s (2006) Driver Risk Survey (Section C of questionnaire) and affect based on
Ellaway’s et al (2003) Driver Habit Survey (Section B of questionnaire).
Cluster analysis with squared Euclidian distance was carried out to place people into categories
based on their answers to Section B, from the Driver Habit Survey (Ellaway et al., 2003), and
Section C, the Driver Risk Survey (Musselwhite, 2006). In this way, people with similar
31
backgrounds to affect and risk could be ascertained to determine whether one of the groups was
more or less likely to drive in a cast.
4.5.4 Qualitative analysis of questionnaire data
Free text sections of the questionnaires were entered onto a spread sheet
These free text comments were coded using the patient’s unique identifier
These short sections were screened for common themes and unique comments
4.5.5 Qualitative analysis of the interview data
Individual reading of the transcribed interviews for key subject areas to be identified
Paired reading and identification of common themes
Research team group reading of themes and identification of key concepts
Researcher identification of supporting quotes for each concept
Research team group discussion of final selections
4.5.6 Qualitative rigor was controlled by:
Coding agreement was subject to inter-rater checking
Relevance is strong as the study captured information from the participants within the DVLA’s
three month window when drivers do not have to report temporary disabilities
Ethical concerns, such as the researcher finding a participant to be driving when they were
perceived unsafe was avoided by using retrospective self-report
32
5.0 FINDINGS
5.1 Background details
Completed questionnaires provided background details on the participants, their usual travel behaviour
(prior to breaking their arm), details of their fracture and advice they sought.
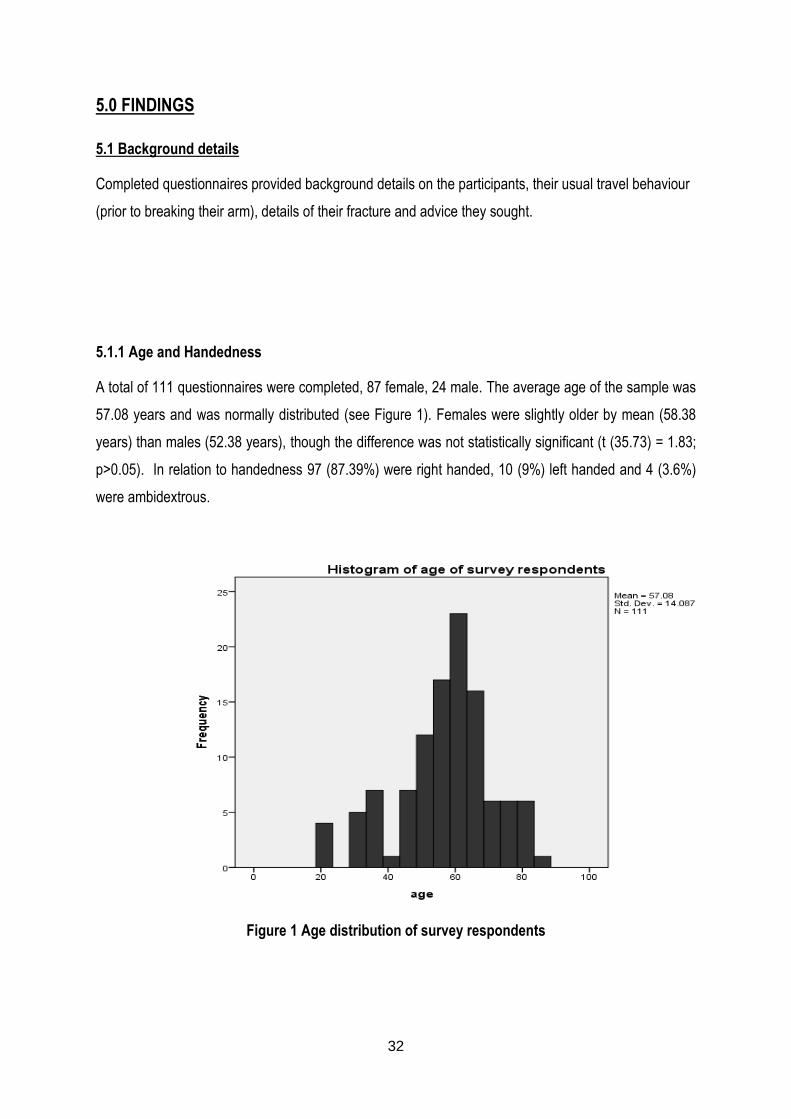
5.1.1 Age and Handedness
A total of 111 questionnaires were completed, 87 female, 24 male. The average age of the sample was
57.08 years and was normally distributed (see Figure 1). Females were slightly older by mean (58.38
years) than males (52.38 years), though the difference was not statistically significant (t (35.73) = 1.83;
p>0.05). In relation to handedness 97 (87.39%) were right handed, 10 (9%) left handed and 4 (3.6%)
were ambidextrous.
Figure 1 Age distribution of survey respondents
33
5.1.2 Mechanism of Injury and Hand Injured
The majority of patients (77) were injured in a fall from, or lower than, standing height and 17 were
injured in a fall from greater than standing height. Other mechanisms of injury included 10 from sporting
activity, 2 from road traffic accidents and 5 were from other causes (dancing, work, pushed over, not
specified). The left hand was most commonly injured (n=66; 59.46%). The right hand was injured 43
times (38.74%) and 2 patients injured both hands (1.81%). Participants had their casts on for between
one and twelve weeks with the median time being 6 weeks.
5.1.3 Car Type and Primary Car Use
The majority of participants had manual cars (97) while 14 had an automatic car. All but one participant
had right hand drive cars. The most common reason stated for using their car was domestic/social
reasons (63) with work cited second (45). A total of 19 participants did not indicate the primary use of
their car selecting either “other” but not specifying, or selecting “all”.
5.1.4 Duration of licence, miles driven and age
The sample had held a driver licence for an average of 32.62 years. On average, the sample drove
82.62 miles a week in a typical week, though distribution was skewed more to the lower number of
miles. Males drove significantly more miles (139.58 miles/week) on average per week than females
(67.72 miles/week) (t(109)=3.57; p<0.01). There was a significant negative correlation between age
and miles driven per typical week (r=-190; n=111; p<0.05), the younger the driver, the more miles they
drove.
5.1.5 Driving in a Cast
Twenty-one participants chose to drive while in their cast with 90 abstaining, representing 18% of the
study population. These twenty-one included the youngest participant (21 years) and the oldest
participant (85 years). 12 drivers were female and 9 were male, indicating the men 9 of the 24 (37.5%)
male participants drove, compared to only 12 of the 87 (13.8%) female participants. A chi-squared test
shows this is a significant difference; males are significantly more likely than females to drive in a
plaster cast (x2=6.89; p<0.01). Drivers were mainly right handed (17 right, 80.95%; 4 left, 19.05%) and
the left hand was most frequently injured (8 right, 38.1%; 13 left, 61.9%). 15 of the drivers had a manual
34
car and 6 had an automatic car. All drivers had right hand drive cars. Eleven drivers cited domestic and
social reasons for their primary use of the car while ten drivers cited work as the primary reason for car
use. The majority of participants drove less often than normal but 5 continued to drive with their usual
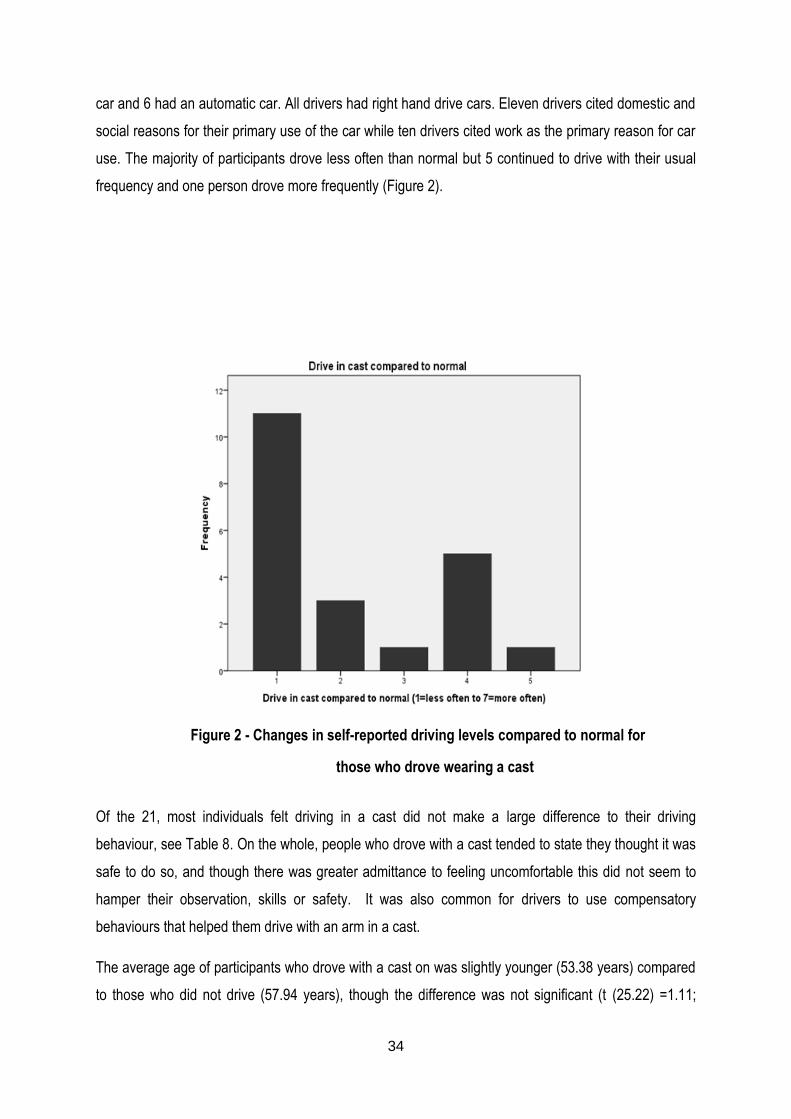
frequency and one person drove more frequently (Figure 2).
Figure 2 - Changes in self-reported driving levels compared to normal for
those who drove wearing a cast
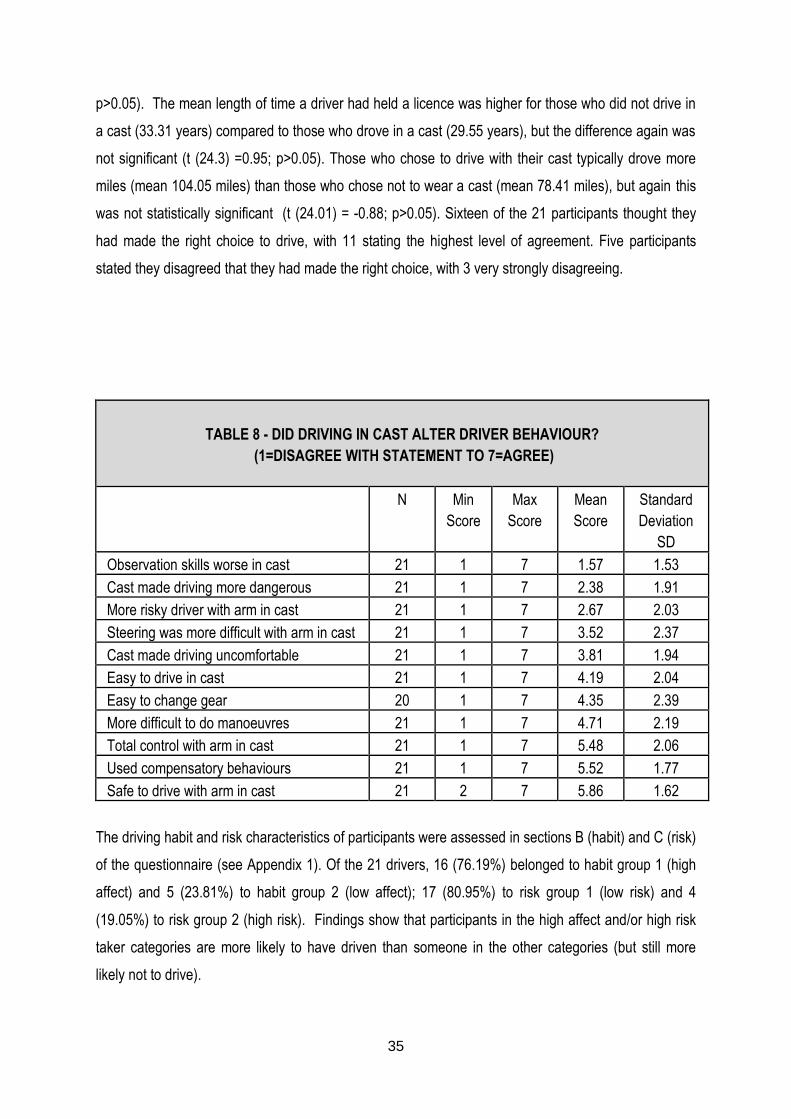
Of the 21, most individuals felt driving in a cast did not make a large difference to their driving
behaviour, see Table 8. On the whole, people who drove with a cast tended to state they thought it was
safe to do so, and though there was greater admittance to feeling uncomfortable this did not seem to
hamper their observation, skills or safety. It was also common for drivers to use compensatory
behaviours that helped them drive with an arm in a cast.
The average age of participants who drove with a cast on was slightly younger (53.38 years) compared
to those who did not drive (57.94 years), though the difference was not significant (t (25.22) =1.11;
35
p>0.05). The mean length of time a driver had held a licence was higher for those who did not drive in
a cast (33.31 years) compared to those who drove in a cast (29.55 years), but the difference again was
not significant (t (24.3) =0.95; p>0.05). Those who chose to drive with their cast typically drove more
miles (mean 104.05 miles) than those who chose not to wear a cast (mean 78.41 miles), but again this
was not statistically significant (t (24.01) = -0.88; p>0.05). Sixteen of the 21 participants thought they
had made the right choice to drive, with 11 stating the highest level of agreement. Five participants
stated they disagreed that they had made the right choice, with 3 very strongly disagreeing.
TABLE 8 - DID DRIVING IN CAST ALTER DRIVER BEHAVIOUR?
(1=DISAGREE WITH STATEMENT TO 7=AGREE)
N Min
Score
Max
Score
Mean
Score
Standard
Deviation
SD
Observation skills worse in cast 21 1 7 1.57 1.53
Cast made driving more dangerous 21 1 7 2.38 1.91
More risky driver with arm in cast 21 1 7 2.67 2.03
Steering was more difficult with arm in cast 21 1 7 3.52 2.37
Cast made driving uncomfortable 21 1 7 3.81 1.94
Easy to drive in cast 21 1 7 4.19 2.04
Easy to change gear 20 1 7 4.35 2.39
More difficult to do manoeuvres 21 1 7 4.71 2.19
Total control with arm in cast 21 1 7 5.48 2.06
Used compensatory behaviours 21 1 7 5.52 1.77
Safe to drive with arm in cast 21 2 7 5.86 1.62
The driving habit and risk characteristics of participants were assessed in sections B (habit) and C (risk)
of the questionnaire (see Appendix 1). Of the 21 drivers, 16 (76.19%) belonged to habit group 1 (high
affect) and 5 (23.81%) to habit group 2 (low affect); 17 (80.95%) to risk group 1 (low risk) and 4
(19.05%) to risk group 2 (high risk). Findings show that participants in the high affect and/or high risk
taker categories are more likely to have driven than someone in the other categories (but still more
likely not to drive).
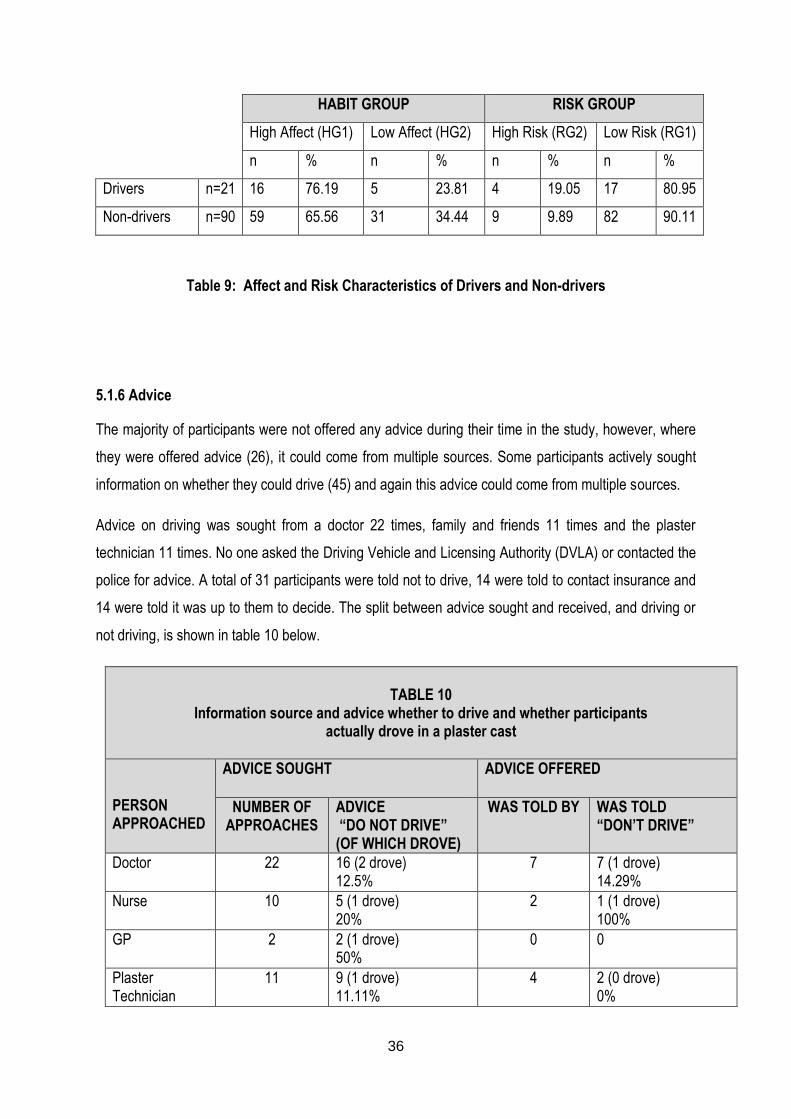
36
HABIT GROUP RISK GROUP
High Affect (HG1) Low Affect (HG2) High Risk (RG2) Low Risk (RG1)
n % n % n % n %
Drivers n=21 16 76.19 5 23.81 4 19.05 17 80.95
Non-drivers n=90 59 65.56 31 34.44 9 9.89 82 90.11
Table 9: Affect and Risk Characteristics of Drivers and Non-drivers
5.1.6 Advice
The majority of participants were not offered any advice during their time in the study, however, where
they were offered advice (26), it could come from multiple sources. Some participants actively sought
information on whether they could drive (45) and again this advice could come from multiple sources.
Advice on driving was sought from a doctor 22 times, family and friends 11 times and the plaster
technician 11 times. No one asked the Driving Vehicle and Licensing Authority (DVLA) or contacted the
police for advice. A total of 31 participants were told not to drive, 14 were told to contact insurance and
14 were told it was up to them to decide. The split between advice sought and received, and driving or
not driving, is shown in table 10 below.
TABLE 10
Information source and advice whether to drive and whether participants actually drove in a plaster cast
PERSON APPROACHED
ADVICE SOUGHT ADVICE OFFERED
NUMBER OF APPROACHES
ADVICE “DO NOT DRIVE” (OF WHICH DROVE)
WAS TOLD BY WAS TOLD “DON’T DRIVE”
Doctor 22 16 (2 drove) 12.5%
7 7 (1 drove) 14.29%
Nurse 10 5 (1 drove) 20%
2 1 (1 drove) 100%
GP 2 2 (1 drove) 50%
0 0
Plaster Technician
11 9 (1 drove) 11.11%
4 2 (0 drove) 0%
37
Other medical person
4 2 (0 drove) 0%
2 2 (0 drove) 0%
All health personnel combined
45 33 (5 drove) 15.15%
17 12 (2 drove) 16.67%
Family and friends
11 9 (2 drove) 22.22%
14 8 (1 drove) 14.29%
Insurance company
6 3 (1 drove) 33.33%
0 0
Total: told “do not drive”
66 sources from 45 people (1.47 sources per person)
46 (8 drove, 38 did not) 17.39% drove
29 sources from 26 people (1.12 sources per person)
20 (3 drove, 17 did not) 15% drove
No information 58 people had no information
58 (11 drove, 47 did not) 18.97%
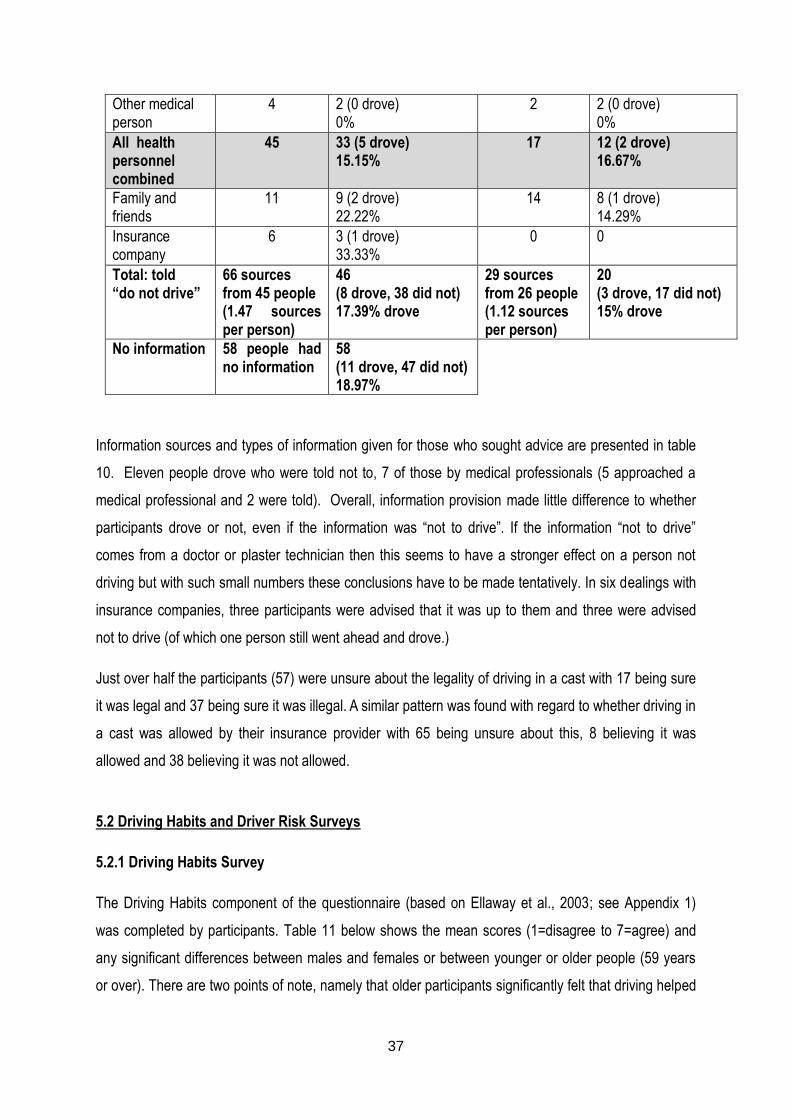
Information sources and types of information given for those who sought advice are presented in table
10. Eleven people drove who were told not to, 7 of those by medical professionals (5 approached a
medical professional and 2 were told). Overall, information provision made little difference to whether
participants drove or not, even if the information was “not to drive”. If the information “not to drive”
comes from a doctor or plaster technician then this seems to have a stronger effect on a person not
driving but with such small numbers these conclusions have to be made tentatively. In six dealings with
insurance companies, three participants were advised that it was up to them and three were advised
not to drive (of which one person still went ahead and drove.)
Just over half the participants (57) were unsure about the legality of driving in a cast with 17 being sure
it was legal and 37 being sure it was illegal. A similar pattern was found with regard to whether driving in
a cast was allowed by their insurance provider with 65 being unsure about this, 8 believing it was
allowed and 38 believing it was not allowed.
5.2 Driving Habits and Driver Risk Surveys
5.2.1 Driving Habits Survey
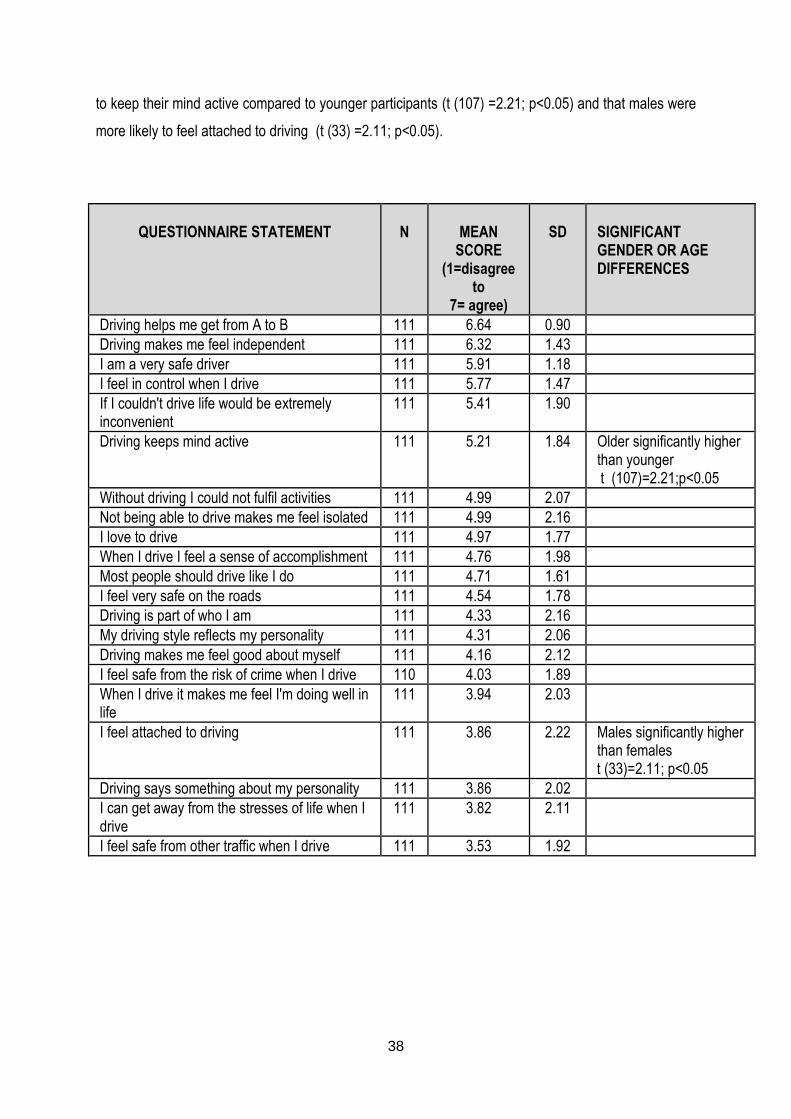
The Driving Habits component of the questionnaire (based on Ellaway et al., 2003; see Appendix 1)
was completed by participants. Table 11 below shows the mean scores (1=disagree to 7=agree) and
any significant differences between males and females or between younger or older people (59 years
or over). There are two points of note, namely that older participants significantly felt that driving helped
38
to keep their mind active compared to younger participants (t (107) =2.21; p<0.05) and that males were
more likely to feel attached to driving (t (33) =2.11; p<0.05).
QUESTIONNAIRE STATEMENT
N
MEAN
SCORE (1=disagree
to 7= agree)
SD
SIGNIFICANT GENDER OR AGE DIFFERENCES
Driving helps me get from A to B 111 6.64 0.90
Driving makes me feel independent 111 6.32 1.43
I am a very safe driver 111 5.91 1.18
I feel in control when I drive 111 5.77 1.47
If I couldn't drive life would be extremely inconvenient
111 5.41 1.90
Driving keeps mind active 111 5.21 1.84 Older significantly higher than younger
t (107)=2.21;p<0.05
Without driving I could not fulfil activities 111 4.99 2.07
Not being able to drive makes me feel isolated 111 4.99 2.16
I love to drive 111 4.97 1.77
When I drive I feel a sense of accomplishment 111 4.76 1.98
Most people should drive like I do 111 4.71 1.61
I feel very safe on the roads 111 4.54 1.78
Driving is part of who I am 111 4.33 2.16
My driving style reflects my personality 111 4.31 2.06
Driving makes me feel good about myself 111 4.16 2.12
I feel safe from the risk of crime when I drive 110 4.03 1.89
When I drive it makes me feel I'm doing well in life
111 3.94 2.03
I feel attached to driving 111 3.86 2.22 Males significantly higher than females
t (33)=2.11; p<0.05
Driving says something about my personality 111 3.86 2.02
I can get away from the stresses of life when I drive
111 3.82 2.11
I feel safe from other traffic when I drive 111 3.53 1.92
39
Table 11: Driver habit survey (after Ellaway et al., 2003) results including significant differences
between gender and age
Utilising a cluster analysis with squared Euclidean distance, two groups clearly emerged amongst the
participants. Group 1 (n=74), the ‘high affect’ group, were attached to the car and enjoyed driving.
Group 2 (n=36), the ‘low affect’ group, by contrast, still thought the car important, but showed less
affective traits linked to the car or driving. Those in this low affect group were older (average age 59.97
years) than those in the high affect group (average age 55.74 years) but this difference was not
significant (t(108)=1.48; p>0.05). Those in the low affect group drove fewer miles (average 74.72 miles
a week) compared to those with a high affect (average 88.27 miles a week), but the difference is not
significant (t(105)=0.87; p>0.05).
5.2.2 Driver Risk Survey
The Driver Risk Survey component of the questionnaire (based on Musselwhite. 2006; see Appendix 1)
was completed by all participants. On the whole participants tended to show safe driver behaviour, with
the most frequently reported risky behaviour realising driving faster than thought so person slows down,
followed by in a hurry to get somewhere and feeling 30mph should be a 40mph speed limit. There were
significant differences between males and females, where males were more likely to report more
frequently engaging in risky behaviour with regards to feeling a 30mph should be a 40mph (t(35)=2.43;
p<0.05), performing fast acceleration and deceleration if late (t(109)=2.47; p<0.05) and risky overtaking
ordinarily (t(109)=3.58; p<0.01) and if late (t(109)=1.43; p<0.05). In terms of differences in age, the
sample was split into two halves at the median, splitting the sample at the median, with younger drivers
are those aged 58 and younger, and those aged 59 and over represented as older people. There were
also many examples of risky behaviour that younger drivers perform significantly more than older
drivers including being in a hurry to get somewhere (t(109)=2.83; p<0.01), driving fast as feels safe to
do so (t(109)=2.69; p<0.01), when in a hurry (t(67)=2.94; p<0.01) and when angry (t(109)=2.75;
p<0.01), using heavy acceleration and braking ordinarily (t(109)=4.19; p<0.01) and if late (t(109)=3.98;
p<0.01), driving close to the vehicle in front if late (t(109)=3.2; p<0.01) and driving fast even when it
feels unsafe to do so (t(109)=4.03; p<0.01).
Utilising a cluster analysis with squared Euclidean distance, two groups clearly emerged amongst the
participants. Group 1 (n=98) were a group who drove relatively safely and took few risks; Group 2
(n=13), by contrast, were a relatively high risk group.
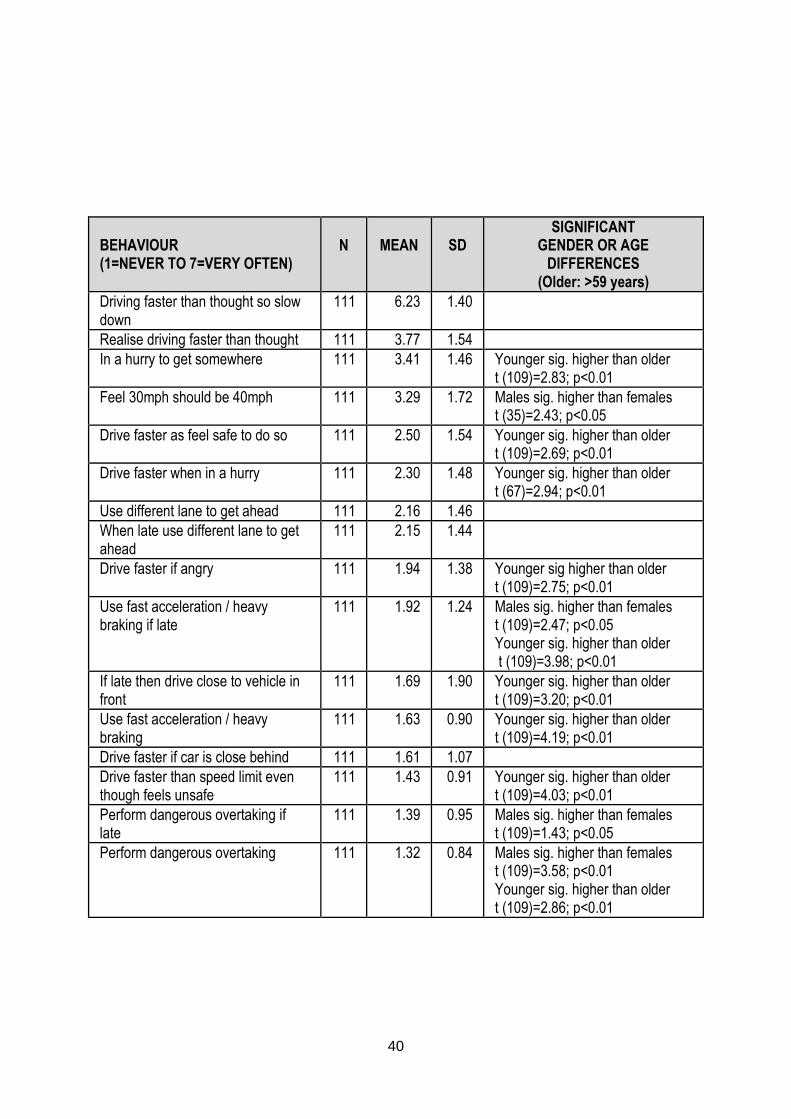
40
BEHAVIOUR (1=NEVER TO 7=VERY OFTEN)
N
MEAN
SD
SIGNIFICANT GENDER OR AGE
DIFFERENCES (Older: >59 years)
Driving faster than thought so slow down
111 6.23 1.40
Realise driving faster than thought 111 3.77 1.54
In a hurry to get somewhere 111 3.41 1.46 Younger sig. higher than older t (109)=2.83; p<0.01
Feel 30mph should be 40mph 111 3.29 1.72 Males sig. higher than females t (35)=2.43; p<0.05
Drive faster as feel safe to do so 111 2.50 1.54 Younger sig. higher than older t (109)=2.69; p<0.01
Drive faster when in a hurry 111 2.30 1.48 Younger sig. higher than older t (67)=2.94; p<0.01
Use different lane to get ahead 111 2.16 1.46
When late use different lane to get ahead
111 2.15 1.44
Drive faster if angry 111 1.94 1.38 Younger sig higher than older t (109)=2.75; p<0.01
Use fast acceleration / heavy braking if late
111 1.92 1.24 Males sig. higher than females t (109)=2.47; p<0.05 Younger sig. higher than older t (109)=3.98; p<0.01
If late then drive close to vehicle in front
111 1.69 1.90 Younger sig. higher than older t (109)=3.20; p<0.01
Use fast acceleration / heavy braking
111 1.63 0.90 Younger sig. higher than older t (109)=4.19; p<0.01
Drive faster if car is close behind 111 1.61 1.07
Drive faster than speed limit even though feels unsafe
111 1.43 0.91 Younger sig. higher than older t (109)=4.03; p<0.01
Perform dangerous overtaking if late
111 1.39 0.95 Males sig. higher than females t (109)=1.43; p<0.05
Perform dangerous overtaking 111 1.32 0.84 Males sig. higher than females t (109)=3.58; p<0.01 Younger sig. higher than older t (109)=2.86; p<0.01
41
Table 12: Driver Risk Survey (after Musselwhite, 2006) results including significant differences
by gender and age
There were no significant differences between the variables on the Driver Risk Survey (Section C of the
questionnaire) and whether someone drove or not. Therefore, driver risk does not influence whether
someone drives in a cast or not. Similarly, there were no significant differences between the variables
on the affect components of the Driver Risk Survey and whether someone drove or not. Therefore,
driver affect is not related to whether someone drives in a cast or not. However, by using the groups
generated by the cluster analysis, it can be seen that:-
High risk takers are much more likely to drive with their arm in a cast than would be found by
chance; there are only 13 high risk takers and 4 of these drove in a cast (high risk takers 30.77%;
overall sample 18%)
Drivers with high affect are slightly more likely to drive than would be found by chance, with 16 of
the 76 driving (high affect drivers 21.62%; overall sample is 18%)
5.3 Effect of having an arm in a cast on travel behaviour
People reported that breaking their arm and having it in a cast reduced their miles and had some effect
on reducing their cycling (for those that did). There were large increases in the use of trains, buses and
walking, with some increase in taking lifts from friends and family. Even though miles were reduced, the
total number of journeys taken increased, suggesting that breaking an arm and wearing a cast reduces
the ability to do multiple things at the destination or has created a greater need to undertake distributed
journeys.
The number of miles is reduced dramatically when someone has their arm in plaster and this is
distributed relatively equally whether or not someone drove with their arm in a cast; the difference
between those that drove and those that did not drive and the mileage undertaken is therefore non-
significant (t (31)=0.05; p>0.05). Use of the bus is slightly increased and this also does not differ
significantly between those that drove and those that did not drive in a cast (t (25)=1.32; p>0.05). There
were significant differences between those that drove and those that did not drive and the use of other
transport, however, people who normally cycled reverted to using the car. Cycling was considerably
reduced for those who drove in their cast, compared to only a very small change for those that did not
drive in their cast (t (109)=2.89; p<0.01). Taking lifts with family and friends increased for non-drivers
and decreased very slightly for drivers; the difference between the two groups is statistically significant
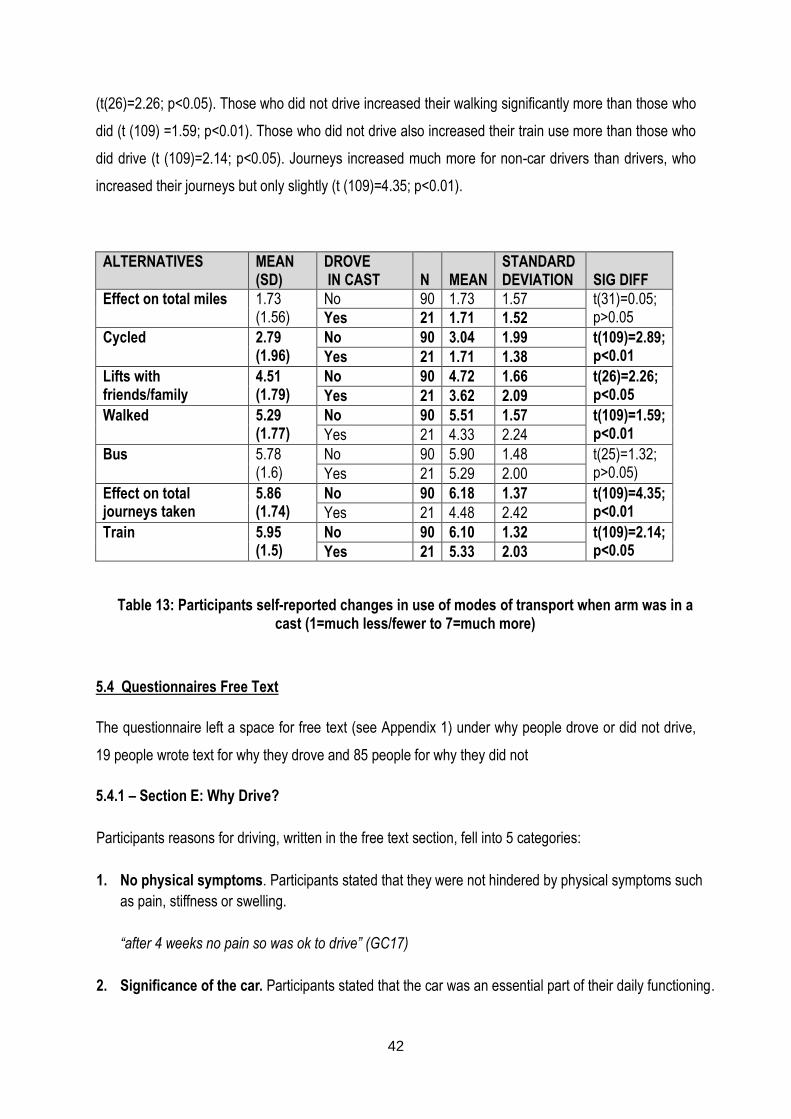
42
(t(26)=2.26; p<0.05). Those who did not drive increased their walking significantly more than those who
did (t (109) =1.59; p<0.01). Those who did not drive also increased their train use more than those who
did drive (t (109)=2.14; p<0.05). Journeys increased much more for non-car drivers than drivers, who
increased their journeys but only slightly (t (109)=4.35; p<0.01).
ALTERNATIVES MEAN (SD)
DROVE IN CAST
N
MEAN
STANDARD DEVIATION
SIG DIFF
Effect on total miles 1.73 (1.56)
No 90 1.73 1.57 t(31)=0.05; p>0.05 Yes 21 1.71 1.52
Cycled 2.79 (1.96)
No 90 3.04 1.99 t(109)=2.89; p<0.01 Yes 21 1.71 1.38
Lifts with friends/family
4.51 (1.79)
No 90 4.72 1.66 t(26)=2.26; p<0.05 Yes 21 3.62 2.09
Walked 5.29 (1.77)
No 90 5.51 1.57 t(109)=1.59; p<0.01 Yes 21 4.33 2.24
Bus 5.78 (1.6)
No 90 5.90 1.48 t(25)=1.32; p>0.05) Yes 21 5.29 2.00
Effect on total journeys taken
5.86 (1.74)
No 90 6.18 1.37 t(109)=4.35; p<0.01 Yes 21 4.48 2.42
Train 5.95 (1.5)
No 90 6.10 1.32 t(109)=2.14; p<0.05 Yes 21 5.33 2.03
Table 13: Participants self-reported changes in use of modes of transport when arm was in a cast (1=much less/fewer to 7=much more)
5.4 Questionnaires Free Text
The questionnaire left a space for free text (see Appendix 1) under why people drove or did not drive,
19 people wrote text for why they drove and 85 people for why they did not
5.4.1 – Section E: Why Drive?
Participants reasons for driving, written in the free text section, fell into 5 categories:
1. No physical symptoms. Participants stated that they were not hindered by physical symptoms such
as pain, stiffness or swelling.
“after 4 weeks no pain so was ok to drive” (GC17)
2. Significance of the car. Participants stated that the car was an essential part of their daily functioning.
43
“needed to get around and car is main mode of transport” (IA120)
“I needed to have some independence” (CL82)
3. Responsibilities. Participants found that car use enabled them to fulfil their daily commitments.
“I had to get to work and I have a toddler at nursery who I also have to collect on way home. Could not
have done this on public transport” (IY88)
4. I decided I could / told I could. Participants acted on their own decision or on advice of others and
chose to drive in their cast.
“I was competent, I could do it” (HZ80)
“My doctor said it was ok and I felt safe to do so” (UY160)
5. Alterations to driving behaviour. Participants made alterations to their driving behaviour in order to
be able to drive in their cast.
“I altered the route to avoid right turns on busy roads” (RC105)
“Didn't drive my usual vehicle. Drove an automatic” (PR170)
5.4.2 Section F: Why Didn’t Drive?
Participant’s reasons for not driving, when added in the free text section, fell into 6 categories:
1. Physical symptoms. Participants stated that they were hindered by physical symptoms such as
pain, stiffness or swelling.
“It was too painful to change gear and use handbrake” (XR91)
“If I banged it and I hurt it I could have lost control of the car” (SO97)
2. Physical block. Participants found that the cast impeded their ability to manoeuvre the controls
“The rigidity if the cast across the palm of my hand restricted the grip, therefore control, of any
action using my left hand” (XH104)
3. Significance of the car. Participant found that the car was easily dismissed from their daily
functioning
“Don’t drive much anyway (II78)
4. Told I shouldn’t. Participants acted on advice
44
“I was advised not to drive [by the consultant]” (II59)
“I was told my insurance would not cover me [by a doctor]” (IL86)
5. Perception that it is not safe, legal or covered by insurance. Participants felt that driving in a
cast was contrary to driving regulations (Highway Code) and insurance
“Probably not insured” (GX84)
“Probably unsafe” (XA92)
“Is not allowed”(XO121)
6. Risk averse. Participants felt safety would be compromised if they drove.
“The safety of myself and other road users was important to me. Couldn't live with guilt if I had
caused an accident through driving” (PC156)
5.5 Qualitative Analysis of Interviews
The 14 interviews were transcribed and subject to a three tier process that involved individual reviews,
paired reviews and, finally, team reviews. The following five themes were identified by this process; the
significance of the car to the participant, reasons for driving, reasons for not driving, the availability of
transport alternatives and the advice that influenced participants choice.
5.5.1 Significance of the car
Participants cited many reasons why the car had a significant place in the functioning of their everyday
lives.
Firstly, car use was deemed essential for practical reasons such as shopping (XY100; PR170), visiting
friends (XY100), getting to work (CS176) and appointments (A0164), as well as enabling caring roles
such as visiting a sick father (A0164), giving mother lifts (A0164), and shopping for nan (CS176).
Researcher “what made you decide that you wanted to drive?”
CS176 “because I could not get anywhere else”
Researcher “ok, so where did you need to get to?”
CS176 “work, boyfriends and taking my nan shopping, everywhere really”
45
5.5.2 Reasons for not driving while in a cast
Physical symptoms affecting the ability to drive was cited most frequently as a reason for not driving
including difficulty gripping or holding the steering wheel (XY100; CS176; IP 200) and pain from the
pressure of changing gear (A0164) and swelling affecting flexibility (PR170)
Researcher “so what is making you not want to drive?”
DC63 “Um well it’s … I haven’t got the strength in my hand, um, the strength to grip the wheel and my fingers are a bit swollen and it aches a bit, so I, I just haven’t attempted it yet and all the angle that you hold the wheel that would be uncomfortable.“
Some participants chose not to drive as they were not sure if driving in a cast was permitted
LO109 “I just didn’t know and you can’t be sure er, you know if there is a problem they might then, you might not be insured, so I didn’t want to do it”
5.5.3 Reasons for driving in a cast
Several participants had an automatic car or were able to borrow an automatic car and this was used
as a reason for driving while in a cast. Interestingly participants with right hand injuries cited use of an
automatic car to the same extent as left hand injured drivers.
IU85 “Yeah, yes I’ve er, I’ve been driving throughout, because I’ve got um an automatic car it’s a lot easier for me ……I’d had a manual car I’d have not drive at all in the slightest, so because I have the automatic it made it a lot easier and I could drive”
Drivers cited essential for practical reasons for choosing to drive.
IU85 “I would have had no idea how I’d have gotten to the hospital. Because I’ve only been in Bristol a few months I’m not really sure about the bus service to the hospital from where ever I am”
PI158 “Transport, I needed it to get from A to B”
5.5.4 Transport alternatives
The availability of, and feelings about using transport alternatives was a key theme among the
participants.
In relation to lifts, participants did not want to put people to any trouble by asking/using lifts.
AO164 “No, not really. I mean people did offer but I really didn’t want to, well it would mean people travelling a long way to come and get me and take me somewhere where …..”
IU85 “Erm, I hadn’t even thought about it really to be honest, er, I probably could have asked two people, erm but I would have felt really cheeky asking.
46
Choosing to walk was influenced by location.
DC63 “Oh no, no, no everything is just a few minutes’ walk, so no I only drive it if I want to go somewhere, where there isn’t a bus”
AO164 “the nearest shop which is a very small one with a post office but that is at least two miles away, so it would have been a four mile walk and I wasn’t really feeling like that”
Participants indicated both positive and negative attitudes and experiences with regard to using public
transport. Barriers included:
Cost:
XY100 “Um I’ve not taken many taxis coz it is so expensive.”
A0164 “plus buses in Bristol are too expensive”
Location:
IP200 “No, the trouble is it’s a 15 minute walk from our house to get to the “nearest bus stop
so it’s not that convenient” Not for me
Attitude:
PI158 “I don’t touch buses!”
Some participants did use Public Transport and found it a positive experience.
IO109 “coz even on the bus my husband came too [on the bus] and he said “it’s different up
here you can see …. get a good view and see the world go by ….. Is sort of relaxing and you
don’t have to park when you get there. I mean um, it’s given me the chance to do, er to see
things that I wouldn’t have, do otherwise. I would have just carried on driving and with life
rushing here and there and everywhere so it’s got me to different things”
5.5.5 Advice
Participants were not routinely given driving advice nor did they seek advice routinely. Some made an
assumption that driving in a cast was ok or not.
IP200 “No, don’t think I asked … them because I just took it for granted I couldn’t”
PI158 “No, I live on my own and I just built it up [to drive] in my own mind, its common sense
really”
Some participants sought advice;
IU85 “friends and family were saying “oh you can’t do it”. Then I er, I’m in quite a fortunate
position coz my ex used to be an insurance underwriter… and he said “there is absolutely
nothing in your policy wording …. that mentions if you have a cast on”. And he knows a

47
couple of policemen and I asked him to ask them, what the deal is … and they said “there’s
nothing in the law that says you can’t drive”
Some were given advice;
Researcher “did you have to contact anyone, like your insurance or anything like that?”
PI158 “I was told not to [by medical team]”
Researcher “told you not to drive?”
PI158 “Not to contact the insurance”
Researcher “Why did they say that?”
PI158 “Because eventually it would be ok, and it would not be a long term thing you
see”
48
Chapter 6
6.0 DISCUSSION
6.1 Gender, age, hand injured and mechanism of injury
Our female to male ratio was 3.6:1 which is similar to gender ratio of the study by Thompson et al, 2004
who found a female to male incidence of distal radial fracture, in Dorset, UK, of 3.9:1. Postmenopausal
women were found to be two to three times more likely to sustain a fracture of the distal radius than
men reaching a maximum incidence between 60 and 70 years. The age specific incidence in our study,
however, does not reflect the typical bimodal distribution of younger men and older women (Garcia-
Elias and Folgar, 2006). This may be because our focus is on adults who are drivers, and this excludes
younger men (15-17 years) who are a key group in the incidence of distal radial fracture. We found that,
in common with another study, the left hand was most commonly injured (66) with the right hand injured
43 times and 2 patients injured both hands (O’Neill et al, 2001). Seventy percent of participants
sustained their injury from a standing height or less. This is similar to the findings of Solgaard and
Petersen (1985) who found that a fall on level ground was the mechanism of injury in 87 per cent of
female and 64 per cent of male patients.
6.2 Prevalence
18% of participants drove in their cast. Previous European studies report a prevalence of between 9
and 15% (Kennedy et al, 2006; Edwards et al, 2009) and, although our finding is slightly higher, it
accords with other European studies, in comparison with the 50% who drove in their cast in an
Australian study (Kalamaris et al. 2006). The difference in the prevalence of drivers between Edwards
et al. (2000) and Kalamaris et al. (2006) study may be due to social norms in the two countries and the
role of driving.
6.3 Drivers
In the general driving population, men still drive about twice as much as women, even though the
number of new drivers is rising more quickly among women and the number of miles driven by women
is increasing (Le Vine and Jones, 2012). We found that males were significantly more likely to drive in
a plaster cast than females and drove more miles on average per week. Other factors such as age,
duration of licence and miles driven were all increased in our driving population compared with non-
drivers but the difference was not significant.
49
6.4 Altered driving behaviour
Several authors have assessed driver performance in a cast and found varying degrees of effect. The
quality of this research is variable as indicated in the literature review and Table 1. Gregory et al (2009)
found a positive effect on routine driving on urban and rural roads but a negative effect when
responding to hazards. Most of our driving participants stated that they did not feel that the cast made a
difference to their driving behaviour and tended to state they thought it was safe to drive in a cast.
Despite admittance to feeling uncomfortable, this was not perceived as hampering their observation,
skills or safety. Despite this, compensatory behaviours occurred, such as switching to an automatic car
or choosing a route to avoid difficult turns. Non-drivers perceived that their performance would be
altered, due to the cast impairing adequate grip or because of pain, and therefore chose not to drive.
6.5 Advice
The low level of advice being either offered or sought in this study shows that driving advice is not a
routine part of practice in the Orthopaedic setting or the patients’ prime concern in the clinic. Perhaps it
ought to be; Edwards et al, 2009, found that 98% of their respondents wanted written advice from the
clinic and our study showed high adherence to the advice offered by doctors and plaster technicians..
Our low rate of advice giving is in contrast to Chen et al, 2008, where 68% of surgeons indicated that
they gave driving advice. Chen et al (2008), however, are reporting what surgeons said they would do
and there may therefore be an element of over-reporting. Alternatively, our participants may have
under-reported advice given, despite targeted questioning, as their focus may have been their injury
and its management. Therefore, if advice is provided by healthcare professionals, it needs to be
consistent, truthful and timely, otherwise patients could be making a choice based on insufficient
information.
Despite being given advice, some participants chose to ignore it and 8 participants drove even though
they were advised not to. Edwards et al (2009) found that 76% of casted drivers informed no-one of
their intention to drive and Chen et al (2008) found that 64% of casted drivers did not seek permission
to drive from their doctor/consultant. Sixteen out of 21 of our drivers felt they had made the right choice
to drive with 11 stating this with the highest level of agreement. Five however stated that they
disagreed that they had made the right choice. Timely advice by healthcare professionals could prevent
patients regretting decisions made and facilitate informed decision making.
50
6.6 Legality and insurance
Since it is not illegal to drive in a cast in Britain, an unqualified “just say no” response from healthcare
professionals means that some patients who could be driving are prevented from doing so. Thirty-
seven of our participants felt it was illegal to drive in a cast and just over half (57) were unsure about
the legality. Thus 37 participants, provided there were no other limiting factors, could have driven. It is,
however, illegal to drive without valid insurance in Britain and patients therefore have a duty to contact
their insurers. Our participants showed a lack of knowledge about insurance and driving in a cast, with
65 being unsure, 8 believing their insurance would allow it and 38 believing their insurance would not
allow it. Twenty-one participants were driving, so some of these were unclear about their insurance
cover, which could have made them illegal. When seeking their insurer’s permission, however, patients
can get caught in a loop where insurers ask for the doctors’ permission and doctors ask for the insurer’s
permission.
In general healthcare professionals are not trained to assess patient’s driving ability and this means
driving advice should be restricted to the parameters of the professionals practice such as medical and
biomechanical concerns only. These could include issues of weakness, pain, lack of mobility, the
effects of cast bulk and medication. This is supported by the police who in the study by Von Arx et al,
(2004) state that:
“You should limit your advice to referring your patients to the Highway Code for direction and
that should any patient be in doubt that they should contact their insurance company and take
their advice regarding liability.” (p.885)
The authors go on to discuss the ensuing dilemma whereby insurance companies then tell patients to
obtain their doctor’s permission. They conclude that insurance companies should not
“seek clarification from the doctor as to whether the patient is fit to drive.” (p. 886)
In view of the possible liability issues, it seems reasonable to support the suggestion of Giddins and
Hammerton (1996) that any driving advice should be recorded in the patients’ notes. To ensure driving
advice is consistent, truthful and timely some form of printed advice could be provided.
51
Chapter 7
7.0 CONCLUSION
We found that 18% of participants with below-elbow casts for distal radial fracture drove in their cast,
and that men were significantly more likely to do so. These drivers were more likely to be in high affect
and high risk taker groups and took compensatory action when driving, such as driving less often than
normal, switching to an automatic car or using an alternative route. Our drivers chose to drive because
they felt their car use was essential to their daily functioning in areas such as work or fulfilling their
personal and social responsibilities. Non-drivers perceived that their performance would be affected by
either physical symptoms or lack of flexibility such as the mechanical blockage of the cast on their grip.
Drivers and non-drivers perceived that using alternative transport had both beneficial and negative
connotations. When advice was given, doctors and plaster technicians in particular had a high advice
adherence rate, if they told participants not to drive then it was more likely that they would not.
52
Chapter 8
8.0 RECOMMENDATIONS FOR PRACTICE
Several recommendations for practice emerge from our literature review and research study.
Healthcare professionals should:
Indicate medical reasons for not driving, such as medication or pain effects, weakness and
restricted motion of the wrist or upper limb.
Indicate technical reasons for not driving such a mechanical blockage to grip on the steering wheel
or gears, or loss of secondary positional adjustment of the arm by the proximity of the door.
Only give advice within their scope of practice.
Point out that driving in a cast, while not always illegal, is not necessarily wise, as driver response
to hazards is affected and the presence of a cast could be considered by the Crown Prosecution
Service as contributing to dangerous driving.
Instruct their patients to inform their insurance company if they intend to drive in their cast as
driving without valid insurance is illegal in Great Britain.
Give consistent, truthful and timely advice to all patients as, in the interests of informed practice, all
patients should receive evidence based driving advice.
Document any driving advice given, as all aspects of a patient’s management should be recorded
for medico-legal reasons.
In addition, healthcare professionals could indicate local alternatives to driving, such as local resources
for buses, trains, car sharing etc. This would require healthcare staff having knowledge of such services
and provision.
53
REFERENCES
Blair S, Chaudhri O, Gregori A (2002) ‘Doctor, can I drive with this plaster? An evidence based
response’. Injury, 33:55-56
Chen V, Desrosiers N, Appleton P, Rodriguez EK (2008) ‘Return to driving after orthopaedic trauma or
surgery’. Available at: www.orthojournalhms.org/volume9/manuscripts/ms22.pdf
Chong PY, Koehler EAS, Shyr Y, Watson JY, Weikert DR, Rowland JH et al (2010) ‘Driving with an arm
immobilised in a splint: A randomised high-order crossover trial’. Journal of Bone and Joint Surgery,
92A:2263-2269
Crown Prosecution Service (2014) Policy for Prosecuting Cases of Bad Driving. Section 5.27, p.
222014. Available at: www.cps.gov.uk/publications/docs/pbd_policy_english.pdf accessed 2014
Department of Health (2009) ‘The NHS in England: The operating framework’
Available at:
www.dh.gov.uk/prod_consum_dh/groups/dh_digitalassets/@dh/@en/documents/digitalasset/dh_09144
6.pdf
Department for Transport (2013a) ‘National Travel Survey 2012, Statistical Release, published July
2013.’ Available at: www.gov.uk/government/publications/national-travel-2012
Department for Transport (2013b) ‘Reported Road Casualties in Great Britain: Quarterly Provisional
Estimates’ Q1 2013, Statistical Release, August 2013. Available at:
www.gov.uk/government/publications/reported-road-casualties-great-britain-provisional-estimates-q1-
2013
Department for Transport (2014) ‘The Highway Code, Rules for drivers and motorcyclists’ (89 to 102).
Available at: www.gov.uk/rules-drivers-motorcyclists-89-102/fitness-to-drive-90-94
Driver and Vehicle Licensing Agency (2014a) ‘For Medical Practitioners, At a glance guide to the current
Medical Standards of Fitness to Drive 2014’. Available at: www.gov.uk/government/publications/at-a-
glance
Driver and Vehicle Licensing Agency (2014b) ‘Drivers Medical Enquiries, Health Conditions and Driving’.
Available at: www.gov.uk/dvla-medical-enquiries
54
Edwards MR, Oliver MC, Hatrick NC (2009) ‘Driving with a forearm plaster cast: patients’ perspective’
Emergency Medical Journal, 26:405-406
Ellaway A, Macintyre S, Hiscock R, Kearns A (2003) ‘In the driving seat: psychosocial benefits from
private motor vehicle transport compared to public transport’. Transportation Research Part F: Traffic
Psychology and Behaviour, 6:217-231
Garcia-Elias M, Folgar MA (2006) ‘The management of wrist injuries: an international perspective.’
Injury. 37:1049-56
Giddins GE, Hammerton A (1996) ‘“Doctor, when can I drive?”: a medical and legal view of the
implications of advice on driving after injury or operation’. Injury, 27:495-7
Gregory JJ, Stephens AN, Steele NA, Groeger JA (2009) ‘Effects of upper-limb immobilisation on
driving safety.’ Injury, 40:253-256
Kalamaras MA, Rando A, Pitchford DGK (2006) ‘Driving Plastered: Who does, is it safe and what to tell
patients.’ Australian and New Zealand Journal of Surgery, 76:439-441
Kennedy MT, Roche S, Lenehan B, Curtin W (2006) ‘Driving plastered: driving habits of orthopaedic
outpatients and the medico-legal implications.’ European Journal of Orthopaedics, Surgery and
Traumatology, 16:228-230
King D, Benbow SJ, Barrett JA (1992) ‘The law and medical fitness to drive- a study of doctors’
knowledge.’ Postgraduate Medical Journal, 68:624-628
Lawton R, Parker D, Manstead ASR, Stradling S (1997) ‘The role of affect in predicting social
behaviours: the case of road traffic violations’ J Appl Soc Psycol, 27:1258-1276
Le Vine S, Jones P (2012) ‘On the move: Making sense of car and train travel trends in Britain.’ RAC
Foundation. Available at:
http://www.racfoundation.org/assets/rac_foundation/content/downloadables/on_the_move-
le_vine_&_jones-dec2012.pdf
Musselwhite C (2006) ‘Attitudes towards vehicle driving behaviour: Categorising and contextualising
risk.’ Accident Analysis and Prevention, 38:324-334
55
Nunez VA, Giddins GEB (2004)’ “Doctor, when can I drive?” An update on the medico-legal aspects of
driving following an injury or operation.’ Injury, 35:888-890
O’Neill TW, Cooper C, Finn JD, Lunt M, Purdie D, Ried DM, Rowe R, Woolf AD, Wallace WA (2001)
‘Incidence of distal forearm fracture in British men and women.’ Osteoporosis International, 12: 555-558
Police specials.com posted 30th April 200; accessed April 2010
http://www.policespecials.com/forum/index.php?/topic/52353-driving-with-a-fractured-wrist/
Reason JT, Manstead ASR, Stradling SG, Baxter JS, Campbell K (1990) ‘Errors and Violations on the
road: a real division?’ Ergonomics, 33:1315-1332
Rees JL, Sharp RJ (2002) ‘Safety to drive after common limb fractures.’ Injury, 33:51-54
Solgaard S, Petersen VS. (1985) ‘Epidemiology of distal radius fractures.’ Acta Orthop Scand, 56:391-
3
Thompson PW, Taylor J, Dawson A (2004) ‘The annual incidence and seasonal variation of fractures of
the distal radius in men and women over 25 years in Dorset’, UK. Injury, 35:462-6
Von Arx OA, Langdown AJ, Brooks RA, Woods DA (2004) ‘Driving whilst plastered: is it safe, is it legal?
A survey of advice to patients given by orthopaedic surgeons, insurance companies and the police’.
Injury, 35:883-887
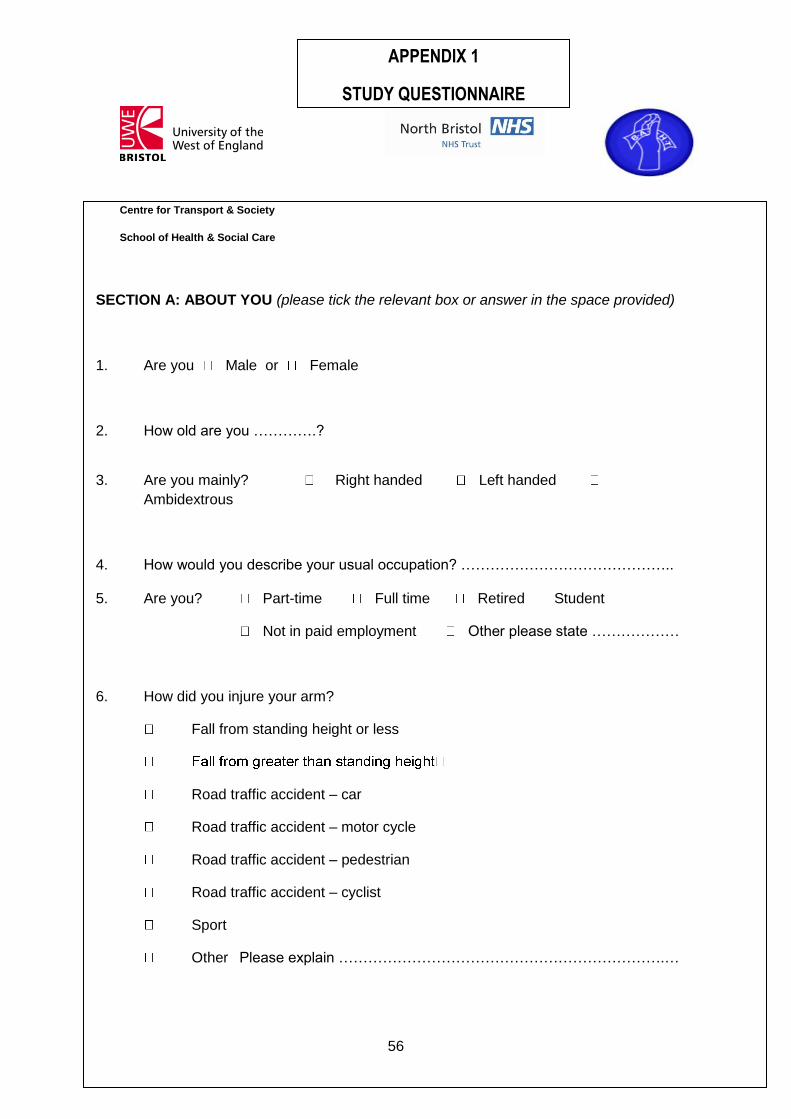
56
SECTION A: ABOUT YOU (please tick the relevant box or answer in the space provided)
1. Are you Male or Female
2. How old are you ………….?
3. Are you mainly? Right handed Left handed
Ambidextrous
4. How would you describe your usual occupation? …………………………………….. 5. Are you? Part-time Full time Retired Student
Not in paid employment Other please state ………………
6. How did you injure your arm?
Fall from standing height or less
Road traffic accident – car
Road traffic accident – motor cycle
Road traffic accident – pedestrian
Road traffic accident – cyclist
Sport
Other Please explain ………………………………………………………….…
Centre for Transport & Society
School of Health & Social Care
APPENDIX 1
STUDY QUESTIONNAIRE
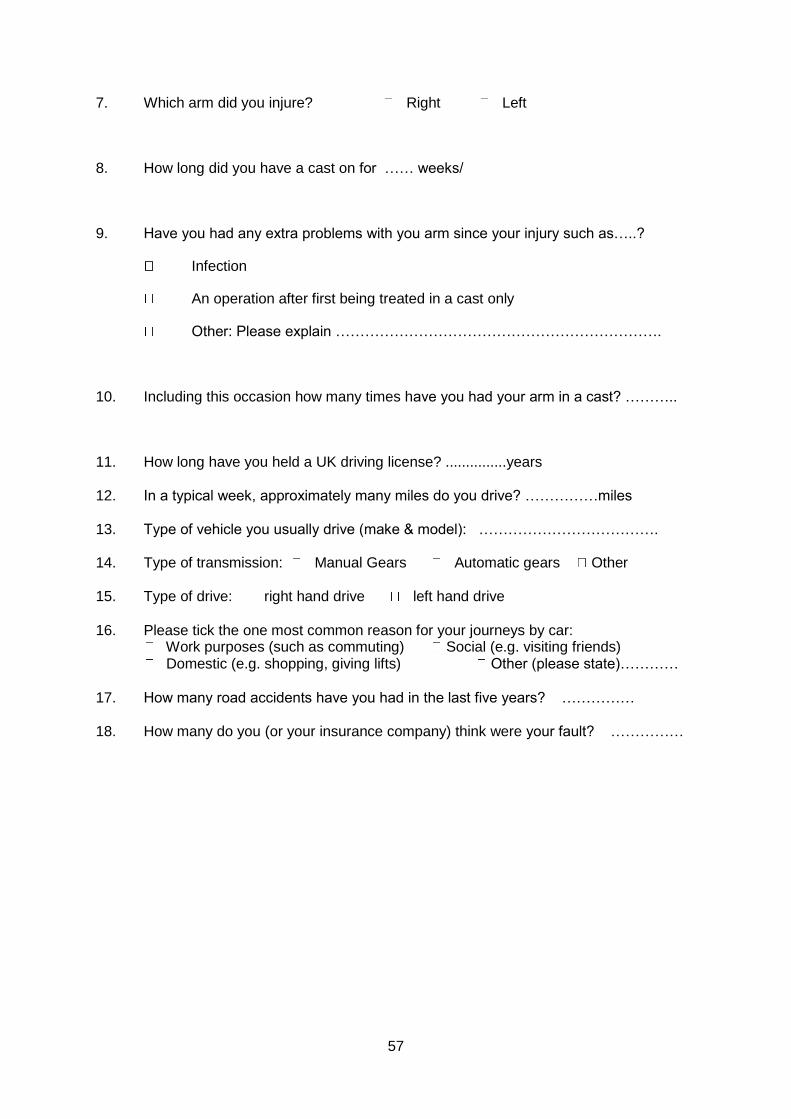
57
7. Which arm did you injure? Right Left
8. How long did you have a cast on for …… weeks/
9. Have you had any extra problems with you arm since your injury such as…..?
Infection
An operation after first being treated in a cast only
Other: Please explain ………………………………………………………….
10. Including this occasion how many times have you had your arm in a cast? ………..
11. How long have you held a UK driving license? ...............years 12. In a typical week, approximately many miles do you drive? ……………miles 13. Type of vehicle you usually drive (make & model): ………………………………. 14. Type of transmission: Manual Gears Automatic gears Other 15. Type of drive: right hand drive left hand drive
16. Please tick the one most common reason for your journeys by car:
Work purposes (such as commuting) Social (e.g. visiting friends) Domestic (e.g. shopping, giving lifts) Other (please state)…………
17. How many road accidents have you had in the last five years? ……………
18. How many do you (or your insurance company) think were your fault? ……………
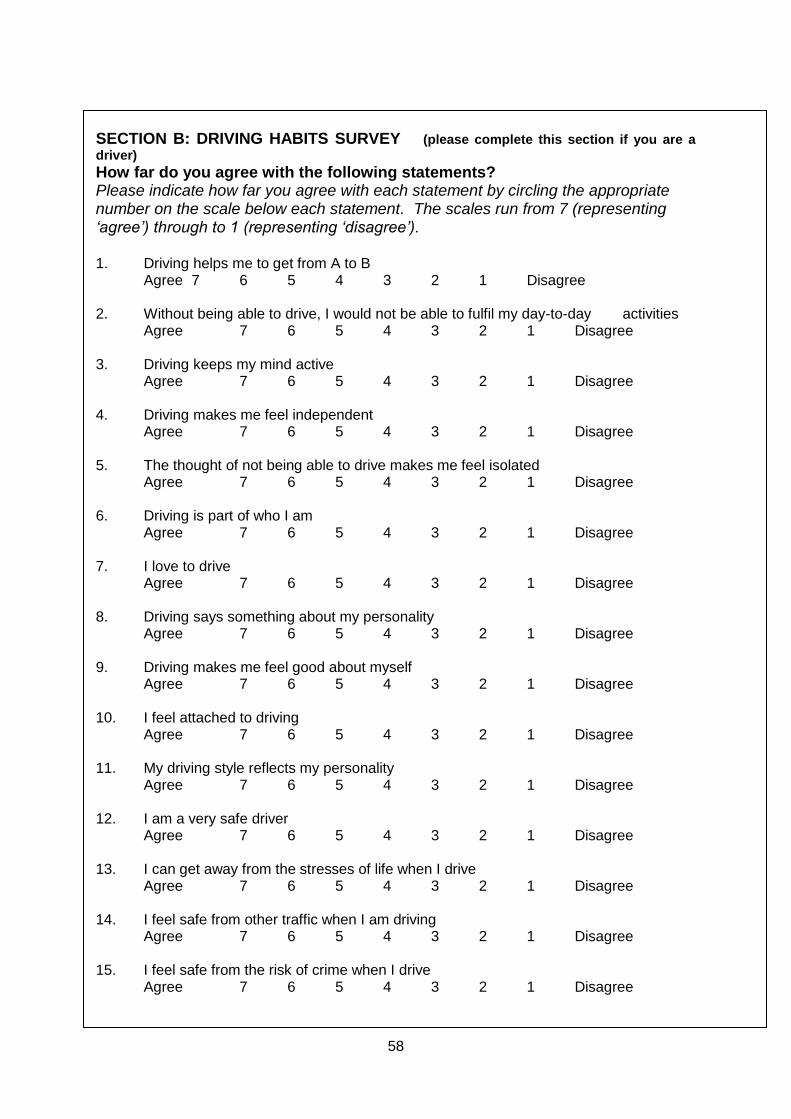
58
SECTION B: DRIVING HABITS SURVEY (please complete this section if you are a
driver) How far do you agree with the following statements? Please indicate how far you agree with each statement by circling the appropriate number on the scale below each statement. The scales run from 7 (representing ‘agree’) through to 1 (representing ‘disagree’). 1. Driving helps me to get from A to B
Agree 7 6 5 4 3 2 1 Disagree 2. Without being able to drive, I would not be able to fulfil my day-to-day activities
Agree 7 6 5 4 3 2 1 Disagree 3. Driving keeps my mind active
Agree 7 6 5 4 3 2 1 Disagree
4. Driving makes me feel independent Agree 7 6 5 4 3 2 1 Disagree
5. The thought of not being able to drive makes me feel isolated
Agree 7 6 5 4 3 2 1 Disagree 6. Driving is part of who I am
Agree 7 6 5 4 3 2 1 Disagree 7. I love to drive
Agree 7 6 5 4 3 2 1 Disagree 8. Driving says something about my personality
Agree 7 6 5 4 3 2 1 Disagree 9. Driving makes me feel good about myself
Agree 7 6 5 4 3 2 1 Disagree 10. I feel attached to driving
Agree 7 6 5 4 3 2 1 Disagree 11. My driving style reflects my personality
Agree 7 6 5 4 3 2 1 Disagree 12. I am a very safe driver
Agree 7 6 5 4 3 2 1 Disagree 13. I can get away from the stresses of life when I drive
Agree 7 6 5 4 3 2 1 Disagree
14. I feel safe from other traffic when I am driving Agree 7 6 5 4 3 2 1 Disagree
15. I feel safe from the risk of crime when I drive
Agree 7 6 5 4 3 2 1 Disagree
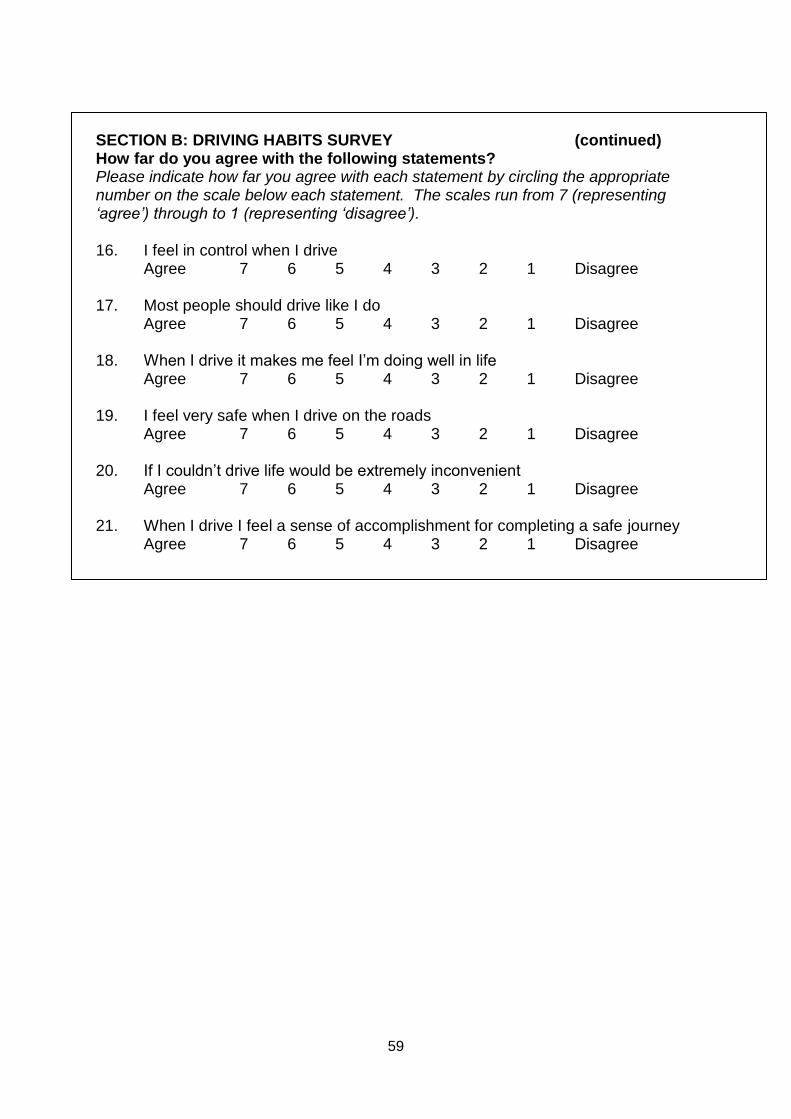
59
SECTION B: DRIVING HABITS SURVEY (continued) How far do you agree with the following statements? Please indicate how far you agree with each statement by circling the appropriate number on the scale below each statement. The scales run from 7 (representing ‘agree’) through to 1 (representing ‘disagree’). 16. I feel in control when I drive
Agree 7 6 5 4 3 2 1 Disagree 17. Most people should drive like I do
Agree 7 6 5 4 3 2 1 Disagree 18. When I drive it makes me feel I’m doing well in life
Agree 7 6 5 4 3 2 1 Disagree 19. I feel very safe when I drive on the roads
Agree 7 6 5 4 3 2 1 Disagree 20. If I couldn’t drive life would be extremely inconvenient
Agree 7 6 5 4 3 2 1 Disagree 21. When I drive I feel a sense of accomplishment for completing a safe journey
Agree 7 6 5 4 3 2 1 Disagree
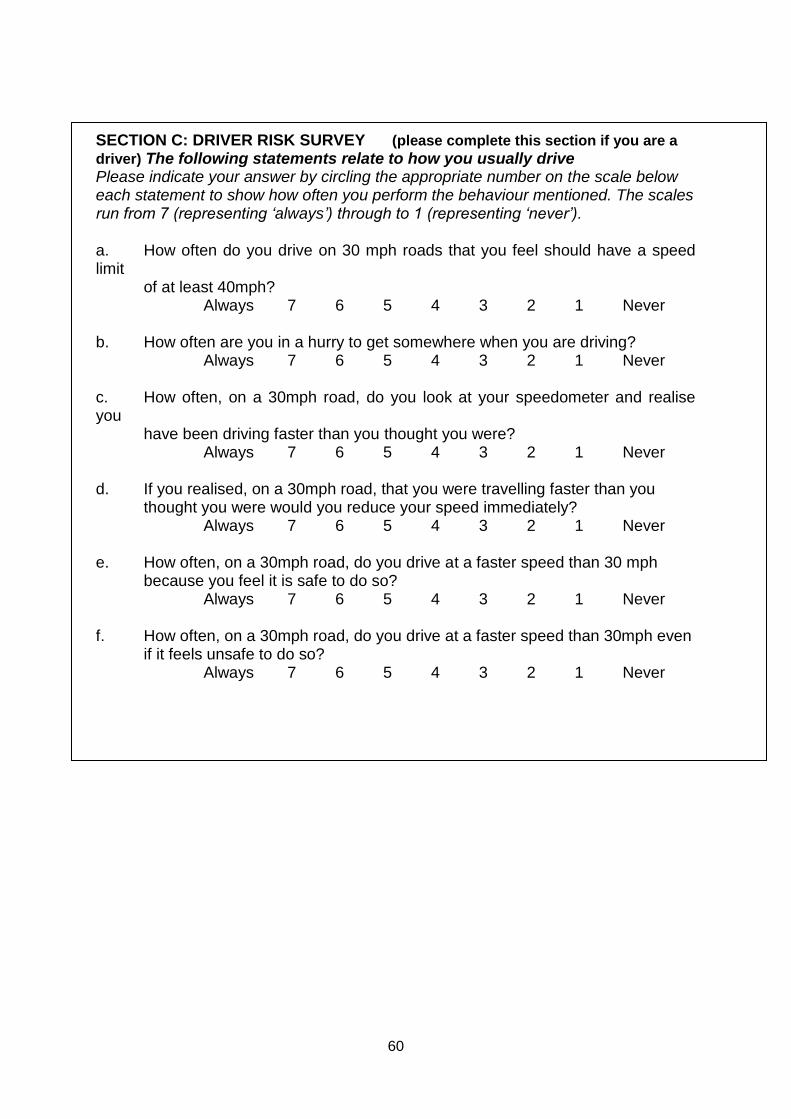
60
SECTION C: DRIVER RISK SURVEY (please complete this section if you are a
driver) The following statements relate to how you usually drive Please indicate your answer by circling the appropriate number on the scale below each statement to show how often you perform the behaviour mentioned. The scales run from 7 (representing ‘always’) through to 1 (representing ‘never’). a. How often do you drive on 30 mph roads that you feel should have a speed limit
of at least 40mph? Always 7 6 5 4 3 2 1 Never
b. How often are you in a hurry to get somewhere when you are driving?
Always 7 6 5 4 3 2 1 Never c. How often, on a 30mph road, do you look at your speedometer and realise you
have been driving faster than you thought you were? Always 7 6 5 4 3 2 1 Never
d. If you realised, on a 30mph road, that you were travelling faster than you
thought you were would you reduce your speed immediately? Always 7 6 5 4 3 2 1 Never
e. How often, on a 30mph road, do you drive at a faster speed than 30 mph
because you feel it is safe to do so? Always 7 6 5 4 3 2 1 Never
f. How often, on a 30mph road, do you drive at a faster speed than 30mph even
if it feels unsafe to do so? Always 7 6 5 4 3 2 1 Never
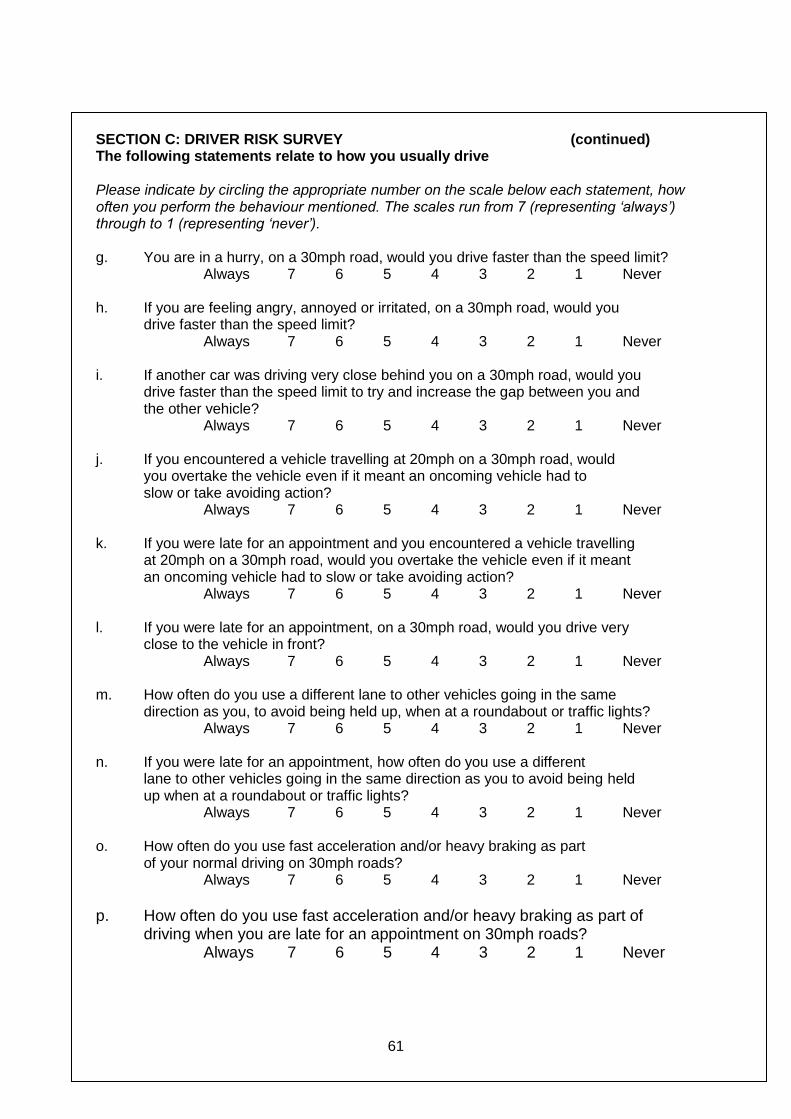
61
SECTION C: DRIVER RISK SURVEY (continued) The following statements relate to how you usually drive Please indicate by circling the appropriate number on the scale below each statement, how often you perform the behaviour mentioned. The scales run from 7 (representing ‘always’) through to 1 (representing ‘never’). g. You are in a hurry, on a 30mph road, would you drive faster than the speed limit?
Always 7 6 5 4 3 2 1 Never h. If you are feeling angry, annoyed or irritated, on a 30mph road, would you
drive faster than the speed limit? Always 7 6 5 4 3 2 1 Never
i. If another car was driving very close behind you on a 30mph road, would you
drive faster than the speed limit to try and increase the gap between you and the other vehicle?
Always 7 6 5 4 3 2 1 Never j. If you encountered a vehicle travelling at 20mph on a 30mph road, would
you overtake the vehicle even if it meant an oncoming vehicle had to slow or take avoiding action?
Always 7 6 5 4 3 2 1 Never k. If you were late for an appointment and you encountered a vehicle travelling
at 20mph on a 30mph road, would you overtake the vehicle even if it meant an oncoming vehicle had to slow or take avoiding action?
Always 7 6 5 4 3 2 1 Never l. If you were late for an appointment, on a 30mph road, would you drive very
close to the vehicle in front? Always 7 6 5 4 3 2 1 Never
m. How often do you use a different lane to other vehicles going in the same
direction as you, to avoid being held up, when at a roundabout or traffic lights? Always 7 6 5 4 3 2 1 Never
n. If you were late for an appointment, how often do you use a different
lane to other vehicles going in the same direction as you to avoid being held up when at a roundabout or traffic lights?
Always 7 6 5 4 3 2 1 Never o. How often do you use fast acceleration and/or heavy braking as part
of your normal driving on 30mph roads? Always 7 6 5 4 3 2 1 Never
p. How often do you use fast acceleration and/or heavy braking as part of
driving when you are late for an appointment on 30mph roads? Always 7 6 5 4 3 2 1 Never
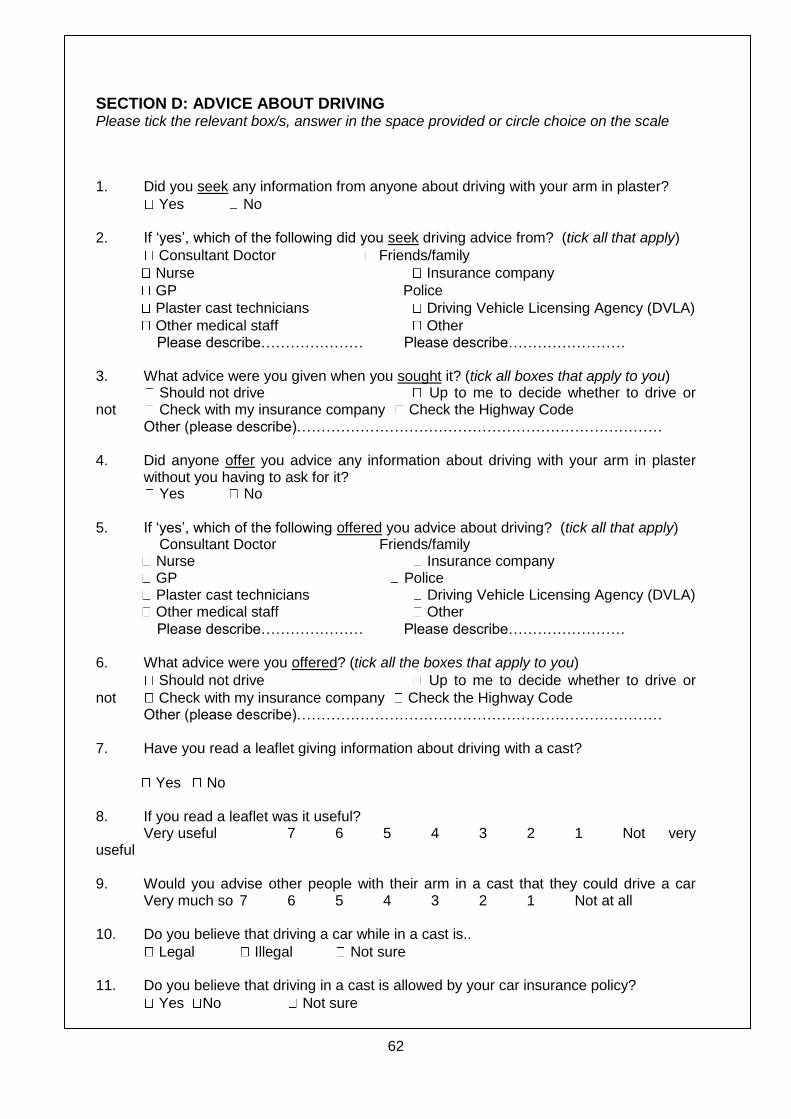
62
SECTION D: ADVICE ABOUT DRIVING Please tick the relevant box/s, answer in the space provided or circle choice on the scale
1. Did you seek any information from anyone about driving with your arm in plaster?
Yes No
2. If ‘yes’, which of the following did you seek driving advice from? (tick all that apply)
Consultant Doctor Friends/family
Nurse Insurance company
GP Police
Plaster cast technicians Driving Vehicle Licensing Agency (DVLA)
Other medical staff Other Please describe………………… Please describe…………………… 3. What advice were you given when you sought it? (tick all boxes that apply to you) Should not drive Up to me to decide whether to drive or not Check with my insurance company Check the Highway Code Other (please describe)………………………………………………………………… 4. Did anyone offer you advice any information about driving with your arm in plaster
without you having to ask for it? Yes No
5. If ‘yes’, which of the following offered you advice about driving? (tick all that apply) Consultant Doctor Friends/family Nurse Insurance company GP Police Plaster cast technicians Driving Vehicle Licensing Agency (DVLA) Other medical staff Other
Please describe………………… Please describe…………………… 6. What advice were you offered? (tick all the boxes that apply to you)
Should not drive Up to me to decide whether to drive or
not Check with my insurance company Check the Highway Code Other (please describe)………………………………………………………………… 7. Have you read a leaflet giving information about driving with a cast?
Yes No 8. If you read a leaflet was it useful? Very useful 7 6 5 4 3 2 1 Not very useful 9. Would you advise other people with their arm in a cast that they could drive a car Very much so 7 6 5 4 3 2 1 Not at all 10. Do you believe that driving a car while in a cast is..
Legal Illegal Not sure 11. Do you believe that driving in a cast is allowed by your car insurance policy?
Yes No Not sure
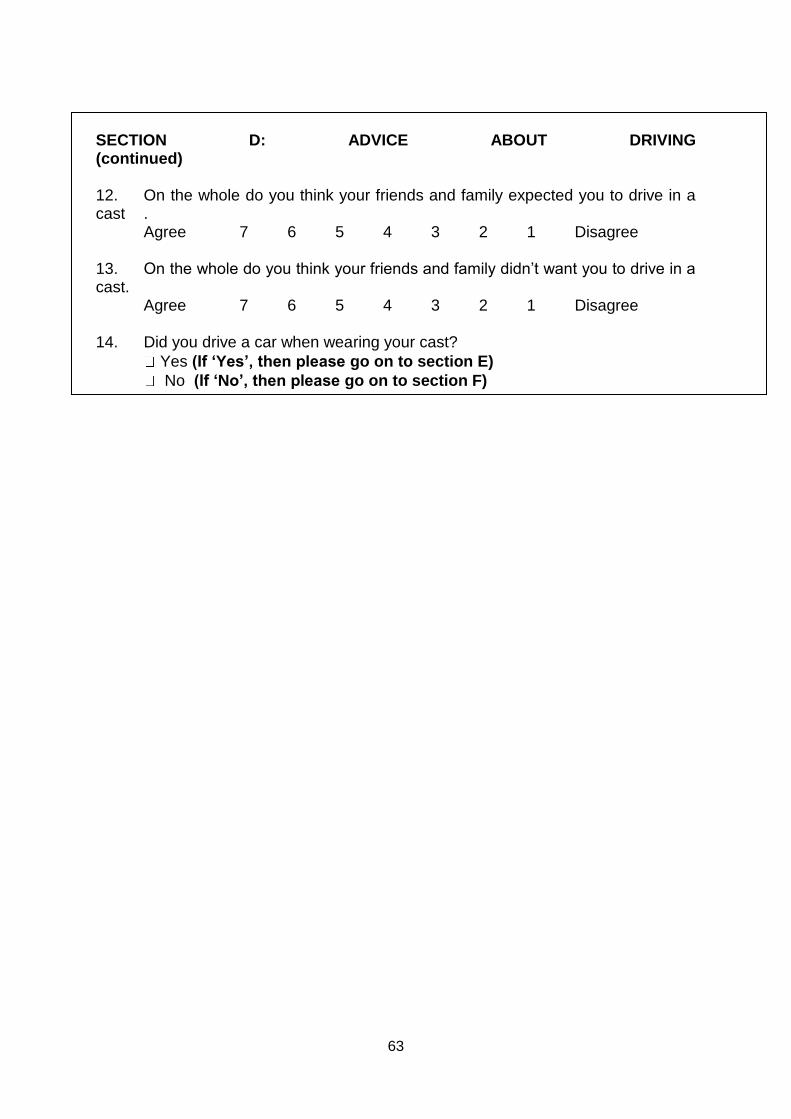
63
SECTION D: ADVICE ABOUT DRIVING (continued) 12. On the whole do you think your friends and family expected you to drive in a cast .
Agree 7 6 5 4 3 2 1 Disagree 13. On the whole do you think your friends and family didn’t want you to drive in a cast.
Agree 7 6 5 4 3 2 1 Disagree
14. Did you drive a car when wearing your cast?
Yes (If ‘Yes’, then please go on to section E)
No (If ‘No’, then please go on to section F)
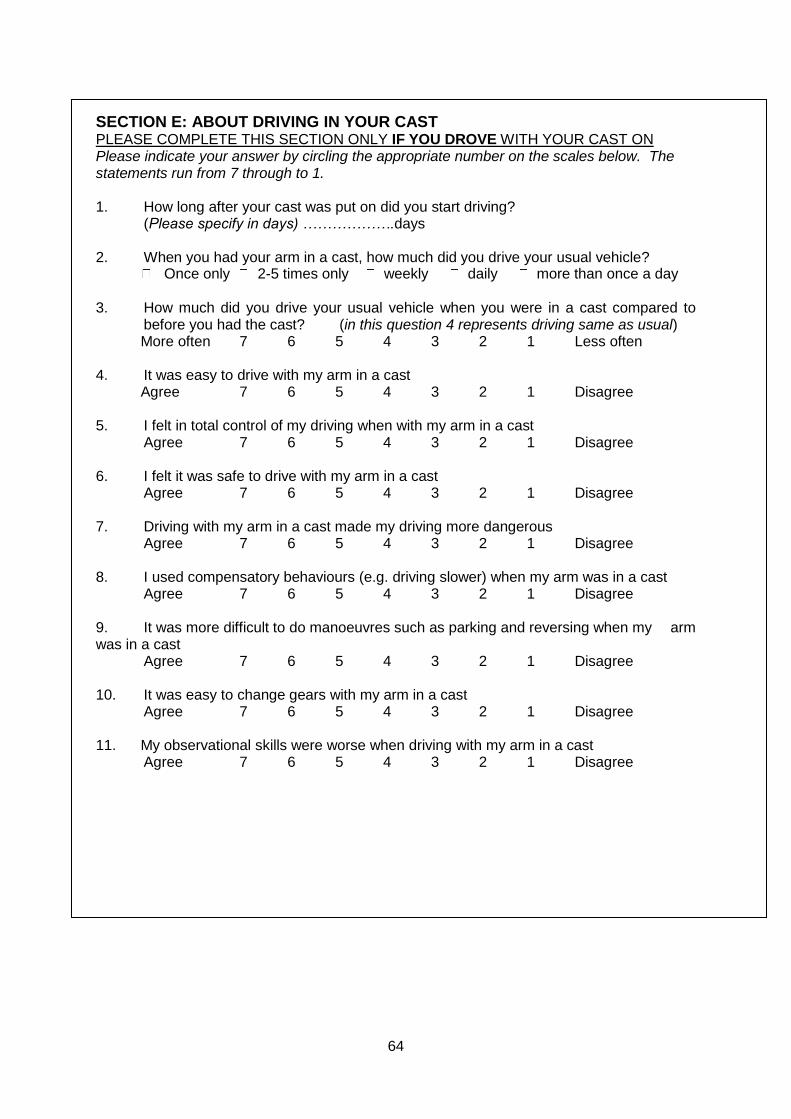
64
SECTION E: ABOUT DRIVING IN YOUR CAST PLEASE COMPLETE THIS SECTION ONLY IF YOU DROVE WITH YOUR CAST ON Please indicate your answer by circling the appropriate number on the scales below. The statements run from 7 through to 1. 1. How long after your cast was put on did you start driving?
(Please specify in days) ……………….days
2. When you had your arm in a cast, how much did you drive your usual vehicle? Once only 2-5 times only weekly daily more than once a day
3. How much did you drive your usual vehicle when you were in a cast compared to
before you had the cast? (in this question 4 represents driving same as usual) More often 7 6 5 4 3 2 1 Less often 4. It was easy to drive with my arm in a cast Agree 7 6 5 4 3 2 1 Disagree 5. I felt in total control of my driving when with my arm in a cast
Agree 7 6 5 4 3 2 1 Disagree 6. I felt it was safe to drive with my arm in a cast
Agree 7 6 5 4 3 2 1 Disagree 7. Driving with my arm in a cast made my driving more dangerous
Agree 7 6 5 4 3 2 1 Disagree 8. I used compensatory behaviours (e.g. driving slower) when my arm was in a cast
Agree 7 6 5 4 3 2 1 Disagree 9. It was more difficult to do manoeuvres such as parking and reversing when my arm was in a cast
Agree 7 6 5 4 3 2 1 Disagree 10. It was easy to change gears with my arm in a cast
Agree 7 6 5 4 3 2 1 Disagree 11. My observational skills were worse when driving with my arm in a cast
Agree 7 6 5 4 3 2 1 Disagree
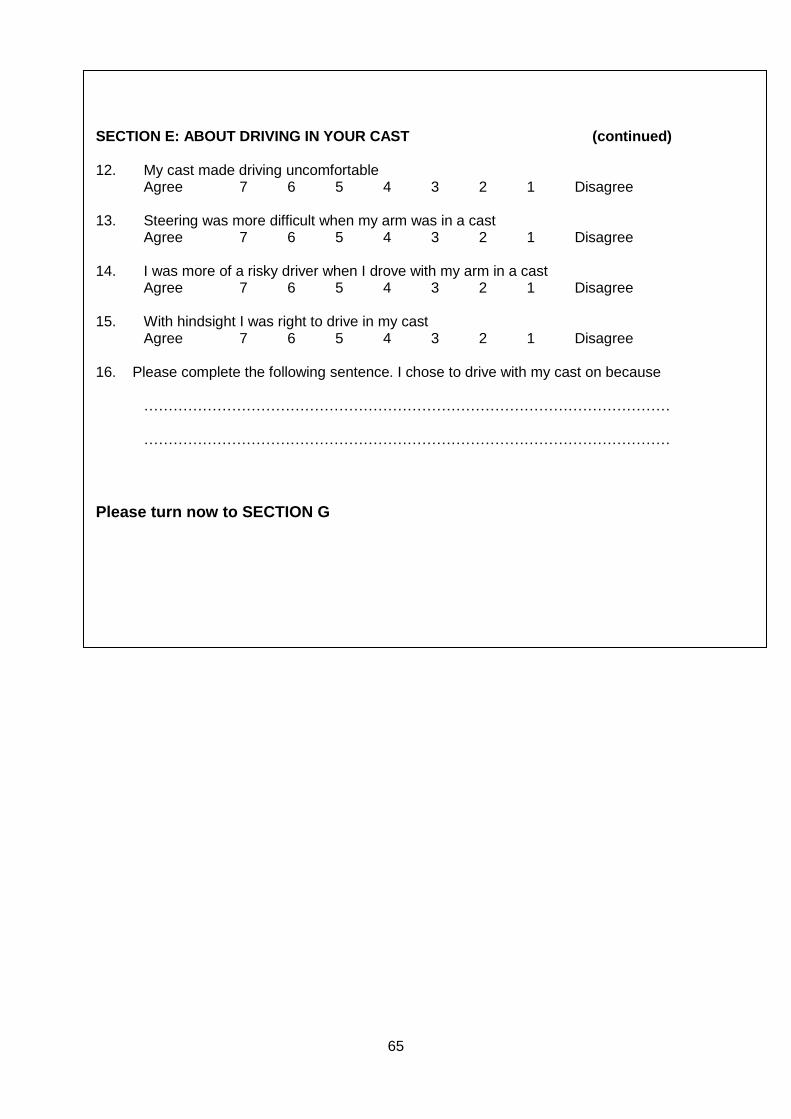
65
SECTION E: ABOUT DRIVING IN YOUR CAST (continued) 12. My cast made driving uncomfortable
Agree 7 6 5 4 3 2 1 Disagree 13. Steering was more difficult when my arm was in a cast
Agree 7 6 5 4 3 2 1 Disagree 14. I was more of a risky driver when I drove with my arm in a cast Agree 7 6 5 4 3 2 1 Disagree
15. With hindsight I was right to drive in my cast
Agree 7 6 5 4 3 2 1 Disagree
16. Please complete the following sentence. I chose to drive with my cast on because ……………………………………………………………………………………………… ………………………………………………………………………………………………
Please turn now to SECTION G
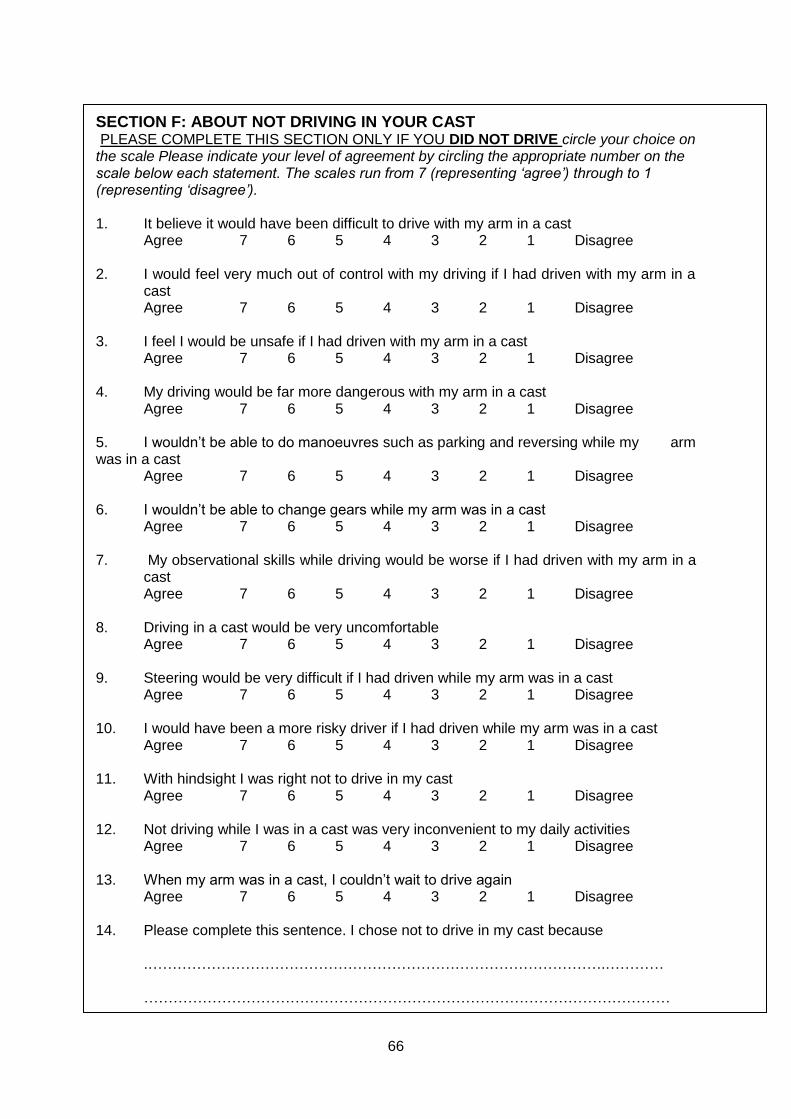
66
SECTION F: ABOUT NOT DRIVING IN YOUR CAST PLEASE COMPLETE THIS SECTION ONLY IF YOU DID NOT DRIVE circle your choice on the scale Please indicate your level of agreement by circling the appropriate number on the scale below each statement. The scales run from 7 (representing ‘agree’) through to 1 (representing ‘disagree’). 1. It believe it would have been difficult to drive with my arm in a cast
Agree 7 6 5 4 3 2 1 Disagree 2. I would feel very much out of control with my driving if I had driven with my arm in a cast
Agree 7 6 5 4 3 2 1 Disagree 3. I feel I would be unsafe if I had driven with my arm in a cast
Agree 7 6 5 4 3 2 1 Disagree 4. My driving would be far more dangerous with my arm in a cast
Agree 7 6 5 4 3 2 1 Disagree
5. I wouldn’t be able to do manoeuvres such as parking and reversing while my arm was in a cast
Agree 7 6 5 4 3 2 1 Disagree 6. I wouldn’t be able to change gears while my arm was in a cast
Agree 7 6 5 4 3 2 1 Disagree 7. My observational skills while driving would be worse if I had driven with my arm in a
cast Agree 7 6 5 4 3 2 1 Disagree
8. Driving in a cast would be very uncomfortable Agree 7 6 5 4 3 2 1 Disagree
9. Steering would be very difficult if I had driven while my arm was in a cast
Agree 7 6 5 4 3 2 1 Disagree 10. I would have been a more risky driver if I had driven while my arm was in a cast Agree 7 6 5 4 3 2 1 Disagree
11. With hindsight I was right not to drive in my cast
Agree 7 6 5 4 3 2 1 Disagree
12. Not driving while I was in a cast was very inconvenient to my daily activities Agree 7 6 5 4 3 2 1 Disagree 13. When my arm was in a cast, I couldn’t wait to drive again Agree 7 6 5 4 3 2 1 Disagree 14. Please complete this sentence. I chose not to drive in my cast because
.………………………………………………………………………………….………… ………………………………………………………………………………………………
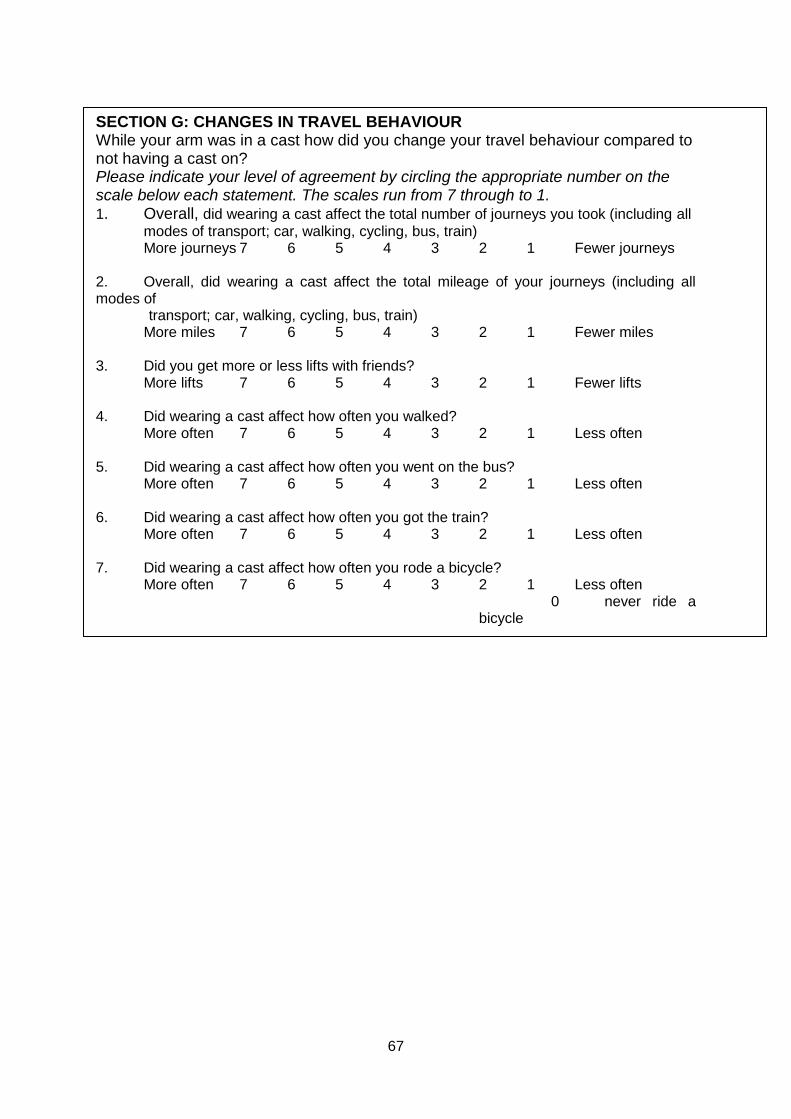
67
SECTION G: CHANGES IN TRAVEL BEHAVIOUR While your arm was in a cast how did you change your travel behaviour compared to not having a cast on? Please indicate your level of agreement by circling the appropriate number on the scale below each statement. The scales run from 7 through to 1. 1. Overall, did wearing a cast affect the total number of journeys you took (including all
modes of transport; car, walking, cycling, bus, train) More journeys 7 6 5 4 3 2 1 Fewer journeys 2. Overall, did wearing a cast affect the total mileage of your journeys (including all modes of transport; car, walking, cycling, bus, train) More miles 7 6 5 4 3 2 1 Fewer miles 3. Did you get more or less lifts with friends? More lifts 7 6 5 4 3 2 1 Fewer lifts 4. Did wearing a cast affect how often you walked? More often 7 6 5 4 3 2 1 Less often 5. Did wearing a cast affect how often you went on the bus? More often 7 6 5 4 3 2 1 Less often 6. Did wearing a cast affect how often you got the train? More often 7 6 5 4 3 2 1 Less often 7. Did wearing a cast affect how often you rode a bicycle? More often 7 6 5 4 3 2 1 Less often
0 never ride a bicycle
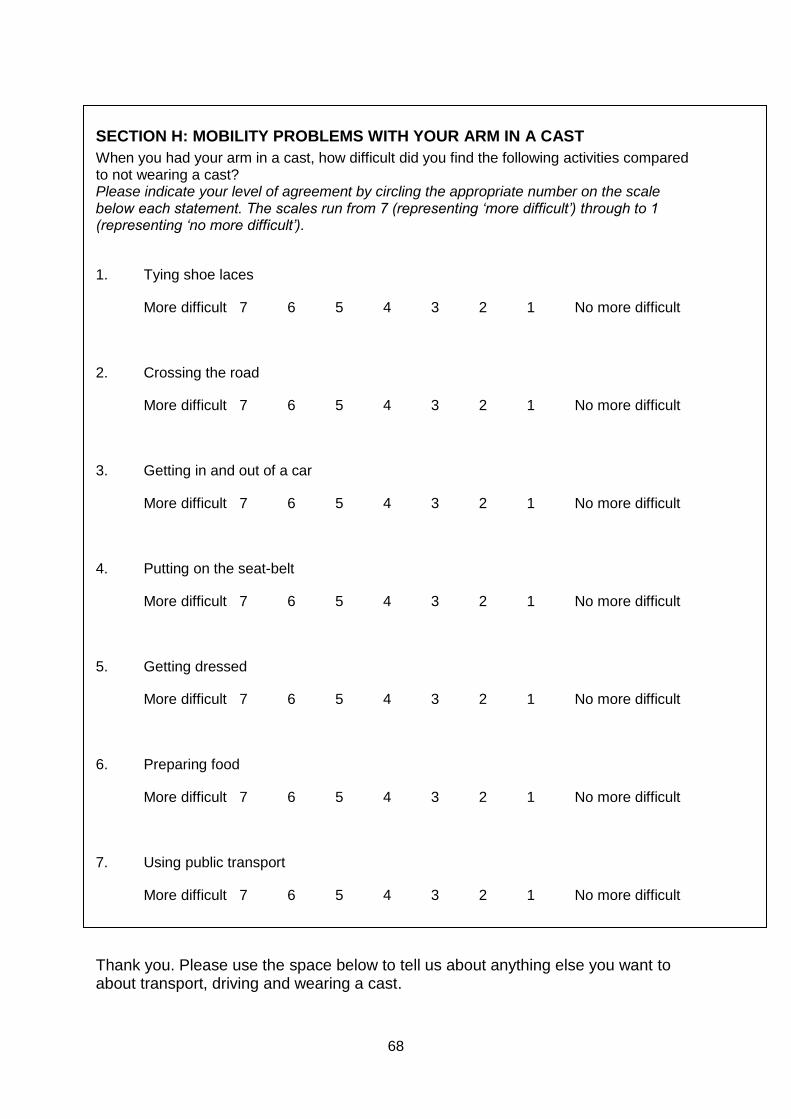
68
SECTION H: MOBILITY PROBLEMS WITH YOUR ARM IN A CAST
When you had your arm in a cast, how difficult did you find the following activities compared to not wearing a cast? Please indicate your level of agreement by circling the appropriate number on the scale below each statement. The scales run from 7 (representing ‘more difficult’) through to 1 (representing ‘no more difficult’).
1. Tying shoe laces
More difficult 7 6 5 4 3 2 1 No more difficult
2. Crossing the road
More difficult 7 6 5 4 3 2 1 No more difficult
3. Getting in and out of a car
More difficult 7 6 5 4 3 2 1 No more difficult
4. Putting on the seat-belt
More difficult 7 6 5 4 3 2 1 No more difficult
5. Getting dressed
More difficult 7 6 5 4 3 2 1 No more difficult
6. Preparing food
More difficult 7 6 5 4 3 2 1 No more difficult
7. Using public transport
More difficult 7 6 5 4 3 2 1 No more difficult
Thank you. Please use the space below to tell us about anything else you want to about transport, driving and wearing a cast.

69
Thank you very much for completing these questionnaires
and for taking part in this research study Please return the questionnaires in the stamped addressed envelope provided to:
Melissa Calcraft, Telephone 0117-323-5980
Physiotherapy Department, and leave a message if you Southmead Hospital, have any questions Westbury-on-Trym, Bristol BS10 5NB