Embed Size (px)
Citation preview

RESEARCH REPORT VTT-R-08804-12
Version 1.0/1.11.2012
Crack growth rate algorithms Authors: Ulla Ehrnstén
Confidentiality: Public
CG
R, m
/s
KI, MPa m


RESEARCH REPORT VTT-R-08804-121 (19)
Report’s title
Crack growth rate algorithms Customer, contact person, address Order reference
SAFIR 2014 programme
Dnro: 30/2012SAF
Project name Project number/Short name
RI-ISI Analyses and Inspection Reliability of Piping Systems RAIPSYS Author(s) Pages
Ulla Ehrnstén 19 / - Keywords Report identification code
Nuclear, crack growth rate algorithms, intergranular stress corrosion cracking
VTT-R-08804-12
Summary Crack growth rate algorithms for intergranular stress corrosion cracking are routinely used in structural integrity evaluations of nuclear components. In boiling water reactors (BWRs), the materials affected by stress corrosion cracking are both austenitic stainless steels and nickel-based alloys, while crack growth rate algorithms exist only for nickel-based alloys in pressurised water reactor (PWR) environment. The objective of this report is to summarise the publically available crack growth rate algorithms, which can be used in integrity evaluations into one report. The materials included are austenitic stainless steels of type 304 and 316, including sensitised materials as well as low carbon grades (L and LN) and nickel-based materials Alloy 600, 182, 82, 152, 132 and 52.
Confidentiality Public Espoo 28.1.2013 Written by Ulla Ehrnstén Principal Scientist
Reviewed by Otso Cronvall Senior Scientist, PM
Accepted by Eila Lehmus Technology Manager
VTT’s contact address PO Box 1000, Kemistintie 3, 02044 VTT, Finland Distribution (customer and VTT) Safi 2014 reference group 6 members, VTT archive, yvl database
The use of the name of the VTT Technical Research Centre of Finland (VTT) in advertising or publication in part of this report is only permissible with written authorisation from the VTT Technical Research Centre of Finland.

RESEARCH REPORT VTT-R-08804-122 (19)
Preface
Crack growth rate algorithms for intergranular stress corrosion cracking are routinely used in structural integrity evaluations of nuclear components. In boiling water reactors the materials affected by stress corrosion cracking are both austenitic stainless steels and nickel-based alloys, while crack growth rate algorithms exist only for nickel-based alloys in pressurised water reactor environment. The objective of this report is to summarise the publically available crack growth rate algorithms, which can be used in integrity evaluations into one report. The report is a part of the SAFIR 2014 RAIPSYS project. The funding and interest by the project manager Otso Cronvall for this task is appreciated. Espoo, 28.1.2013 Ulla Ehrnstén

RESEARCH REPORT VTT-R-08804-123 (19)
Contents
Preface ................................................................................................................................... 2
Contents ................................................................................................................................. 3
1. Introduction ....................................................................................................................... 4
2. Goal .................................................................................................................................. 4
3. Overview of crack growth rate algorithms for austenitic stainless steels ............................ 5
3.1 Sweden, stainless steel in BWR environment ........................................................... 5 3.2 USA, stainless steels in BWR environment ............................................................... 5 3.3 Japan, stainless steels in BWR environment ............................................................ 6 3.4 Summary of crack growth rate curves for stainless steels in BWR environments ...... 7
4. Overview of crack growth rate algorithms for nickel-based materials in BWR environments .................................................................................................................... 8
4.1 Sweden, Alloys 182, 82 and 600 in BWR environment ............................................. 8 4.2 USA, alloys 182, 82 and 600 in BWR environments ................................................. 9 4.3 Japan, Alloy 182, BWR NWC .................................................................................... 9 4.4 Summary of crack growth rate curves for alloys 600, 182 and 82 in BWR
environments .......................................................................................................... 10
5. Overview of crack growth rate algorithms for nickel-based materials in PWR environments .................................................................................................................. 11
5.1 Sweden, Alloy 600 and 182 in PWR environment ................................................... 11 5.2 USA, Alloy 600, 182, 82 and 132 in PWR environment ........................................... 12 5.3 Japan, Alloy 82 and 132 in PWR environment ........................................................ 13 5.4 France, Alloy 600 and 182 in PWR environment ..................................................... 13
6. Summary of CGR algorithms for austenitic materials in LWR environments ................... 15

RESEARCH REPORT VTT-R-08804-124 (19)
1. Introduction
Intergranular stress corrosion cracking (IGSCC) is one of the key degradation modes affecting austenitic materials in nuclear power plants (NPPs). Austenitic stainless steels may suffer from IGSCC in sensitised or non-sensitised but cold worked condition, while IGSCC in austenitic stainless steels is not usually considered to be a viable degradation mode in PWR conditions, although more and more plant experience on IGSCC in PWRs is developing. Nickel-based alloys may also suffer from IGSCC in BWR conditions. In PWR conditions, IGSCC is called primary water stress corrosion cracking (PWSCC), probably to differentiate between the primary and secondary side events in PWRs, and to make a distinction between IGSCC in stainless steels in BWRs and IGSCC in nickel-based alloys in PWRs.
Crack growth rate (CGR) algorithms for IGSCC and PWSCC are routinely used in safety analyses of nuclear components. To obtain reliable CGR algorithms, a large amount of reliable, high quality CGR data is needed. The available data must also be screened to select only valid data, and omit data which is not relevant for each case under consideration. Intergranular or interdendritic stress corrosion crack growth, which is the cracking mode under consideration, is dependent on the material, the environment and the stress. A CGR algorithm gives the CGR as a power law function of stress intensity factor, KI, i.e.:
nICKdtda (1-1)
where a is the crack depth, t is the time, C is an environmental parameter and n is a power exponent. The CGR algorithms are different for different plant types, i.e., BWR and PWR and additionally for different plant conditions, i.e. BWR NWC (normal water chemistry) and HWC (hydrogen water chemistry).
This report summarises publically available CGR algorithms and starts with those for stainless steels in BWR environments, continues with those for Ni-based materials in BWR environments before moving to algorithms for Ni-based materials in PWR environment. There is a multitude of algorithms, based on e.g. available data (from laboratory testing and field experience) and screening criteria. When available, the screening criteria are briefly reported for the different algorithms. The available data may be derived from tests performed at different temperatures (especially true for PWR conditions). The data is usually recalculated to one selected single temperature using the activation energy. The used activation energy value, again, may be different in different curves, resulting in differences between the curves.
The choice has been made in this report to entitle the chapters according to the country, where the algorithm has been developed, although the algorithms are not necessarily national. Authorities and utilities may apply different algorithms in structural integrity calculations, while other countries, like Finland, has not developed any algorithms of their own, but depend on internationally available algorithms.
2. Goal
This report summarises published CGR algorithms for austenitic materials used in BWRs and PWRs. The materials included are austenitic stainless steels of type 304 and 316, including sensitised materials as well as low carbon grades (L and LN) and nickel-based materials Alloy 600, 182, 82, 152, 132 and 52. Large international efforts are on-going to develop CGR algorithms for Alloy 690.

RESEARCH REPORT VTT-R-08804-125 (19)
3. Overview of crack growth rate algorithms for austenitic stainless steels
3.1 Sweden, stainless steel in BWR environment
A CGR algorithm for IGSCC in stainless steel, suggested by Jansson et al. in 1997 [1], is based on screened data from the open literature and on results from experiments performed by Swedish utilities. The database contained more than 750 data points. The algorithms are presented in Table 1 together with the algorithms presented in the Handbook of the Swedish authority (SSM) [2].
Table 1. IGSCC growth algorithm for austenitic stainless steels in BWR environments, presented by Jansson et al. and in the SSM Handbook [1, 2]. Material da/dt in m/s, KI in MPa m
Austenitic stainless steel, Jansson et al., BWR NWC
4.5 x 10⁻¹⁵ x KI 3.0 KI < 50 5.6 x 10⁻¹⁰ KI > 50
Austenitic stainless steel, Jansson et al., BWR HWC
2.0 x 10⁻¹⁶ x KI 3.0 KI < 50 2.5 x 10⁻¹¹ KI > 50
Austenitic stainless steel, SSM Handbook BWR NWC
1.46 x 10⁻¹⁵ x KI 3.0 KI < 55.5 2.5 x 10⁻¹⁰ KI > 55.5
Austenitic stainless steel, SSM Handbook, BWR HWC
7.04 x 10⁻¹⁷ x KI 3.0 KI < 55.5 1.2 x 10⁻¹¹ KI > 55.5
The following criteria were used in the evaluation of the Jansson et al. data [1]:
Material: sensitised austenitic stainless steel of type AISI 304, most data on heavily sensitised material
Conductivity: < 0.2 µS/cm (< 0.3 µS/cm)* Oxygen level: 100 ppb < O2 <600 ppb Constant load, near constant load, constant K or constant deflection, R > 0.9 Frequency: f <2.5 x 10⁻⁴ Hz CT- or WOL-specimens Corrosion potential: above - 70 mVSHE. Chloride: < 5 ppb Sulphate: < 5 ppb Cold worked material excluded
* Whether the screening of data was performed using a maximum conductivity level of 0.3 µS/cm as acceptance criteria instead of 0.2 µS/cm did not change the number of data points.
3.2 USA, stainless steels in BWR environment
The guidelines for calculating crack growth of a flaw that is left in a plant without repair are described in reference [3], where also the CGR algorithm selected by NRC is presented.

RESEARCH REPORT VTT-R-08804-126 (19)
The BWRVIP (BWR Vessel internals project) was established by EPRI in 1994 to address structural integrity issues arising from service related degradation, beginning with core shroud cracking. Data was made available from ABB-Atom, ANL and GE. The data was screened using pattern recognition. The following variables and range were considered [4]: Conductivity, 0.055 – 1.5 µS/cm Corrosion potential, ECP -575 - +250 mVSHE Temperature, T 210 – 289 C Stress intensity factor, KI 11 – 60 MPa m
Only data from static load and steady state conditions were included. The pattern recognition revealed a strong influence of the conductivity on the CGR, indications of plateau behaviour at high KI -values, a weak influence of ECP and a contradictory influence of the degree of sensitisation (EPR value). No plateau behaviour was included in the CGR algorithm for cracks with a depth less than 80% of wall thickness. The EPR value was omitted from the modelling. The best fit model for type 304 stainless steel is [4]:
567.356730ECP00362.0Cond787.0ln181.2ln 586.0
ABSI T
Kdtda (3.1-1)
where da/dt is the CGR in mm/s, KI is the stress intensity factor in MPa m, Cond is the average conductivity at room temperature in µS/cm, ECP is the electrochemical corrosion potential in mVSHE, and TABS is the temperature in K. Both KI dependent and KI independent CGR algorithms were derived for NWC (ECP of stainless steel ~+200mVSHE and average coolant conductivity 0.15µS/cm) and HWC (ECP of stainless steel ~-200mVSHE and average coolant conductivity 0.15µS/cm) conditions. The algorithms are relevant to heavily sensitised stainless steel material of type 304 and should be conservative for lightly sensitised or non-sensitised materials [4]. Table 2. CGR algorithms developed in the USA for austenitic stainless steels in BWR environments [4]. Material da/dt in m/s and KI in MPa m da/dt in in/h and KI in ksi in
Austenitic stainless steel NWC, NRC curve
2.53 x 10⁻¹³ (KI /1.099)2.161 3.590 x 10⁻⁸ x KI 2.161
Sensitised type 304 stainless steel, BWR NWC, BWRVIP curve*
1.129 x 10⁻¹³ KI 2.181
1.6 x 10⁻¹⁰
Sensitised type 304 stainless steel, BWR HWC, BWRVIP curve*
0.564 x 10⁻¹³ KI 2.181
7.8 x 10⁻¹¹
*The KI dependent algorithms are to be used for core shroud integrity calculations up to a crack depth of 80% of the wall thickness. The KI independent algorithm is to be used for deeper cracks.
3.3 Japan, stainless steels in BWR environment
The flaw evaluation concept according to the JSME rules are based on ASME, but with some differences in the dimensions of allowable flaw size (only applied to fatigue, not to IGSCC), in the rules for linear elastic calculations etc. [5].

RESEARCH REPORT VTT-R-08804-127 (19)
The IGSCC growth rates for stainless steels in BWR-environment according to JSME are given in Table 3 [6]. Table 3. Summary of the JSME IGSCC CGR algorithms for stainless steel in BWR environments [6]. Material da/dt in m/s, KI in MPa m
Sensitised type 304 SS, BWR high ECP (>+150 mV SHE)
1.43 x 10 -13 KI 2.161
Sensitised Type 304 SS, BWR, medium ECP (-70 - + 50 mV SHE)
6.31 x 10 -14 KI 2.161 KI < 54 3.5 x 10 -10 KI > 54
Low carbon austenitic stainless steels, BWR high ECP (>+150 mVSHE)
2.0 x10⁻¹² KI < 6.7 3.33 x 10⁻¹⁴ KI 2.161 6.7 KI 57.9 2.1 x 10⁻¹⁰ KI > 57.9
Austenitic stainless steels , BWR HWC
7.94 x 10 -15 KI 2.161 KI < 54 4.0 x 10 -11 KI > 54
3.4 Summary of crack growth rate curves for stainless steels in BWR environments
A summary of most CGR algorithms as CGR versus stress intensity factor for stainless steels in BWR environments is presented in Figure 1. The NRC curve for sensitised stainless steel shows the highest CGRs while the CGRs are lowest using the SSM Handbook curve for BWR HWC environment. Of course, these cannot really be compared, as the CGR algorithm must be chosen in accordance with the plant operation mode.
Figure 1. CGR versus stress intensity factor KI using different CGR algorithms for stainless steels in BWR environments. The curves in NWC environment are drawn with solid lines and those for HWC environment with dashed lines.
1.E-15
1.E-14
1.E-13
1.E-12
1.E-11
1.E-10
1.E-09
1.E-08
0 10 20 30 40 50 60 70 80
CG
R, m
/s
K, MPa m
CGR for stainless steels in BWR (NWC and HCW) environments
Jansson et al., BWR NWC Jansson et al. BWR HWC
SSM handbook, BWR NWC SSM Handbook, BWR HWC
EPRI, sens. SS, BWR NWC EPRI, BWR HWC
NRC, SS BWR NWC JSME, BWR high ECP
JSME, BWR HWC

RESEARCH REPORT VTT-R-08804-128 (19)
4. Overview of crack growth rate algorithms for nickel-based materials in BWR environments
In the following, the CGR algorithms for nickel-based materials, i.e., Alloys 600, 182 and 82 in BWR environments (NWC and HWC) are summarised.
4.1 Sweden, Alloys 182, 82 and 600 in BWR environment
In 1993, Morin et al. presented CGR algorithms presented in the Table 4 for the nickel based alloys Alloy 600, Alloy 182 weld metal and Alloy 82 weld metal [7]. The algorithms are based on literature data, which was screened with certain criteria, see below. Later, the Swedish utilities screened data from laboratory tests and from the Oskarshamn loop to evaluate a factor of improvement for Alloy 82 in correlation to Alloy 182. The equation is also presented in Table 4. [8] The factor of improvement of 2.9 was derived from the data. The SSM Handbook (HB) algorithms are presented in the same table [2].
Table 4. Summary of CGR algorithms developed in Sweden for alloys 600, 182 and 82 in BWR environments [2, 7]. Material da/dt in m/s, KI in MPa m
Alloy 600, BWR NWC, Morin et al. [2] 1.52 x 10 -15 KI 3.44
Alloy 600, BWR NWC, SSM Handbook [2] 3.52 x 10 -15 KI 3.0
Alloy 182 weld metal, BWR NWC, Morin et al. 2.71 x 10 -20 KI 6.98
Alloy 182 weld metal, BWR NWC, SSM HB 2.56 x 10 -17 KI 4.96 KI < 39
1.99 x 10⁻⁹ KI 39
Alloy 82 weld metal, BWR NWC , Morin et al. 2.65 x 10 -16 KI 3.44
Alloy 82 weld metal, BWR NWC , Efsing et al. 2.1 x 10 -19 KI 6.1 KI 30
2.2 x 10⁻¹⁰ KI > 30
Alloy 600 and 82, BWR HWC, Morin et al. 7.83 x 10 -17 KI 3.44
Alloy 600, BWR HWC , SSM HB 1.5 x 10 -14 KI 3.0
Alloy 182 weld metal, BWR HWC, Morin et al. 2.001 x 10 -21 KI 6.98
Alloy 182 weld metal, BWR HWC , SSM HB 6.77 x 10 -16 KI 3.23 KI < 48
1.82 x 10⁻¹⁰ KI 48
The experimental data in the Morin et al. study [7] include materials with the following heat treatment conditions:
Alloy 600: Mill annealed + low temperature sensitisation (LTS) at 400 C/200h and post weld heat treatment (PWHT) at 600 C/24 h,
Alloy 182: As welded and as welded + PWHT, Alloy 82: As welded.

RESEARCH REPORT VTT-R-08804-129 (19)
The experimental data was screened using the following acceptance criteria [7]:
Conductivity < 0.3 µS/cm, Good chemistry control, oxygen level above 250 ppb, Tests made according to ASTM-requirement, Constant load or near constant load R > 0.95, CT-specimens, Tests run 1980 or later, Corrosion potential measurement on test specimens, ECP above - 50 mVSHE.
Morin et al. [7] suggested also threshold stress intensity factor values of 30 MPa m for Alloy 600, 15 MPa m for Alloy 182 and 30 MPa m for Alloy 82. There is, however, data which indicate that the threshold values may be much lower, and therefore it is suggested, that the threshold data should are not to be used in safety assessment calculations.
4.2 USA, alloys 182, 82 and 600 in BWR environments
The Boiling Water Reactor Vessel and Internals Project, i.e. BWRVIP was formed in June 1994 by EPRI, to address structural integrity issues arising from service related degradation of BWR vessel internals [9]. Alloy 182 CGR data was chosen because this material experiences highest CGR in the BWR environment and thus, the associated CGRs conservatively bound Alloy 600 and Alloy 82 CGRs. A total amount of 590 data points were gathered and evaluated. The screened data were then used in the development of disposition curves (CGR algorithms) for BWR NWC and BWR NWC conditions. The data for BWR NWC conditions contain data within the following regime: 9 < KI < 45 ksi in, 0.055 < < 0.298 µS/cm and -575 < ECP < 160 mV SHE. The data basis for BWR HWC, defined as conditions where the ECP is below -230 mV SHE, conditions is much more restricted in amount of data, and the regimes for KI and has not been included in the reference [9]. Both algorithms are valid up to a KI level of 45 ksi in or 49.5 MPa m. The equations change to SI units with 1 ksi in = 1.099 MPa m and 1 in/h = 7.0556 x 10 -6 m/s. Table 5. CGR algorithms developed by EPRI for Alloys 600, 182 and 82 in BWR environments [9]. Materials da/dt in m/s, KI in MPa m da/dt in in/h, KI in ksi in Alloy 600, 182 and 82, BWR NWC
1.13 x 10⁻¹³ (KI /1.099)2.5 KI 27.5 3.53 x 10⁻¹⁰ KI > 27.5
1.6 x 10 -8 KI 2.5, KI 25 5.0 x 10 -5 KI > 25
Alloy 600, 182 and 82 BWR HWC
2.26 x 10⁻¹⁵ (KI /1.099)3.0 KI 27.5 3.53 x 10 -11 KI > 27.5
3.2 x 10 -10 KI 3.0 KI 25 5.0 x 10 -6 KI > 25
4.3 Japan, Alloy 182, BWR NWC
It was difficult to find CGR algorithms developed in Japan, not because they would not exist, but because most references are in Japanese language and therefore unfortunately impossible to utilise by the author. Some algorithms for Alloy 182 in BWR environment are presented in Table 6 [10].

RESEARCH REPORT VTT-R-08804-1210 (19)
Table 6. CGR algorithms developed in Japan for Alloys 182 and 132 in BWR NWC environment [10]. Material da/dt in m/s, KI in MPa m Alloy 182, JSME 2.0 x 10 -12 KI < 13.3
3 x 10-18 KI 5.186 13.3 < KI < 50.3
2 x 10 -9 KI > 50.3
4.4 Summary of crack growth rate curves for alloys 600, 182 and 82 in BWR environments
A summary of most CGR algorithms as CGR versus stress intensity factor for stainless steels in BWR environments is presented in Figure 2. As can be seen from the figure, the effect of HWC is clearly seen, i.e., the curves for NWC are clearly above those for HWC conditions.
Figure 2. CGR versus stress intensity factor KI using different CGR algorithms. The curves in NWC environment are drawn with solid lines and those for HWC environment with dashed lines.
1.E-13
1.E-12
1.E-11
1.E-10
1.E-09
1.E-08
0 10 20 30 40 50 60 70 80 90
CG
R, m
/s
K, MPa m
CGR for Alloys 600,182 and 82 in BWR (NWC and HCW) environments
Alloy 600, Morin, BWR NWC
Alloy 600, SSM Handbook, BWR NWC
Alloy 600, BWRVIP, BWR NWC
Alloy 182, JSME, BWR NWC
Alloy 82, Efsing et al., BWR NWC
Alloy 600, 182 and 82, BWR VIP, BWR HWC
Alloy 600 and 82, Morin et al. BWR HWC

RESEARCH REPORT VTT-R-08804-1211 (19)
5. Overview of crack growth rate algorithms for nickel-based materials in PWR environments
In the following, the CGR algorithms for Ni-based materials in PWR environment are summarised. It is well known that the CGR is higher along the weld metal dendrites compared to the opposite orientation. Further, a marked beneficial effect of stress relief heat treatment has been observed with 3-5 lower CGRs in heat treated materials in PWR environment. Cold work, again, results in higher CGRs. The CGR is also dependent on the amount of dissolved hydrogen, being highest close to the Ni/NiO boundary and lower at high as well as very low DH levels. The DH is also reported to affect crack initiation, with less susceptibility at very low DH levels. Much effort has been put internationally to obtain high quality CGR data. One of the challenges when testing weld metals is the uneven crack growth, which is typical for weld metals. This is also one of the screening factors for data.
5.1 Sweden, Alloy 600 and 182 in PWR environment
The CGR algorithms for different temperatures are presented in the SSM Handbook [2] and are also in Table 7, while the so called Ringhals curve for Alloy 182 is presented in Table 8 [11]. Ringhals NPP performed an evaluation of the available CGR data and used normal screening criteria (representative PWR environment, on-line crack growth monitoring, etc.). In cases, where several conditions had been applied to the same specimen, a minimum of 200 hours at each condition was set as a requirement for the data. The same apparent activation energy as used by most others, i.e. 130 kJ/mol, was used. Based on the data, they proposed a CGR algorithm in which one part is KI dependent and the other is not. Two different slopes were determined for the KI dependent part, of which only the steeper is included in the table, as the practical implication of using one or the other of the two KI dependent curves is negligible [11]. Table 7. Summary of CGR algorithms presented in the Swedish SSM Handbook for Alloys 600 and 182 in PWR environment [2]. Material da/dt in m/s, KI in MPa m Alloy 600, 290 C 4.0 x 10 -22 KI 7.5 KI < 30
4.79 x 10⁻¹¹ KI 30
Alloy 600, 320 C 7.0 x 10 -20 KI 6.5 KI < 30 2.79 x 10⁻¹⁰ KI 30
Alloy 600, 345 C 1.6 x 10 -19 KI 6.5 KI < 30 6.39 x 10⁻¹⁰ KI 30
Alloy 182, 290 C 1.47 x 10⁻¹⁰
Alloy 182, 320 C 3.61 x 10 -18 KI 5.76 KI < 27.5
7 x 10⁻¹⁰ KI 27.5
Alloy 182, 345 C 1.05 x 10 -17 KI 5.76 KI < 26.7 1.74 x 10⁻⁹ KI 26.7

RESEARCH REPORT VTT-R-08804-1212 (19)
Table 8. The “Ringhals” CGR algorithms for Alloy 182 in PWR environment [11]. Material da/dt in m/s, KI in MPa m Alloy 182, “Ringhals”, 320 C 5.79 x 10 -23 KI
9.3 KI < 25.1 6.0 x 10 -10 KI > 25.1
5.2 USA, Alloy 600, 182, 82 and 132 in PWR environment
EPRI MRP has developed CGR algorithms for Alloy 600, which are presented in the report MRP-55 and also included in ASME, Section XI, appendix O [12]. After issuing the MRP-55 report, work was continued to derive a disposition curve also for nickel-based weld metals. A preliminary MRP CGR curve was published in a proprietary MRP-21 report in 2000, and was made publically available in 2002. This curve has since been updated based on a data set comprising a total amount of 261 data points, of which 184 points were excluded in the screening. The work explaining the screening procedure in detail together with the algorithms were published in the report MRP-115 in 2004. The algorithms are presented in Table 9 [13]. Table 9. Summary of the MRP-55 and MRP-115 CGR algorithms for Alloy 600, 182, 82 and 132 in PWR environment [13]. Material da/dt in m/s, KI in MPa m Alloy 600, MRP-55 2.67 x 10 -12 (KI - 9)1.16
Alloy 182 and 132, MRP-115, T=325 C 1.5 x 10 -12 KI
1.6
Alloy 82, MRP-115, T=325 C ((1.5 x 10 -12)/2.6) x KI
1.6
For crack propagation that is clearly perpendicular to the dendrite orientation, a factor of 2.0 lowering the CGR may be applied to the curves for Alloy 182, 132 and 82. The screened data for MRP-115 show certain characteristics, when the selected screening criteria (in total 16 different criteria) were applied [13]: Stress intensity factors were between 19.7 and 60.0 MPa m for Alloy 182/132 specimens
and between 28.0 and 56.8 MPa m for Alloy 82. A combination of purely constant loading and periodic partial unloading. Cyclic loading
parameters include load rations, R, between 0.65 and 0.75 and hold times between 2600 and 100 000 seconds.
Three of six possible orientations, of which two are parallel to the dendrite orientation, i.e., T-S and L-S and one, T-L, is perpendicular to the dendrite orientation. Temperature between 316 and 360 C. The data was recalculated to a temperature of 325 C assuming thermal activation energy of 130 kJ/mol.
Screening criteria for the environment: hydrogenated high-temperature water with low levels of impurities, with or without lithium and boric acid additions to simulate PWR primary water environment. Demonstration of careful control of the hydrogen concentration. Hydrogen concentration within PWR primary water specifications.
Crack growth criteria: more than 0.5 mm average crack growth and more than 50% intergranular crack engagement across the specimen width required. Zero crack growth shall not be included in the calculation of the average CGR. The average CGR was used rather than the maximum.
Load criteria: fulfilment of the Linear Elastic Fracture Mechanics (LEFM) criteria. No stress intensity factor threshold value was applied, as it was concluded that there is
insufficient evidence for such a threshold.

RESEARCH REPORT VTT-R-08804-1213 (19)
5.3 Japan, Alloy 82 and 132 in PWR environment
JNES has proposed a CGR algorithm for Alloy 132 as presented in Table 10 [14]. Table 10. CGR algorithm for Alloy 132 and 82, proposed by JNES and based on experimental data [14]. Material da/dt in m/s, KI in MPa m Alloy 132, PWR, 325 C 1.7 x 10⁻¹⁴ KI
2.42
5.4 France, Alloy 600 and 182 in PWR environment
The French CGR algorithms are based on results from constant load CGR experiments, where each specimen is tested in one condition only. The Alloy 182 data was determined at temperatures between 290 C and 360 C, and an activation energy value of 130 kJ/mol has been used to recalculate the results to one specific temperature. The hydrogen content in the tests was between 25 and 50 cc/kg, the KI levels between 15 and 65 MPa m, and a lower threshold value of 9 MPa m has been assumed. The evaluation of the data imply an improvement factor of 2 for stress relieving, while 5% cold work increase the CGR by a factor of 2 for vessel head penetrations. The beneficial effect of stress relieving on initiation is, though, dependent on many parameters, and full benefit cannot always be ascertained. The CGR in the dendrite orientation is 2-5 times higher than in the perpendicular orientation [15]. Alloy 82 is also susceptible to stress corrosion cracking, but the initiation time is assumed to be at least 6 time longer at high stress level, and the CGRs are assumed to be at least 2.6 times slower than those of Alloy 182 [16]. Table 11. Summary of French CGR algorithms for Alloy 600 and 182 in PWR environment [15]. Material da/dt in m/s, KI in MPa m Alloy 600 (modified Scott curve at 330 C) 2.8 x 10 -12 (KI - 9)1.16
Alloy 600 (EDF curve), 320 C 7.10 -10 (KI - 9) 0.1
Alloy 182 (EDF curve for 75% cumulative distribution of CGRs), 325 C
0.51 x 10 –10 KI 0.4
Alloy 182 (EDF curve for maximum CGRs), 325 C
0.5114 x 10 -10 (KI - 9)0.42
The EDF curve for Alloy 600 is reflecting the maximum CGRs at 325 C.
RESEARCH REPORT VTT-R-08804-1214 (19)
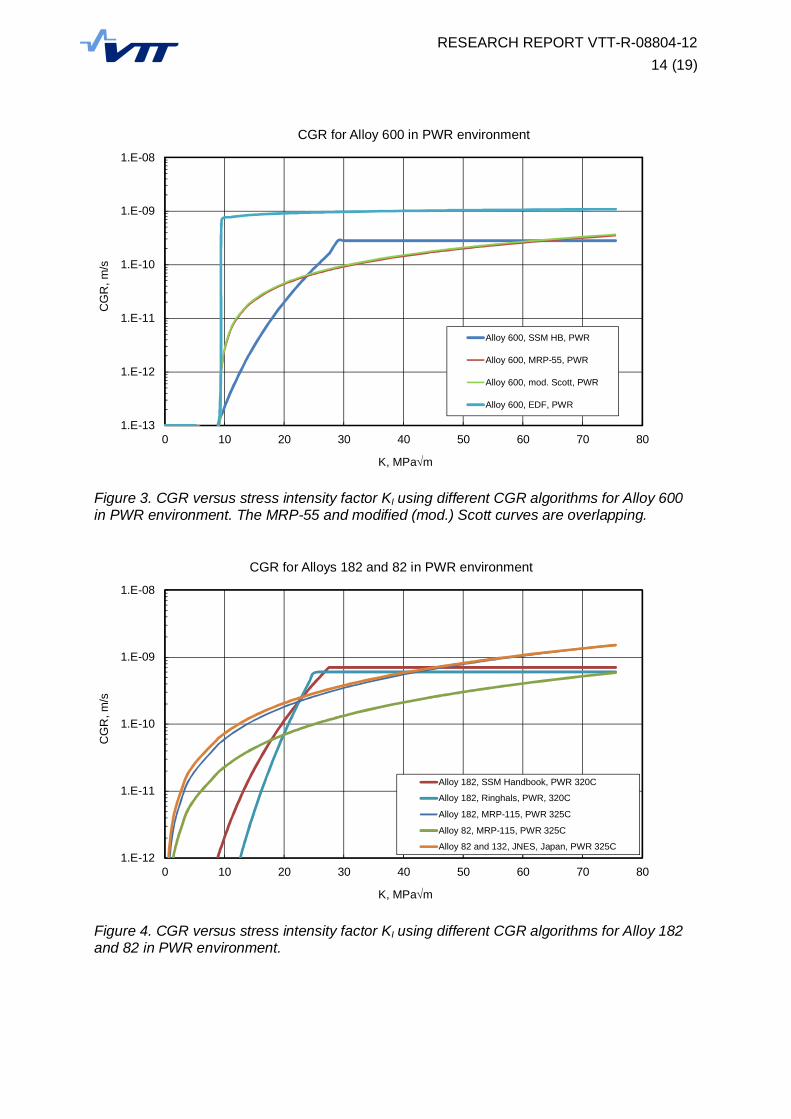
Figure 3. CGR versus stress intensity factor KI using different CGR algorithms for Alloy 600 in PWR environment. The MRP-55 and modified (mod.) Scott curves are overlapping.
Figure 4. CGR versus stress intensity factor KI using different CGR algorithms for Alloy 182 and 82 in PWR environment.
1.E-13
1.E-12
1.E-11
1.E-10
1.E-09
1.E-08
0 10 20 30 40 50 60 70 80
CG
R, m
/s
K, MPa m
CGR for Alloy 600 in PWR environment
Alloy 600, SSM HB, PWR
Alloy 600, MRP-55, PWR
Alloy 600, mod. Scott, PWR
Alloy 600, EDF, PWR
1.E-12
1.E-11
1.E-10
1.E-09
1.E-08
0 10 20 30 40 50 60 70 80
CG
R, m
/s
K, MPa m
CGR for Alloys 182 and 82 in PWR environment
Alloy 182, SSM Handbook, PWR 320C
Alloy 182, Ringhals, PWR, 320C
Alloy 182, MRP-115, PWR 325C
Alloy 82, MRP-115, PWR 325C
Alloy 82 and 132, JNES, Japan, PWR 325C

RESEARCH REPORT VTT-R-08804-1215 (19)
6. Summary of CGR algorithms for austenitic materials in LWR environments
All algorithms presented in this review are collected in Table 12, as sorted by material and environment.
Table 12. Summary of all CGR algorithms presented in this review presented per material and environments. The HWC is underlined to highlight the different environments. Material Environment da/dt in m/s, KI in MPa m Austenitic stainless steel, Jansson et al., Sweden
BWR NWC 4.5 x 10⁻¹⁵ x KI 3.0 KI < 50 5.6 x 10⁻¹⁰ KI > 50
Austenitic stainless steel, Jansson et al., Sweden
BWR HWC 2.0 x 10⁻¹⁶ x KI 3.0 KI < 50 2.5 x 10⁻¹¹ KI > 50
Austenitic stainless steel, SSM HB, Sweden
BWR NWC 1.46 x 10⁻¹⁵ x KI 3.0 KI < 55.5 2.5 x 10⁻¹⁰ KI > 55.5
Austenitic stainless steel, SSM HB, Sweden
BWR HWC 7.04 x 10⁻¹⁷ x KI 3.0 KI < 55.5 1.2 x 10⁻¹¹ KI > 55.5
Austenitic stainless steel, NRC, US
BWR NWC 2.53 x 10⁻¹³ (KI /1.099)2.161
Sensitised type 304 stainless steel, EPRI, US
BWR NWC 1.129 x 10⁻¹³ KI 2.181
Low carbon austenitic stainless steels, Japan
BWR high ECP
3.33 x 10 -14 x KI 2.161,6.7 KI 57.9
Sensitised type 304 SS, Japan BWR high ECP
1.43 x 10 -13 x KI 2.161
Sensitised Type 304 SS BWR medium ECP
6.31 x 10 -14 x KI 2.161 KI < 54 3.5 x 10 -10 KI > 54
Austenitic stainless steels BWR HWC 7.94 x 10 -15 x KI 2.161 KI < 54 4.0 x 10 -11 KI > 54

RESEARCH REPORT VTT-R-08804-1216 (19)
Table 12. Continued. Alloy 600, Morin et al., Sweden BWR NWC 1.52 x 10 -15 KI 3.44
Alloy 600, SSM HB, Sweden BWR NWC 3.52 x 10 -15 KI 3.0
Alloy 600, 182 and 82, EPRI, US BWR NWC 1.13 x 10⁻¹³ (KI /1.099)2.5 KI 27.5
3.53 x 10⁻¹⁰ KI > 27.5
Alloy 600 and 82, Morin et al., Sweden
BWR HWC 7.83 x 10 -17 KI 3.44
Alloy 600, SSM HB, Sweden BWR HWC 1.5 x 10 -14 KI 3.0
Alloy 600, 182 and 82, EPRI, US BWR HWC 2.26 x 10⁻¹⁵ (KI /1.099)3.0 KI 27.5 3.53 x 10 -11 KI > 27.5
Alloy 182, Morin et al., Sweden BWR NWC 2.71 x 10 -20 KI 6.98
Alloy 182, SSM HB, Sweden BWR NWC 2.56 x 10 -17 KI 4.96 KI < 39
1.99 x 10⁻⁹ KI 39
Alloy 182, JSME, Japan BWR NWC 2.0 x 10 -12 KI <13.3
3 x 10-18 KI 5.186 13.3 < KI < 50.3
2 x 10 -9 KI >50.3
Alloy 182, Morin et al., Sweden BWR HWC 2.001 x 10 -21 KI 6.98
Alloy 182, SSM HB, Sweden BWR HWC 6.77 x 10 -16 KI 3.23 KI < 48 1.82 x 10⁻¹⁰ KI 48
Alloy 82, Morin et al., Sweden BWR NWC 2.65 x 10 -16 KI 3.44
Alloy 82 weld metal, Efsing et al., Sweden
BWR NWC 2.1 x 10 -19 KI 6.1 KI 30
2.2 x 10⁻¹⁰ KI > 30

RESEARCH REPORT VTT-R-08804-1217 (19)
Table 12. Continued. Alloy 600, SSM HB, Sweden (320 °C) PWR 7.0 x 10 -20 KI 6.5 KI < 30
2.79 x 10⁻¹⁰ KI 30
Alloy 600, MRP-55, US PWR 2.67 x 10 -12 (KI - 9)1.16
Alloy 600, mod. Scott, France PWR 2.8 x 10 -12 (KI - 9)1.16
Alloy 600, EDF, France PWR 7.10 -10 (KI - 9) 0.1
Alloy 182, SSM HB (320 °C) PWR 3.61 x 10 -18 KI 5.76 KI < 27.5
7 x 10⁻¹⁰ KI 27.5
Alloy 182, Ringhals, Sweden PWR 5.79 x 10 -23 KI 9.3 KI <25.1
6.0 x 10 -10 KI > 25.1
Alloy 182 and 132, MRP-115, US
PWR 1.5 x 10 -12 KI 1.6
Alloy 182 EDF 75% cum., France
PWR 0.51 x 10 –10 KI 0.4
Alloy 182, EDF max, France PWR 0.5114 x 10 -10 (KI - 9)0.42
Alloy 132, Japan PWR 1.7 x 10⁻¹⁴ KI
2.42
Alloy 82, MRP-115, US PWR ((1.5 x 10 -12)/2.6) x KI 1.6
Alloy 82 and 132, Japan PWR 2.3 x 10 -12 KI
1.5

RESEARCH REPORT VTT-R-08804-1218 (19)
References:
1. Jansson, C., Morin, U., ‘Assessment of Crack Growth Rates in Austenitic Stainless Steels in Operating BWRS’. Proc. Eight International Symposium on Environmental Degradation of Materials in Nuclear power Systems - Water Reactors. August 10 - 14, 1997. Amelia Island, Florida. Pp. 667-674.
2. Dillström, P et al. A combined deterministic and probabilistic for safety assessment of components with cracks - Handbook. Strålsäkerhetsmydigheten Report 2008:1. Available on-line at: http://www.stralsakerhetsmyndigheten.se/Global/Publikationer/ Rapport/Sakerhet-vid-karnkraftverken/2008/SSM-Rapp-2008-01.pdf.
3. NUREG-0313, "Technical Report on Material Selection and Processing Guidelines for BWR Coolant Pressure Boundary Piping," U.S. Nuclear Regulatory Commission, July 1977, (Rev. 1) July 1980, (Rev. 2) January 1988.
4. Carter, R and Pathania, R. Technical basis for BWRVIP stainless steel crack growth correlations in BWRs. Proceedings of PVP 2007, July 22 – 26, San Antonio, Texas, USA. Paper No 26618, 10 p.
5. Kobayashi, H., Kashima, K. Overview of JSME flaw evaluation code for nuclear power plants. Pressure Vessels and piping 77 (2000). Pp. 937 - 944.
6. Shoji, T et al., Deterministic prediction of stress corrosion crack growth rates in high temperature water by combination interface oxidation kinetics and crack tip asymptotic field. Proceedings of PVP 2008, July 27 – 31, Chicago, Illinois, USA. Paper No 61417, 28 p.
7. Morin, U., Jansson, C., Bengtsson, B.: Crack Growth Rates for Ni-base Alloys with the Application to an operating BWR. Proc. Sixth International Symposium on Environmental Degradation of Materials in Nuclear power Systems-Water reactor Systems. August 1-5, 1993, San Diego, California. Pp. 373-378.
8. Efsing, P. et al. IGSCC disposition curves for Alloy 82 in BWR normal water chemistry. Proc. 13th International Symposium on Environmental Degradation of Materials in Nuclear power Systems-Water reactor Systems. August 19-23, 2007, Whistler, British Columbia, Canada. 11 p.
9. Pathania, R., Carter, R. Nickel alloy crack growth correlations in BWR environment and application to core support structure weld evaluation. Proceedings PVP2008, ASME pressure vessels and piping division conference, July 27 – 31, 2008, Chicago, Illinois, USA. Paper No 61299, 8 p.
10. Reference 7: Codes for nuclear power generation facilities – rules on fitness for service for nuclear power plants, JSME S NAI-2004 in Bosch, R. and Van Dyck, S. SCC pilot study RA3, Nulife (08)23, September 2008. Confidential.
11. Jenssen, A. et al., Structural assessment of detected nozzle safe-end welds in Ringhals 3 and 4. Proceeding of the 14th International Symposium on Environmental Degradation of Materials in Nuclear power Systems-Water reactor Systems, ANS, August 23-27, 2009, Virginia beach, Virginia, USA.
12. ASME Boiler and Pressure Vessel Code, Section XI. 2010 Edition.
13. White, G. et al., Development of crack growth rate disposition curves for primary water stress corrosion cracking (PWSCC) of alloys 82,182, and 132 weldments.

RESEARCH REPORT VTT-R-08804-1219 (19)
Proceeding of the 12th International Symposium on Environmental Degradation of Materials in Nuclear power Systems-Water reactor Systems. Ed.T.R Allen, P.J King and L. Nelson, TMS, 2005. Pp 511 – 531.
14. Ogawa, N et al., Sensitivity analysis of SCC crack extension simulation. Proceedings PVP 2011, July 17-21, 2011, Baltimore Maryland, USA. Paper No 57454, 8p.
15. Le Hong, S. et al., Measurements of stress corrosion cracking growth rates in weld alloy 182 in primary water of PWRs. Proceeding of the 10th International Symposium on Environmental Degradation of Materials in Nuclear power Systems-Water reactor Systems. August 5-9 2001, Harveys Resort and Casino, Lake Tahoe, Nevada, USA.
16. Vaillant. F. et al., Environmental behaviour and weldability of Ni-base weld metals in PWRs. RGN No 6, Novembre-Decembre 2007. 10 p.


![AOSA | SCST – Association of Official Seed Analysts ... · Web viewFor Method 1, place 400 seeds on blotters moistened withgibberellic acid [GA3; 0.055% (500 ppm)] and germinate](https://img.pdfslide.net/doc/110x75/60cc11529c748634003d78cb/aosa-scst-a-association-of-official-seed-analysts-web-view-for-method-1.jpg)