Embed Size (px)
Citation preview

RESEARCH STUDY OF A
CO^ LASER RADAR TRANSMITTER
I I
v CM
SEMIANNUAL TECHNICAL SUMMARY REPORT
June 1967
Prepared by
Perry A. Miles Frank A. Horrigan
Raytheon Research Division
Waltham, Massachusetts 02154
*n
I I I [ L I
Reproduction in whole or in part is permitted for any purpose of the United States Government.
(This research is part of Project DEFENDER under the joint sporsorship of the Advanced Research Project Agency, the Office of Naval Research, and the Departm. nt of Defense.) f . *♦»>
mmwi i w .fti ""5
f
,v\ JUN Z 7 196/
5^
\

S-970
RESEARCH STUDY OF A C02 LASER RADAR TRANSMITTER
Semiannual Technical Sumrr ary Report
1 November 1966 throup'i 1 May 1967
Prepared by
Perry A. Miles Frank A. Hcrrigan
Raytheon Research Division
Waltham, Massachusetts 02154
ARPA Order No. 306
Project No. NP 015-714
Contract No. N00014-67-C0264
Distribution of this document is unlimited. It may be released to the Clearinghouse, Department of Commerce, for sale to the general public.

D TABLE OF CONTENTS
j
L
Page
I. INTRODUCTION 1
II. REVIEW , 4
A. Molecular Level Populations and Dynamics 4
B. Energy Storage and Gain Characteristics 9
C Conversion Efficiency in Oscillators and Amplifiers. ... 15
III GAIN AND SATURATION MEASUREMENTS IN DC-EXCITED AMPLIFIERS 17
A. Spurious Oscillations 24
B. Super Radiance Effects 27
IV. PULSE AMPLIFICATION IN DC-EXCITED AMPLIFIERS 28
V. PULSE FORMATION AND AMPLIFICATION IN PULSE- EXCITED AMPLIFIERS 35
VI. RFFRACTIVE AND DISTORTION EFFECTS IN AMPLIFIERS 41
VII. OPTICAL MATERIALS 44
VIII. PRESENT STATE OF THE TRANSMITTER DEVELOPMENT. 46
IX. SUMMARY 48
REFERENCES 49
[
L
L
\

Figure
3
4
10
11
12
13
14
15
16
17
18
LIST OF ILLUSTRATIONS
Title Page
Vibrational-Rotational Ener^v Levels of JO2 Involved in Laser Emission 5
Effect of the Addition of Helium on the Frequency Distribution of Laser Output 6
Molecular Level Dynamics in the COo Laser 8
Peak Gain vs Tube Diameter for N2-CO2 and N2-CO2- He Mixes 11
Radial Profile of Single-Pass Gain of a One-Meter Long, Two-Inch Diameter Laser Tube with 15 cfm Pump for Various Currents 13
Experimental Arrangement for High-Power Amplifica- tion Measurements 18
Plots of In (G- 1) vs Input Power for Various Values of QoL 21
Experimental Data for a 3-Meter Amplifier Plotted as In G vs Pin (G-1) 22
Experimental Datü from Kogelnik and Bridges for a 5- Meter Amplifier Plotted as In G vs Pin (G-1) 23
Spurious Oscillation Pulse in a de-Excited Amplifier. . 26
Self-Oscillation Signal Produced by Reflections from the Chopper Blade 26
Pulse Distortion Produced on Amplification 29
Time-Dependent Amplification in a Discharge Excited by 60 cps Current 29
Large Signal Gain Observed as a Function of Time for a Single Input Pulse - 31
Experimental Results on Pulse Amplification 33
Gain Enhancement Under Pulse Excitation 36
Deterioration of Gain in Pulse-Excited Amplifiers ... 36
Pulse Emission Profiles Generated when a cw Signal Is Passed Through a Pulse-Excited Amplifier 38
Vll
- :'

BLANK PAGE
f I f I
■
IT
=*f
IHta «
^= = »a
\

I. INTRODUCTION
The object of this work is twofold; first, to investigate the
physical properties of laser amplifiers using electrically excited mixtures
of C02, N2. and He with a view to producing high-power pulse emission
with well-controlled temporal and spatis.1 form; second, to design and build
such a source with an average power of l kW in a form suitable for use as
a laser r^dar transmitter.
Our approach to the project, recognizing the limited time available,
has been to anticipate the final transmitter design and perform experiments
on components of this design, pushing to high powers as quickly as possible.
In this way, operational problems which arise would be relevant in the actual
engineering design, while investigation of the processes which will finally
determine the gain, saturation, and optical properties of the gaseous discharges
would take place in a geometrical form very closely related to that of the
finished transmitter.
That we have been able to do this with some degree of success de-
pended on a considerable foreknowledge of the physical processes which
dominate the excitation and energy transfer processes in CO^-Ny-He dis- l V jes derived from the work of M . Weber and T. Deutsch and from the
^ 3wer oscillator work of D. Whitehouse, all of this laboratory. This
work has provided us with measurements both of excited-state lifetimes of
COp levels in collision with their neighbors CO-, N2, and He, and of the
resultant gain, gain profiles, and energy storage capabilities of discharges
as functions of temperature, tube diameter, current density, and gas mix.
The problem of producing a compact and efficient power amplifier
is essentially a matter of identifying the energy source which a specific
input signal can draw upon, and controlling the excitation and decay processes
which relate directly to that energy source. From this standpoint, it was
clear that the dominant energy source depended on the time scale chosen for
the input signal. - ;
f
ji

IF l
In the present case we considered input pulse lengths that varied
from the Q-switched variety of 10' ' sec to pulses longer than I0"4 sec,
where the system behavior appro:;mu.tes that of a steady-state cw ampl ier.
Because we require the output signal to be at a stable frequency it has to be
generated from a stabilized oscillator, preterably a cw source. We would
anticipate the output for such a source to lie in the range of 5-SOW; after
modulation, an amplification into the range of 5-50 kW would be necessary
depending on the duty cycle chosen. At the outset we decided that M
dc-excited system could have an advantage of stability over a pulse-excited
one, both in pulse-to-pulse gain and in the spatial form of its output. Con-
sideration of the energy level dynamics then indicated that an efficient
extraction of energy could take place by using A sequence cf input pulses of
length between 10 and 30 fxsec, at repetition rates in excess of 3000 cps.
Discussion with our radar engineering collegues indicated that for the
proposed radar system, pulse lengths in the range of 5-30 |isec would indeed
be acceptable.
The experimental program has evolved from this as a starting point,
and has been directed primarily (but not exclusively) at gain and power meas-
urements on dc-excited amplifiers subjected to input pulses of 10 and 20 jisec
at repetition rates up to 12 kc. Measurements have also been made in pulse-
excited discharges and will continue throughout the program.
From our experience in the first six months of this study, we have
developed designs for both dc- and pulse-excited amplifiers, and believe that
we understand the physical limitations of each well enough to produce the
required output of 1 kW. The physical quantities of importance in these designs
have been measured, notably the signal intensity required to drive an ampli-
fier to saturation, together with information on the refractive properties of
the discharge, the time constant determining maximum pulse repetition rates,
both for the input pulse trace and for the pulse excitation process, and the
'
•
1
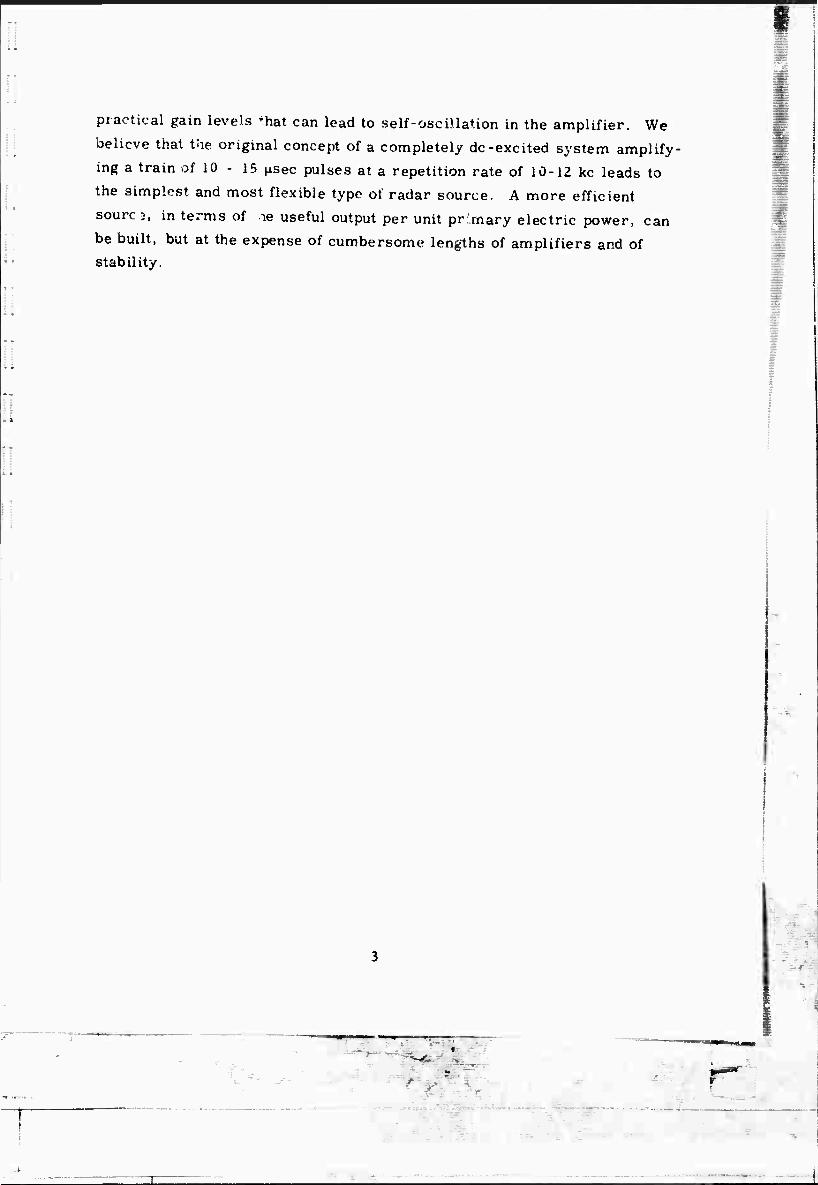
practical gain levels *hat can lead to self-oscillation in the amplifier. We
believe that the original concept of a completely dc-excited system amplify-
ing a train of 10 - 15 fisec pulses at a repetition rate of 10-12 kc leads to
the simplest and most flexible type of radar source. A more efficient
sourc ?, in terms of le useful output per unit primary electric power, can
be built, but at the expense of cumbersome lengths of amplifiers and of stability.
'

II. REVIEW
A. Molecular Level Populations and Dynamics
The 10. 6ji. C02 emission comes from a population inversion
established between rotational sublevels of the (00° 1) vibration level as
compared to the corresponding rotational sublevels of the (10o0) vibrational
level (Fig. 1). This inversion is produced by collisional transfer of energy
from vibrationally excited N2 or CO molecules formed in an electrical
discharge which may be operated with dc, ac, or pulsed currents. A
detailed analysis of the dynamics of these molecular levels has been carried
out in our research laboratories by Deutsch and Weber. Due to the near
equality of the energies of CO? molecules in (00n) vibration states with those
for excited nitrogen, this transfer is more likely than is usual in most
vibration-vibration transfers, and takes (on the average) some 500 classical
collisions. For pressures of N2 and CCL each at 1 torr, this transfer time
is of the order of 100 psec.
A second requirement for population inversion to exist has to do with
the distribution of population among the rotational sublevels of the CO, vibra-
tion levels. The close spacing of these levels (for 1 to 50 cm ) makes energy
transfer between them and kinetic states of the molecules a more probable
process than vibration-vibration transfer. Thus the rotational levels tend to
come quickly into thermal equilibrium with the kinetic temperature of the
ambient gas. This process is further accelerated by the introduction of
helium gas into the discharge, and typically takes =*0. 1 jisec. The lower the
rotational temperature, the more is the amplifier gain concentrated in a
single emission line (see Fig. 2). These emission lii es are usually asso-
ciated with the P branch of the CO, spectrum, with J values In the range
of 17 to 25. The int 'oduction of helium also assists in the transfer of excita-
tion in CO- from the lower laser levels of the (10o0) vibrational state to
nearby levels in the (020) vibrational state. From there, a very rapid de-
excitation to the ground states can take place.

«r«
»•o
00» I
/ • /
S Upptr .
\ ItVtlt -
Etc
Loter transition 960 em-1
X« 10.6/1
P(I0)
JVOJUM
- 13
- II
9
- 5 = 3
Ptl2)
02^0
0220
01'0
Lmvtr lottr Itvtlt
/Etc
\lottr Itv
\
14
■M 12 * in to
8 6
I
00*0 C02 Ground |teti
Fig. 1 Vibrational-Rotational Energy Levels of C02 Involved in Laser Emission
*"

WITHOUT HELIUM 11
1 l zi A PU4) PtlSl PUS)
A
WITH HELIUM
PWO) »22) P(24} Pt26l
JU i P(I4) p;ifi PtlS) P120) P(22) P124) PU6)
Fig. I Effect of the Addition of Helium on the Frequency Distribution of Laser Output
n [i 11 Ll [I
Li

A high inversion requires, therefore, an efficient excitation of
nitrogen molecules in a medium with as low a gas kinetic temperature as
possible. The dynamics of this system are represented in Fig. 3, albeit
in a simt .ified form.
In examining this figure, we see that the discharge dynamics,
having to do with the degree of ionization of CO,, N,. CO, 02 and thtir
constituent atomic ions and the related electron energy distribution, will
depend on the gas mixture, pressure, and tube diameter. They will result
in excited nitrogen molecules which can come into equilibrium with C07
upper vibration lev Is at a rate governed by a time constant of the order of
100 PN jisec wher ; PN is the partial pressure of nitrogen in torr. Vibra-
tional transfer among the (OOn) vibrational levels can be expect d to be of
the order of 10 usec. This last vibration-vibration interchange is nossible
because of the resonant nature of the transfer, the vibrational levels being
essentially equally spaced. Effective temperatures of the order of 5000°K
are established for the population distributions in the uppe~ CO and N?
vibrational levels, corresponding to the energies found in the electrons of
the discharge.
As discussed above, the helium-assisted transfer between rota-
tional levels, and between these and the gas kinetic ambient, takes place
in approximately 0. 1 ^sec, while the transfer out of the lowe" laser vibra-
tional states, also assisted by helium, takes place in approximately 10 ^.sec.
Finally, the gas kinetic temperature will relax back to the tube
wall temperature at a rate governed by the heat diffusion from the axis to
the walls, by excited molecular migrations, both governed by the degree
of macroscopic fluid flow and gas mixing going on In the tube. These rates
will depend on tube diameter and flow rate, and typically give time constants
of between Z and 20 msec for tube diameters between 2 and 5 cms.
^-^

VIBWATIONALLYI» EXCITED
r'9fi SEt,
DISCHARGE MECHANISMS
IONIZATION ELECTRON ENERGIES
r^ «lOO/iSEC
COs
OO0I STATES
4 LEVELS
T«O.IMSEC
LASER EMISSION
T«O.I>tSEC
COj 100 STATES
J LEVELS
r>0.i/tSEC
GAS KINETIC
AMBIENT
COj GROUND STATE
Fig. 3 Molecular Level Dynamics in the CO, Laser (Schematic) 2
8
iT' 2-20 MSEC
WALL TEMPERATURE
AMBIENT
■-yr--" ***--, ^ -.'»J^^.^L^^r- —-
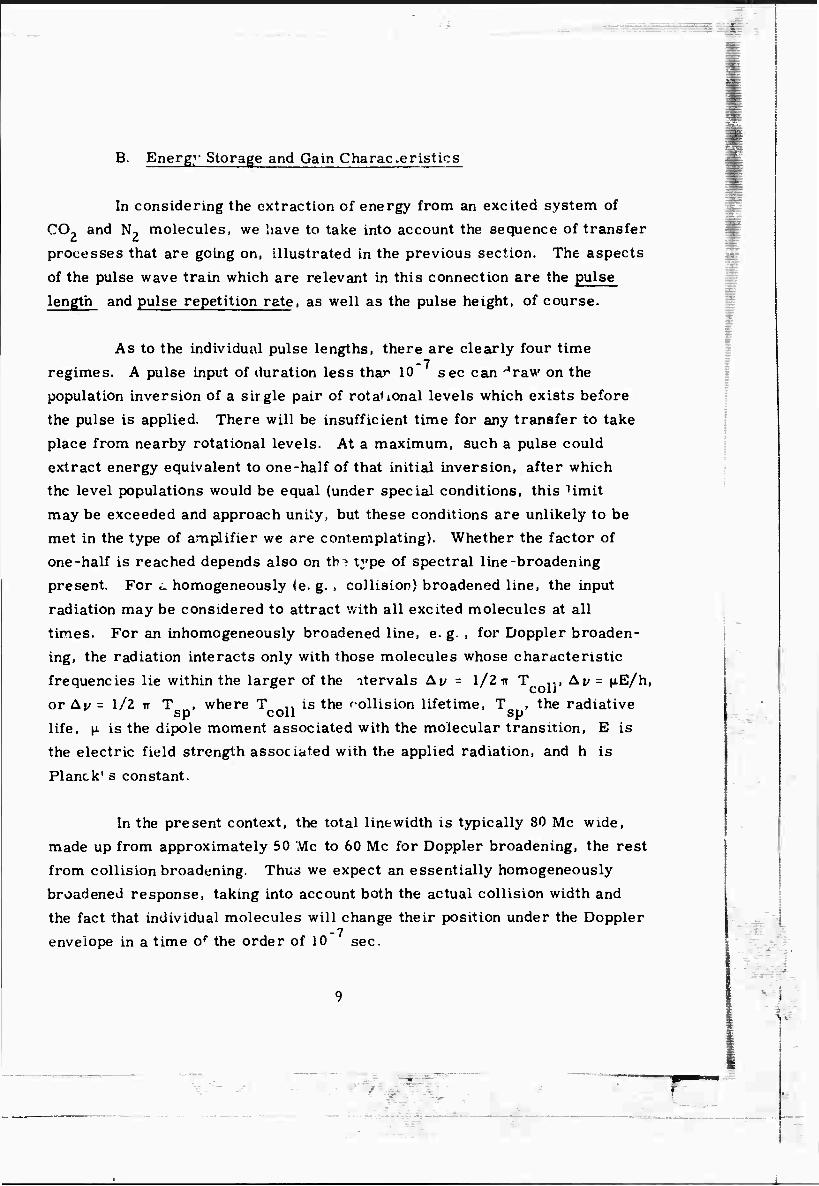
B. Energy Storage and Gain Charac.eristics
In considering the extraction of energy from an excited system of
CO? and N2 molecules, we have to take into account the sequence of transfer
processes that are going on, illustrated in the previous section. The aspects
of the pulse wave train which are relevant in this connection are the pulse
length and pulse repetition rate, as well as the pulse height, of course.
As to the individual pulse lengths, there are clearly four time
regimes. A pulse input of duration less thar 10 sec can ''raw on the
population inversion of a sirgle pair of rotalional levels which exists before
the pulse is applied. There will be insufficient time for any transfer to take
place from nearby rotational levels. At a maximum, such a pulse could
extract energy equivalent to one-half of that initial inversion, after which
the level populations would be equal (under special conditions, this Hmit
may be exceeded and approach unity, but these conditions are unlikely to be
met in the type of amplifier we are contemplating). Whether the factor of
one-half is reached depends also on tin type of spectral line-broadening
present. For i. homogeneously (e. g. , collision) broadened line, the input
radiation may be considered to attract with all excited molecules at all
times. For an inhomogeneously broadened line, e. g. , for Doppler broaden-
ing, the radiation interacts only with those molecules whose characteristic
frequencies lie within the larger of the itervals Aj/ = 1/2 u T ,,, Av = M.E/h,
or Aj/ = 1/2 IT T , where T „ is the »■"ollision lifetime, T , the radiative ' sp coll sp life, |x is the dipole moment associated with the molecular transition, E is
the electric field strength associated with the applied radiation, and h is
Planck' s constant.
In the present context, the total linewidth is typically 80 Mc wide,
made up from approximately 60 Mc to 60 Mc for Doppler broadening, the rest
from collision broadening. Thus we expect an essentially homogeneously
broadened response, taking into account both the actual collision width and
the fact that individual molecules will change their position under the Doppler
envelope in a time of the order of 10 sec.
|
J l -
t

Input pulses with lengths between 0, 1 and 10 jisec can affect all
rotational levels with (001) vibrational state, while the population of this
state should be replenished from others of the (00n) series in a time of the
order of 10 \xsec. In fact the work of T. Bridges at Bell Laboratories
indicated a typical recovery time of the order of 30 p.sec in an oscillator
delivering 1 ^sec pulses. This time sets an upper limit on the useful
repetitive rate which can be achieved, of the order of 30 kc.
Pulses of 10 to 100 |jLsec last long enough for population transfer
between C02 vibrational levels to take place, but with little chance for
transfer from the main energy reservoir, the excited nitrogen molecules.
Such pulses, then, can draw on a greater excited-state population, but the
system will take longer to recover, namely =«100 jisec, indicating an upper
limit of repetition rate of 10 kc. As we will see later, our experiments
confirm this prediction. Pulses longer than 100 jisec can draw on the full
energy storage in the excited nitrogen molecules, and upon the continual
replenishment of these levels from the electron bath itself. The behavior
of the amplifier to such long pulses should tend progressively to that for
the amplification of a cw signal.
The instantaneous inversions which can be established can be
inferred from measurements of the gain as seen by weak input signals.
The relationship between gain coefficient, Q, and inversion , An, per c.c.
is given by
a = An X 2 X 10"16 cm"1
- -
for a spectral linewidth of 80 Mc and using the dipole moments computed 4
by Statz, et al. Experimentally, we find that a depends on gas mixture,
current density, gas flow rate, wall temperature, and tube diameter.
Further, the highest value of gain obtainable in a tube of given diameter d
tends to vary inversely with d (Fig. 4). The value for a 2 cm (3/4 In. )
diameter tube is a = 0. 007 cm corresponding to a gain of approximately
3 dB/meter.
r 10
T

I
i i i i 111 rnrmpntwrn
o,*,o «N2-C02-He
Q 11 ■ i i i I a i ii ntiiliimtni 0.5 1.0 20 3.0
Diameter inches
Fig. 4 Peak Gain vs. Tube Diameter for N2-C02 and N2-C02-He Mixes
II
i
■ _ i-
smä* ? ...
For the projected radar application, the appropriate pulse length
is of the order of 10 ^scc. The added requirement for as much energy as
possible per pulse brings up the question of the best way of exciting the
discharge so as to maximize the output-pulse height. The choice lies
between a dc-excited tube, and a pulse-excited tube To avoid confusion
in treating the subject, we will deal here with energy storage for dc-excited
amplifiers, and consider the pulse excited case in the context of our
measurements. In this discussion, we will continually refer to tubes of
2 in. diameter. This is because; (1) we have data on such tubes; and
(2) we believe that this is the most manageable diameter, both from the
point of view of providing uniform discharges, of handling the optical
diffraction of the beam over lengths of the order of 40 meters, and of
maintaining acceptable gas flow rates.
In choosing a tube diameter, we have to further bear in mind that
the low-signal gain (and, therefore, the energy storage available to 10 jisec
pulses) depends on the radial position to the tube (Fig. 5). Thus the
conditions which give the largest low-signal gain as measured along the tube
axis usually do not correspond to the condition giving the highest power out-
put in a cw oscillator. The reason is simply that as the current increases,
the radial gain profile saturates and then decreases along the axis, while
the off-axis gain keeps increasing before saturating at a higher current
level. The output power depends on an integration of the low-signal gain
across the tube cross section, and this will be a maximum for current
values greater than for optimum gain measured on axis. In choosing ampli-
fier cross sections for our present program, we wish to obtain the highest
gain in initial amplification stages, the largest total power in later stages,
and overall, an output intensity distribution either- (a) as uniform as
possible across the output plane, or (b) as close to gaussian as possible.
Choice (a) maximizes the use of the amplifier tube cross section; and at
the same time minimizes the angle of the central lobe of the transmitter
pattern (at the expense of introducing a side lobe structure) whereas choice (b)
eliminates the transmitter side lobes at the expense of less efficient use of
the tube cross section In either case it seems that constant gain off-axis
would be helnful in the preamplifying section to preserve the input intensity
distribution .n the power amplifier sections, either a uniform gain or one
peaked up off axis is called for These conditions are closer to those appropriate to maximum power output than to those chosen for maximum
axial gain.
12 I
, r
w) a 8 £ j £ ^ IM
OJ fc su 1 c a» V LI 0 4>
«9 PL< «M O JZ •»-« c •<-«
•w ■« rt a 0)
01 3 (0 h a, u
1 <u 4) (0 fH a M J m L: *J
—H t. c UJ <ü (u <M flt ►* o ^ 55 9) t 3
ö1-' 3
C JJ ■"5 t-i <ä
CO ■ »^s,
fa
2 ? S S ^313« / iN33«3d - NIV9
IJ
~r

With this preface, let us consider the energy storage accessible
to a 10 jisec input pulse, passed through a dc-excited tube of 2 in diam,
with a typical low-signal gain of 1 dB/meter ( Q = 0.0023 cm ). From this
data, the excited state density is 1. 1 X 10 /cc, and at a photon energy
of 1.7 X 10"20 J/photon, the stored energy Is W = 1.85X 10"4 j/liter of
discharge.
On this basis some 7 mJ would be available from 4. single rotational
level in a 20-meter length of 2 in. discharge. This number sets a lower
limit to the available energy, and will be added to by transfer from other
rotational and upper vibrational states.
A second estimate of the available energy can be derived by
considering the power output from a 2 in. tube operated as an oscillator.
Such a tube delivers 60 W per meter (at a gas flow rate of approximately
2. 5 meters/sec).
-4 1 Thus in any 100 jxsec interval, an energy of 60 X 10 X ——
J/liter is delivered. We can draw the inference that 3 mJ/hter would be
accessible to a 100 jisec pulse. In terms of length, a 20-meter discharge
would have approximately 120 mJ accessible to a 100 jisec pulse.
The fraction of this available to a 10 jisec pulse would depend on
the relative populations of excited C02 to excited N2. The ratio of these
populations will be the ratio of Jas pressures, modified by a factor depending
on the relative number of ava. ^e rotational-vibrational states in the same
energy range. The ratio is of the order N2/C07 - 4:3 for equal pressures of
N? and CO?. As a result we expect approximately 1. 5 mJ/hter to be avail-
able to a 10 fisec pulse under dc excitation (or 60 mJ/pulse for a 20-meter,
2 in. tube). These two estimates set upper and lower limits to the energy
available per 10 |iseo pulse; i.e. , 20 meters of dc-excited tube should give
between 7 and 60 mJ per pulse when driven as a saturated amplifier.
14
^

C, Conversion Efficiency in Oscillators and Amplifiers
The efficiency with which energy from th« primary power source is
converted into useful output radiation depends in part on the excitation and
collision processes going o.. in the electrical discharge, in part on geometri-
cal factors which determine the fraction of the total excited volume accessible
to the radiation field of the device, on the efficiency with which radiant
energy is coupled out from the active region, and finally on the temporal
aspects of the excitation and emission processes.
The most complicated of these determinants are the multiple ion-
ization, collision, and excitation effects which go on to establish the inversion
between the emitting molecular levels. These depend on gas mixture, current
density, temperature, and gas flow rate. Despite the complexity of the de-
tails, we can state overall experimental results for oscillators.
Experiments have been performed in which at least 80 percent of
the available energy generated as a molecular inversion has been extracted
in the output beam. Under these conditions, and using laser mirrors which
maintain a radiation field filling the active region of the discharge, efficien-
cies of 15-20 percent have been achieved. That is, 15-20 percent of the
energy dissipated in the discharge itself has been converted to an output
beam which, although belonging to a single P line, usually contains a
number of separate modes. Under these conditions, some 75 watts per
meter of discharge is obtainable. The number depends on the gas flow
rate, and at higher flow rates, 100 watts/meter has been quoted. We
believe that the 20 percent figure can be used as the basis of an oscillator
design.
On the other hand, the need to produce a single-mode output forces
a restriction of the radiation field to a size smaller than that of the actual
active discharge region. As a result, we can expect the output efficiency
15
^ - ; r m
T

to decrease, roughly by a factor of two. While this figure may be improved
by more sophisticated designs of discharge tubes, we will consider our own
transmitter designs to be based on a 1 0 percent efficiency for powc extrac-
tion in a single mode.
The efficiency with which one evtracts energy from a single-mode
amplifier will depend on the level at which it is driven. In the limit of large
input signals where the amplifier becomew nonlinear, and is driven into
saturation, its efficiency should approach the cw oscillator figure, namely
20 percent multimoae, 1^ percent single mode. As indicated in the next
section, our experiments indicate that strong saturation takes place when
the input intensity is of the order of 60 watts/cm . For an efficient ampli-
fier, then, one should arrange to reach this level of radiation density as
ojon as possible.
In an amplifier where the input is a sequence of pulses, with a
duty cycle of l/lO or less, the power extraction problem is more involved,
as indicated previously. If we are concerned with extraction of energy in
10 jisec pulses, the repetition rate of these pulses should be increased
until the pulse spacing is of the order of the time for energy transfer from
the reservoir of excited N-, to the upper laser level, a time which we
estimated to be of the order of 100 ^isec. For repetition rates greatly in
excess of 10 kc, the outpm efficiency should again be comparable to that
of a saturated amplifier driven by a cw signal.
16
<
—• #■»■
V
III. GAIN AND SATURATION MEASUREMENTS IN DC-EXCITED AMPLIFIERS
While experiments carried out for this project have varied in their
detailed form over the 6-month period covered by this report, Fig. 6 indicates
the general form taken by the equipment. This consisted of an oscillator emit-
ting between 15 and 35 W single mode, whose output was focused either by
mirrors or NaCl lenses to permit a focal plane shutter to form the primary
pulse train signal. After recollimation, the beam passed through two 3-meter
lengths of 2 cm i.d. amplifier and, at times, a further action of 20 meters of
a 5 cm i.d. amplifier. The small-bore amplifier could be excited with ac, dc.
or pulsed current; the large-bore amplifier was always driven from a dc supply.
NaCl windows have been used throughout this system.
I
The mirrors on the oscillator were usually a 10-meter radius, gold-
coated silica reflector set in opposition to a 1/4 in. thick germanium optical
flat, mounted in a water-cooled holder. The open structure of the oscillator
allowed the introduction of irises to produce a single-mode output Due to
air currents in the open sections, however, the output tended to fluctuate with
time. The mirror surfaces exposed to high powers in the latter stages of the
amplifier were made of stainless steel or sapphire, both gold plated.
Signals were detected using a gold-doped germanium photoconductor,
operated at 77°K. Average powers were measured using an anodized aluminum
conical absorber cooled by a known flow of water. Measurement of the increase
of water temperature, usually of the order of several degrees, gave a direct
calorimetric determination.
The exact chronological order of the various measurements was
rather involved and depended on the availability of the various amp.ifier com-
ponents and power supplies. These measurements will be grouped under the
17
i ■ ■

f -1 ac
*--vr g
• a ^o, - »-
* O i
i 1
U & * ! 0 a. J2 tJO
• i i 1
M 0
v B ■ i «« to B u Ik
1 '■ 3 «
•> £
1 t _i a. a 5
en
Q o « !2 — — s- ? X E « 5^ ' « <S »0 i ■n^ 1
ri c i i i 1
3 C
16 0 > C w ~ <b (0
6.^
If u
u<
i > «1, NO
1 p» bio 5 V i i 1 r
Ü V L—' i •
s if 5 «r i 0 2 Ik
1 • i ■ o s < ^ -t ,
18 U

following topics for the purpose of discussion: straight cw amplification,
amplification of a cw signal by current-pulsed amplifier, and of pulse trains
by dc and pulse-excited amplifiers. We will first treat the cw case. The
simplest form this could take would be for a beam of uniform intensity to be
amplified by a medium of uniform gain snd saturation parameter. By con-
trast, our measurements have been taken on a more complicated system,
where a roughly gaussian beam has been amplified by a msdium where there
is likely to be a strong radial dependence of gain. At this poin; of time, how-
ever, we have analyzed the data on the basis of a uniform propagation model only.
f-
In this, we assume that a cw signal of intensity I. (W/cm2) passes
through an amplifier whose exponential gain coefficient a = a (l/l ( J"1.
For this case, assuming a uniform input wave and uniform excitation, the Dower gain is:
dP(x) a0dx
^ sat
wh^re
Hence
P = I .A sat
P = I A sat sat
In out
in
m
sat
out P. m
-J) =
or
In G + ß(G-l) = a L
19

where
G =
ß
P . out P.
in
P ir^
3 at
Fi Türe 7 shows the solution to this equation plotted as In (G-l) vs ß for
various values of a L. The quantity (G-l) P. is the additional power
contributed by the amplifier. Alternatively, we may plot In G vs P. (G-I).
This should give a straight line plot with intercept a L at P. =0 and a
slope of-l/P . We have carried out such exper-ments on cw gain in SSL v
dc-excited amplifier tubes of i. d. = 2 cms (3/4 in. ). Figure 8 shows the
results of two sets of experiments, one with a convergent beam, the second Qo 2.2 0.95
with a uniform beam. From both sets of data, we obtain d =e =10
for a length of 3 meters ( a = 0. 73 nepers = 3. 2 dB/m). The uniform cross-
section beam gave an effective saturation power of 13 W, an average saturation
intensity of 28W/cm . The corresponding intensity at the center of the beam
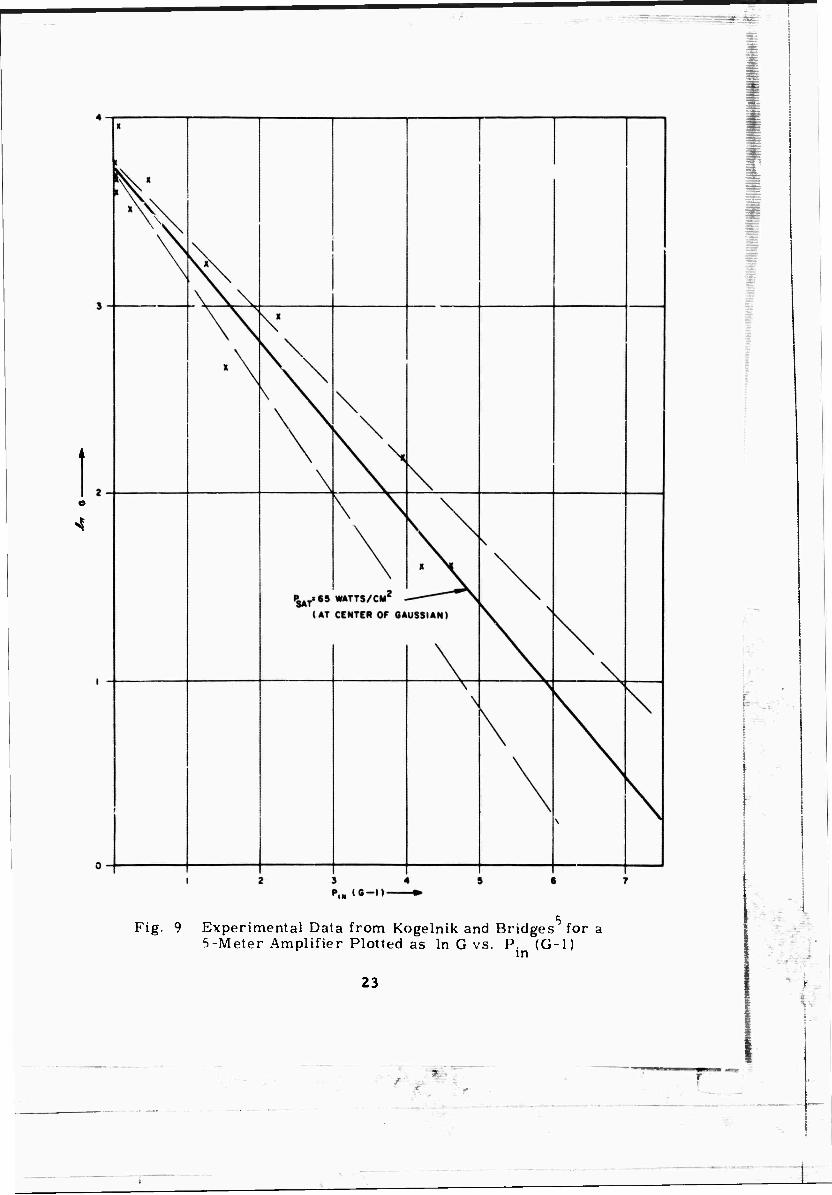
was * 56 W/cm . A similar experiment has been performed by Kogelnik and
Bridges who also obtain a gain of 3. 2 dB/meter for a 2 cm tube. They quote
a central intensity of 100 W/cm for I but on reanalyzing their data in tne
manner indicated above, we obtain a value of 65 W/cm (Fig. 9). This number
allows us to predict the behavior of various amplifiers by reuse of Eq. 4 or
of Fig. 4.
A second way to estimate the saturation parameter is to use the
figure for the power output per unit length of an oscillator. In conditions where
the resonator losses are dominated by the output coupling, we can use the
limiting case of Eq. 4 for high P. /P ., to give- P , — P , a L. 6 ^ 6 in sat e out sat o
20
=**^^^L-~=^:^-=
\
100
CURVES OERIVCO FROM
Jn.Q +-üi. (G-ll«aÄ t
WHERE G • •
rS*T
O0\' O.OI Qi IC
IN
SAT
Fig. 7 Plots of In (G-l) vs. Input Power for Various Values of a L o t
21 i -
V
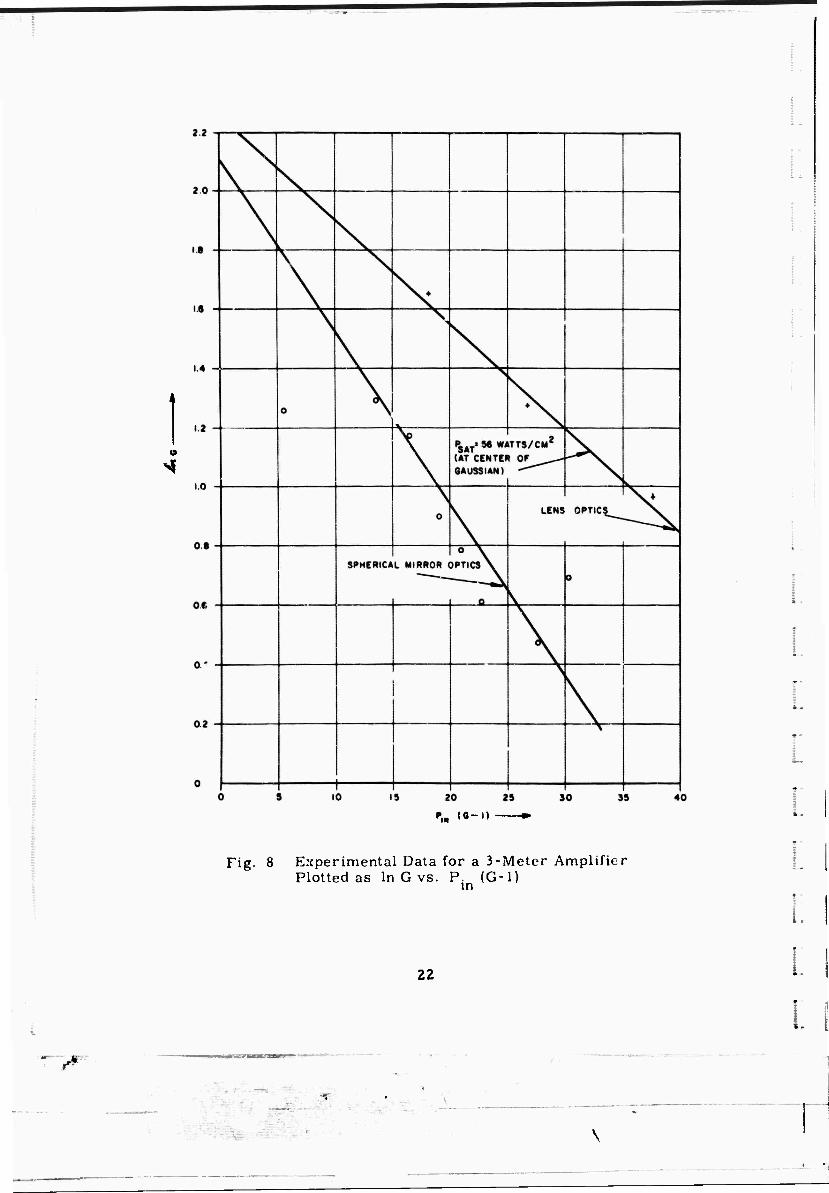
Fig. 8 Experimental Data for a 3-Meter Amplifier Plotted as In G vs. P. (G-l) in
22
----T-.U:.-:;-;:T.-
v
>5
1
Fig. 9 Experimental Data from Kogelnik and Bridges for a 5-Meter Amplifier Plotted as In G vs. P. (Ü-1)
in
23
• -" -
-' -
±
•» ***
For a 2cm tube, P , ^ 50 W/meter, a ^0.7 m'1
out ' o
to give P„ ♦ ^ TT^ = 70W " sat 0. 7
70 , 2 and I =« -5- r 2 3W/cm
sat 3 '
This result is in fair agreement with our direct gain measurement, since
the actual effective area is somewhat less than the full 3 cm assumed in
this calculation. For a 2 in. tube, on the other hand, P . =» 75 W per .i out
meter of discharge and Q ^0. 23, m whence
PSal = (TH = ii0 «•
or
'sat = Hw - "W/cm2
Again, allowing for a somewhat reduced effective area, we would estimate
the actual figure to be closer to 25W/cm for the 2 in. tube. In either case,
the saturation parameter would appear to be a slow function of tube diameter.
A. Spurious Oscillations
One of the major problems in handling high gain optical amplifiers,
as in rf amplifiers, is the suppression of spurious oscillations which draw
the power into unwanted output beams. An overall power gain of 100 is
contemplated in the production of 1 kW output power. With a duty cycle of
1/10, this corresponds to a pulse average gain of 1000 under saturated
24
-
I i li 1
\

«2
conditions, and a small signal gain of at least 10 . In fact, as we will
descr ibo later, we contemplate a design with a large bore tube length of
40 to 50 meters preceded by 13 meters of small bore tube. The total
small signal gain of this assembly would be approximately 50 X l +
13 X 2,5 = 82. 5 dB. Considering the fact that one end of this system
faces a resonant cavity (the oscillator) with a high reflectance coefficient,
a double-pass gain of 10 must be contemplated!
In our erperiments, we have detected ; elf oscillations of the 4
amplifier at a single-pass gain of 10 using 20 meters of 2 in. diameter,
and 6 meters of 3/4 in. diameter tube with a NaCl slab on one end,
giving ^ 10 percent Fresnel reflection, and a NaCl flat set at Brewster* s 4 / 4 angle at the other end. The effective double pass gain was 10 X 1/10 X 10 ,
7 or 10 . Reduction of the single-pass gain by a factor of 5 suppressed this
effect. Apparently, there is sufficient surface backscatter from the NaCl
Brewster window to cause oscillation at an effective total gain of approxi-
mately 10 . That is, the Brewster window has an effective reflectivity of
10 , The oscillations appear as a steady output in the abseuce of any
signal from the oscillator. With the chopper blade removed, the output can
be as much as 200 W, in a spatial pattern showing the circular fringes
characteristic of reflections from the tube walls. With the chopper in place,
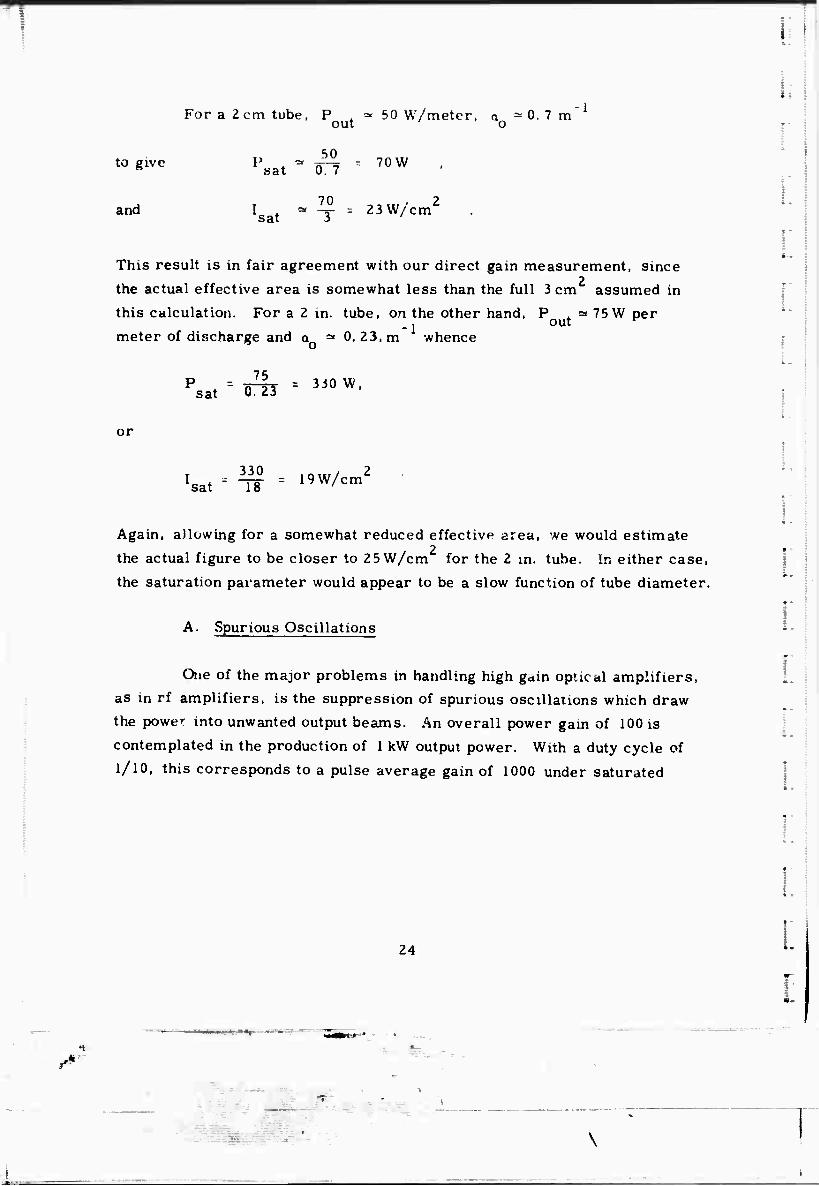
the oscillations appear as noisy spikes of the order of 2 jisec on base, with
a delay of 1 - 3 usec after the opening of the chopper (Fig. 10). The average
power of these pulses can be as much as 30W. In addition to these pulses,
a noisy spectrum can occur when the amplifiers are running at maximum
gain, produced by reflections from the chopper blade itself which is not
entirely plane (Fig. 11). The latter noisy oscillations can give average
powers of up to 100W.
When the primary oscillator is turned on, the spatial form of the
output changes abruptly, and becomes dominated by a pattern similar to
that observed in the absence of any amplification. At the same time, the
spurious oscillation pulses which occurred while the chopper was open are
completely suppressed by the incoming signal.
25
4- L.
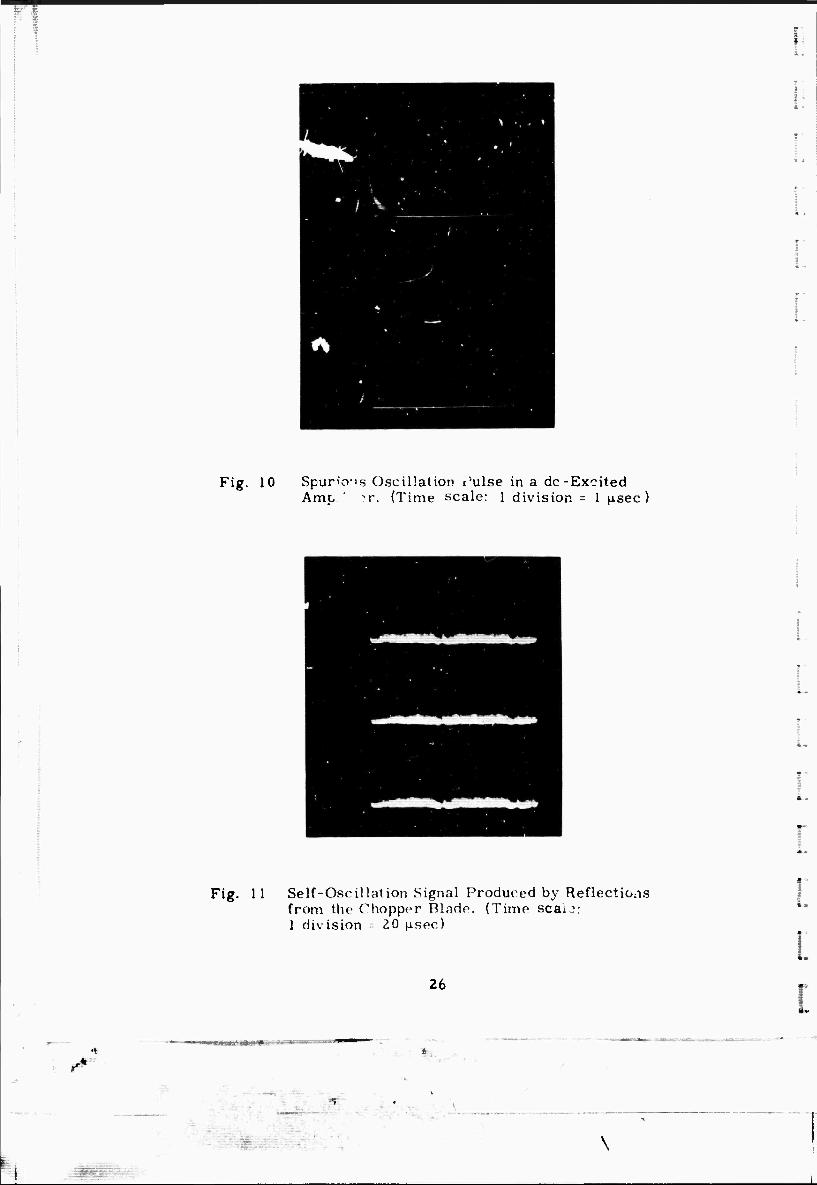
Fig. 10 Spurious Oscillation t'ulse in a dc-Excited Amp ' *r. (Time scale: 1 division = 1 |isec )
Fig. 11 Self-Oscillation Signal Produced by Reflections from the Chopper Blade. (Time sea. _v 1 div ision 20 |j.sec)
26
**
\

The lesson to be learned here is that for stable operation of an
amplifier one should e'ther drive it into saturation with a cw signal, or
isolate sections (each of which has a small-signal gain of less tnan 10 )
using reflective optics and well-made Brewster (or at least angled)
windows. The separation could be achieved either with multiple shutters
or bv beam division and subsequent amplification in parallel elements.
B. Super Radiance Effects
A problem related to spurious oscillations is the loss of energy
due to amplification of the natural spontaneous emission at 10. 6^,. While
this is of low intensity and emitted Isotropie ally, it will finally set a limit
on the length of amplifier which can be kept excited continuously.
We have made a calculation for a 2 in. diameter tube, assuming 7
non-reflecting tube walls and find that for a single pass gain of 10 , some
10 percent of the available power is being depleted by superradiance. While
this figure could be reduced by the use of focussing optics and apertures,
we believe that these are impractical. Furthermore, considering the
likelihood of the onset of spurious oscillations at gains of 10 , we do not
believe that population depletion by superradiance will be a problem in
practice.
-
27
*-
f w-
^
IV. PULSE AMPLIFICATION IN DC - KXCITED AM PLIFIERS
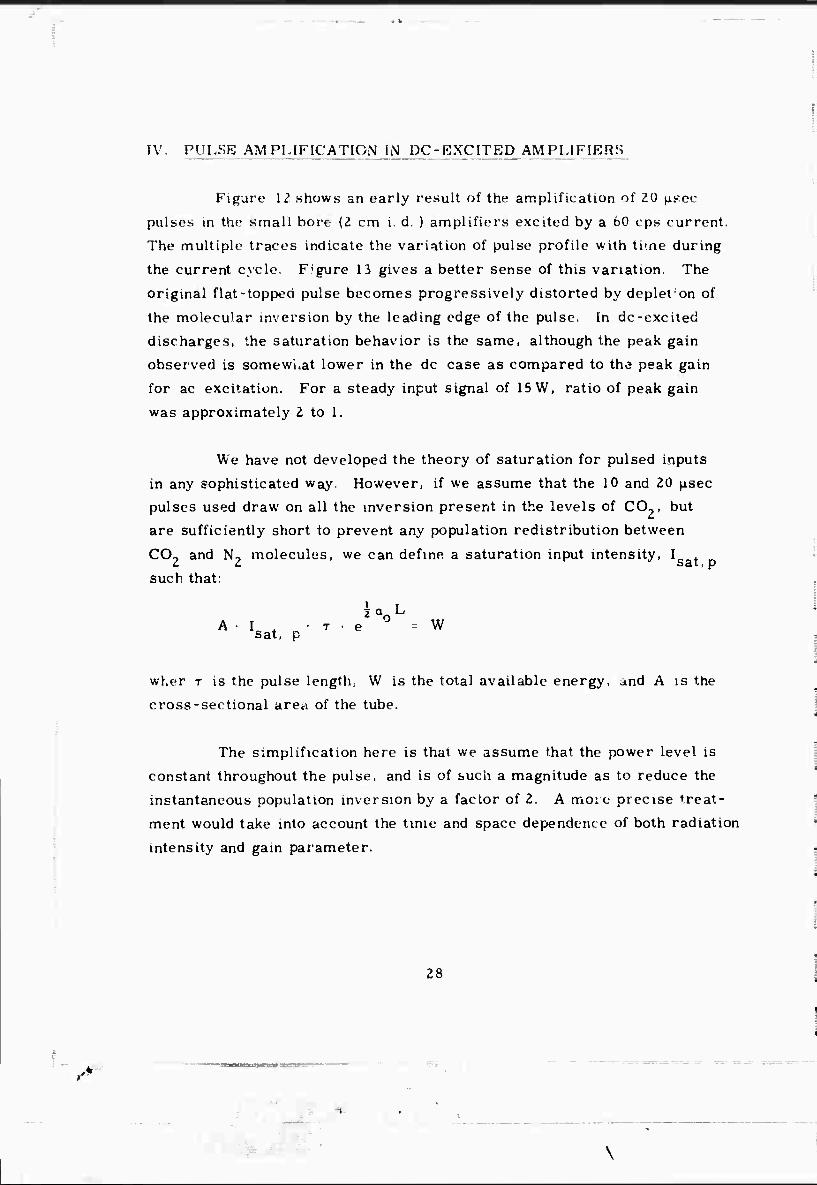
Figure II shows an early result of the amplification of ZO [AFCC
pulses in the small bore (2 cm i. d. ) amplifiers excited by a 60 cps current.
The multiple traces indicate the variation of pulse profile with time during
the current cycle. Figure 13 gives a better sense of this variation. The
original flat-topped pulse becomes progressively distorted by deplet:on of
the molecular inversion by the leading edge of the pulse, in dc-excited
discharges, the saturation behavior is the same, although the peak gain
observed is somewi.at lower in the dc case as compared to the peak gain
for ac excitation. For a steady input signal of 15 W, ratio of peak gain
was approximately Z to 1.
We have not developed the theory of saturation for pulsed inputs
in any sophisticated way. However, if we assume that the 10 and 20 ^sec
pulses used draw on all the inversion present in the levels of CO-, but
are sufficiently short to prevent any population redistribution between
CO, and N-, molecules, we can define a saturation input intensity, I« t n
such that;
*aoL
AI. -Te =W sat, p
wher T is the pulse length; VV is the total available energy, and A is the
cross-sectional area of the tube.
The simplification here is that we assume that the power level is
constant throughout the pulse, and is of such a magnitude as to reduce the
instantaneous population inversion by a factor of 2. A more precise treat-
ment would take into account the time and space dependence of both radiation
intensity and gain parameter.
28
■■■~*KM?z.^T^'vB.'&vr ^rr^i^r
"
\

(a) Output pulse after amplification sequentially by Amplifiers A and B
(b) Output pulse from A.nplifier B in which there was uniform propagation
(c) Output pulse from Amplifier A in which severe beam constriction took place
(d) Input pulse (Length 20 ^isec)
Fig. 12 Pulse Distortion Produced on Amplification
(a) Amplifier output
(b) Input - a train of 20 jxsec pulses
Fig. 13 Time-Dependent Amplification in a Discharge Excited by 60 cps Current
29

For a 2cm diameter tube with a ~ 3. 2 dB/m, and a 3-nieter o
length, assuming a total stored energy of eight times the calculated energy
for a single rot; Uonal level, then:
W 8 X 7. 3 X 10
2X10 16 X 1. 7 / 10 •20
X 300 X TT joules
« 5 rnillijoules
From this WP calculate for a 2 0 (isec pulse
p t - -5 JU^! x { satp 10 ^ 3
= 170 W
that is,
I - 60 W/cnr sat p
In early experiments of this type, we found that input intensities of the order
of 200 W/cm were required to reduce the gain of a 3-meter length of sucii
a tube by a factor of 2 from the low-signal value. Clearly, our model will
have to be made more elaborate. As an experimental fart, however, it is
clear that the effective saturation parameter for short pulses is considerably
larger than the corresponding cw case.
An alternate way to pi >sent the data is to plot the obser-veo gam
le^el as a function ol time after turning on a long pulse input signal. Figure 14
shows the result of such an experiment, contracting the pulse results with
data taken using a cw input of identical geometric form. Drawing the dashed
curve appropriate for the cw analysis through the 8 |isec point is admittedly
done on shaky grounds, but it indicates a displacement oi some 7 times to
higher powers and would then g^ e 7 X 28 or approximately 200 W/cm for a
^oatial average saturation power density.
30

100
t I
0.01
t»-*0O(C.WEXP)i
PE.,p - 13 Wottt (pulttd a CW)
Amplifltr: »«ntttrt of C02:N2:Ht "0.9'.0.45:3.7torr
DC txcittd
0.1 10
PIN/ PEXP
Fig. 14 Large Signal Gain Observed as a Function of Time for a Single Input Pulse
31 i V

•*
It is clear that as a design parameter, ar input power density of
this order (200 watts/cm ) is required to efficiently extract the energy
stored in the excited CO moiecules. The efficient extraction of energy
for the reservoir of excited N? molecules now requires a repetitive appli-
cation of the 10p.sec pulses. We have taken data on the complete system of
3/4 and 2 in. diam amplifiers shown in Fig. 6. Due to the limitation of
our recoilimating optics at the time of the experiment, the full cross
section of the large bore amplifiers was not used. As a result, we estimate
that only one-half of the available volume of excited gas molecules was
inuuenced by the injected signal. The data is shown in Fig. 15 . For the
10 ►isec pulses, the initial slope is 25 mj/pulse with a progressive falling
away from the line with increasing repetition rate. If we interpret this
data on the basis of a model with single time constant 7 connecting the N7
and CO, states, T is the reciprocal of the frequency at which the curve
drops away from ths initial straight line by l/e. In our case T = 100 fisec.
In this experiment we used a standard gas mix of 0. 5 torr C02, 1. OtorrN,,
5. 5 torr of He in the larger bore amplifier, 0. 45 torr C071 0. 9 torr N-,,
and 3. 7 torr Hein thesmall bore section, .At these pressures, and a gas
temperature of, say, 500'K. a time of 100 jisec would imply that approxi-
mately 200 collisions are required per quantum transfer.
As a practical matter, we have been able to obtain 200\, of
average power at the 12 kc repetition rate, a level which would corres-
pond to an initial slope of 28 mj/pulse. This implies that if the same
excitation had been applied to the total active volume, some 56 mj/pulse
would be achieved. Our previous calculation of 7 mj of energy available
from a single rotational level indicates ihpt transfer for other rotational
levels takes place to give an eight-fold enhancement. At a repetition rate
of 12 kcs, the output per pulse will have dropped to some 60% of the low
rate value, nearly to 33 mj/pulse. This figure is to be compared to the
32
=T
! I
\

400-
300-
/ /
LINE FOR 35 MJ/PULSE /
/
/ /
6 9 12
REPETITION RATE ( KC )
I i
Fig. 15 Experimental Results on Pulse Amplification
33

estimate of 60 mj/pulse made earlier in this report by analysis of the cw
emission properties. The present results suggest that the large bore
amplifier should be driven more vigorously, and in fact, the present
^iE^L Peak intensity is only 150 watts/cm while the input is approximately 100 watts/cm .
34 L i.
\

V- PULSE FORMATION AND AMPLIFICATION IN PULSE EXCITED
AMPLIFIERS
The pulse trains formed by passing a uniform train of peak height
approximately 15 watts through puls ^excited discharges have been studied
using the small-bore amplifiers. Figure 16a shows typical traces obtained
in this type of experiment. In this particular case a current pulse of
120 |isec duration was applied to the mix normally used for dc-excited
tubes, namely 0.5 torr CO,, I torr N?< 3.7 torr of He. The photograph
shows the superposition of many traces, in each of which the actual separation
of the 10 jisec measuring pulses was 330 fisec. In this particular instance,
we see that the pulse gain profile continues to rise after the termination of
the 120 p.sec current pulse, passes a maximum some 200 ^sec later, and
slowly decreases over the next millisecond.
By using 15 jJtsec current pulses, we can produce a situation wherein
most of the increase of gain with time occurs after the current pulse. This
buildup in the normal gas mix is governed by the N2 " CO energy transfer.
The observed curves are again consistent with a 100 fxsec transfer time.
We find also that the pulse gain measured at its maximum value
after the application of the current pul^e has been increased by a factor of 2
over that measured in the same mixture using dc excitation (Fig. iob). By
increasing the length of the exciting current pulse to approximately 250 usec,
we have achieved a gain enhancement of three times the dc value. In
interpreting this factor, it should be noted that the output pulse profiles
indicated that partial saturation was occurring in the pulse amplification.
Thus the small signal gain may have been increased by an even greater
factor. This data implies that for a period of some 200 \isec, it is possible
to at least triple the energy storage in levels accessible to a 10 fisec pulse,
a result which at first sight is very attractive from the point of view of
producing a compact pulse amplifier. However, if we have to provide high
average powers by using high repetition rates, we would be required to
35 r I
— r
J.-/

(a) Trace (a) Gain Profile measured with lOjisec pulses during and after the application of a IZOjisec current pulse. (Time scale: 1 dtviäion - 200 (j,sec)
(b) Trace (b) A similar measurement using dc excitation
Fig. 16 Gain Enhancement Under Pulse Excitation
(a) Trace (a) Gain Profile using 120 jisec current pulses rep rate of 100 pps. (Time scale; 1 division = 200 ^sec)
(b) Trace (b) as for (a) but with reduced time scale
(c) Trace (c) as for (a) with 300 pps.
(d) Trace (d) as for (b) with 300 pps.
Fig. 17 DeU'rioration of Gain in Pulse Excited Amplifiers
36
i

pulse excite at a correspondingly high rate. Unfortunately, the rain
enhancement achieved with each current pulse decreases as the pulse
excitation repetition rate increases. Figure 17 shows the corresponding
profiles for repetition rates of 200 pps and 300 pps. The obvious drop-off
in gain indicates that a process with an effective decay time of some 2-3
milliseconds comes into play in a 2 cm i.d. tube. Following a comparison
of this data with that obtained by our companion contractors at the first
quarterly review, it appears likely that the time constant is associated
with the temperature of the gas mix, and depends on both the nature of
this mix and on the tube diameter, becoming longer as the tube diameter
increases.
In any case, it is highly unlikely that we will be able to reduce
this time to the 100 (isec which would be required to handle 10 kc repetition
rates, although a 1 kc rate may be practical in a 2 cm i.d. tube. It will
be important to discover to what degree the response time can be reduced
below 2 to 3 msec for 3/4 in. tubes, and below 20 msec for 2 in; tubes,
by gas mixing and injection techniques, for example. In our own experiments
on 2 in. tubes, it is clear that the gam profile follows a 120 cps current
ripple, and we believe that at gas flow rates of the order of 2. 5 meter/sec,
tho recovery time for sequential pulse excitation will be more like 10 msec,
allowing a pulse repetition rate of 100 ppr .
In a second set of experiments, we have studied the pulse formation
which occurs when a cw signal, present at all times in the system, is ampli-
fied during and afier the application of a current pulse to the second section
of the amplifying chain. Figure 18 indicates the types of pulse profile that
result in such cases. The profile depends on the gas mix, having its shortest
decay time for pure C02, and increases significantly with the addition of
nitrogen to the discharge. The profile becomes shorter as the gain is
increased by raising the pulse current. The shortest pulse (70 jisec on
base) was observed in pure C02, but the energy per pulse was much less
than for the case of CCX,, He, N? mixes.
37
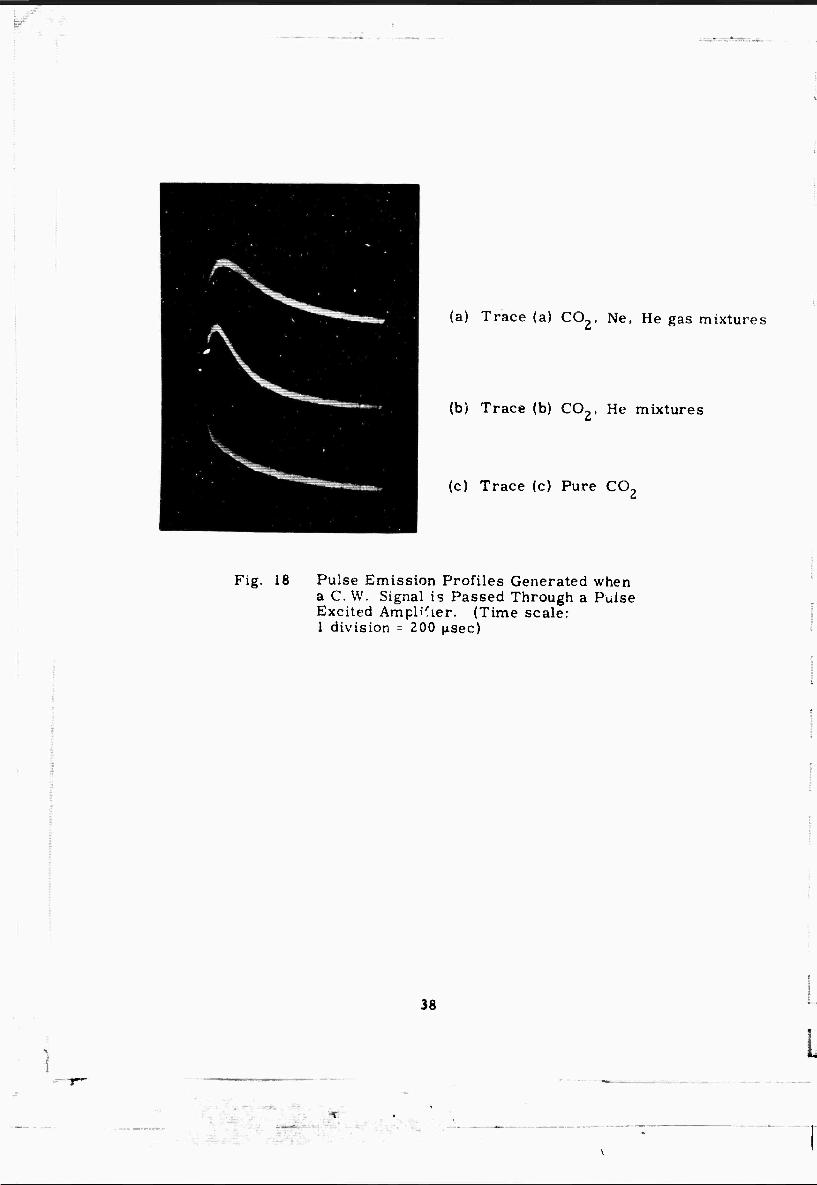
(a) Trace (a) CO-, Ne, He gas mixtures
(b) Trace (b) C02, He mixtures
(c) Trace (c) Pure CO.
Fig. 18 Pulse Emission Profiles Generated when a C. W. Signal is Passed Through a Pulse Excited Amplifier. (Time scale: 1 division - 200 jisec)
38
L

If we rely entirely on the pulse-forming characteristics of the
pulse-excited discharge, it will be difficult to achieve high-power output
pulses much less than 60 \isec in length. To do even this would require
a pulsed preamplifier of pure CO followed by a CO-, N.,. He-filled
pulsed amplifier. In fact it would be simpler to form a pulse by mechanical
means, and amplify to a level required to drive the power amplifier into
saturation before sending it to the pulse-excited amplifier.
As a result of these experiments, we have conceived of a system
of double-modulated pulse trains which provides an attractive alternate
to the dc- and single-pulse systems. Consider a system of pulses each
10 |j,sec long, separated by an interval of 160 jjisec, which pass into a
40 meter length of 2 in. amplifier, pulse excited at 100 pps. Each
exciting pulse lasts approximately 500 (isec, somewhat longer than the
time required for energy transfer from excited N' molecules to the
C02 upper laser levels. For a period of approximately 1 msec, the
train of 10 jisec input pulses can draw on an inversion of «600 mJ per
pulse, repeated up to three times.
In this mode of operation, three pulses, each of approximately
600 mj/pulse would form a 0. 5 msec burst repeated lOO times/sec. In
this type of amplifier, we take the fullest advantage of the high energy
storage in ihe pulse-excited mode without as large a loss of average
power as occurs when only one 10 jjisec pulse is used per excitation pulse.
We would expect an average power of 180W to be obtainable from a
40 meter section of 2 in. amplifier. While development of this type of
excitation and operation may result in an increase of the usable repetition
rate; i.e. , beyond 100 pps, it is evident that in order to produce a 1 kwatt
source by the means, a much longer amplifier will be necessary - approxi-
mately 200 - 250 meters.
39
By comparison with a completely dc-excited, high repetition-rate
source, such a pulsed type has the advantage of greater efficiency on the
use of the electrical power consumed in the excitation, together with a
potential advantage of hi^h peak power. The latter is beneficial in radar
applications where a low signal-to-noise ratio per pulse is to be expected.
The drawbacks are the obvious one of complexity of layout and handling of
the long optical paths, and the possibility of transient beam distortion
effects. It is clearly important to deteimine the far field patterns pro-
duced in such pulsed amplifiers, and we plan to do just this.
40
^
VI. REFRACTIVE AND DISTORTION EFFECTS IN AMPLIFIERS
For the application in mind for the transmitter, accurate defini-
tion and control of the output wavefront will be important. This wavefront
could be distorted by
1. Warping of the various optical elements (particularly mirrors)
due to heating produced by absorption of the incident radiation.
2. Refractive effects produced by temperature gradients and
molecular dissociation within the discharge.
3. Effects of nonuniform amplifier gain across the tube diameter.
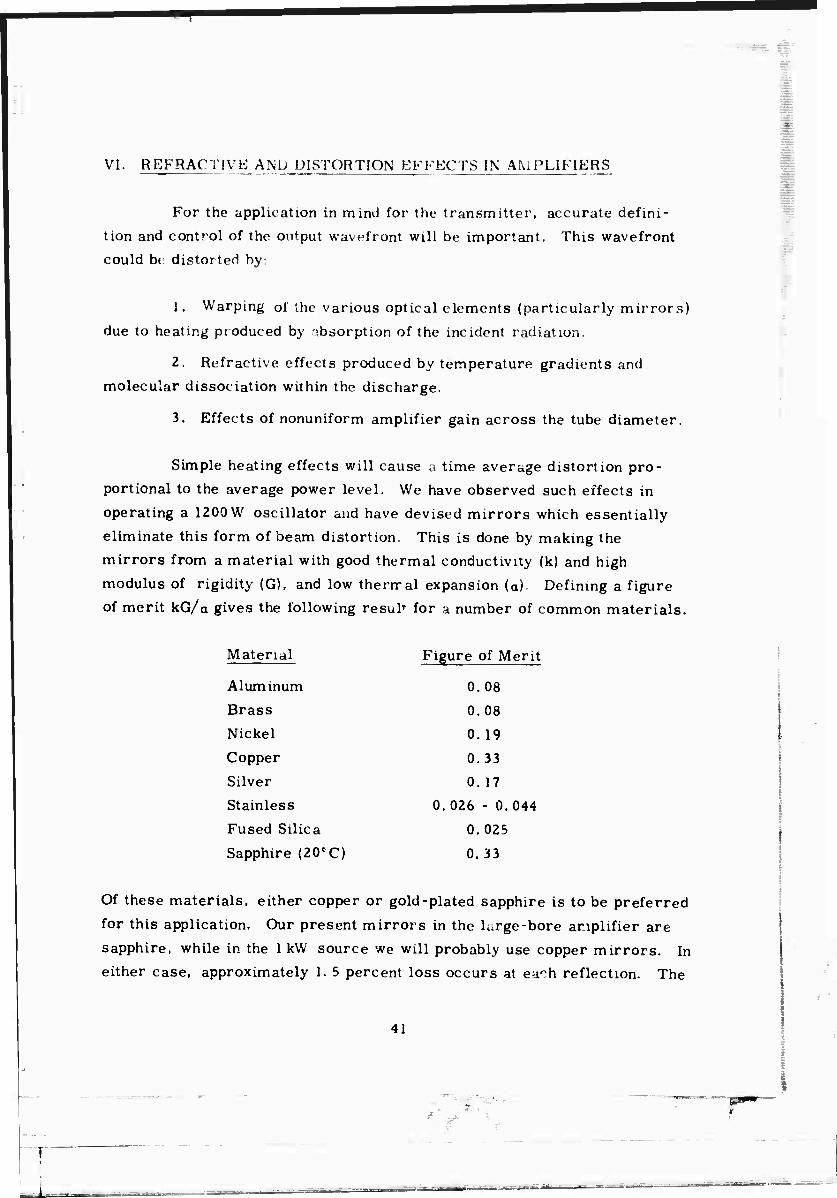
Simple heating effects will cause a time average distortion pro-
portional to the average power level. We have observed such effects in
operating a I200W oscillator and have devised mirrors which essentially
eliminate this form of beam distortion. This is done by making the
mirrors from a material with good thermal conductivity (k) and high
modulus of rigidity (G), and low thermal expansion (a) Defining a figure
of merit kG/a gives the following resuh for a number of common materials.
Material Figure of Merit
Aluminum 0.08
Brass 0.08
Nickel 0.19
Copper 0,33
Silver 0.17
Stainless 0. 026 - 0. 044
Fused Silica 0. 025
Sapphire (20°C) 0.33
Of these materials, either copper or gold-plated sapphire is to be preferred
for this application. Our present mirrors in the large-bore amplifier are
sapphire, while in the 1 kW source we will probably use copper mirrors. In
either case, approximately 1. 5 percent loss occurs at each reflection. The
41
T" I

rcsultan' heat (15 W per mirror) must be removed by conduction cooling.
In addition, there are likely to be transient distortions set up by pulse
heating effects. A rapid "xpansion occurs at the absorbing surface each
time a 10 i^sec pulse is reflected. When an absorptive surface is used in
our present amplification experiments, a clearly audible tone is heard
at 3, 6, and 12 kc, even at average power levels of a few watts.
As far as refractive effects are concerned, we have measured
the effects present in a 3/^ in. discharge tube operating under the normal
conditions for a maximum amplification at 10, b\j. and in other gas mixtures. o
This was done by passing a collimated probing beam (\ = 6328 A) along the
tube pxis, and also along the tube wül parallel to the axis. We have found
that a refractive index gradient appears along the tube wall in discharges
containing N?, 0?, C02 and mixtures thereof. The introduction of helium
into the discharge reduces the effect by a factor of approximately 2. The
pure helium discharge shows no obser able effect. A beam sent along I^L
tube axis shows an expansion at its edges approximately 3 times less than
*he observed displacements for the beam along the wall. These affects are
consistent with an axially symmetric negative lens effect with a parabolic
dependence on radial position;
n(r) = no ( I ■ y r )
Our measurements show that for a discharge in 1 torr of CO?, the
refractive index at the wall is greater than that along the tube axis by an
amount of 3 X 10 This is to be compared to the refractive index contri-
bution of 1 torr of C02, namely 4 X 10 Whether the cause of 'his effect
is purely a density van ition, or due to molecular excitation and dissociation
is not yet clear. Nevertheless, this ligure represents a difference in optical
length of \/3 for a 10. 6M- beam passing through a 10 meti : tube- Since we
are contemplating total lengths in excess of 40 meters, it becomes an im -
portant consideration in maintaining the beam shape. Wl ether this effect
42
i. L:
\ r

is comparable in magnitude for radiation ?* 10. 6(1 as it is for radiation at
0. 6328(1, is not yet known for sure but will soon be investigated in detail.
What we have observed, however, is that the emission pattern at the output
of the 20 meter, large bore amplifier is not significantly changed by the
presence of the discharge, e nd only varies in brightness. The implication
is th?t only minor changes, if any, are introduced by the purely refractive properties of the discharge.
The third effect, due to nonuniform gain profiles, is likely to be
the most significant effect, and is yet to be experimented on. As discussed
previously, we have measurements of these gain profiles as functions of gas
mix and tube current on dc-excited tubes, and have considerable control
over ♦hese profiles. In pulse-excited tubes, however, pulse-to-pulse
instabilities may occur which distort the gain profiles to give an azimuthai
variation as well as a radial variation, effects associated with streamer-
like discharge patterns. These effects are still to be investigated.
43 lv

VII. OPTICAL MATbJHIALS
While there are numerous mr>< ials which transmit radiation at
10. 6|JL sufficient for their use as window» and lenses in conventional optical
instruments, their attenuation is usually too great for their use in the
present context of a high-power transmitter.
In fact, there are four materials which we have considered:
1. Sodium chloride
2. Germanium
3. Gallium arsenide
4. Irtran-4
Of these, sodium chlonae has the lowest loss coefficient (<0. 01cm )
and the lowest refractive index. There are no significani hea mg effects in a
1/2'* windtw for a flux below 10 watts/cm . We have used such windows to 2
transmit 1200 watts over an area of ~20 cm , but at this level, some deteri-
oration is found after use for a period beyond 1 hour. This material must be
handled with care, being subject to damage from moisture, slight abrasion,
and mechanical and thermal shock. It is nevertheless the most widely used
window material for CO? lasers at present.
Germanium, in its present form, has a loss copffkieni of approxi-
mately 0. 01 cm but this loss increases rapidly with rising temperature
and is therefore subject to thermal runaway. We have used water-cooled 2
windows to handle 100 watts per cm , and could probably increase this
figu' ? by d factor of at least 2. Germanium takes a farood optical finish and
can be obtained in large crystalline ingots. At this time it is the best
material available for partially transmitting laser mirrors. Its high re-
fractive index (4. 0; requires the use of antirefiection coatings when it is
used as a window. Given adequate cooling, we believe that germanium is
a more rugged and longer-lived material for high-power optics than is
sodium chloride.
4 4
T
Gallium arsenide, specially doped with iron to increase its
resistivity to greater than 10 fl ~ cms, has optical properties similar to
those of germanium, with the advantage that the loss should not be strongly
dependent on temperatur. . We have used a water-cooled window of 3/4"
diameter with 500 watts impinging on it with no deleterious effects, although
a loss of 4 % of the incident energy was measured. If this material r-ould
be obtained in large plates, it would be somewhat superior to germanium
for high-power use, although cooling would still be necessary.
Irtran-4, an aggregate of zinc selenide, tends to vary in quality
from piece to piece, but the best specimens make excellent lenses and
windows for medium power (less than 10 watts/cm ) applications. T.T»Ir
problem is one of thermal distortion, and we believe that they would be of
little use at high average power levels.
It is our intention at this time to use g "manium windows, and we
are setting up experiments for loss measurements on various sample pieces.
4S
Vni. PRESENT STATE OF THE TRANSMITTER DEVELOPMENT
Based on the various observations outlined abcve, we have developed
a design for a 1 kwatt source as follows:
We envisage a cw stabilized oscillator with a single-mode, polarized
output of 30 watts. It will consist of a 2-meter length of l/2" i. d. discharge
arranged as a near semi-confocal resonator. The output window will be a
water-cooled germanium flat. The beam will be collimated to form a 3/4"
dia. beam and passed through a dc-excited buffer amplifier with internal
diameter of 1". and total length some 12 meters. At this point the average
power level will be approximately 400 watts. Using reflective optics, a
focal plane chopper, carefully polished to cut down on scatter, will form the
desired pulse train. After recombination and expansion of its diameter by
two times, the beam will pass into 40 or perhaps 50 meters of 2" dia. power
amplifier. (The window materials will all be germanium, as close to the
Brewster cngle as is practical. ) The beam will be focused to propagate as
uniformly as possible throughout the mam power amplifier, which will be
excited by dc current. In this design, the buffer amplifier is always driven
into saturation by the incoming signal, while the power amplifier has a
single pass gain of 40-50 dB, and should be stable while the chopper is
closed.
We have built an experimental assembly along these lines using
NaCl optics, and jvi-h only 20 meters of the final 40-50 meter power ampli-
fier. Up to this point, the main problem has been the control of the beam
coming from the primary oscillator. Using a 12 kc train of 10 \isec pulses,
we have measured up to 435 watts of average power at the output window,
distributed in a spatial pattern determined by the signal coming out of the
buffer amplifier. In these experiments, the primary oscillator power was
approximately 20 watts in a double spatial mode The cw signal at the
output from the buffer amplifier was approximately 300 watts. Spurious
46

oscillation pulses have been seen in this assembly when the chopper blade
is open, but these are again suppressed by the amplified signal for the oscillator when the latter is turned on.
Work on this system is going on, of course, and we believe that
with proper control of the oscillator, proper use of the two amplifiers, that,
an output of the order of 500 watts will be obtained from the present equip-
ment. Even with the present results, it seems evident that a 50-me.ar
power amplifier will produce in excess of 1 kw average power, and we
intend to begin construction of such a device immediately. While this is
going on, experiments will continue on the window materials, on the far-
field pattern of our existing transmitter and its dependence on our optics.
In a different context, the properties of the existing system will be studied
using i- cw source, a dc- driven buffer amplifier and pulse excitation of
the main power amplifier. Pulsed power supplies adequate for these latter experiments have been built.
47
IX. SUMMARY
In this repo^. we have outlined our original guiding thoughts on
the achievement of a l kW power transmitter, our initial experiments on
dc- and pulse-excited amplifiers, their interpretation in terms of the laser
and discharge dynamics and their significance for the overall design of high-
power amplifiers.
As a result of this work we have designed and built a prototype
system which is presently being tested. The most impo> cant work yet to
be done has to do with the far-field and propagation properties of the beam
and investigations of the quality and stability of the optics under the action
of high average powers and high pulse powers.
48
ft-
■ ■■■'■- \

REFERENCES
1. M. Weber and T. Deutsch. IEEE J. Quant. Elec. QE-2, 365(1966).
2. D. R. Whitehouse, "High Power Gas Laser Research," Final Technical Report on Contract DA-01-021-AMC-12427(Z), May 1967.
3. T. J. Bridpes, Appl. Phys. Letters 9. 174/1966).
4. H. Statz, C. L. Tang, and G. F. Koster, "Transition Probabilities between Laser States in Carbon Dioxide," J. Appl. Phys. 37, 4278 - 4284 (1966).
5. H. Kogelnik and T. J. Bridges, IEEE J. Quant. Elec. QE-3, ',3(1967).
c
49

BLANK PAGE
!
^
>-

Unclassified Secunlv ClaiiificMtion
[ DOCUMENT CONTROL DATA 3&D j (SwaiHty efa*t>/ie«rien at lllf# body of mb»ltmcl mnd mdwrnng m*rK>t»"<m mutt tt »n-«f#rf *ft«n ih» 9**tmll rrpafi is ■■ (flj«t/>»rfi
l OKICINATIW 0 ACTIVITY rCerpönf »g(ho>;
Ravtheon Company Research Division '1« »E»0«T tJCu«' '> (T L4UI' C» '.ON
Unclassified Waltham. Massachusetts 02154 N/A
1 nt^OUT TITLI
Research Study of a C02 Laser Radar Transmitter
« OKtCm^Tlvt NO^tl tTjrp» el nßoil ti4 inc/u.i.» Mt««)
j Semiannual Technical Summary Report 11/1/66 to 4/30/67 i AUTMOHW r<.««t nan«, itrtt nmmm. Inlllml)
Miles, Perry A. and Horrigan, Frank A.
« RCPOST oATi June. 1967
7« TOTAL NO or »Aarr 48
76 NO OF ncr« 5
t« eONTÄACT OH OHANT NO
N00014-67-C-0264 k -«ojiCTNo NR 015-714
. ARFJA Order No. 306
*
t. o'iaiNATon'S mtromr NUMSCHTSJ
S-970
10 AVAIL ASIUTV/LIMITATION NOTICCt
Reproduction in whole or in part is permitted for any purpose of the United States Government.
It SU^LCMENTARY NOTES
N/A 12 SPONIOMING MIUTAHV ACTIVITV
Advanced Research Projects Agency Office of Naval Research Department of Defense
II. ABSTRACT
This report concerns the investigation of physical properties of laser amplifiers, using electrically excited mixtures of CO-, N?, and He with a view to producing high-power pulse emission with welr-coirtrolled temporal and spatial form. The object of this investigation is to design and build such a source with an average power of 1 kW in a form suitable for use as a laser radar transmitter.
Designs have been developed for both dc - and pulse-excited amplifiers and the physical quantities of importance in these designs have been measured. The most notable of these are; the signal intensity required to drive an ampli- fier to saturation, information on the refractive properties of the discharge, the time constant determining maximum pulse repetition rates, both for the input pulse trace and for the pulse excitation process, and the practical gain levels that can lead to self-oscillation in the amplifier. These measurements lead to the choice of a system in which a train of 1 0 - 1 5 nsec pulses at a repetition rate of 10 - 12 kc is an.plified by a 50-meter length of dc-excited power amplifier.
DD FORM 1473 Unclassified SecunJv Classification
T

Unclassified Si i Liti!\ C L.NSIIH .,t|,,n
£ ■ •"" c s
CO, Laser Transmitter
H'gh Powpr Laser Amplifier.
COj Laser Pulse Amplification.
INSTWCTIONS
1, ORIGINAT1M ITY: Ent« Ih» name mnd «ddr«« ol Ih* coMraclor. . .ractor. grantee, Department of De- tente activity M otKPt orgcmration ('corporate mthot) i**ulng the report.
la. REPORT SECUHTY CLASSIFICATION: Enter the over- all aecurity clattlfiction of the report. Indicate whether "Rcttncted Data" i» included. Marking ia to be in accord- ance with appropriate recurtty r»|ulalion*.
26. GROUP: Automatic downcrading it specified In DoD Di- recttv* S300.10 and Armed Forces Induttntl Manual. Enter the »raup number Alao. when applicable, the* that optional markingt have been uaed lor Group 3 and Group 4 at author- ned.
3. REPORT TITLE: Enter Ih* complete report title in all capital letter*. Titlet in all cate* thould be unclattificd. If a meaningful title cannot be telected without clattifica- tion, thow title clattification in all capllalt in parenthetit immidielet y following the title.
4. DESCRIPTIVE NOTES If «pproprui*. enter Ih* type of report, e.*,. interim, progret . tummary, annual, or final. Civ* the inclutiv* dale* when a tpecific reporting period is covered.
5. AUTHOR(S): Enter the nam*(t) of authot<t) at thown on or in the report. Enter leal name, firtt name, middle initial. If military, thow rank and branch of service. The ntmt of Ih* principal author ia an abaolute minimum requirement*
6. REPORT DATE: Enter the date of the report at day, month, yc»r; or month, year. If more than one date eppeart on the report, ute dale of publication.
7a. TOTAL NUMBER OF PAGES: The total page count •hould follow normal pagination proceduret, i.e.. enter the number of page* containing informatioiv
7b NUMBER OF REFERENCES Eater the total number of referencrt cited in the report.
ta CONTRACT OR GRANT NUMBER: If «propriate, enter the applicable number r( the contract or grant under which the report was wntteiv
S6, 8c, & id. PROJECT NUMBER: Enter the appropriate miltttry department identification, tuch at project number, subproject number, system numbers, task number, etc
9* ORIGINATOR'S REPORT NUMBER(S): Enter the offi- cial report number by which the documen; will be U>m,fl*d and controlled by the originating activity. This number mutt be unique to this report.
«fc OTHER REPORT NUMBER(S): If the report hat been assigned any other report numbers (tither by the originator or by rhe tponror). elso enter '.his numberts).
10. AVAILABILITY/LIMITATION NOTICES: Enter »ny lim- itation* on further distenunatlon of the report, other than that* impoted by security clattification, using tttndard ttat*m*nta ■uch •■:
(1) "Quetifled reijUBttert may obtain copl*t of this report from DOC"
(2) "Foreign announcement and dissemination of (Ml report by DDC If not authoritcd."
(3) "U. & Govemmanl agencies may obtain copiet of thit report directly horn DDC Other qualified DOC u**r* shall re(]u*al through
(4) "U, S. military agencies may obtain copies of «hi* report directly from DOC Other qualified uttn thatl requett through
(S) "Alt dittribution ot thit report it controlled. Qual- ified DDC user« shall request through
If the report has been furnished to the Office of Technical Services, Departmont of Commerce, for sal* to th* public. Indi- cate this fact and enter the nrlce. If known
11. SUPPLEMENTARY NOTES: Uoe for additional esplana- lory notes.
12. SPONSORING MILITARY ACTIVITY: Enter th* name of the dtpartmenta! project office or laboratory tponso-^ng fpay Ing lor) th* research and development. Include addraaa. 13. ABSTRACT: Enter en ebttra-t giving a brief and factual
I summary of the document indicative of the report, even though it may alto appear elsewhere in the body of ihe technical re- port. If additional tpace it required, a continuation sheet the 11 be attached.
It it highly detirabte that the abttract of clattified re- ports be unctattifir ' Etch paragrtph of the abttract thall end with an indicttion of Ihe military tecurity cltttiflcetlon of the information in th» paragraph, represented at (TS), (S), (C). or (V).
There it no limltttion nn the length of the abttract. How- ever, the tuggetteri length it from 150 to 22S »ordt.
14. KEY WORDS: Key words tre technically meaningful term« or thort phrttee thtt characterise e report and m«y be uaed at index e.^riet for ctttloging the report. Key wordt mutt be telected to thtt no security cltttiflcetlon it required. Iden- fiert, tuch it equipment model detignction. trade narre, mill- lary project code name. geo(>r*r>hic location, may be uted tt key wordt but will be followed by tn indication of technical context The assignment of linkt, rutet. and weights it optional-
Unclassified Security Claisification
,'*
*r