Embed Size (px)
Citation preview
Reshaping Reshaping Economic GeographyEconomic Geography
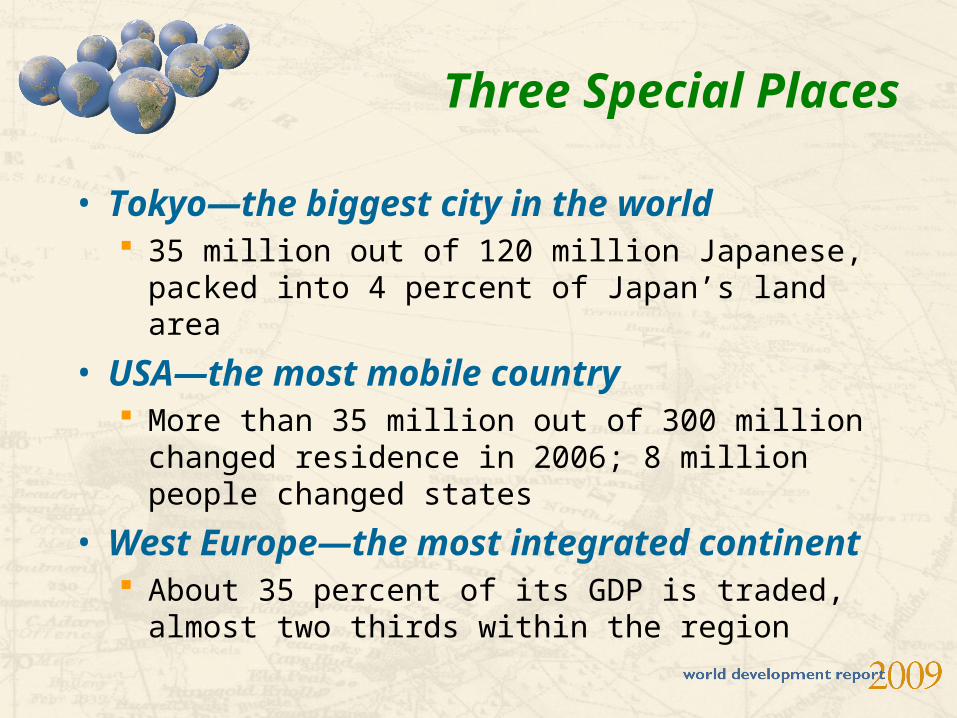
• Tokyo—the biggest city in the world 35 million out of 120 million Japanese, packed into 4
percent of Japan’s land area
• USA—the most mobile country More than 35 million out of 300 million changed
residence in 2006; 8 million people changed states
• West Europe—the most integrated continent About 35 percent of its GDP is traded, almost two
thirds within the region
Three Special Places
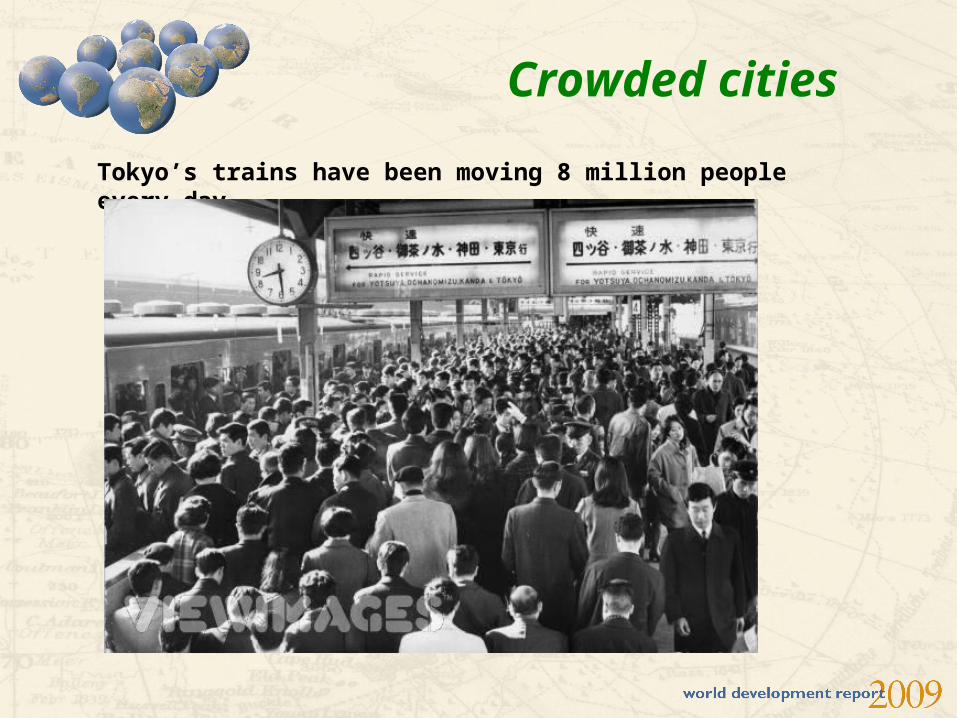
Crowded cities
Tokyo’s trains have been moving 8 million people every day
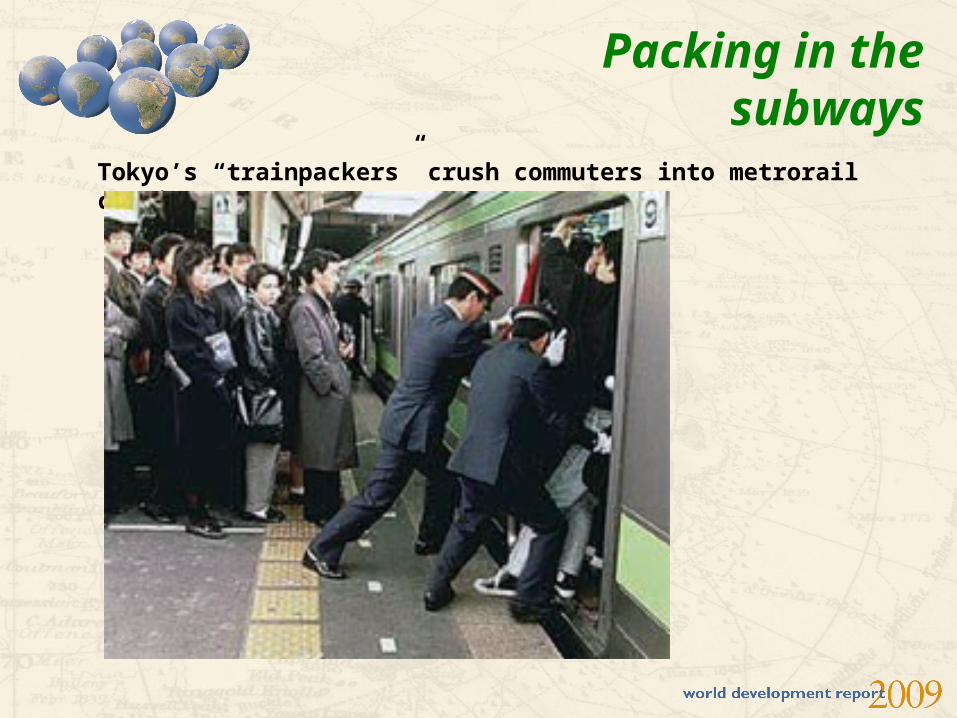
Packing in the subways
Tokyo’s “trainpackers” crush commuters into metrorail carriages
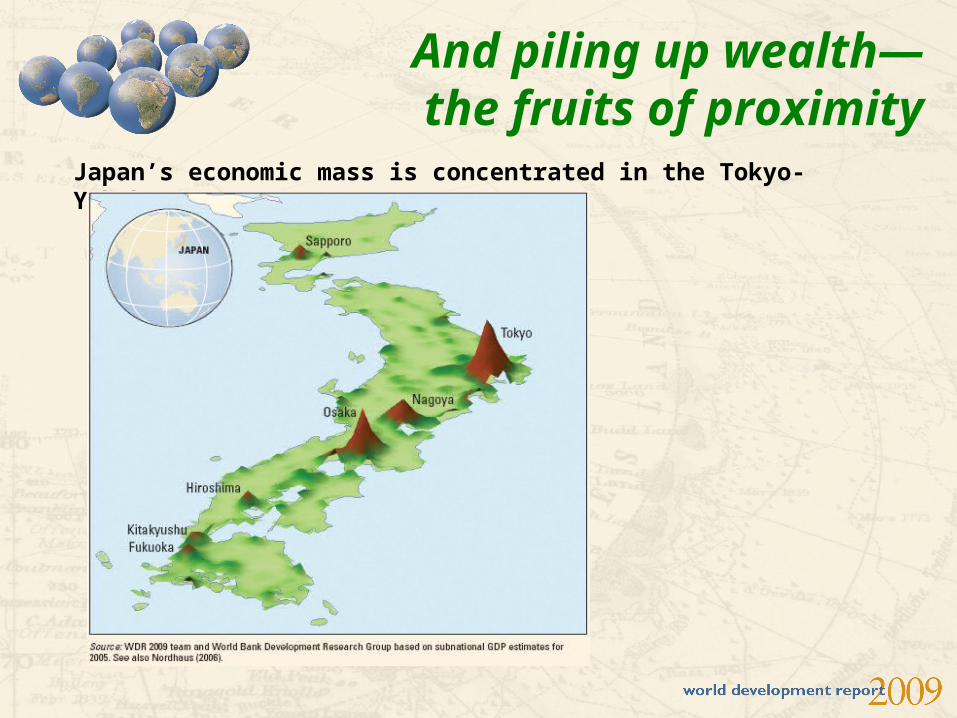
And piling up wealth—the fruits of proximity
Japan’s economic mass is concentrated in the Tokyo-Yokohama area
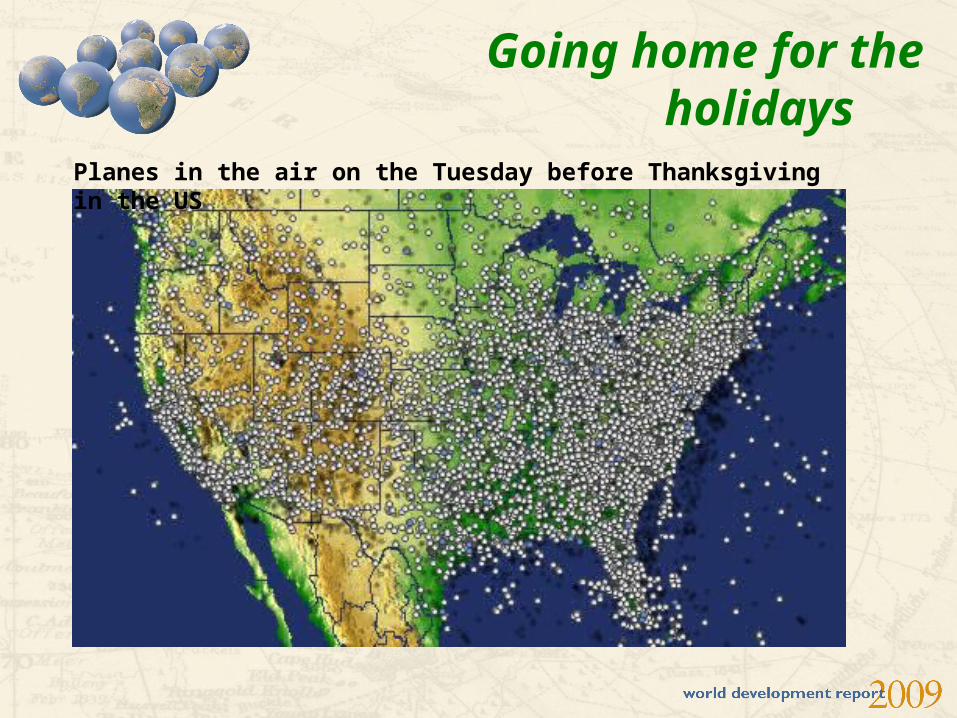
Going home for the holidays
Planes in the air on the Tuesday before Thanksgiving in the US
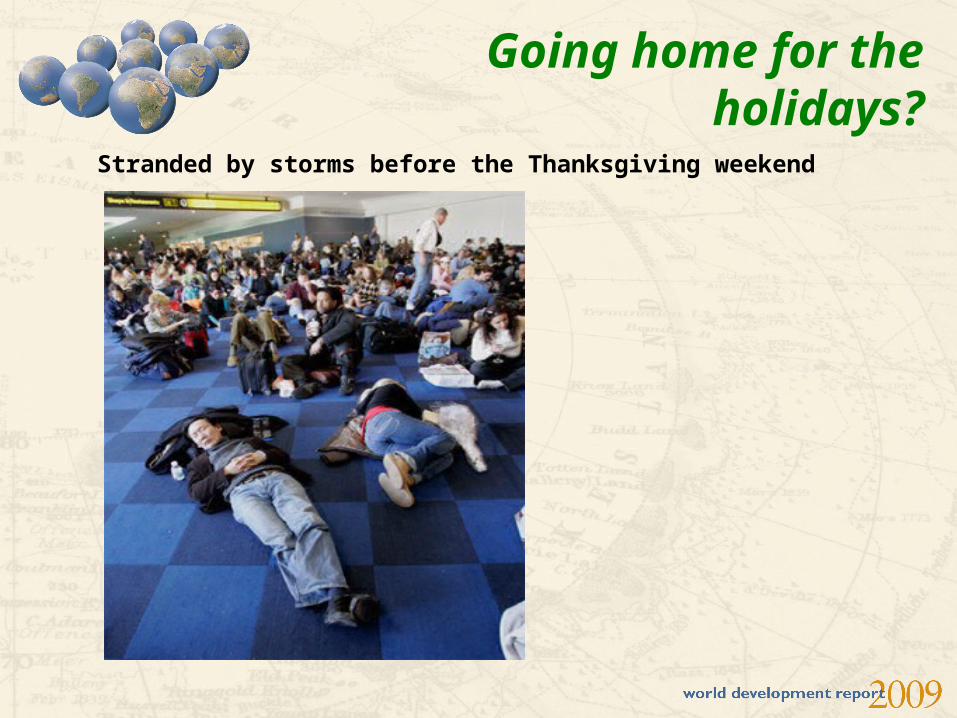
Going home for the holidays?
Stranded by storms before the Thanksgiving weekend
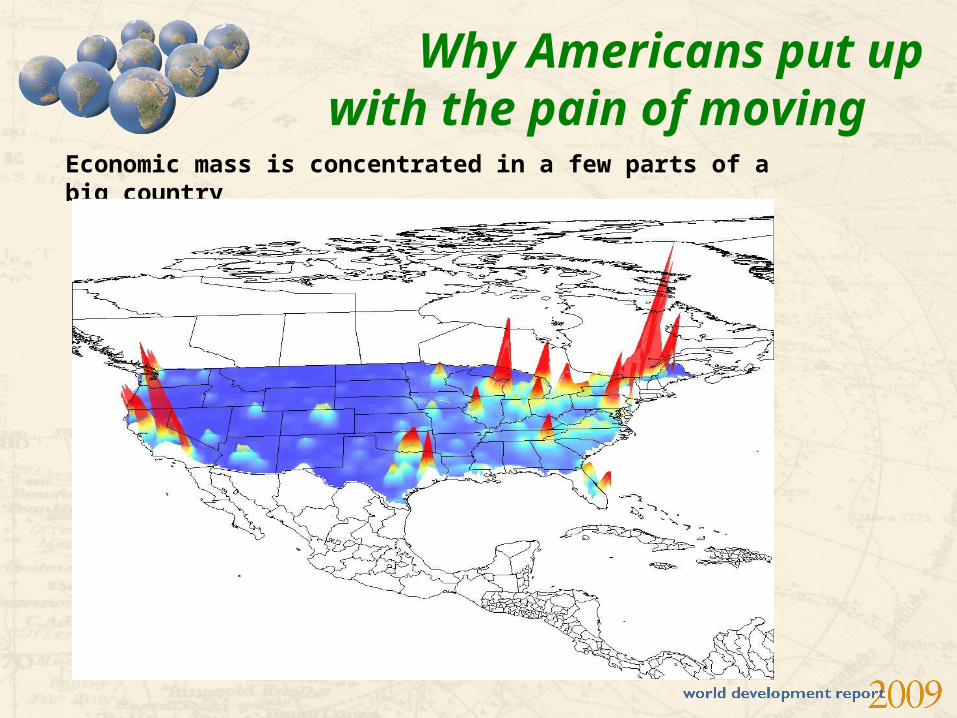
Why Americans put up with the pain of moving
Economic mass is concentrated in a few parts of a big country
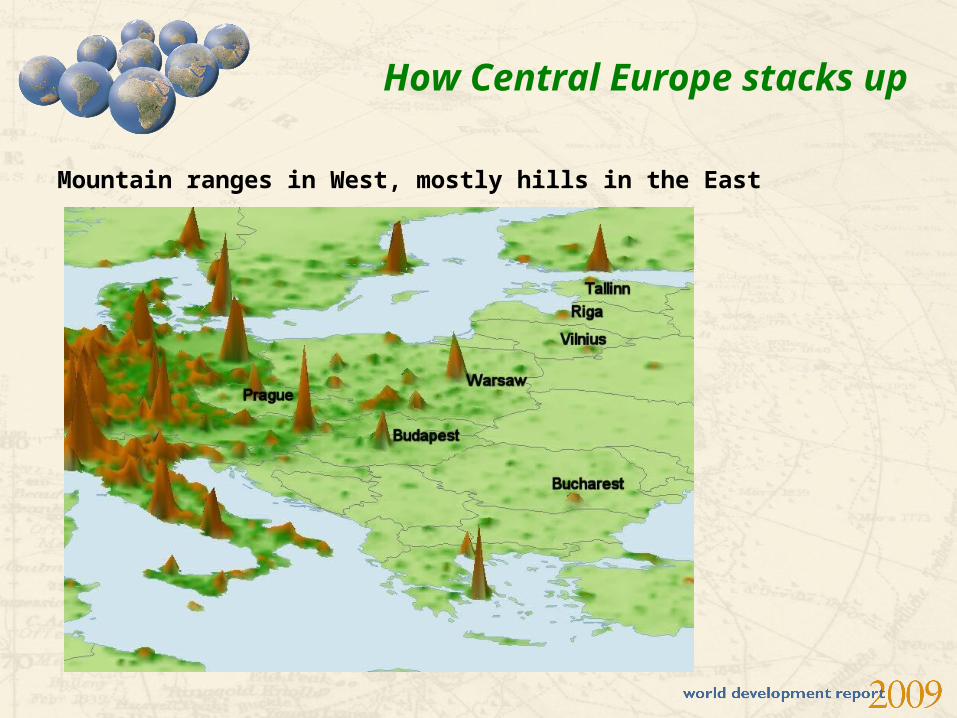
How Central Europe stacks up
Mountain ranges in West, mostly hills in the East
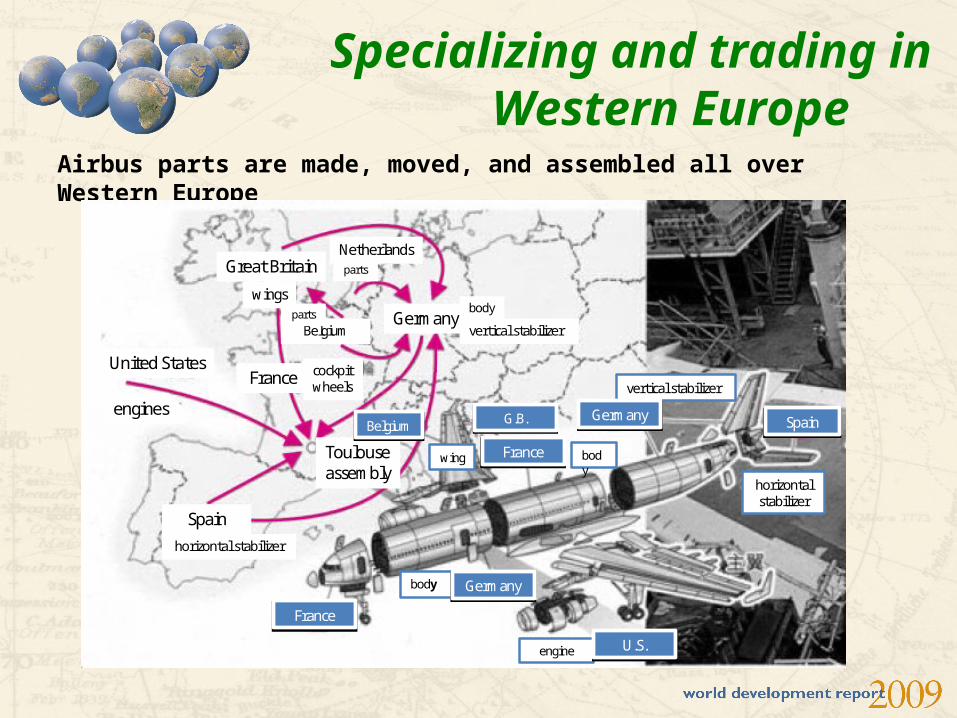
Specializing and trading in Western Europe
Airbus parts are made, moved, and assembled all over Western Europe
United States
engines
Great Britain
wings
Belgiumparts
Netherlandsparts
Germanybody
vertical stabilizer
France cockpitwheels
Toulouseassembly
Spainhorizontal stabilizer
FranceFrance
BelgiumBelgium G.B.G.B.
FranceFrance
SpainSpain
body GermanyGermany
body
wing
horizontal stabilizer
engine U.S.U.S.
vertical stabilizer
GermanyGermany
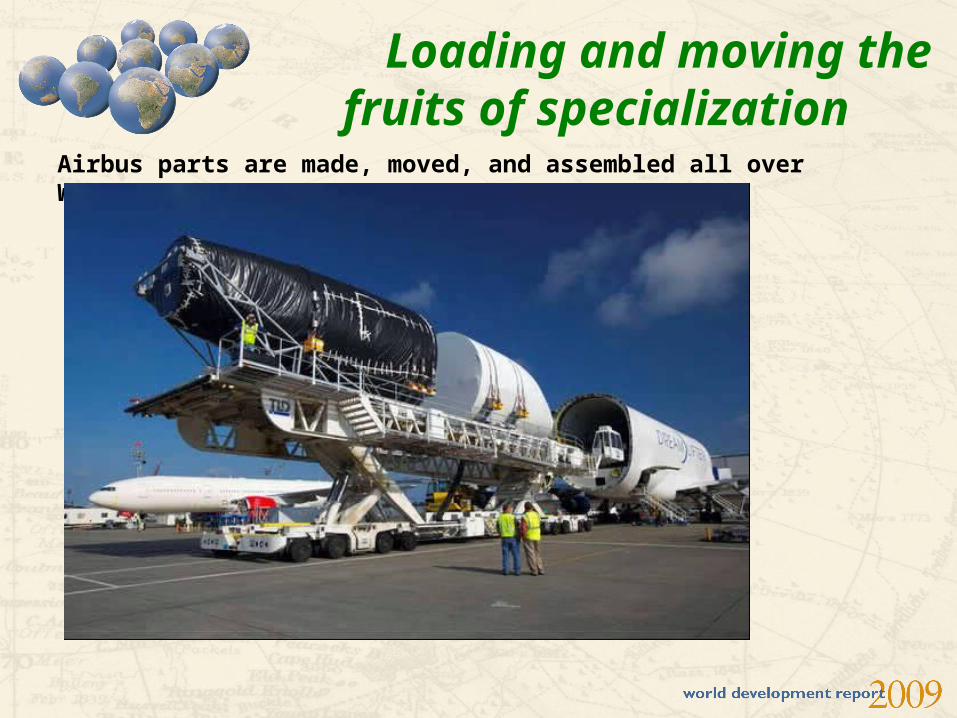
Loading and moving the fruits of specialization
Airbus parts are made, moved, and assembled all over Western Europe
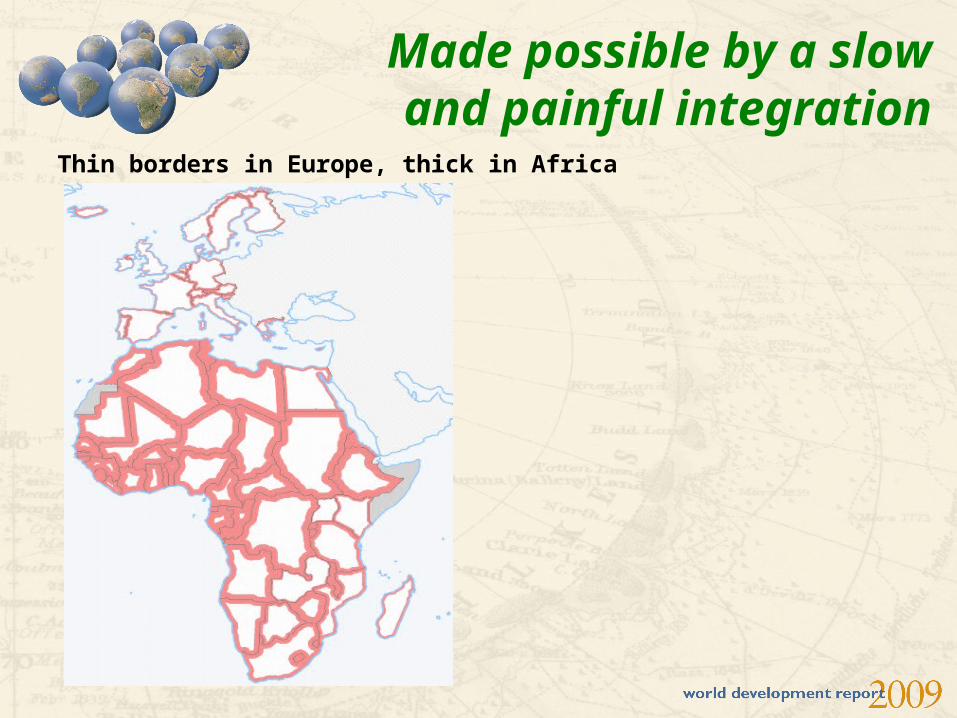
Made possible by a slow and painful integration
Thin borders in Europe, thick in Africa
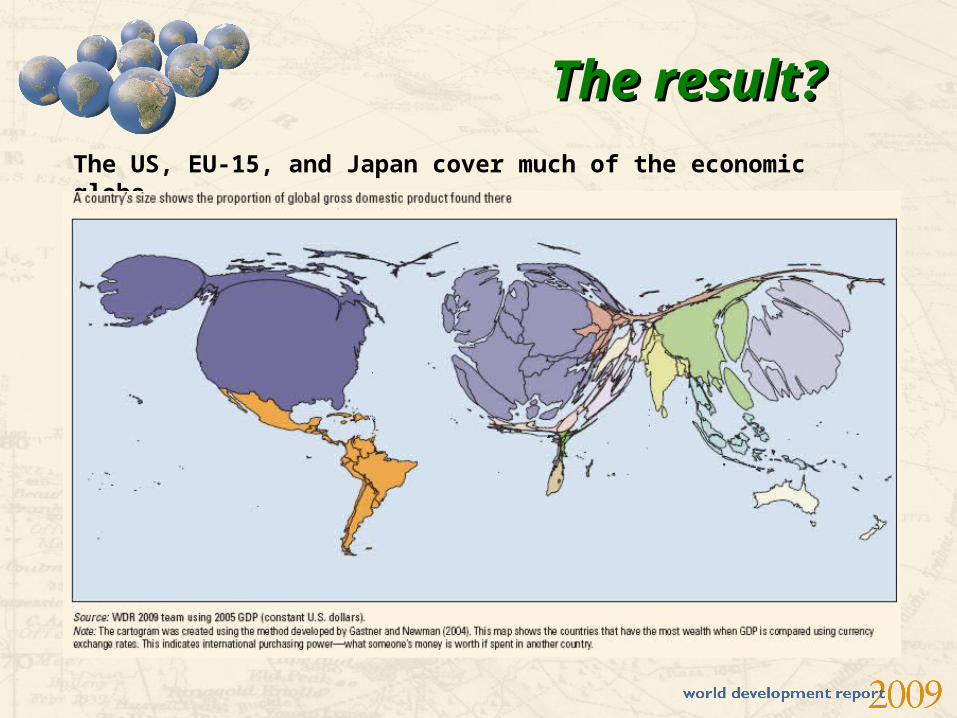
The result?The result? The US, EU-15, and Japan cover much of the economic globe
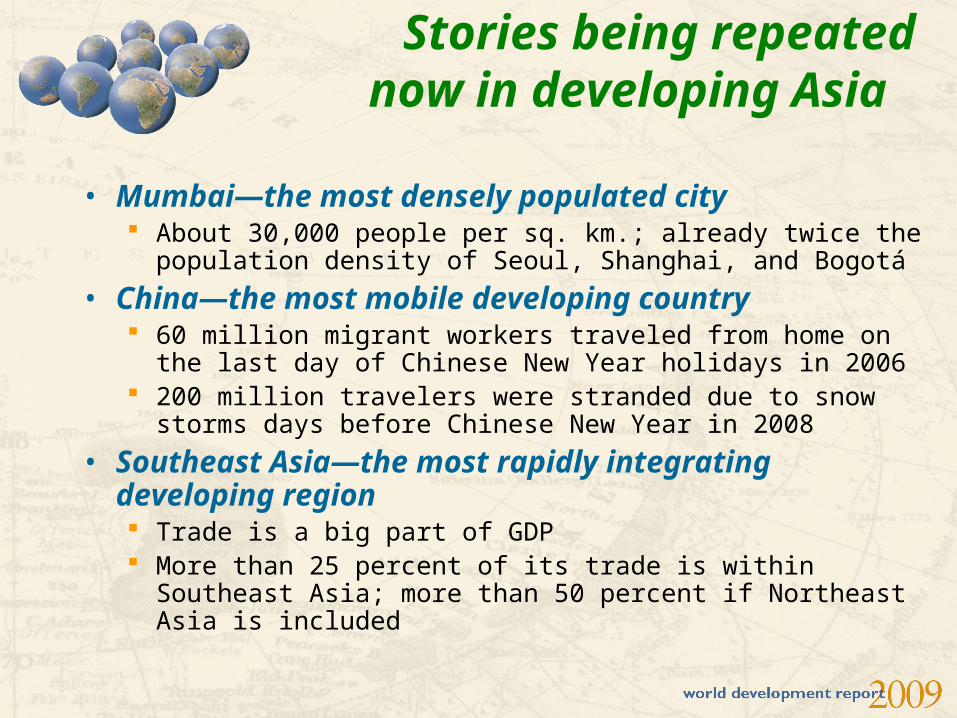
Stories being repeated now in developing Asia
• Mumbai—the most densely populated city About 30,000 people per sq. km.; already twice the population
density of Seoul, Shanghai, and Bogotá
• China—the most mobile developing country 60 million migrant workers traveled from home on the last day of
Chinese New Year holidays in 2006 200 million travelers were stranded due to snow storms days
before Chinese New Year in 2008
• Southeast Asia—the most rapidly integrating developing region Trade is a big part of GDP More than 25 percent of its trade is within Southeast Asia; more
than 50 percent if Northeast Asia is included
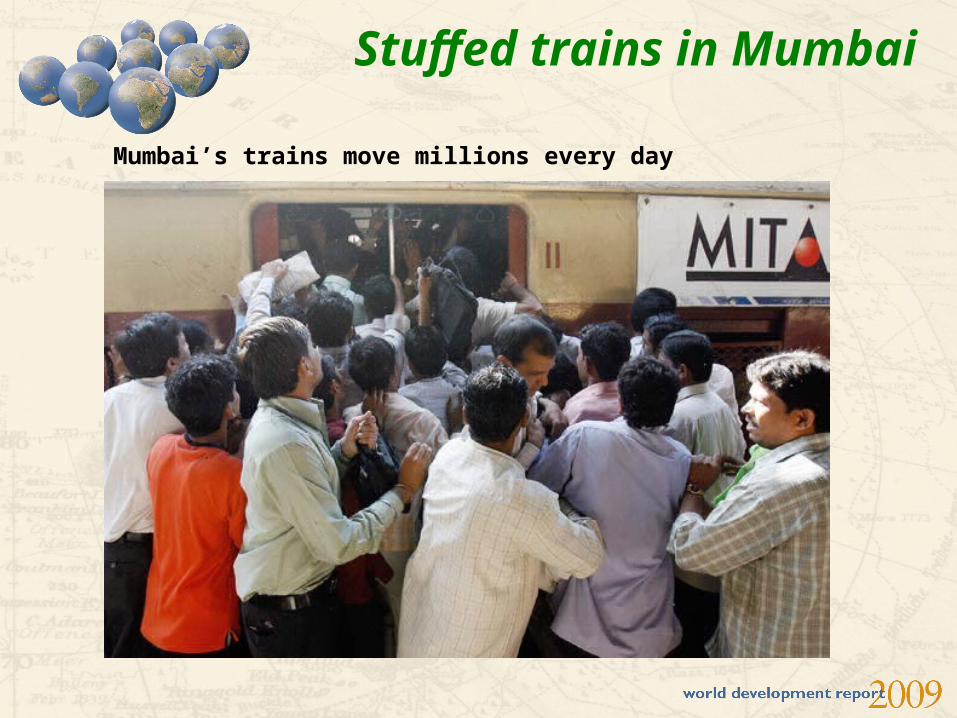
Stuffed trains in Mumbai Mumbai’s trains move millions every day
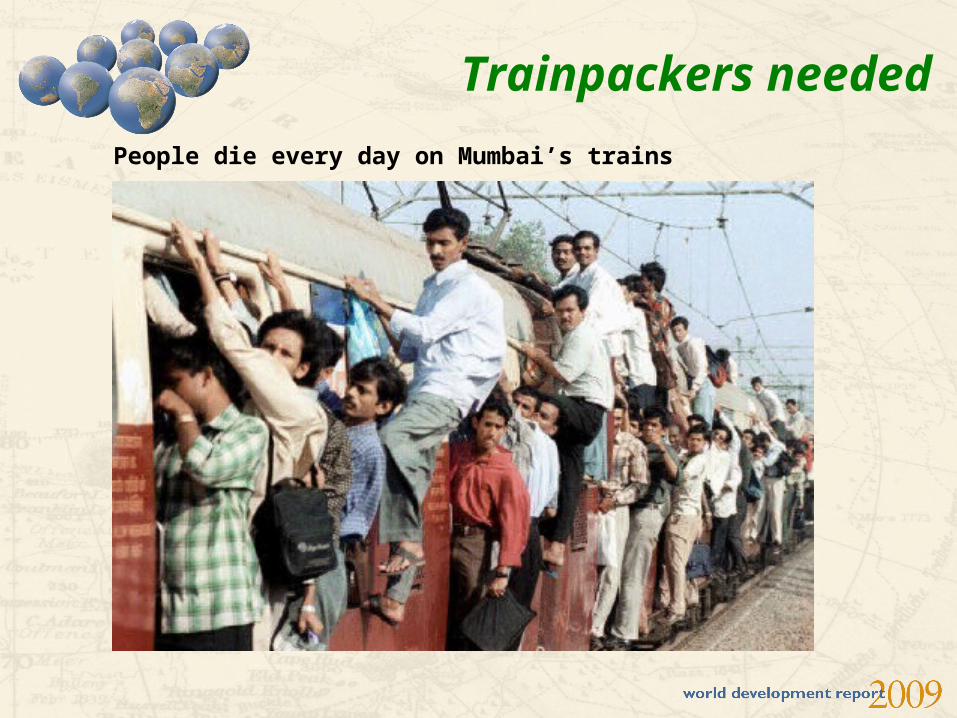
Trainpackers needed
People die every day on Mumbai’s trains
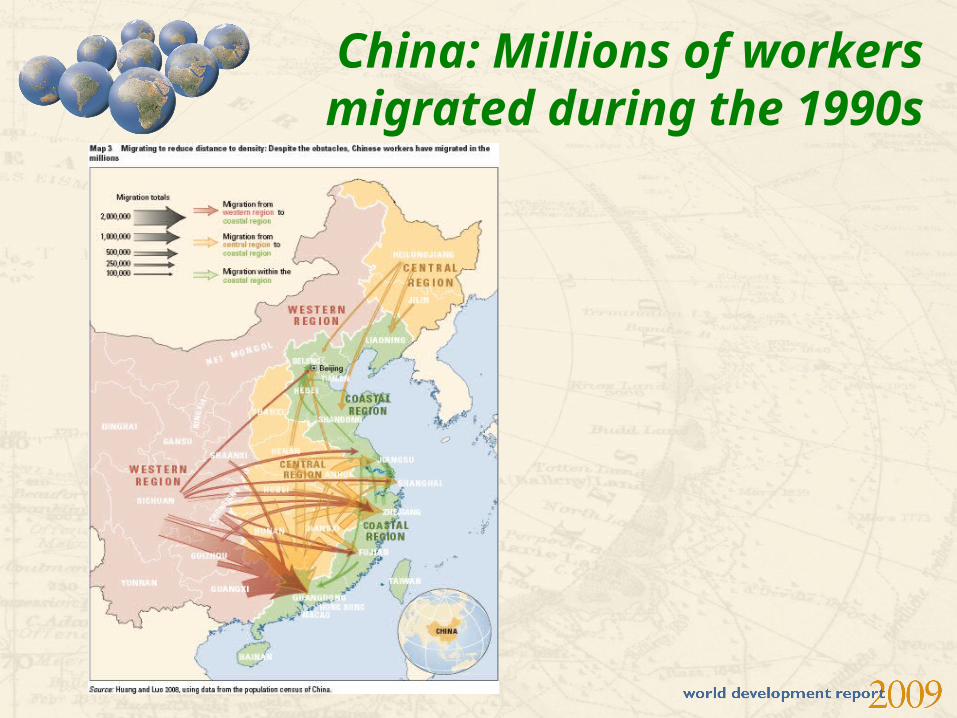
China: Millions of workers migrated during the 1990s
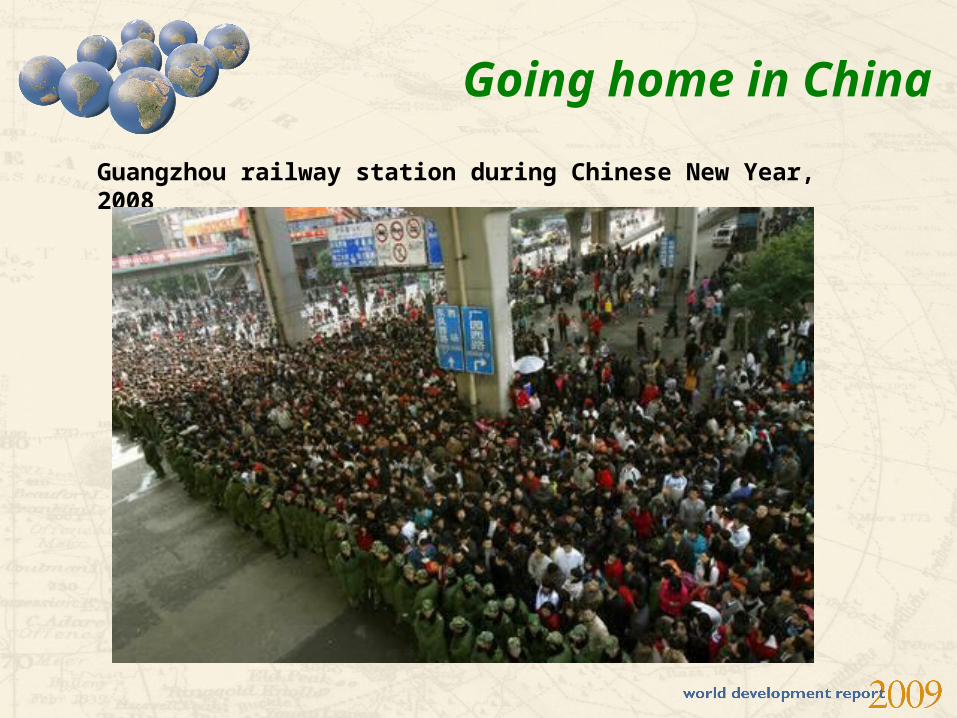
Going home in China
Guangzhou railway station during Chinese New Year, 2008
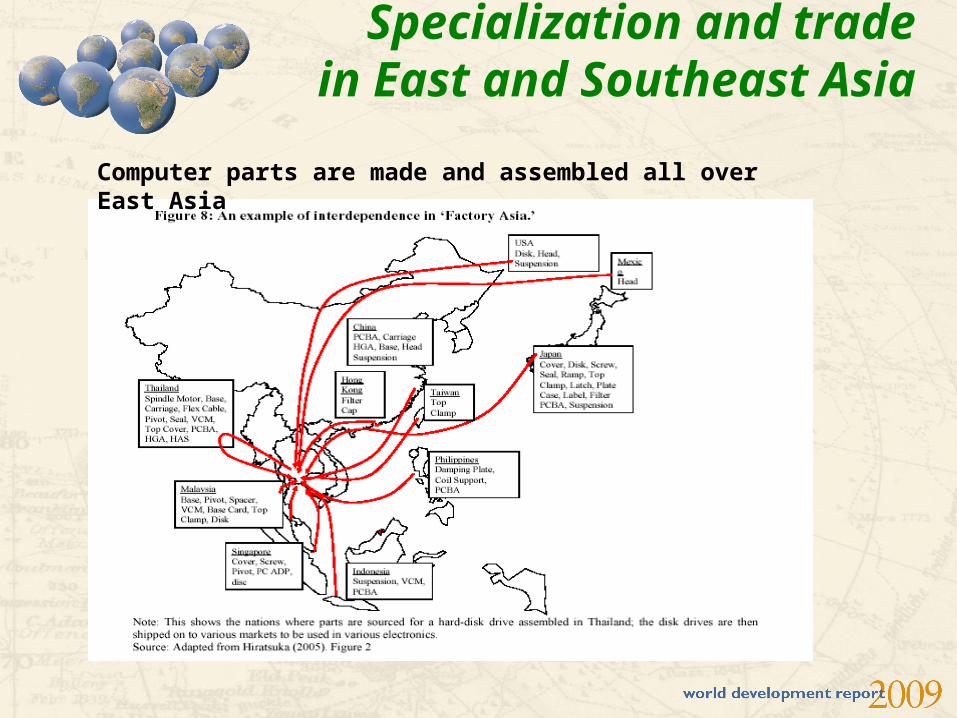
Specialization and trade in East and Southeast Asia
Computer parts are made and assembled all over East Asia
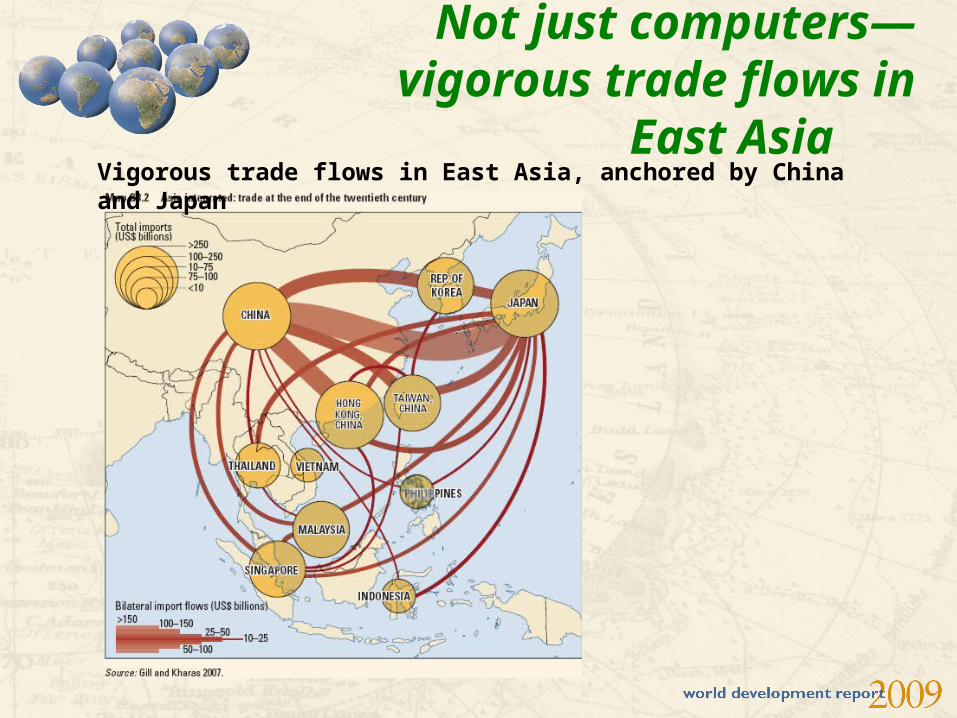
Not just computers—vigorous trade flows in East Asia
Vigorous trade flows in East Asia, anchored by China and Japan
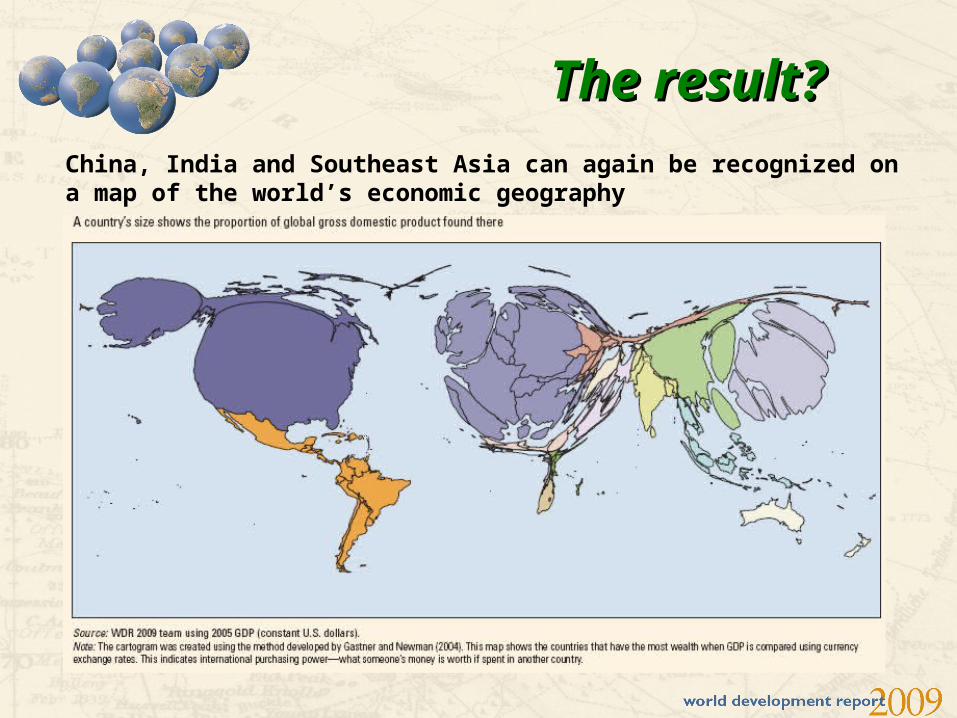
The result?The result? China, India and Southeast Asia can again be recognized on a map of the world’s economic geography
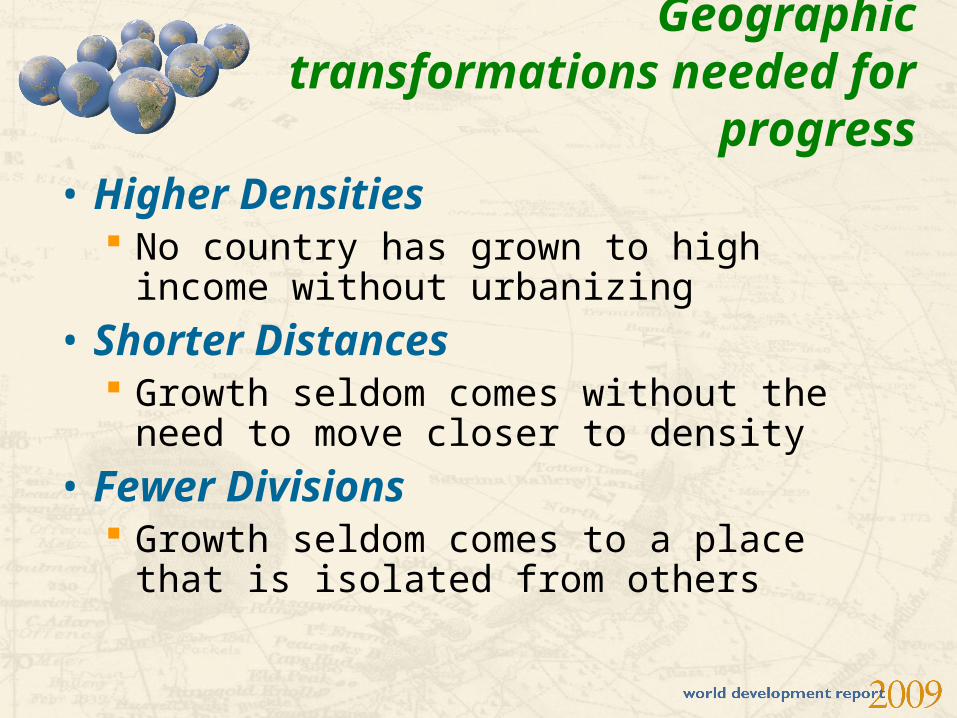
Geographic transformations needed for progress
• Higher Densities No country has grown to high income without
urbanizing
• Shorter Distances Growth seldom comes without the need to
move closer to density
• Fewer Divisions Growth seldom comes to a place that is
isolated from others
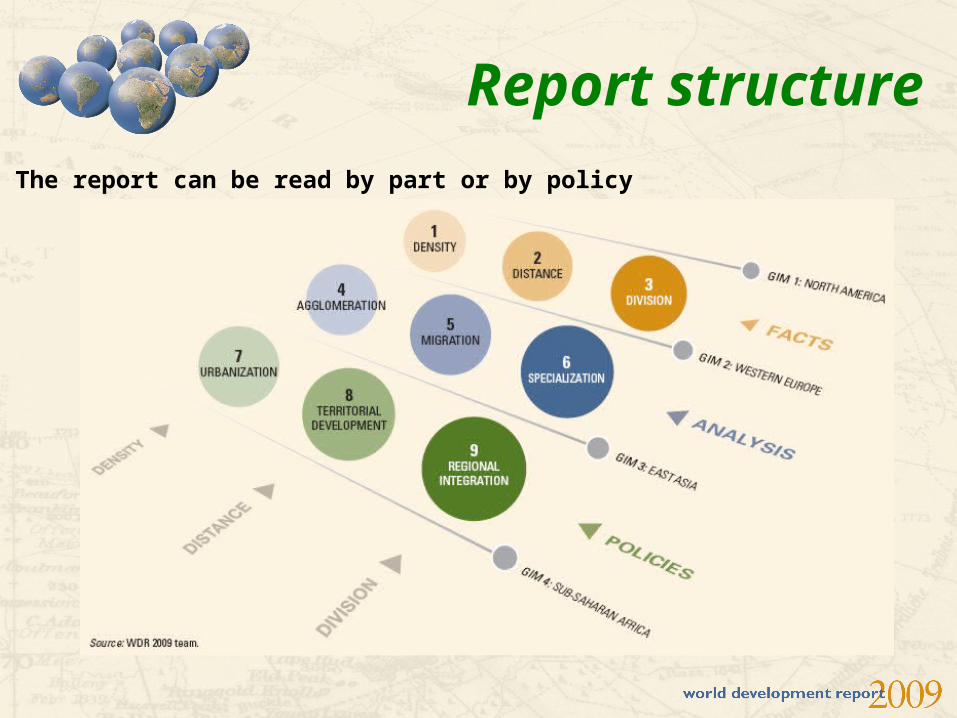
Report structure
The report can be read by part or by policy
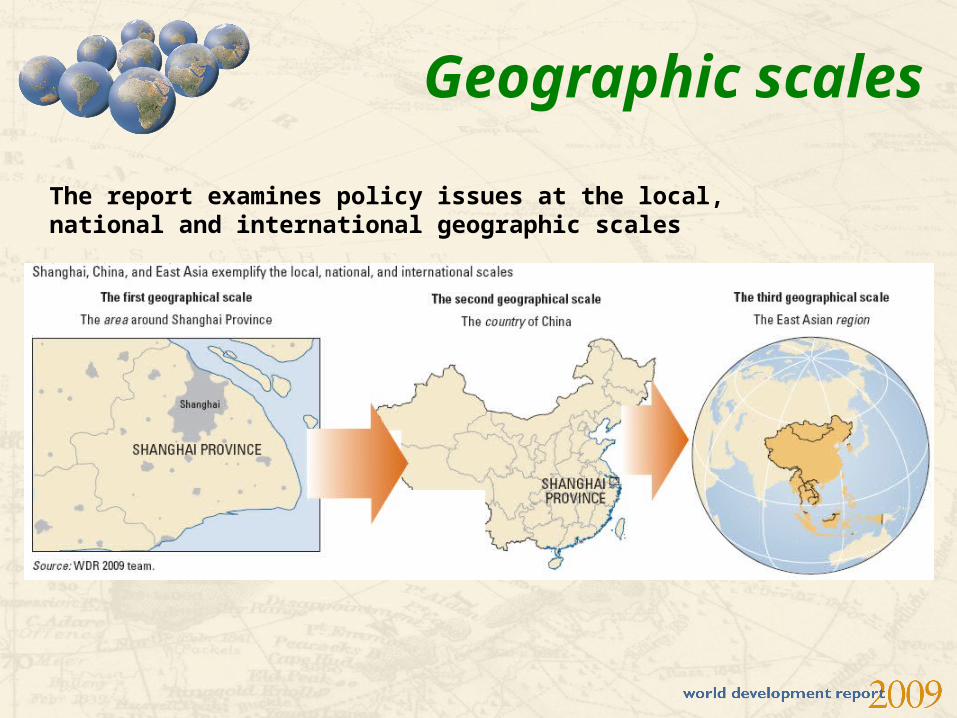
Geographic scales
The report examines policy issues at the local, national and international geographic scales
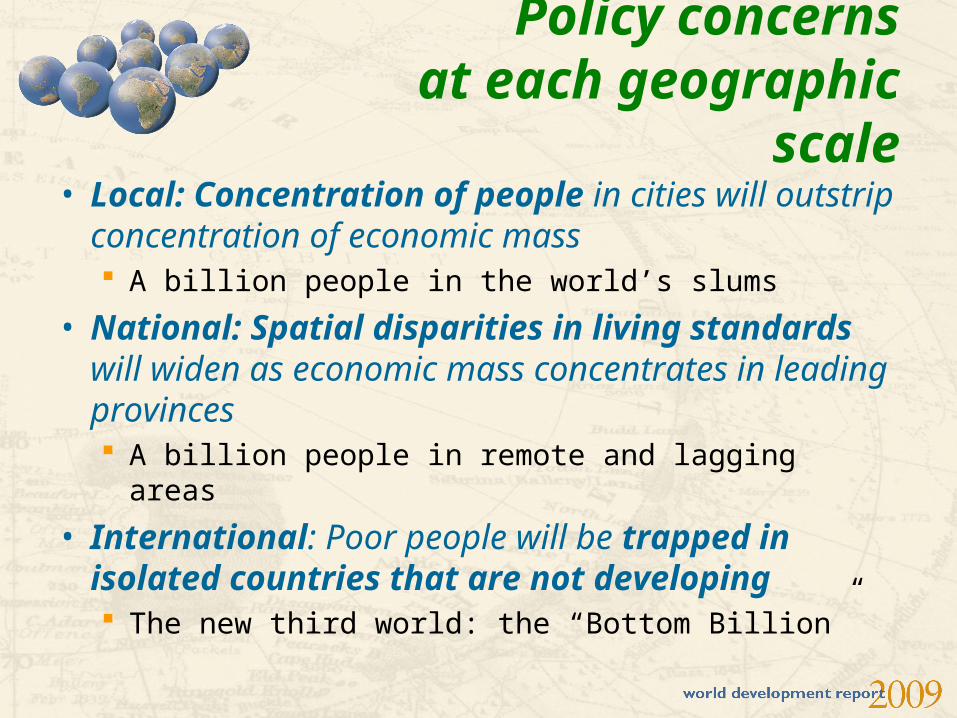
Policy concernsat each geographic scale
• Local: Concentration of people in cities will outstrip concentration of economic mass A billion people in the world’s slums
• National: Spatial disparities in living standards will widen as economic mass concentrates in leading provinces A billion people in remote and lagging areas
• International: Poor people will be trapped in isolated countries that are not developing The new third world: the “Bottom Billion”
WDR 2009 messages
• Growth will be unbalanced– Trying to spread out economic production
amounts to fighting the forces of economic growth• Development can still be inclusive
– Persistent spatial disparities in basic living standards are neither desirable nor inevitable
• How to get both unbalanced growth and inclusive development? Economic integration– Changing debates on urbanization, regional
development, and global integration from spatial targeting to spatial integration
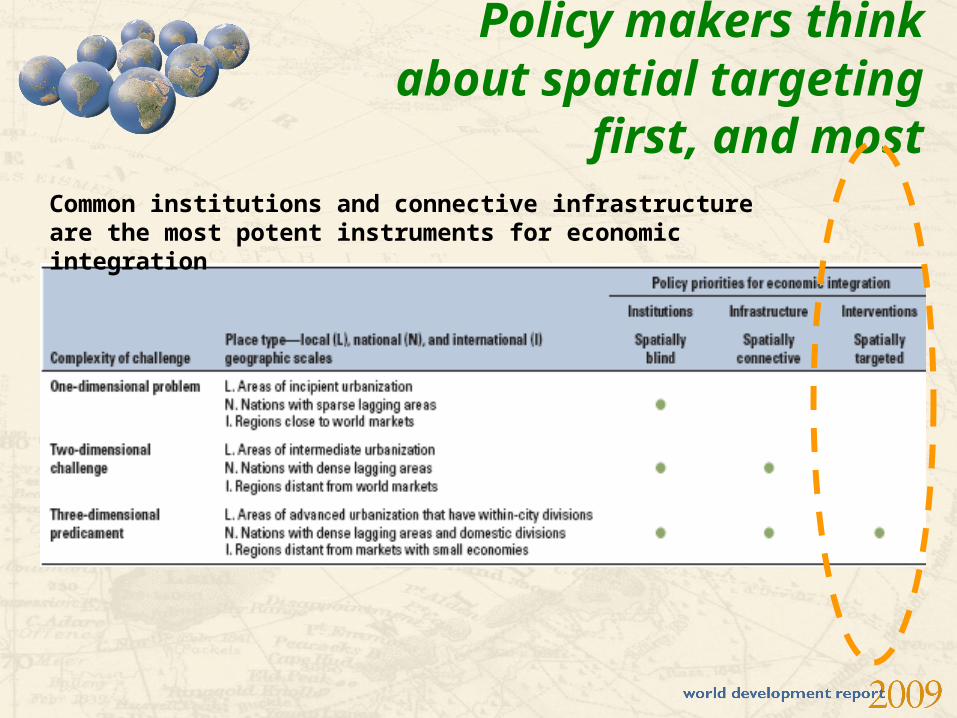
Policy makers think about spatial targeting first, and most
Common institutions and connective infrastructure are the most potent instruments for economic integration
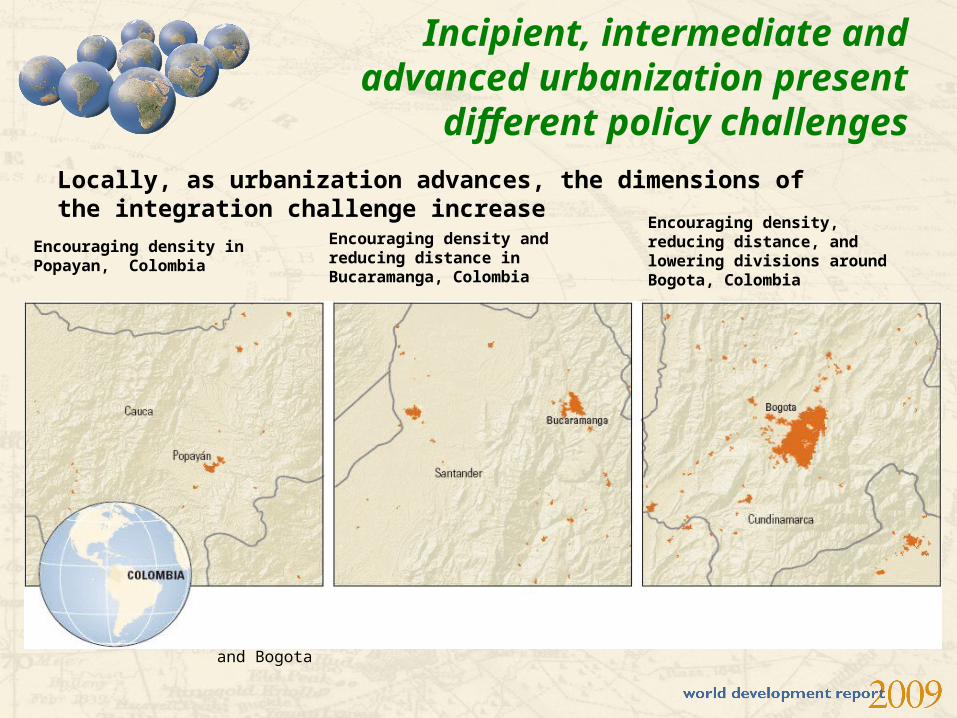
Incipient, intermediate and advanced urbanization present
different policy challenges
Locally, as urbanization advances, the dimensions of the integration challenge increase
Encouraging density in Popayan, Colombia
Encouraging density and reducing distance in Bucaramanga, Colombia
Encouraging density, reducing distance, and lowering divisions around Bogota, Colombia
Orange areas denote urban settlements—Popayan, Bucaramanga, and Bogota
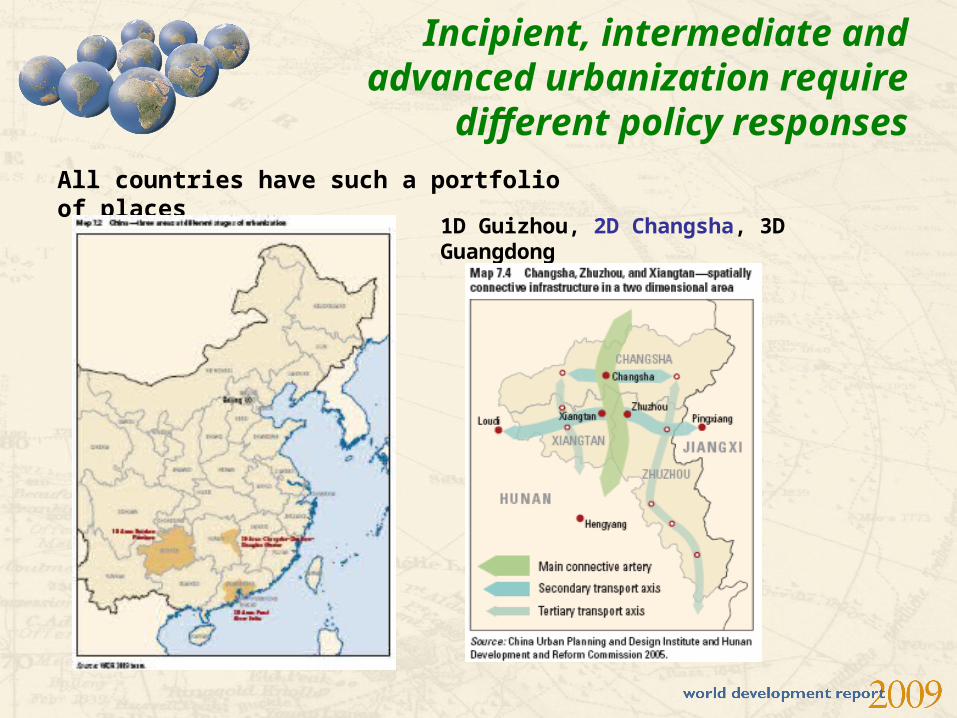
Incipient, intermediate and advanced urbanization require
different policy responses
All countries have such a portfolio of places
1D Guizhou, 2D Changsha, 3D Guangdong
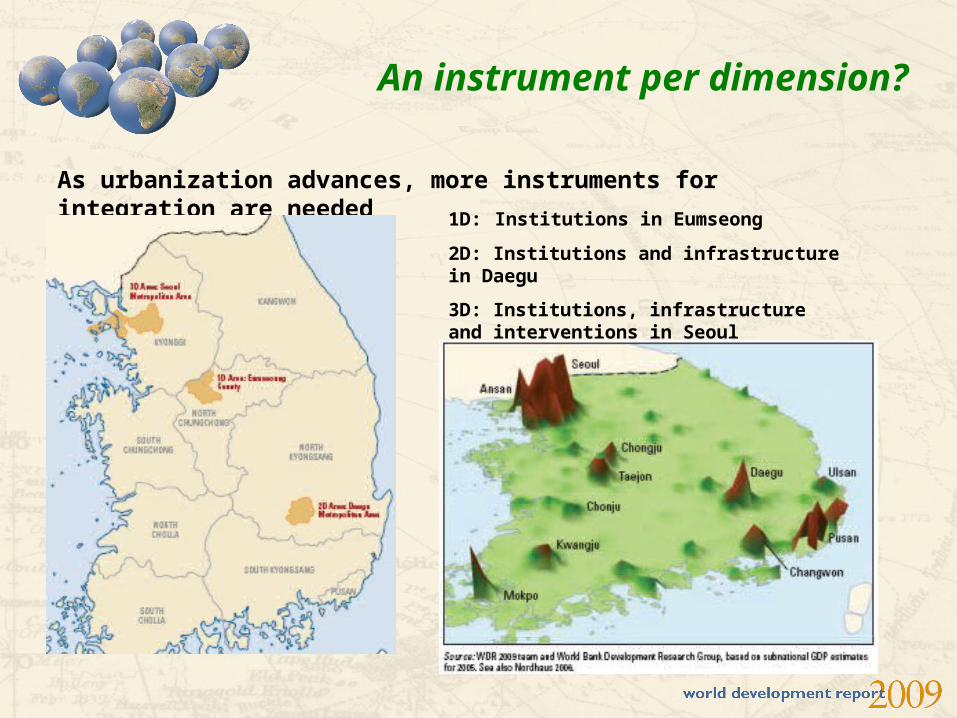
An instrument per dimension?
As urbanization advances, more instruments for integration are needed
1D: Institutions in Eumseong
2D: Institutions and infrastructure in Daegu
3D: Institutions, infrastructure and interventions in Seoul
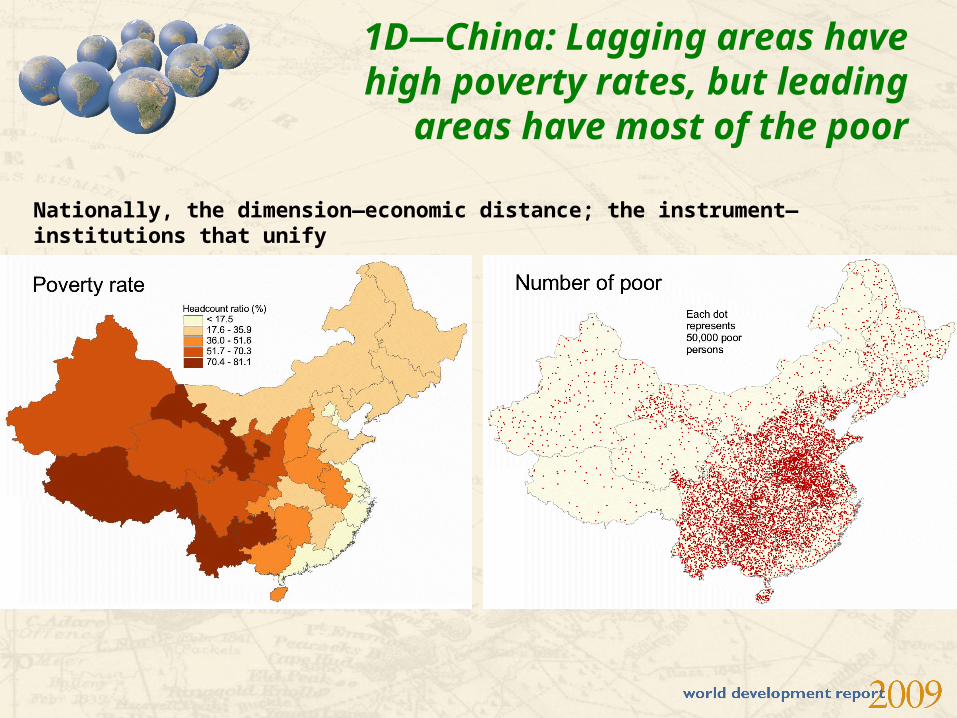
1D—China: Lagging areas have high poverty rates, but leading areas have
most of the poor
Nationally, the dimension—economic distance; the instrument—institutions that unify

2D—Brazil: Lagging areas have high poverty rates and many of the poor
The dimensions—long distances and misplaced densities; the instruments—institutions, and infrastructure to connect leading and lagging places
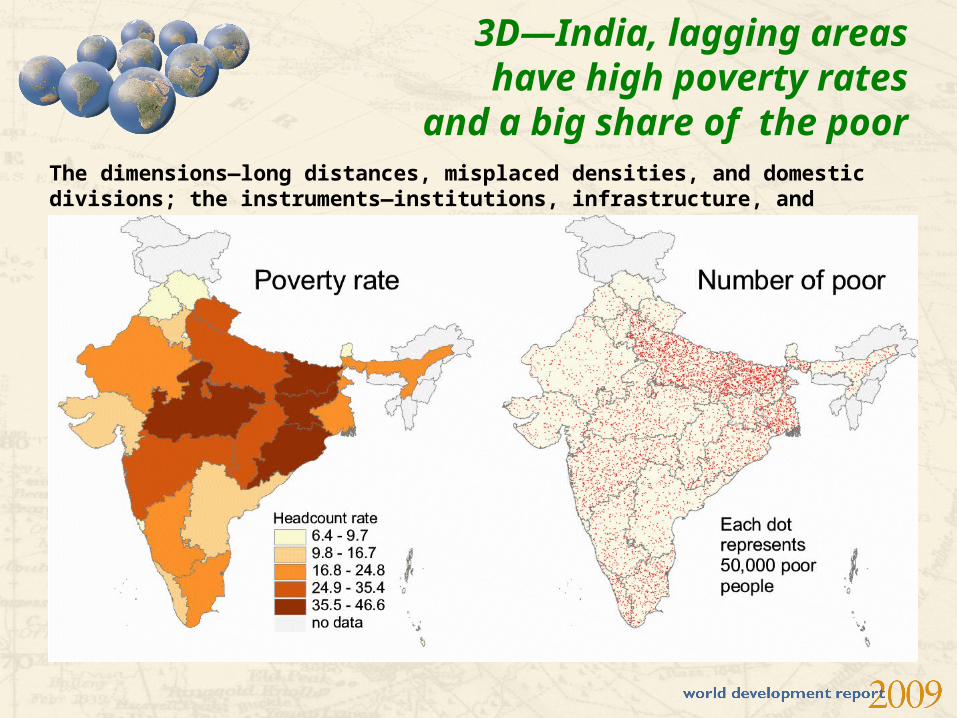
3D—India, lagging areas have high poverty rates and a big
share of the poorThe dimensions—long distances, misplaced densities, and domestic divisions; the instruments—institutions, infrastructure, and incentives that target
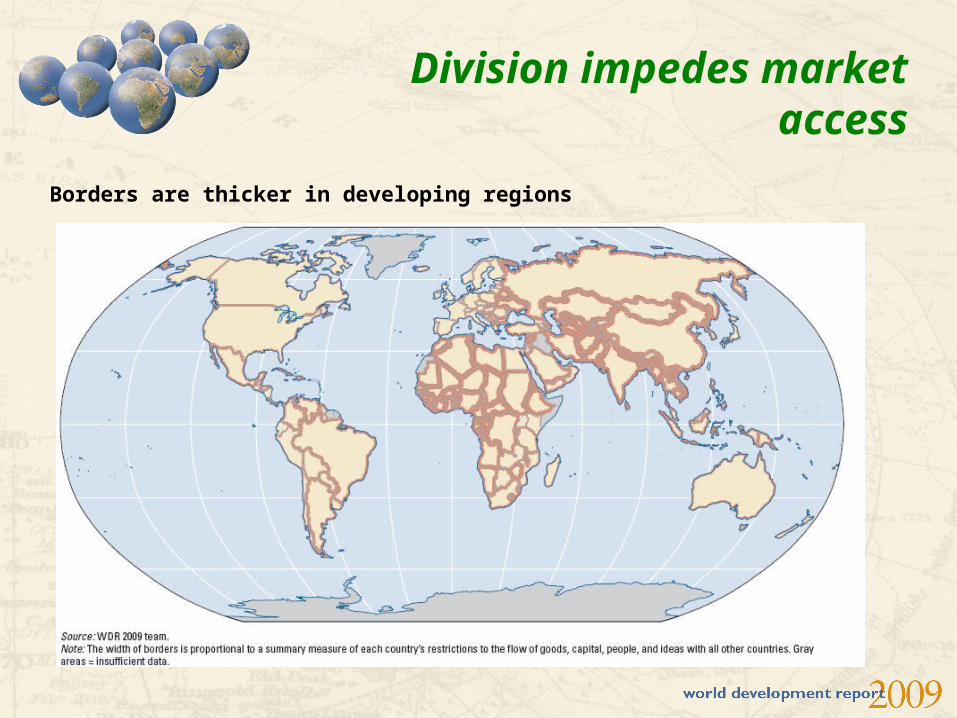
Division impedes market access
Borders are thicker in developing regions

Division impedes market access
Borders are thicker in the EU’s New Member States
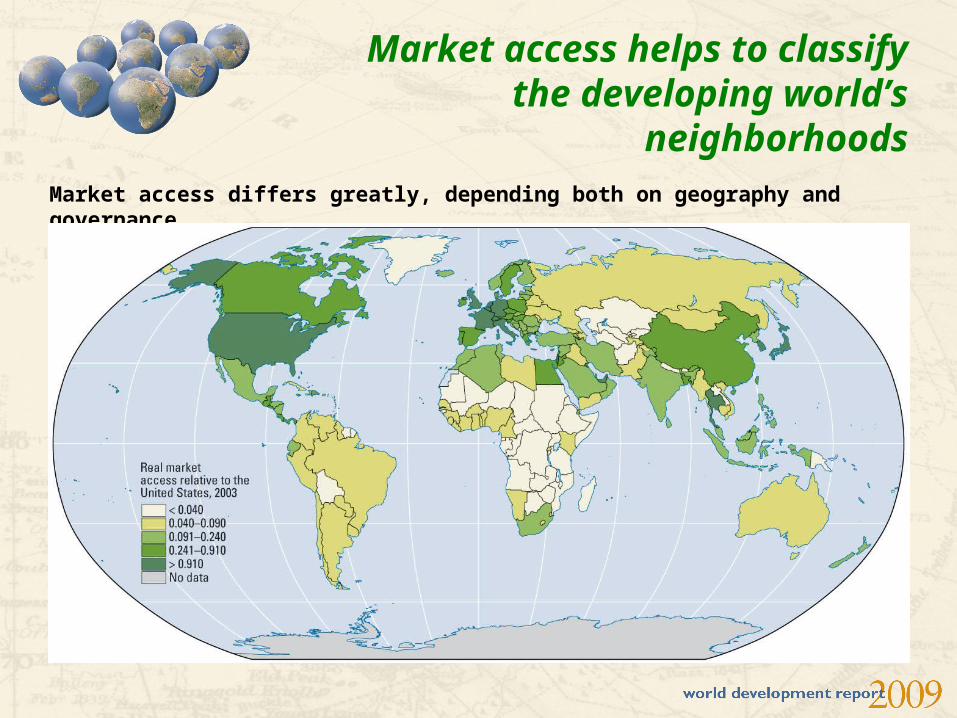
Market access helps to classify the developing world’s neighborhoods
Market access differs greatly, depending both on geography and governance
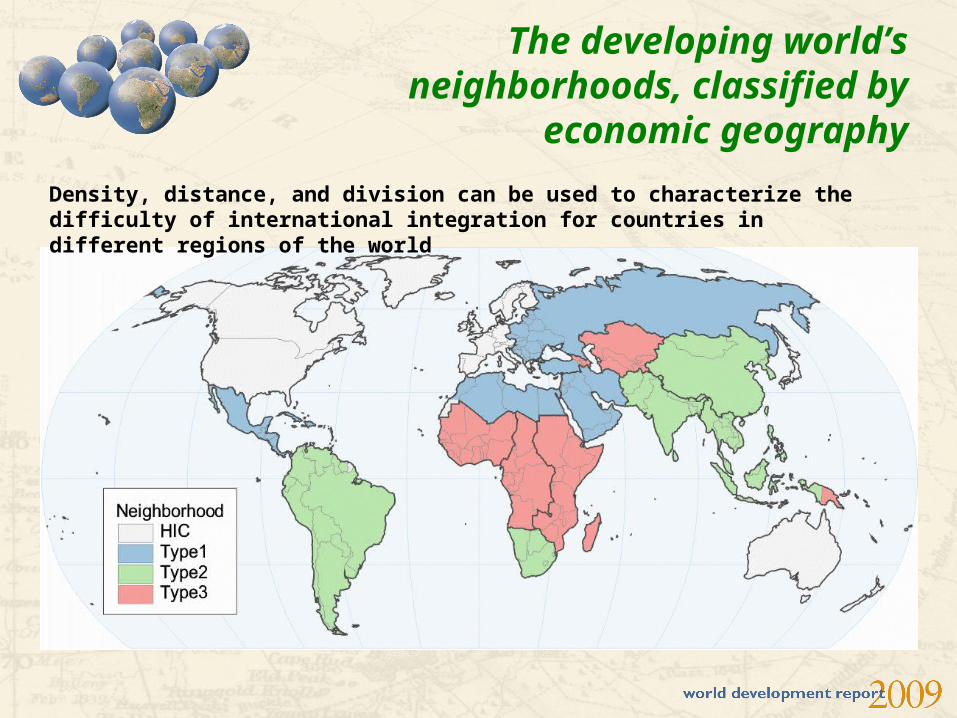
The developing world’s neighborhoods, classified by economic geography
Density, distance, and division can be used to characterize the difficulty of international integration for countries in different regions of the world
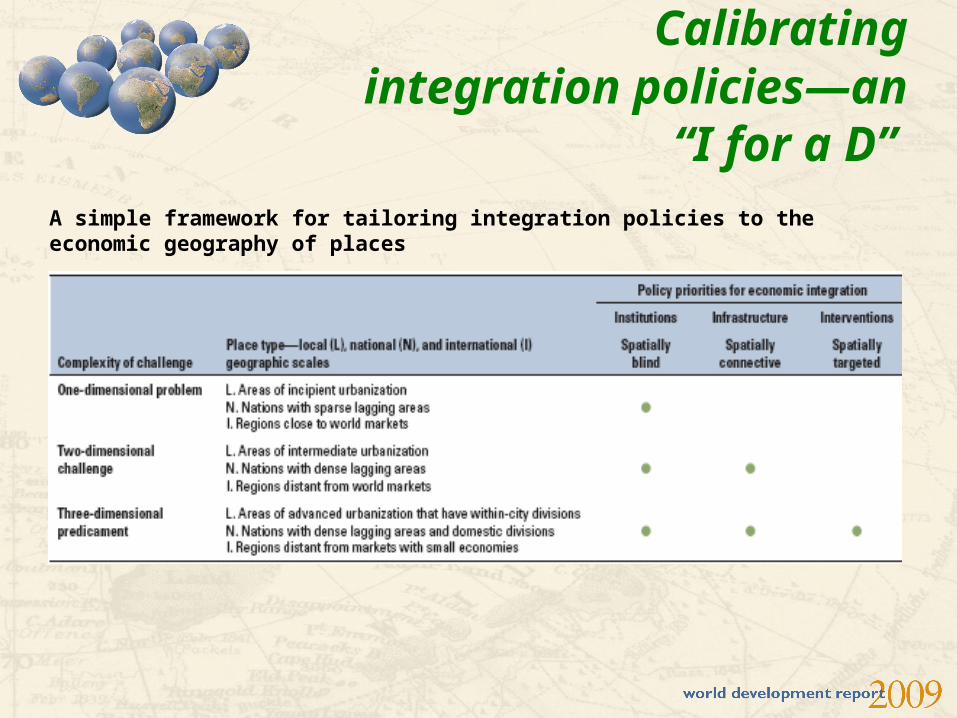
Calibrating integration policies—an “I for a D”
A simple framework for tailoring integration policies to the economic geography of places
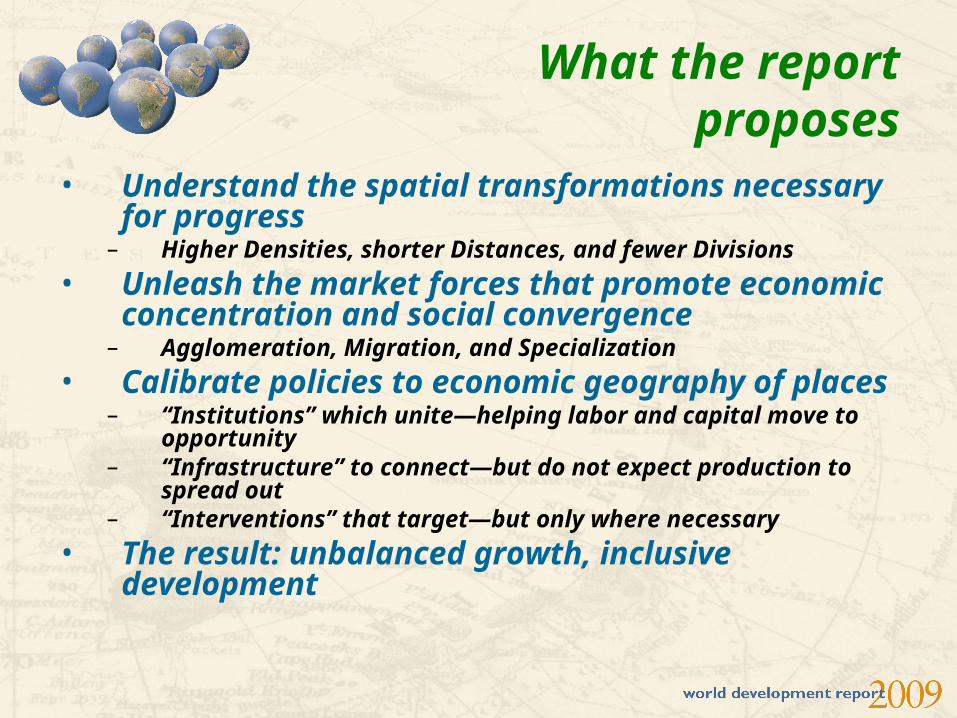
What the report proposes
• Understand the spatial transformations necessary for progress
– Higher Densities, shorter Distances, and fewer Divisions
• Unleash the market forces that promote economic concentration and social convergence
– Agglomeration, Migration, and Specialization
• Calibrate policies to economic geography of places
– “Institutions” which unite—helping labor and capital move to opportunity
– “Infrastructure” to connect—but do not expect production to spread out
– “Interventions” that target—but only where necessary
• The result: unbalanced growth, inclusive development
• www.worldbank.org/wdr2009
• [email protected] • [email protected]• [email protected]• [email protected]
For more information

![Japan’s Stewardship Code and Japan’s Corporate Governance Code · 2017-03-13 · Japan’s Stewardship Code and Japan’s Corporate Governance Code December 22, 2015 [Ikeo, Chairman]](https://img.pdfslide.net/doc/110x75/5f90a50a670cf42f0354242f/japanas-stewardship-code-and-japanas-corporate-governance-code-2017-03-13.jpg)