Embed Size (px)
Citation preview
8/10/2019 Residue Maps
http://slidepdf.com/reader/full/residue-maps 1/6
66 www.cepmagazine.org November 2002 CEP
Reactions and Separations
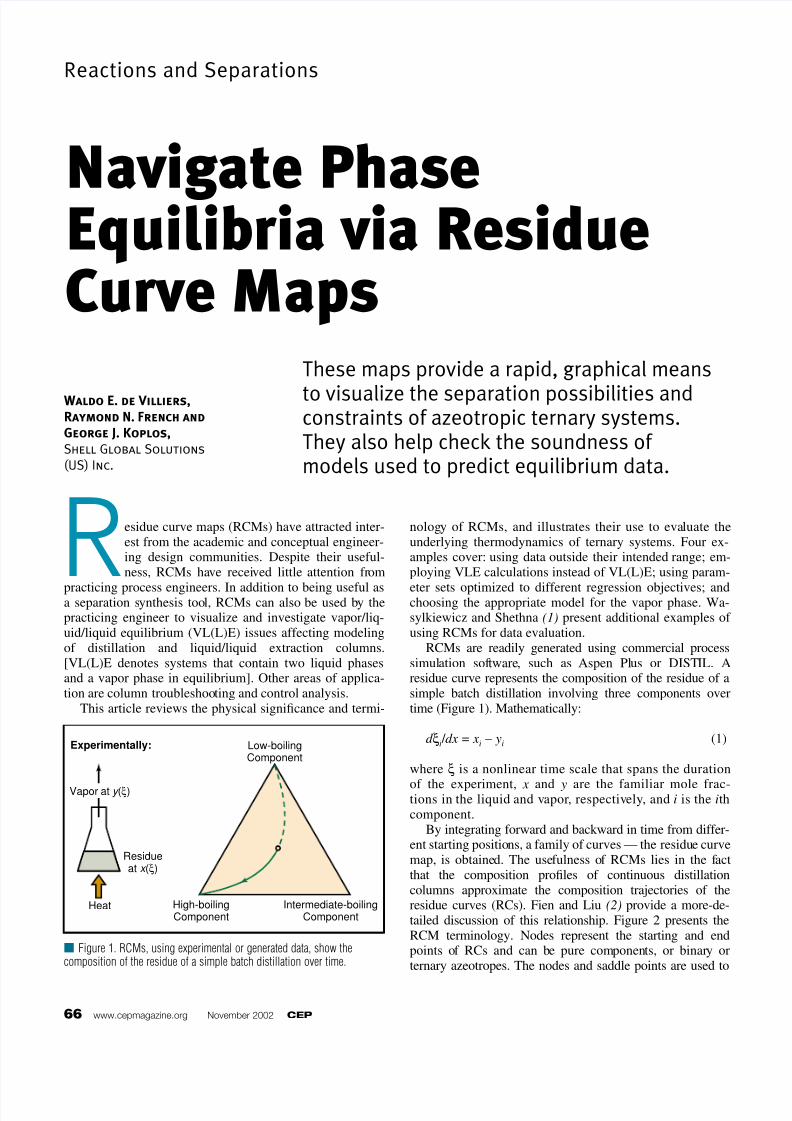
esidue curve maps (RCMs) have attracted inter-est from the academic and conceptual engineer-ing design communities. Despite their useful-ness, RCMs have received little attention from
practicing process engineers. In addition to being useful asa separation synthesis tool, RCMs can also be used by thepracticing engineer to visualize and investigate vapor/liq-uid/liquid equilibrium (VL(L)E) issues affecting modelingof distillation and liquid/liquid extraction columns.[VL(L)E denotes systems that contain two liquid phasesand a vapor phase in equilibrium]. Other areas of applica-tion are column troubleshooting and control analysis.
This article reviews the physical significance and termi-
nology of RCMs, and illustrates their use to evaluate theunderlying thermodynamics of ternary systems. Four ex-amples cover: using data outside their intended range; em-ploying VLE calculations instead of VL(L)E; using param-
eter sets optimized to different regression objectives; andchoosing the appropriate model for the vapor phase. Wa-sylkiewicz and Shethna (1) present additional examples of using RCMs for data evaluation.
RCMs are readily generated using commercial processsimulation software, such as Aspen Plus or DISTIL. Aresidue curve represents the composition of the residue of asimple batch distillation involving three components overtime (Figure 1). Mathematically:
d ξi / dx = xi – yi (1)
where ξ is a nonlinear time scale that spans the duration
of the experiment, x and y are the familiar mole frac-tions in the liquid and vapor, respectively, and i is the ithcomponent.
By integrating forward and backward in time from differ-ent starting positions, a family of curves — the residue curvemap, is obtained. The usefulness of RCMs lies in the factthat the composition profiles of continuous distillationcolumns approximate the composition trajectories of theresidue curves (RCs). Fien and Liu (2) provide a more-de-tailed discussion of this relationship. Figure 2 presents theRCM terminology. Nodes represent the starting and endpoints of RCs and can be pure components, or binary orternary azeotropes. The nodes and saddle points are used to
These maps provide a rapid, graphical means
to visualize the separation possibilities andconstraints of azeotropic ternary systems.They also help check the soundness ofmodels used to predict equilibrium data.
Navigate PhaseEquilibria via ResidueCurve Maps
R
Waldo E. de Villiers,
Raymond N. French and
George J. Koplos,
Shell Global Solutions
(US) Inc.
Vapor at y (ξ)
High-boilingComponent
FeedComposition
Intermediate-boilingComponent
Low-boilingComponent
Residueat x (ξ)
Heat
Experimentally:
Figure 1. RCMs, using experimental or generated data, show thecomposition of the residue of a simple batch distillation over time.
8/10/2019 Residue Maps
http://slidepdf.com/reader/full/residue-maps 2/6
CEP November 2002 www.cepmagazine.org 67
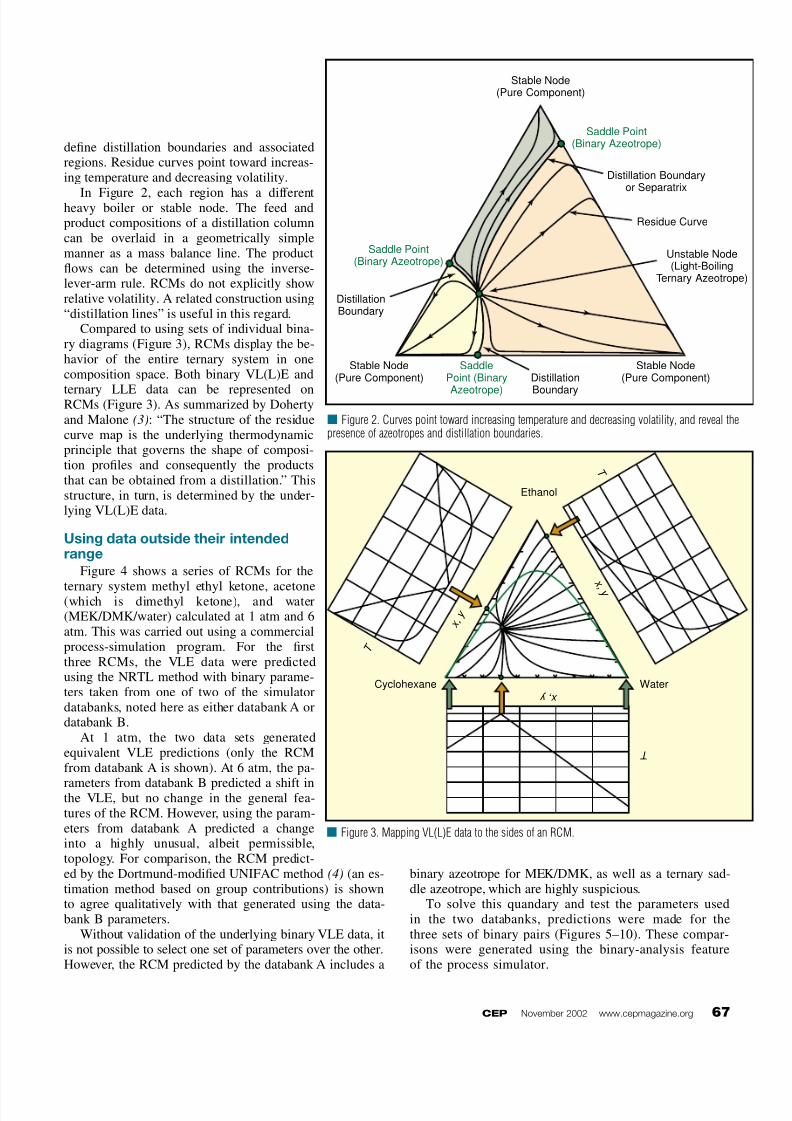
define distillation boundaries and associatedregions. Residue curves point toward increas-ing temperature and decreasing volatility.
In Figure 2, each region has a differentheavy boiler or stable node. The feed andproduct compositions of a distillation columncan be overlaid in a geometrically simplemanner as a mass balance line. The productflows can be determined using the inverse-lever-arm rule. RCMs do not explicitly showrelative volatility. A related construction using“distillation lines” is useful in this regard.
Compared to using sets of individual bina-ry diagrams (Figure 3), RCMs display the be-havior of the entire ternary system in onecomposition space. Both binary VL(L)E and
ternary LLE data can be represented onRCMs (Figure 3). As summarized by Dohertyand Malone (3): “The structure of the residuecurve map is the underlying thermodynamicprinciple that governs the shape of composi-tion profiles and consequently the productsthat can be obtained from a distillation.” Thisstructure, in turn, is determined by the under-lying VL(L)E data.
Using data outside their intendedrange
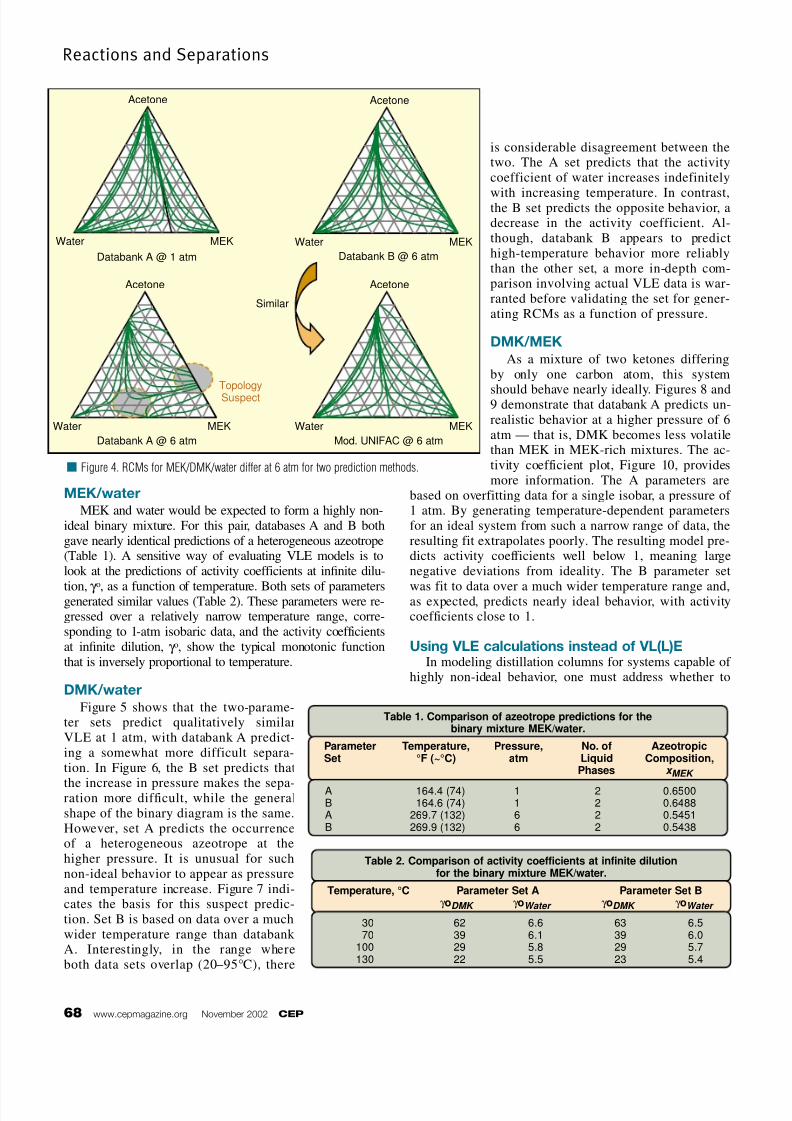
Figure 4 shows a series of RCMs for the
ternary system methyl ethyl ketone, acetone(which is dimethyl ketone), and water(MEK/DMK/water) calculated at 1 atm and 6atm. This was carried out using a commercialprocess-simulation program. For the firstthree RCMs, the VLE data were predictedusing the NRTL method with binary parame-ters taken from one of two of the simulatordatabanks, noted here as either databank A ordatabank B.
At 1 atm, the two data sets generatedequivalent VLE predictions (only the RCMfrom databank A is shown). At 6 atm, the pa-
rameters from databank B predicted a shift inthe VLE, but no change in the general fea-tures of the RCM. However, using the param-eters from databank A predicted a changeinto a highly unusual, albeit permissible,topology. For comparison, the RCM predict-ed by the Dortmund-modified UNIFAC method (4) (an es-timation method based on group contributions) is shownto agree qualitatively with that generated using the data-bank B parameters.
Without validation of the underlying binary VLE data, itis not possible to select one set of parameters over the other.However, the RCM predicted by the databank A includes a
binary azeotrope for MEK/DMK, as well as a ternary sad-dle azeotrope, which are highly suspicious.
To solve this quandary and test the parameters usedin the two databanks, predictions were made for thethree sets of binary pairs (Figures 5–10). These compar-isons were generated using the binary-analysis featureof the process simulator.
Stable Node(Pure Component)
Unstable Node(Light-Boiling
Ternary Azeotrope)
Stable Node(Pure Component)
Stable Node(Pure Component)
Saddle Point(Binary Azeotrope)
Saddle Point(Binary Azeotrope)
SaddlePoint (Binary
Azeotrope)
DistillationBoundary
Distillation Boundaryor Separatrix
Residue Curve
Distillation
Boundary
Figure 2. Curves point toward increasing temperature and decreasing volatility, and reveal thepresence of azeotropes and distillation boundaries.
Cyclohexane
Ethanol
Water x , y
T
x , y
T
x
, y
T
Figure 3. Mapping VL(L)E data to the sides of an RCM.
8/10/2019 Residue Maps
http://slidepdf.com/reader/full/residue-maps 3/6
MEK/water
MEK and water would be expected to form a highly non-ideal binary mixture. For this pair, databases A and B bothgave nearly identical predictions of a heterogeneous azeotrope(Table 1). A sensitive way of evaluating VLE models is tolook at the predictions of activity coefficients at infinite dilu-
tion, γ o
, as a function of temperature. Both sets of parametersgenerated similar values (Table 2). These parameters were re-gressed over a relatively narrow temperature range, corre-sponding to 1-atm isobaric data, and the activity coefficientsat infinite dilution, γ o, show the typical monotonic functionthat is inversely proportional to temperature.
DMK/water
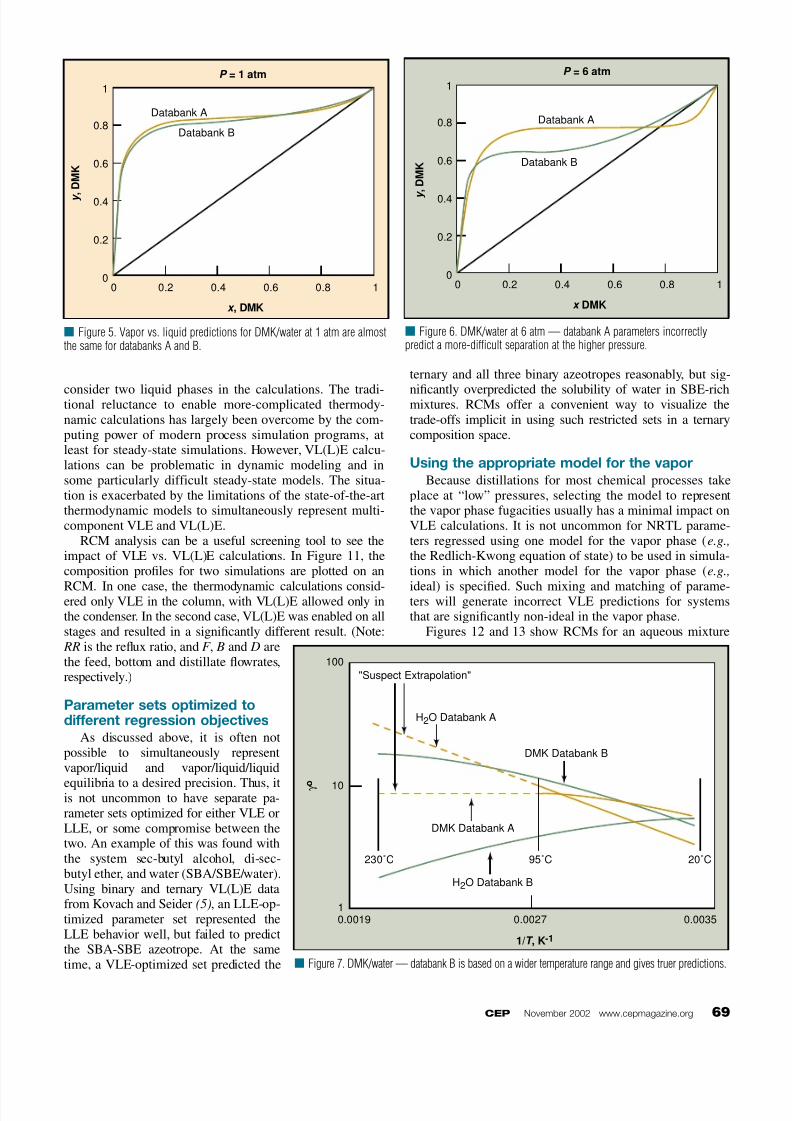
Figure 5 shows that the two-parame-ter sets predict qualitatively similarVLE at 1 atm, with databank A predict-ing a somewhat more difficult separa-tion. In Figure 6, the B set predicts that
the increase in pressure makes the sepa-ration more difficult, while the generalshape of the binary diagram is the same.However, set A predicts the occurrenceof a heterogeneous azeotrope at thehigher pressure. It is unusual for suchnon-ideal behavior to appear as pressureand temperature increase. Figure 7 indi-cates the basis for this suspect predic-tion. Set B is based on data over a muchwider temperature range than databank A. Interestingly, in the range whereboth data sets overlap (20–95°C), there
is considerable disagreement between thetwo. The A set predicts that the activitycoefficient of water increases indefinitely
with increasing temperature. In contrast,the B set predicts the opposite behavior, adecrease in the activity coefficient. Al-though, databank B appears to predicthigh-temperature behavior more reliablythan the other set, a more in-depth com-parison involving actual VLE data is war-ranted before validating the set for gener-ating RCMs as a function of pressure.
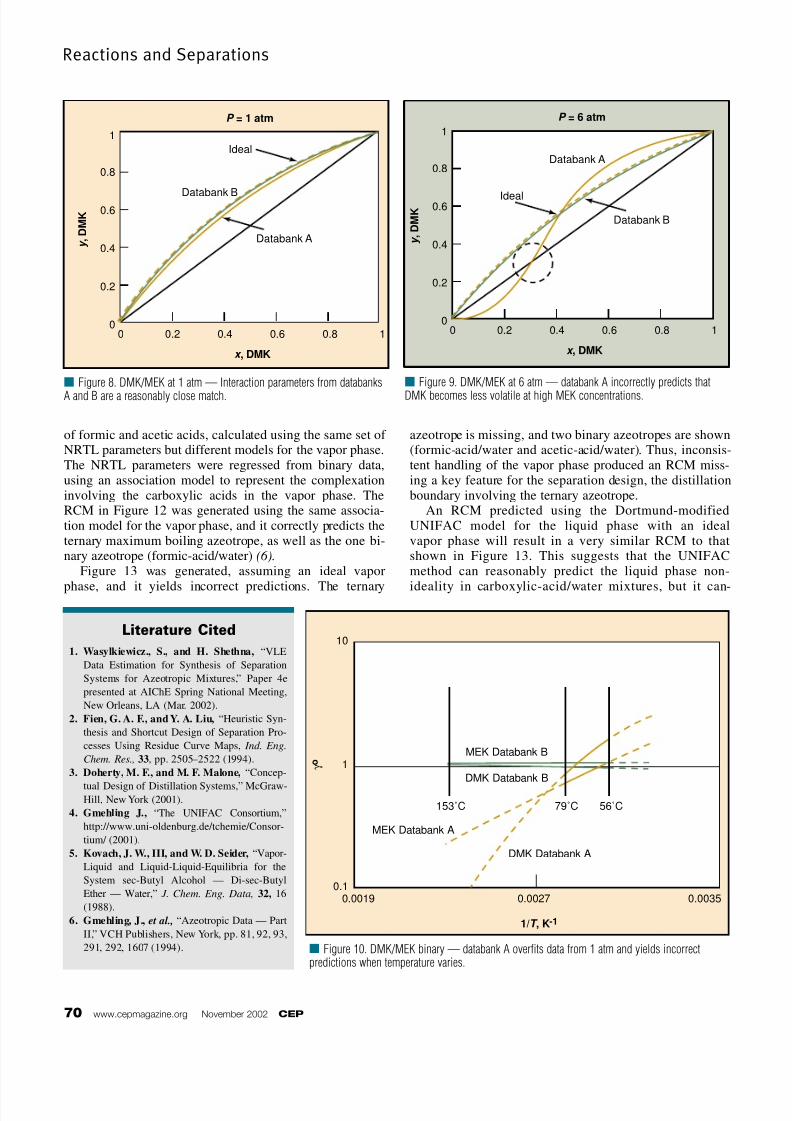
DMK/MEK
As a mixture of two ketones differingby only one carbon atom, this system
should behave nearly ideally. Figures 8 and9 demonstrate that databank A predicts un-realistic behavior at a higher pressure of 6atm — that is, DMK becomes less volatilethan MEK in MEK-rich mixtures. The ac-tivity coefficient plot, Figure 10, providesmore information. The A parameters are
based on overfitting data for a single isobar, a pressure of 1 atm. By generating temperature-dependent parametersfor an ideal system from such a narrow range of data, theresulting fit extrapolates poorly. The resulting model pre-dicts activity coefficients well below 1, meaning largenegative deviations from ideality. The B parameter set
was fit to data over a much wider temperature range and,as expected, predicts nearly ideal behavior, with activitycoefficients close to 1.
Using VLE calculations instead of VL(L)EIn modeling distillation columns for systems capable of
highly non-ideal behavior, one must address whether to
Reactions and Separations
68 www.cepmagazine.org November 2002 CEP
Table 2. Comparison of activity coefficients at infinite dilutionfor the binary mixture MEK/water.
Temperature, °C Parameter Set A Parameter Set Bγ oDMK γ oWater γ oDMK γ oWater
30 62 6.6 63 6.570 39 6.1 39 6.0
100 29 5.8 29 5.7130 22 5.5 23 5.4
MEK
TopologySuspect
Water
Acetone
Similar
Databank A @ 1 atm
Databank A @ 6 atm
MEKWater
Acetone
MEKWater
Acetone
Mod. UNIFAC @ 6 atm
MEKWater
Acetone
Databank B @ 6 atm
Figure 4. RCMs for MEK/DMK/water differ at 6 atm for two prediction methods.
Table 1. Comparison of azeotrope predictions for thebinary mixture MEK/water.
Parameter Temperature, Pressure, No. of AzeotropicSet °F (~°C) atm Liquid Composition,
Phases x MEK
A 164.4 (74) 1 2 0.6500B 164.6 (74) 1 2 0.6488A 269.7 (132) 6 2 0.5451B 269.9 (132) 6 2 0.5438
8/10/2019 Residue Maps
http://slidepdf.com/reader/full/residue-maps 4/6
consider two liquid phases in the calculations. The tradi-tional reluctance to enable more-complicated thermody-namic calculations has largely been overcome by the com-puting power of modern process simulation programs, atleast for steady-state simulations. However, VL(L)E calcu-lations can be problematic in dynamic modeling and insome particularly difficult steady-state models. The situa-tion is exacerbated by the limitations of the state-of-the-artthermodynamic models to simultaneously represent multi-component VLE and VL(L)E.
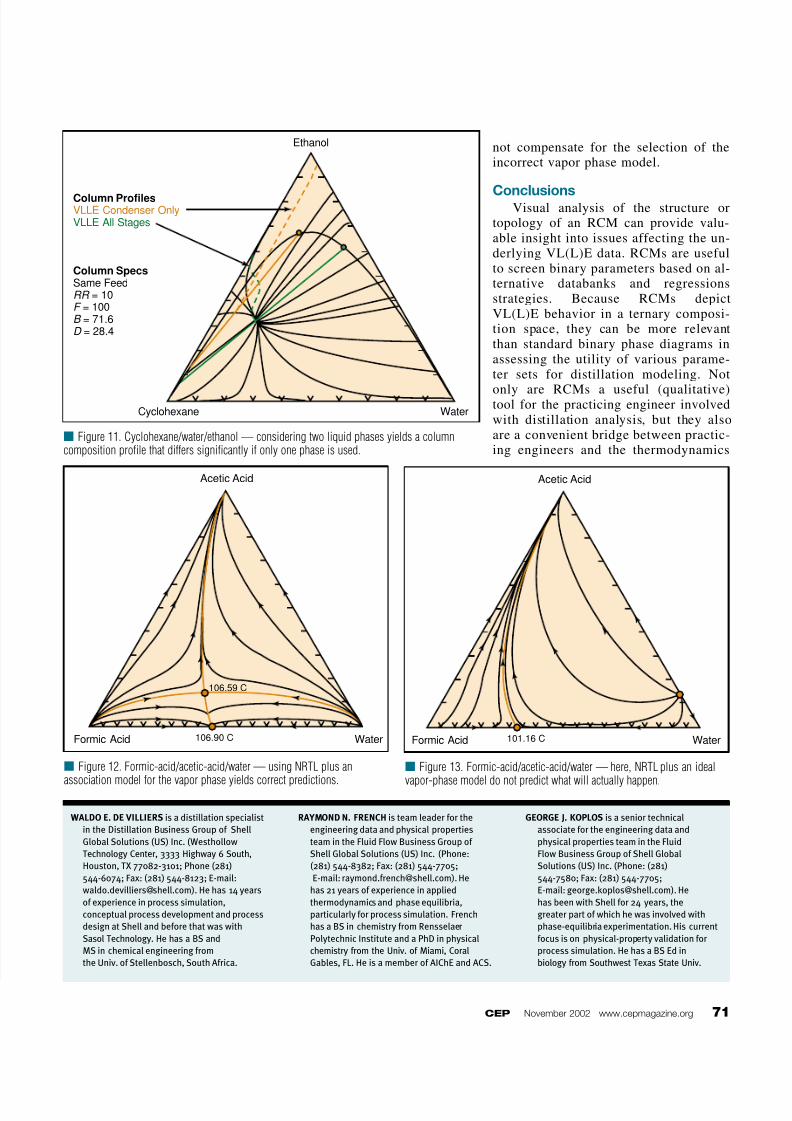
RCM analysis can be a useful screening tool to see theimpact of VLE vs. VL(L)E calculations. In Figure 11, thecomposition profiles for two simulations are plotted on an
RCM. In one case, the thermodynamic calculations consid-ered only VLE in the column, with VL(L)E allowed only inthe condenser. In the second case, VL(L)E was enabled on allstages and resulted in a significantly different result. (Note: RR is the reflux ratio, and F , B and D arethe feed, bottom and distillate flowrates,respectively.)
Parameter sets optimized todifferent regression objectives
As discussed above, it is often notpossible to simultaneously representvapor/liquid and vapor/liquid/liquid
equilibria to a desired precision. Thus, itis not uncommon to have separate pa-rameter sets optimized for either VLE orLLE, or some compromise between thetwo. An example of this was found withthe system sec-butyl alcohol, di-sec-butyl ether, and water (SBA/SBE/water).Using binary and ternary VL(L)E datafrom Kovach and Seider (5), an LLE-op-timized parameter set represented theLLE behavior well, but failed to predictthe SBA-SBE azeotrope. At the sametime, a VLE-optimized set predicted the
ternary and all three binary azeotropes reasonably, but sig-
nificantly overpredicted the solubility of water in SBE-richmixtures. RCMs offer a convenient way to visualize thetrade-offs implicit in using such restricted sets in a ternarycomposition space.
Using the appropriate model for the vapor
Because distillations for most chemical processes takeplace at “low” pressures, selecting the model to representthe vapor phase fugacities usually has a minimal impact onVLE calculations. It is not uncommon for NRTL parame-ters regressed using one model for the vapor phase (e.g.,the Redlich-Kwong equation of state) to be used in simula-tions in which another model for the vapor phase (e.g.,
ideal) is specified. Such mixing and matching of parame-ters will generate incorrect VLE predictions for systemsthat are significantly non-ideal in the vapor phase.
Figures 12 and 13 show RCMs for an aqueous mixture
CEP November 2002 www.cepmagazine.org 69
Databank A
1
0.8
0.6
0.4
0.2
00 0.2 0.4 0.6
x , DMK
P = 1 atm
y , D M K
0.8 1
Databank B
Figure 5. Vapor vs. liquid predictions for DMK/water at 1 atm are almostthe same for databanks A and B.
Databank A
1
0.8
0.6
0.4
0.2
00 0.2 0.4 0.6
x DMK
P = 6 atm
y
, D M K
0.8 1
Databank B
Figure 6. DMK/water at 6 atm — databank A parameters incorrectlypredict a more-difficult separation at the higher pressure.
H2O Databank A
H2O Databank B
"Suspect Extrapolation"
DMK Databank A
100
10
10.0019 0.0027
95˚C230˚C 20˚C
0.0035
1/T , K-1
γ o
DMK Databank B
Figure 7. DMK/water — databank B is based on a wider temperature range and gives truer predictions.
8/10/2019 Residue Maps
http://slidepdf.com/reader/full/residue-maps 5/6
of formic and acetic acids, calculated using the same set of NRTL parameters but different models for the vapor phase.The NRTL parameters were regressed from binary data,using an association model to represent the complexationinvolving the carboxylic acids in the vapor phase. TheRCM in Figure 12 was generated using the same associa-tion model for the vapor phase, and it correctly predicts theternary maximum boiling azeotrope, as well as the one bi-nary azeotrope (formic-acid/water) (6).
Figure 13 was generated, assuming an ideal vapor
phase, and it yields incorrect predictions. The ternary
azeotrope is missing, and two binary azeotropes are shown(formic-acid/water and acetic-acid/water). Thus, inconsis-tent handling of the vapor phase produced an RCM miss-ing a key feature for the separation design, the distillationboundary involving the ternary azeotrope.
An RCM predicted using the Dortmund-modifiedUNIFAC model for the liquid phase with an idealvapor phase will result in a very similar RCM to thatshown in Figure 13. This suggests that the UNIFACmethod can reasonably predict the liquid phase non-
ideality in carboxylic-acid/water mixtures, but it can-
Reactions and Separations
70 www.cepmagazine.org November 2002 CEP
Databank A
1
0.8
0.6
0.4
0.2
00 0.2 0.4 0.6
x , DMK
P = 1 atm
y , D M K
0.8 1
Databank B
Ideal
Figure 8. DMK/MEK at 1 atm — Interaction parameters from databanks
A and B are a reasonably close match.
Databank A
1
0.8
0.6
0.4
0.2
00 0.2 0.4 0.6
x , DMK
P = 6 atm
y , D M K
0.8 1
Databank B
Ideal
Figure 9. DMK/MEK at 6 atm — databank A incorrectly predicts that
DMK becomes less volatile at high MEK concentrations.
Figure 10. DMK/MEK binary — databank A overfits data from 1 atm and yields incorrectpredictions when temperature varies.
DMK Databank A
10
1
0.10.0019 0.0027
153˚C 79˚C 56˚C
0.0035
1/T , K-1
γ o
DMK Databank B
MEK Databank B
MEK Databank A
Literature Cited
1. Wasylkiewicz., S., and H. Shethna, “VLE
Data Estimation for Synthesis of Separation
Systems for Azeotropic Mixtures,” Paper 4e
presented at AIChE Spring National Meeting,
New Orleans, LA (Mar. 2002).
2. Fien, G. A. F., and Y. A. Liu, “Heuristic Syn-
thesis and Shortcut Design of Separation Pro-
cesses Using Residue Curve Maps, Ind. Eng.
Chem. Res., 33, pp. 2505–2522 (1994).
3. Doherty, M. F., and M. F. Malone, “Concep-
tual Design of Distillation Systems,” McGraw-Hill, New York (2001).
4. Gmehling J., “The UNIFAC Consortium,”
http://www.uni-oldenburg.de/tchemie/Consor-
tium/ (2001).
5. Kovach, J. W., III, and W. D. Seider, “Vapor-
Liquid and Liquid-Liquid-Equilibria for the
System sec-Butyl Alcohol — Di-sec-Butyl
Ether — Water,” J. Chem. Eng. Data, 32, 16
(1988).
6. Gmehling, J., et al., “Azeotropic Data — Part
II,” VCH Publishers, New York, pp. 81, 92, 93,
291, 292, 1607 (1994).
8/10/2019 Residue Maps
http://slidepdf.com/reader/full/residue-maps 6/6
not compensate for the selection of theincorrect vapor phase model.
ConclusionsVisual analysis of the structure ortopology of an RCM can provide valu-able insight into issues affecting the un-derlying VL(L)E data. RCMs are usefulto screen binary parameters based on al-ternative databanks and regressionsstrategies. Because RCMs depictVL(L)E behavior in a ternary composi-tion space, they can be more relevantthan standard binary phase diagrams inassessing the utility of various parame-ter sets for distillation modeling. Not
only are RCMs a useful (qualitative)tool for the practicing engineer involvedwith distillation analysis, but they alsoare a convenient bridge between practic-ing engineers and the thermodynamics
CEP November 2002 www.cepmagazine.org 71
Figure 12. Formic-acid/acetic-acid/water — using NRTL plus an
association model for the vapor phase yields correct predictions.
WaterFormic Acid
106.59 C
106.90 C
Acetic Acid
Figure 13. Formic-acid/acetic-acid/water — here, NRTL plus an ideal
vapor-phase model do not predict what will actually happen.
WaterFormic Acid 101.16 C
Acetic Acid
Figure 11. Cyclohexane/water/ethanol — considering two liquid phases yields a columncomposition profile that differs significantly if only one phase is used.
WaterCyclohexane
Column ProfilesVLLE Condenser OnlyVLLE All Stages
Column SpecsSame FeedRR = 10F = 100B = 71.6D = 28.4
Ethanol
WALDO E. DE VILLIERS is a distillation specialist
in the Distillation Business Group of Shell
Global Solutions (US) Inc. (Westhollow
Technology Center, 3333 Highway 6 South,
Houston, TX 77082-3101; Phone (281)
544-6074; Fax: (281) 544-8123; E-mail:
[email protected]). He has 14 years
of experience in process simulation,
conceptual process development and process
design at Shell and before that was with
Sasol Technology. He has a BS and
MS in chemical engineering from
the Univ. of Stellenbosch, South Africa.
RAYMOND N. FRENCH is team leader for the
engineering data and physical properties
team in the Fluid Flow Business Group of
Shell Global Solutions (US) Inc. (Phone:
(281) 544-8382; Fax: (281) 544-7705;
E-mail: [email protected]). He
has 21 years of experience in applied
thermodynamics and phase equilibria,
particularly for process simulation. French
has a BS in chemistry from Rensselaer
Polytechnic Institute and a PhD in physical
chemistry from the Univ. of Miami, Coral
Gables, FL. He is a member of AIChE and ACS.
GEORGE J. KOPLOS is a senior technical
associate for the engineering data and
physical properties team in the Fluid
Flow Business Group of Shell Global
Solutions (US) Inc. (Phone: (281)
544-7580; Fax: (281) 544-7705;
E-mail: [email protected]). He
has been with Shell for 24 years, the
greater part of which he was involved with
phase-equilibria experimentation. His current
focus is on physical-property validation for
process simulation. He has a BS Ed in
biology from Southwest Texas State Univ.