Embed Size (px)
Citation preview
ISSN 0111-1760 (Print) ISSN 1178-2293 (Online)
University of Otago Economics Discussion Papers
No. 1012
September 2010
Resource-based FDI and Expropriation in Developing Economies
Chris Hajzler
Address for correspondence:
Chris Hajzler Department of Economics University of Otago PO Box 56 Dunedin NEW ZEALAND E-mail: [email protected] Telephone: 64 3 479 7387 Fax: 64 3 479 8174
Abstract
Globally, foreign direct investment (FDI) assets are expropriated more in resource extraction industries compared to other sectors. Despite the higher apparent risk of expropriation in resources, countries more likely to expropriate also have a larger share of FDI in the resource sector. An incomplete markets model of FDI is developed to account for this puzzle. The type of government regime is stochastic, with low penalty regimes facing a relatively low, exogenous cost of expropriating FDI, and country risk is measured by the variation in these costs across different regimes. The key innovation of the model is that the government, before the regime type is known, is able to charge different prices to domestic and foreign investors for mineral rights. Granting cheap access increases FDI and reduces the country’s share of resource rents, increasing the temptation to expropriate in a relatively low penalty regime. In very high-risk countries, subsidizing resource FDI increases the total value of output by raising investment, and the net gains from expropriating in a low penalty regime outweigh the rents foregone under a high penalty one. However, a stochastic resource output price results in relatively low-risk countries restricting FDI inflows to the resource sector instead - "windfall profits" in this sector raise incentives to expropriate when prices are high, yet minimization of the ex ante risk of expropriation is preferred owing to the relatively high penalty for expropriating. These results imply a higher average share of resource-based FDI in countries most likely to expropriate, while resources account for a high share of expropriated assets compared to the sector’s global share of FDI. We show that the model is able to reconcile observed patterns of foreign investment and expropriation for a sample of 38 developing and emerging economies.
Keywords: Expropriation, Foreign Direct Investment, Natural Resources
1. IntroductionPolitical risk is frequently cited as an important determinant of foreign direct invest-ment (FDI) in developing countries.1 A relatively extreme but not uncommon form ofpolitical risk is expropriation, where a host-country government seizes company assetswithout fair compensation. This risk is particularly acute in resource-based sectors.Compared to the relative importance of these sectors in aggregate investment and out-put, foreign investment is expropriated more in mining and petroleum than in otherindustries. Hajzler (2012) examines the sectoral distributions of expropriation overthe 1990-2006 period according to both number of firms and estimated value of as-sets seized, which are reproduced in Table 1. The proportion of assets expropriated inthe primaries sector is high (almost 60%) compared to the average developing coun-try production shares (about 22%), with the bulk of these acts occuring in mining andpetroleum. Truitt (1970), Kobrin (1984), and Jones Jr (1993) examine evidence forthis sectoral pattern over the 1960s and 1970s, employing various measures of expro-priation.2 This observation has motivated several authors to examine industry-specificfactors that increase the likelihood of expropriation in resources. The factors proposedinclude the prevalence of sunk costs in resources and mineral price volatility (Nel-lor, 1987; Monaldi, 2001; Engel and Fischer, 2010), varying uncertainty over projectreturns at different phases (Kobrin, 1980), and issues related to national economic se-curity and strategic political objectives (Kobrin, 1980; Shafer, 2009).
Much less attention has been given to the apparent willingness of foreign investorsto continue investing in resource extraction in several high-risk countries. In Bolivia,Ecuador, Russia, and Venezuela, for instance, large amounts of FDI are currently beingexpropriated in mining and petroleum, the same industries which had been national-ized in these countries several times during the past half-century. Repeating cycles offoreign investment and expropriation, particularly in extractive industries, have beenwell documented.3 There is also counter-intuitive evidence to suggest that developingcountries that are more likely to expropriate do better in attracting resource-based FDI
1This includes risk associated with corruption, war, and expropriation. According to a recent surveyconducted by the IMF Capital Markets Consultative Group (2003), most managers of companies engaged inFDI rank access to the legal system and the enforceability of contracts first in assessing the political risksassociated with investing. (See Albuquerque, 2003; Alfaro, Kalemli-Ozcan, and Volosovych, 2008; Geiger,1989; Jensen, 2006; Wei, 2000, for empirical evidence for the adverse impact of political risk on FDI.)
2Kobrin’s (1984) expropriation data, which is also extended by Hajzler (2012) for the 1993-2006 period,is a frequency-based measure he refers to as an expropriation “act.” Although a similar sector pattern ofexpropriation emerges using each of these measures of expropriation intensity, we focus on the distributionover the value of assets seized because this measure maps more naturally into our model’s predictions.
3Hajzler (2012) notes that many of the countries expropriating during the 1990-2006 period have also na-tionalized the Mining and Petroleum sector at multiple points over the past century – Argentina (1963, 1974),Bolivia (1937, 1952, 1969, 2006), the Democratic Republic of Congo (1976, 1993), Ecuador (1969-1979,2006), Indonesia (1960, 1965), Russia (1918, 2006) and Venezuela (1975, 2005)– as well as in the utilitiessector – Indonesia (1966, 1976, 1998) and Venezuela (1963, 1969). Other historical examples of “serialexpropriators” are discussed in Gadano (2010) and Hogan, Sturzenegger, and Tai (2010). The latter note thathost-countries, having felt the negative consequences of expropriation, will often offer very favorable dealsto investors to entice them back: “Then the cycle may start again, with similar costs to both parties as before”(p.3).
2
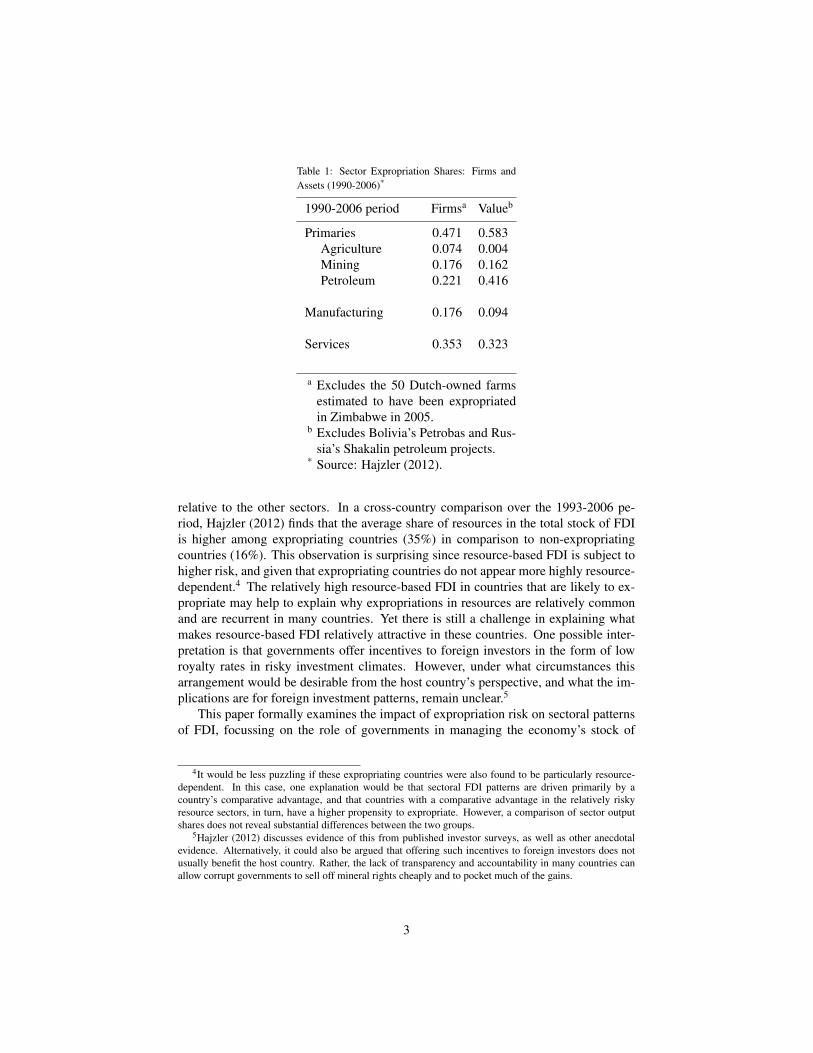
Table 1: Sector Expropriation Shares: Firms andAssets (1990-2006)*
1990-2006 period Firmsa Valueb
Primaries 0.471 0.583Agriculture 0.074 0.004Mining 0.176 0.162Petroleum 0.221 0.416
Manufacturing 0.176 0.094
Services 0.353 0.323
a Excludes the 50 Dutch-owned farmsestimated to have been expropriatedin Zimbabwe in 2005.
b Excludes Bolivia’s Petrobas and Rus-sia’s Shakalin petroleum projects.
* Source: Hajzler (2012).
relative to the other sectors. In a cross-country comparison over the 1993-2006 pe-riod, Hajzler (2012) finds that the average share of resources in the total stock of FDIis higher among expropriating countries (35%) in comparison to non-expropriatingcountries (16%). This observation is surprising since resource-based FDI is subject tohigher risk, and given that expropriating countries do not appear more highly resource-dependent.4 The relatively high resource-based FDI in countries that are likely to ex-propriate may help to explain why expropriations in resources are relatively commonand are recurrent in many countries. Yet there is still a challenge in explaining whatmakes resource-based FDI relatively attractive in these countries. One possible inter-pretation is that governments offer incentives to foreign investors in the form of lowroyalty rates in risky investment climates. However, under what circumstances thisarrangement would be desirable from the host country’s perspective, and what the im-plications are for foreign investment patterns, remain unclear.5
This paper formally examines the impact of expropriation risk on sectoral patternsof FDI, focussing on the role of governments in managing the economy’s stock of
4It would be less puzzling if these expropriating countries were also found to be particularly resource-dependent. In this case, one explanation would be that sectoral FDI patterns are driven primarily by acountry’s comparative advantage, and that countries with a comparative advantage in the relatively riskyresource sectors, in turn, have a higher propensity to expropriate. However, a comparison of sector outputshares does not reveal substantial differences between the two groups.
5Hajzler (2012) discusses evidence of this from published investor surveys, as well as other anecdotalevidence. Alternatively, it could also be argued that offering such incentives to foreign investors does notusually benefit the host country. Rather, the lack of transparency and accountability in many countries canallow corrupt governments to sell off mineral rights cheaply and to pocket much of the gains.
3
mineral wealth. Host country governments typically decide how mineral rights areallocated and under what terms, and they can exercise a special influence over FDI inthis sector that is not paralleled in other sectors.6 The question we ask is this: underwhat circumstances would governments want to partially offset the negative impact ofpolitical risk on FDI by offering mineral-rights more cheaply to foreign investors? Theidea that governments are able to offset expropriation risk by providing “sweet deals”to foreign investors in the resource sector is not a new one (see, for example, Monaldi,2001). In countries where a relatively low capital stock is a primary motivation forattracting FDI, cheap mineral rights may be an attractive substitute for direct subsidies.(Subsidies necessarily draw on already scarce domestic capital, which may be difficultfinancially and politically for many developing country governments.) We ask whetheror not a host country benefits from offering more favorable terms to foreign investorsin resources when country risk is high, and whether this can provide insight into therelatively large resource-based FDI in expropriating countries.
The two-sector environment that we consider builds on the single-sector, incom-plete markets models of Eaton and Gersovitz (1984) and Cole and English (1991).These papers consider a capital poor country that benefits from capital inflows, orFDI, but where aggregate investment remains inefficiently low due to expropriationrisk. There are no enforceable international regulations to protect investors, and a hostcountry government that maximizes domestic welfare (or perhaps even its own cof-fers) is tempted to take these investments when their value is high. The paymentsthe government collects from investors can not be conditioned on the the current andfuture profitability of the investment or on the costs of expropriating.7 As a result, self-enforcing contracts are impossible and foreign investors will always invest less thanthe efficient amount. The novel approach taken in this paper is to examine the role ofthe host country mineral contract in determining the patterns of foreign investment andexpropriation at the sector level. The government’s optimal allocation and pricing ofmineral rights, as well as required investments in the resource sector, are evaluated atdifferent levels of political risk. Of particular interest are the implications for FDI atthe sector level.
We focus on two sources of uncertainty: stochastic resource output prices and arandom external penalty to host country income if it expropriates. Changes in the ex-propriation penalty can represent variation in the external sanctions foreign investors(or their governments) can impose on the host-country, or may capture shifts in do-mestic political attitudes towards foreign investment. Political risk is then measured asthe spread between the size of the expropriation penalty in the highest penalty regime
6Historically, utilities and banking have also been relatively vulnerable to expropriation. The utilitiesand banking sectors appear to share this feature of extractive industries insofar as governments can regulatemarket entry and offer companies monopoly profits, and the theoretical framework considered in this papercould potentially offer insight into expropriation in these sectors.
7This assumption also implies that expropriation can occur in equilibrium, which is consistent with ob-servation. For an analysis of the effects of expropriation risk on patterns of FDI when contracts are complete,see Thomas and Worrall (1994). Here, the equilibrium contract delivers a positive share of the returns to thehost-country only as necessary to deter expropriation – this allows the investor to recover its sunk investmentcosts sooner so that investment can be raised towards the efficient level, and expropriation never occurs.
4
– representing a government with a high disincentive to expropriate – and the size ofthe penalty of the lowest penalty regime. A relatively low-risk country is one in whichthe expropriation penalty is similarly high for all regimes, whereas a relatively high-risk country is characterized by large swings in the incentive to expropriate across thedifferent regimes.
We find that very high-risk countries benefit from offering mineral rights cheaplyto foreign investors in order to raise FDI in resources, while relatively low-risk coun-tries do better by restricting FDI to this sector. This reflects the host country govern-ment’s desire to balance the goal of larger capital inflows, which it will occasionallybe tempted to expropriate, with a credible commitment to not (or rarely) expropriate,which is costly. Only in a low penalty regime is the government tempted to expro-priate, and this temptation increases with the mineral output price. When the lowestpenalty is moderately large (i.e. the country is low risk), for given levels of aggregateFDI, the risk of expropriation is amplified as FDI is tilted towards resources. The rea-son is that, in addition to the ordinary returns to capital received by foreign investorsin both sectors, investors in resources stand to earn positive ex post rents when facedwith above average output prices.8 In order to reduce the temptation to expropriate inhigh price, low penalty states, mineral rights are allocated predominantly to domesticinvestors, shifting FDI to the non-resource sector. As country risk rises, however, thegovernment is willing to expropriate at successively lower mineral output prices, andat some point ex post rents are fully appropriated by the host country in the low penaltyregime. Increasing FDI in resources raises the probability of expropriation by less thanan equal increase in non-resource FDI, and the government prefers to allocate mineralrights to foreign investors. Finally, in a very high-risk country, minimizing expropria-tion risk requires FDI to be far below the efficient level and the gains from increasinginvestment are large relative to the direct cost of expropriating. It is therefore optimal toincrease investment in the resource sector (increasing the likelihood of expropriating ina low penalty regime) by lowering the price of mineral rights sufficiently to compensateforeign investors for the additional risk. Taken together, these results imply a positiveaverage relationship between expropriation risk and the share of FDI in resources.
We calibrate the model and simulate sector FDI shares and expropriation proba-bilities for a sample of 38 developing and emerging economies. Predicted investmentpatterns and expropriation risk are broadly consistent with the data. Countries predictedto fall in the lowest risk category have expropriated much less, on average, comparedto countries classified as moderate or high risk, and they are also predicted to havemuch lower shares of FDI located in the resource sector compared to relatively highrisk countries. These results imply that the volume of foreign assets seized will be bi-ased towards resources relative to the sector’s average importance in GDP. Moreover,for each country in the sample, we compare both the predicted and the empirical FDIshares to the benchmark of a standard, competitive two sector model. Compared tothis benchmark, our model predicts an adjustment in FDI shares in a direction of the
8In a low-risk country, expropriation occurs only in the highest price states since the cost of expropriatingis high for even the low penalty regime. This implies a range of above average prices for which the investorwalks away with positive ex post rents.
5
empirical shares for more than 75% of the countries in the sample. Finally, the timingof expropriation in natural resource sectors often coincides with above average com-modity prices both in the model and in the data. As we might expect, host-countrygovernments are more likely to expropriate when the value of assets is high, whetherthey seek to maximize host-country welfare or to line their own pockets. (This is a keyfeature of the models of expropriation developed by Eaton and Gersovitz (1984), Coleand English (1991) - for certain host-country welfare functions - and Thomas and Wor-rall (1994).) The empirical tendency for governments to expropriate or raise tax androyalty rates when the mineral price is above trend is documented in Duncan (2005)and Hajzler (2012).
This paper complements a number of recent theoretical investigations of expropri-ation of foreign investment in natural resource sectors. Hogan et al. (2010), Engel andFischer (2010), and Guriev, Kolotilin, and Sonin (2009) each examine resource sectorcontracts in the presence of expropriation risk. They note that, historically, investors’returns in this sector tend to be lower than what is stipulated in their contracts whenprices are high (due to expropriation), yet they are offered very favorable concessionswhen prices are low (which are not likely to be honored in the long run). Engel andFischer (2010) show that deviations from a fixed payment schedule such as this can bean optimal response to expropriation risk in industries with large sunk investments. Intheir model, however, the probability of expropriation is an exogenous, positive func-tion of project return and all investment is sunk investment. These assumptions allowthe authors to focus on the effects of risk on the optimal allocation of returns in the re-source contract. The analysis of this paper instead focuses on the relationship betweencountry risk and sectoral patterns of expropriation and FDI. In Guriev et al. (2009), sim-ple resource sector contracts are considered and expropriation is also endogenous, butthey focus exclusively on the effects of output prices and institutional quality (whichthey represent by a high, constant cost of expropriating) on foreign investment andexpropriation within a single sector.
Chang, Hevia, and Loayza (2010) show how endogenous cycles of FDI and ex-propriation in natural resources can arise within a dynamic, incomplete contracts en-vironment. Their focus is on the links between private ownership, inequality and thegovernment’s desire to redistribute wealth, and they examine a single sector in isola-tion. Their theoretical analysis relates to several of stylized facts we consider in thispaper and complement our main findings.
The rest of the paper is organized as follows. Section 2 and presents the basic modelenvironment and defines the equilibrium strategies of investors and the host countrygovernment. In section 3, a simplified version of the model with no resource outputprice uncertainty and a simple resource contract is used to emphasize main intuitionfor why very high-risk countries offer mineral rights cheaply to foreign investors tomaximize FDI in this sector. Section 4 considers equilibrium with a stochastic resourceoutput price, and demonstrates the additional implications of price volatility on theoptimal choice of resource contract at different levels of country risk. The model’s keyresults are generalized for a broader range of resource contracts, including ad valoremroyalty-based payments, in Section 5. Finally, Section 6 presents the empirical resultsfor the calibrated model, and Section 7 concludes.
6
2. The ModelHaving reviewed the empirical facts and related literature, we present a static, two-sector model of foreign investment and expropriation that is broadly consistent withthese facts.
2.1. Basic EnvironmentThe basic environment consists of a large number of foreign investors that competefor a limited number of projects in each of two sectors of the host country. The host-country is capital poor and is unable to finance all of these projects itself. Domesticand foreign capital are perfect substitutes in production, and the relatively high returnsto capital in the host country provide a motivation for foreign investors to invest. Forsimplicity, it is assumed that there is no foreign borrowing, so all capital inflows takethe form of FDI.9
Production in each sector employs foreign and/or domestic capital and a sector-specific domestic input. In the resource sector, this input is a mineral right. In thenon-resource sector, domestic labor is employed. Output in each sector is producedusing twice-differentiable, linear-homogenous production functions:
Xj = F (KXj , Lj)
Rj = G(KRj ,Mj)
where Rj is the quantity of resource-sector output produced by firms of type j andXj is the quantity of non-resource output by firms of type j: either foreign (j = f )or domestic (j = h). Mj is the quantity of the mineral rights leased by firms of typej. Similarly, Lj denotes labor employed by each firm type, and Kij is investment insector i. Aggregate stocks of labor L and mineral rights M , as well as the total stockof domestic capital K, are fixed, and the stock of labor is normalized to 1. We alsoassume F (0, ·) = G(0, ·) = 0, and
limKX→0
FK(KX , ·) = limKR→0
GK(KR, ·) =∞
where FK(·) = ∂F/∂K and GK(·) = ∂G/∂K.In the non-resource sector (henceforth “manufacturing”), both foreign and domes-
tic firms compete for access to domestic labor and face a common labor price w. In
9Albuquerque (2003) considers both FDI and foreign borrowing in an imperfect contract enforcementenvironment, where the value of borrowed capital is fully appropriable whenever default occurs but only afraction of the value of FDI can be appropriated. (This captures the notion that FDI is often accompaniedby firm-specific managerial or organizational expertise that is costly or impossible for the host country toacquire.) In his analysis, FDI and borrowed or equity capital occur in distinct sectors and are thereforeimperfect substitutes. In the context of industries where FDI and equity capital are substitutes, however,the idea that it is relatively costly for the host country to appropriate FDI implies that this form of foreigninvestment is superior in the presence of expropriation risk, providing a rationale for focusing on FDI andabstracting from other types of capital inflows. I am grateful to one of the referees for pointing out thisconnection.
7
the resource sector, by contrast, the mineral rights are allocated by the government inthe form of resource contracts. The choice of resource contract is the main policy toolavailable to the government, and the contract stipulates transfers to the governmentas well as the investment obligations of the firm. One way to interpret the standardresource contract is as follows. For each concession and corresponding investmentamount, domestic and foreign investors compete by offering payments τh and τf re-sulting in a schedules [KRj , τj ] for j = h, f . The government chooses the preferredcontracts among foreign and domestic bidders and allocates mineral rights accordingly.The mineral price is assumed to be independent of the state of nature, a characteristicof the most commonly observed types of mineral contracts in developing countries.
Under this resource contract the host-country government exercises a significantinfluence over investment levels in this sector that it does not have in the other sector.This assumption is motivated by the observation that, in practice, the government exer-cises significant control over the supply and price of an essential input in production inresource extraction as well as contract terms, but typically does not in other sectors.10
Specific terms of mining contracts will typically jointly determine the quantity andform of payment for the mineral concession and the quantity of investment per conces-sion. In the extreme, the entire set of investment obligations of each contracting partywill be explicitly negotiated. More often, however, only part of the investment will bespecified, as in the case of minimum investment requirements or when the developmentof specific infrastructure such as roads or ports is included in the contract, leaving theremaining capital investments up to the investor. A range of other contractual elementsalso influence investment intensity, such as cost-recovery limits, the pooling of pro-duction and exploration expenses for tax purposes, and environmental regulations (forinstance, clean-up and restoration of the site at the end of production).11
Investment is risky – there is a positive probability that foreign capital and derivedoutput are seized by the host country government. That is, once the successful biddersfor the resource contract as well as investors in the non-resource sector have investedand output is produced, the government may decide it is worthwhile to expropriateforeign investor assets. However, the relative costs and benefits to the host countryfrom expropriating are unknown to both investors and the government at the time thatinvestments are made. Specifically, agents face an uncertain relative mineral outputprice p ∈ P as well as a random penalty a ∈ A incurred by the host country if the
10Important exceptions may arise in industries where the government can guarantee market power, suchas telecommunications and public works. Here the essential input is market access itself, and it is reasonableto think that governments should exercise a commensurate degree of influence in these industries as well.Specified investment amounts are also common in the utilities sector and for build-to-operate contracts inother industries.
11Raising cost-recovery limits, which cap the amount of investment expenditures that can be deductedfrom taxable income, makes investment more attractive. This mechanism is especially effective when de-cided in conjunction with the size and configuration of the exploration territory that forms the basis for thetax and exemptions. If the areas are large and contain “frontier” regions that require considerable explorationexpense, relaxing cost-recovery limits can raise the amount of exploration (and future development of wellsor mines) that takes place when exploration costs can be deducted from the income generated on the moreprofitable tracts. A thorough comparison of different types of contracts in the petroleum production sector isprovided by Johnston (2007).
8
government decides to expropriate. We also assume that foreign firm payments whichis paid after revenues are received and only in the event their assets are not expropri-ated. A particular state a, p is denoted s ∈ S = A× P . The timing of the model issummarized as follows:
Government announces resource contracts↓
KR,f , KX,f , KR,h, and KX,h are investedand output is produced
↓s ∈ S is realized
↓Government decides whether or not to
expropriate↓
Investors pay τfMf , τhMh, wLf and wLhif not expropriated
2.2. Host Country ObjectiveThe host-country government is altruistic and chooses chooses a resource contracts thatmaximize what we refer to as host-country income. The objective function is a linearaggregator that takes into account the expected penalty incurred from expropriation.
If the government does not expropriate, the host country receives the value of do-mestic firm production plus the revenues from leasing the sector specific inputs to for-eign firms, τfMf and wLf . If, on the other hand, the government expropriates, thehost country claims the entire value of output of both sectors. The country also incurspenalty a and forgoes domestic factor payments from investors whose assets have beenseized.12
For ease of exposition, it is useful to define the vector of joint decisions taken priorto the expropriation decision as
θ = (Mf ,Mh,KRf ,KRh,KXf ,KXh, τf , τh, Lf , Lh)
and to define D ⊂ S = A × P as the set (possibly empty) of states in which thegovernment expropriates, which depends on θ. We refer to D as the “default set”.
Given any realization of a particular state, if the government does not expropriate,expected national income is
Y N (p, θ) = F (KXh, Lh) + pG(KRh,Mh) + w(θ)Lf + τfMf
wherew(θ) represents the equilibrium price of labor given θ. If instead the government
12In the manufacturing sector, we assume that the government pays all workers from the revenues of itsnewly acquired state enterprise.
9
chooses to expropriate, income is
Y E(p, θ)− a =∑j=h,f
(F (KXj , Lj) + pG(KRj ,Mj)
)− a
Ex ante host-country income is
V (θ) =
∫s∈D(θ)
(Y E(p, θ)− a
)h(s)ds+
∫s/∈D(θ)
Y N (p, θ)h(s)ds (1)
where h(·) is the joint probability density function over A×P .This treatment of the expropriation penalty as a deadweight loss is most closely
related to the approach of Eaton and Gersovitz (1984) who consider a host countrygovernment that can expropriate foreign capital but is constrained from appropriatingforeign managerial expertise, and where the domestic supply of managers is uncertainat the time of investment. (A country with a higher expected managerial capacityreceives a comparatively low amount of FDI because the output loss associated withexpropriation is relatively low.) In the dynamic models of expropriation consideredby Cole and English (1991), Thomas and Worrall (1994) and Albuquerque (2003),the threat of being cut off from future foreign investment is a sufficient penalty toprevent the host country from finding it optimal to expropriate in all states, providedthe government’s discount factor is not too low. Unlike these models, future investmentdecisions are not relevant in the static environment that we consider here. However,the common features with these dynamic frameworks is a stochastic marginal utility ofcurrent consumption relative to the marginal utility of future consumption conditionalon the decision to expropriate.13
Note that the penalty is independent of the value of output and investment seized.Hence there is no incentive for the government to partially expropriate foreign assetsonce this penalty is incurred.
2.3. Investor ReturnsForeign firms are assumed to fully commit to paying domestic factors conditional ontheir assets not being expropriated, and can delay payments until payments for pro-duction are received. Denoting by π = Prob(s ∈ D) the ex ante probability thatexpropriation occurs, expected returns to the representative foreign investor in the man-ufacturing sector is given by by
E[ΠXf ] = (1− π)(F (KXf , Lf )− wLf
)− (1 + r)KXf (2)
13What is essential for FDI is that there is some positive, exogenous cost component associated withexpropriation. Whether this is interpreted as a loss in output, as in the case of externally imposed sanctions,or as a lack of political support for such actions, does not matter. In the former case, the government objectivefunction is expected national income, and in the latter case it is instead a government utility function that islinear over expected national income and the expected default penalty.
10
where r is the world risk-free rate of return on capital. (Without loss of generality, capi-tal is assumed to fully depreciate.) Domestic investors do not face risk of expropriation,but must pay domestic capital rh, and domestic investor returns are
E[ΠXh] = F (KXh, Lh)− wLh − (1 + rh)KXh. (3)
Resource sector contracts deliver the following returns to foreign and domestic in-vestors:
E[ΠRf ] =(1− π)(E[p|s /∈ D]G(KRf ,Mf )− τfMf
)− (1 + r)KRf (4)
E[ΠRh] =E[p]G(KRf ,Mf )− τhMh − (1 + rh)KRh (5)
where E[p|s /∈ D] is the expected price of the resource good given that expropriationhas not occurred and E[p] is the unconditional expected price.
2.4. EquilibriumWith the above definitions of production, resource contracts, investor returns, and hostcountry income, we can define an open-economy equilibrium with foreign investment.
Definition 2.1. An open-economy equilibrium is a vector
θ = (Mf ,Mh,KRf ,KRh,KXf ,KXh, τf , τh, Lf , Lh)
as well as pricesw and rh, default setD and a probability of expropriation π satisfyingthe following:
(i) Givenw, π and rh, foreign and domestic manufacturing firms choose KXf , Lfand KXh, Lh, respectively, to maximize (2) and (3).
(ii) The host country government chooses contracts [KRf , τf ] and [KRh, τh] and al-locates Mf and Mh to maximize (1) subject to the participation constraints offoreign and domestic firms, (4) > 0 and (5) > 0, taking into account the optimalresponses of firms in the manufacturing sector and corresponding changes in D.
(iii) Given θ, w, rh, and realization of s ∈ A×P , expropriation occurs whenever theresulting net gain in host-country exceeds the penalty a:
s ∈ D ⇔ a < Y E(p, θ)− Y N (p, θ).
(iv) Given θ and joint distribution h(·) over A× P , the ex ante probability of expro-priation is
π =
∫s∈D
h(s)ds.
11
(v) The domestic resource constraints are satisfied:
Mf +Mh = M
Lf + Lh = 1
KXh +KRh = K
Section 3 characterizes the equilibrium in the special case of a constant resourceoutput price. This provides the benchmark for considering the importance of stochasticresource output price in Section 4. Several general properties of the equilibrium aredescribed before considering these separate cases.
Equilibrium conditions (iii) and (iv) define mappings from the vector θ to the de-fault set and probability of expropriation, respectively, D(θ) and π(θ). Observing θand taking w(θ) and π(θ) as given, if there is positive foreign investment in the man-ufacturing sector, competitive foreign investors pay a wage to labor Lf that satisfiestheir zero profit condition. The assumed homogeneity of the productions implies
w(θ) =F (kXf , 1)−(
1 + r
1− π(θ)
)kXf (6)
where kXf = KXf/Lf . Conditional on positive foreign investment in this sector, theforeign investor capital-labor ratio in manufacturing determines the equilibrium priceof labor w(θ). If domestic investors operate in this sector, they pay w(θ) per unit oflabor and choose kXh = KXh/Lh to satisfy
w(θ) =F (kXh, 1)− FK(kXh, 1)kXf
where FK(·) = ∂F/∂Kh.If π(θ) is continuous (or constant) around equilibrium θ, the the foreign investment
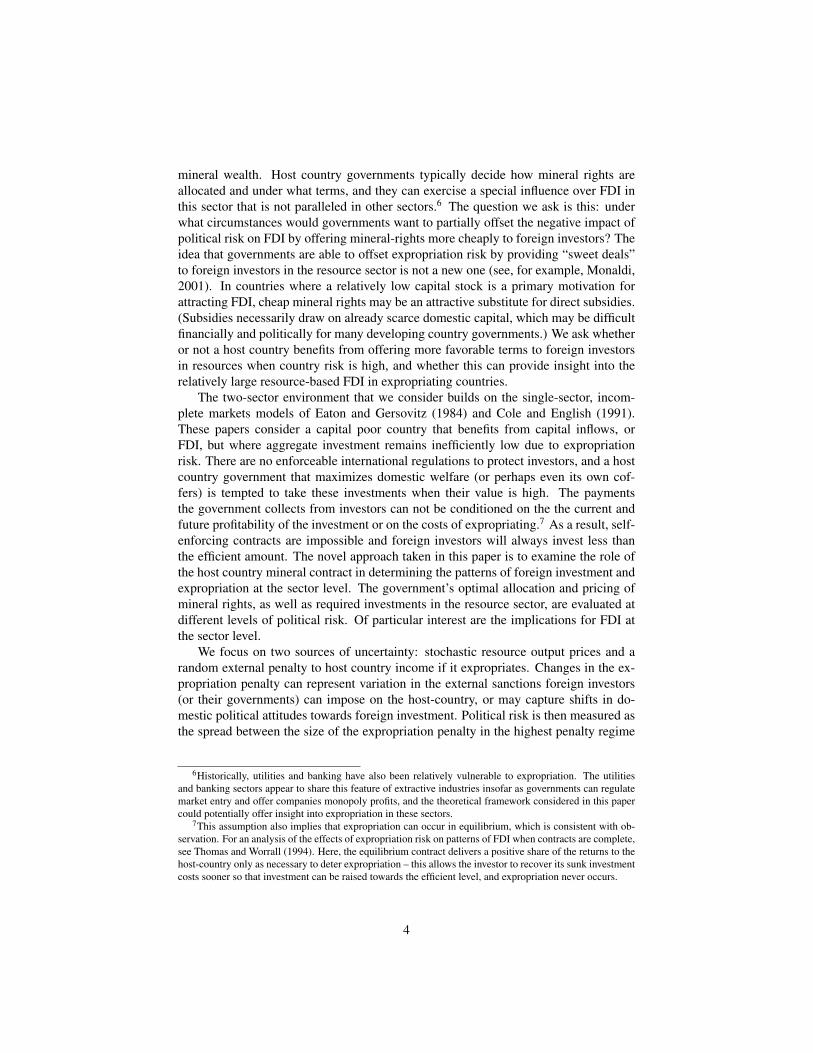
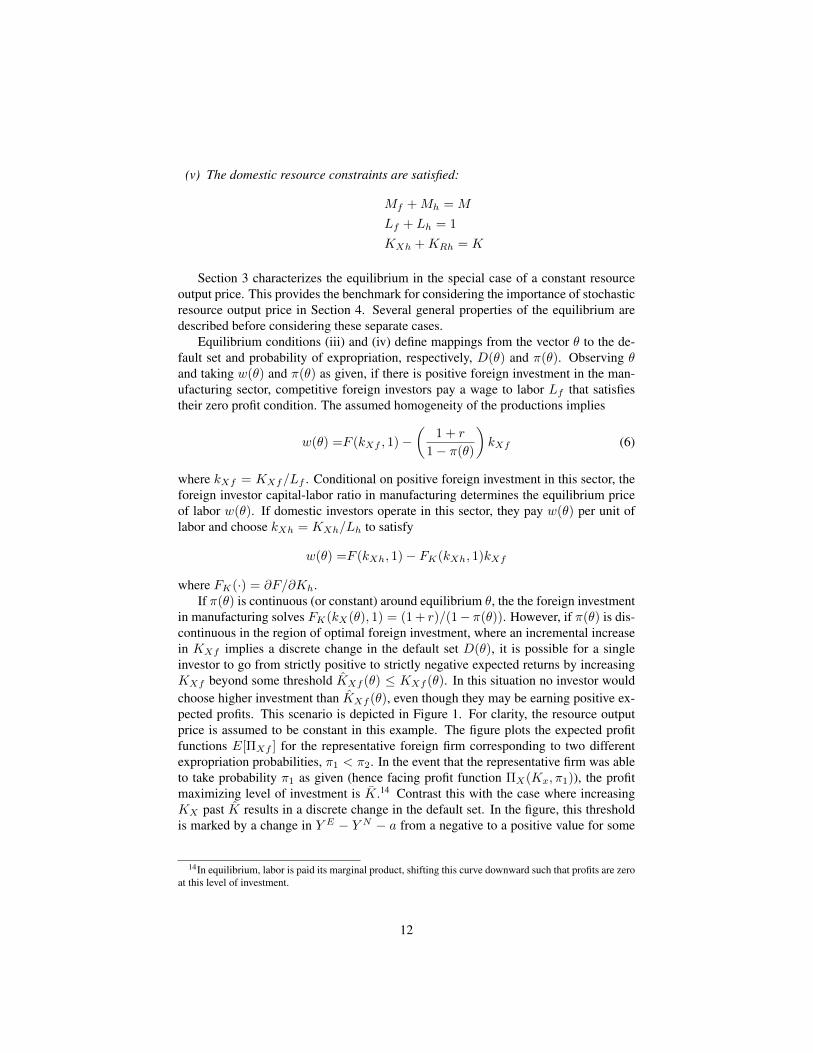
in manufacturing solves FK(kX(θ), 1) = (1 + r)/(1− π(θ)). However, if π(θ) is dis-continuous in the region of optimal foreign investment, where an incremental increasein KXf implies a discrete change in the default set D(θ), it is possible for a singleinvestor to go from strictly positive to strictly negative expected returns by increasingKXf beyond some threshold KXf (θ) ≤ KXf (θ). In this situation no investor wouldchoose higher investment than KXf (θ), even though they may be earning positive ex-pected profits. This scenario is depicted in Figure 1. For clarity, the resource outputprice is assumed to be constant in this example. The figure plots the expected profitfunctions E[ΠXf ] for the representative foreign firm corresponding to two differentexpropriation probabilities, π1 < π2. In the event that the representative firm was ableto take probability π1 as given (hence facing profit function ΠX(Kx, π1)), the profitmaximizing level of investment is K.14 Contrast this with the case where increasingKX past K results in a discrete change in the default set. In the figure, this thresholdis marked by a change in Y E − Y N − a from a negative to a positive value for some
14In equilibrium, labor is paid its marginal product, shifting this curve downward such that profits are zeroat this level of investment.
12
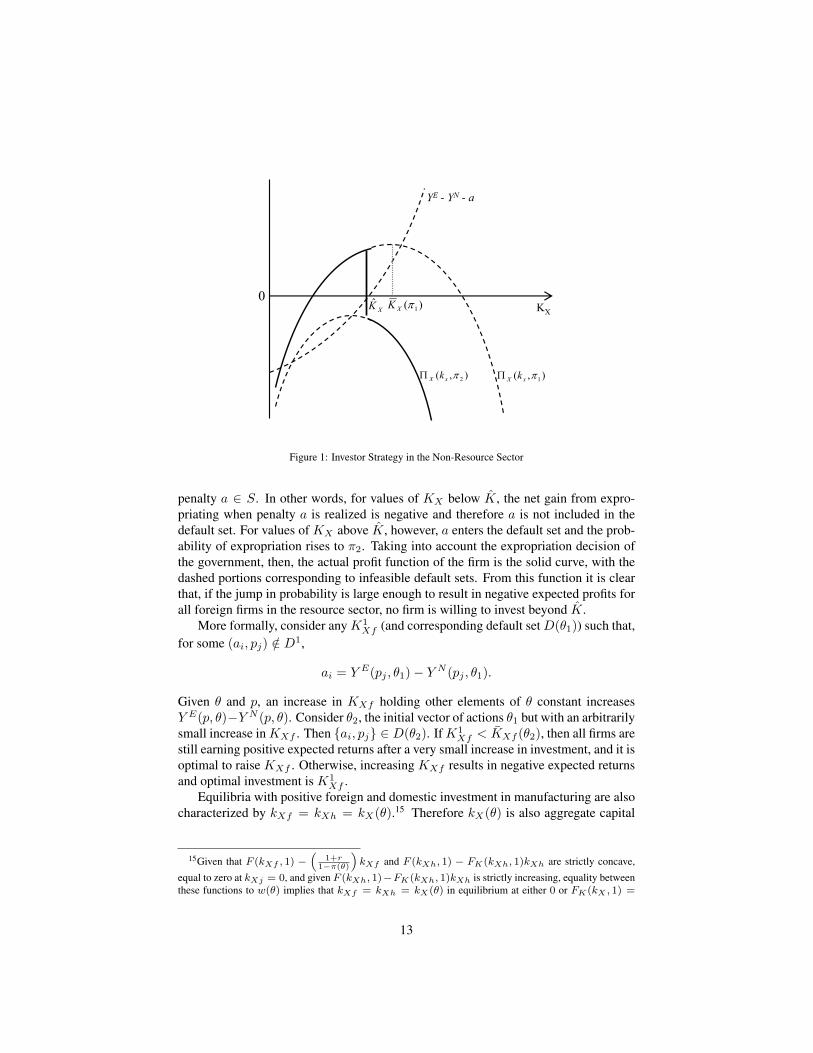
KX
0
YE - YN - a
),( 2πxX kΠ ),( 1πxX kΠ
XK )( 1πXK
Figure 1: Investor Strategy in the Non-Resource Sector
penalty a ∈ S. In other words, for values of KX below K, the net gain from expro-priating when penalty a is realized is negative and therefore a is not included in thedefault set. For values of KX above K, however, a enters the default set and the prob-ability of expropriation rises to π2. Taking into account the expropriation decision ofthe government, then, the actual profit function of the firm is the solid curve, with thedashed portions corresponding to infeasible default sets. From this function it is clearthat, if the jump in probability is large enough to result in negative expected profits forall foreign firms in the resource sector, no firm is willing to invest beyond K.
More formally, consider anyK1Xf (and corresponding default setD(θ1)) such that,
for some (ai, pj) /∈ D1,
ai = Y E(pj , θ1)− Y N (pj , θ1).
Given θ and p, an increase in KXf holding other elements of θ constant increasesY E(p, θ)−Y N (p, θ). Consider θ2, the initial vector of actions θ1 but with an arbitrarilysmall increase inKXf . Then ai, pj ∈ D(θ2). IfK1
Xf < KXf (θ2), then all firms arestill earning positive expected returns after a very small increase in investment, and it isoptimal to raise KXf . Otherwise, increasing KXf results in negative expected returnsand optimal investment is K1
Xf .Equilibria with positive foreign and domestic investment in manufacturing are also
characterized by kXf = kXh = kX(θ).15 Therefore kX(θ) is also aggregate capital
15Given that F (kXf , 1) −(
1+r1−π(θ)
)kXf and F (kXh, 1) − FK(kXh, 1)kXh are strictly concave,
equal to zero at kXj = 0, and given F (kXh, 1)−FK(kXh, 1)kXh is strictly increasing, equality betweenthese functions to w(θ) implies that kXf = kXh = kX(θ) in equilibrium at either 0 or FK(kX , 1) =
13
invested in the manufacturing sector, and kX(θ) = K − kRh(M − Mf ) (kRh =KRh/(M −Mf )). Hence kX(θ) pins down Lf (θ) and Lh(θ) given kRh and Mf :
Lf (θ) = 1− Lh(θ) =kX(θ)− (K − kRh(M −Mf ))
kX(θ).
Finally, FK(kX(θ), 1) = 1 + rh(θ), implying 1 + rh(θ) = (1 + r)/(1− π(θ)).Successful bidders for the resource-sector contracts simply carry out the investment
and payments specified in the contract chosen by the government (since all contractsdeliver non-negative expected profits). This results in a schedule τf (θ) for foreigninvestors (and an analogous schedule for domestic investors). This schedule leaves theforeign investor with zero expected profits:
τf (θ) =E[p|s /∈ D(θ)]G (kRf , 1)−(
1 + r
1− π(θ)
)kRf . (7)
Given the payments made to labor and for access to mineral rights summarized byequations (6) and (7), it is straightforward to verify that expected host country incomegiven by expression (1) is equal to:
V (θ) =F (KXh, Lh) + F (KXf , Lf ) + E[p]G(KRh,Mh) + E[p]G(KRf ,Mf ) (8)− (1 + r)[KXf +KRf ]− π(θ)E[a|s ∈ D(θ)].
where E[p] is the unconditional average mineral output price. Moreover, substituting(6) and (7) into Y E(p, θ)− Y N (p, θ), D(θ) and π(θ) implicitly defined by
s ∈ D(θ) ⇔ a < (p− E[p|s /∈ D(θ)])G(KRf ,Mf ) +(1 + r)(KXf +KRf )
1− π(θ). (9)
The equilibrium can be solved in two stages by backward induction where, in the sec-ond stage of the game, foreign and domestic firms adopt the optimal production andinvestment decisions just described conditional on the resource sector contracts, equi-librium prices, and the probability of expropriation. In the first stage of the game, thegovernment chooses resource contracts that maximize (8), taking into account the op-timal responses of firms and the corresponding effects on prices and the probabilityof expropriation. Given (7), this first stage collapses to a simultaneous decision over(KRf ,KRh,Mf ).
3. Equilibrium with a Constant Mineral PriceIn this section, we examine the relationship between country risk and sectoral patternsof FDI using a stylized example with a constant mineral output price and two potential
(1 + r)/(1− π(θ), and the latter is satisfied if there is positive production in the manufacturing sector.
14
expropriation penalties faced by the host-country government:
A = al, ah ∼ πl, 1− πl.
Differences in country risk are considered by varying the distribution over these directcosts of expropriation. Specifically, political risk is measured as the difference in thesize of expropriation penalty in the high penalty regime, ah, representing a governmentwith a high disincentive to expropriate, and the size of the low penalty, al.16 Withoutloss of generality, we fix ah at a value just above the level such that it could neverbe optimal for the government to expropriate such that al as an inverse measure ofcountry risk. In other words, a is high for all political regimes in a relatively low riskcountry, whereas a relatively high risk country is characterized by large swings in theexpropriation incentives of the different regimes.17
Depending on the equilibrium levels of foreign investment in both sectors, the prob-ability of expropriation occurring is either zero or the probability of the low penaltyregime, πl. With a constant mineral price p0, condition (9) implies that expropriationoccurs with probability zero if and only if:
al ≥ (1 + r)(KXf +KRf ) = (1 + r)(kXfLf + kRfMf ) (NE)
and expropriation occurs whenever al is realized and π(θ) = πl. We refer to (NE) asthe no-expropriation constraint. We assume that
0 ≤ al < a = (1 + r)(kFBX + kFBR M −K
)where kFBi is the efficient capital ratio in sector i. This ensures that expropriationrisk matters for investment decisions (the interesting case) since it implies that efficientlevels of investment in both sectors are not feasible.
We find that, for relatively high values of al (a relatively low risk country), (NE)binds, expropriation never occurs and the optimal resource contract corresponds toa continuous range of foreign mineral rights allocations Mf . This implies that theresource sector FDI share is not uniquely determined. Moreover, the “average” shareof FDI in the resource sector, defined as the median share across the set of all possible
16This notion of country risk is similar in spirit to that adopted by Cole, Dow, and English (1995) in theiranalysis of sovereign default, where a government transits through different political states that affect itsvaluation of future investments.
17An alternative approach would be to vary both ah and al such that the expected value of a is unchangedacross different risk groups. This alternative approach would result in qualitatively identical results in termsof sectoral foreign investment patterns, which is the main focus of this analysis, and merely influences thethreshold value of al below which expropriation occurs with positive probability. The reason is that it isnever optimal for foreign investor to invest beyond the point at which it is also optimal to expropriate inboth states and, as we will demonstrate, optimal foreign investment only exceeds the threshold for whichexpropriation occurs in the low penalty state when the difference between al and ah is large. Conversely,holding the difference between ah and al constant but varying the expected value of the penalty is yet anotherway to conceive differences in country risk. It is not clear that the implications of the model are identicalwhen country risk is modeled in this particular way. For the purposes of this analysis, however, our primaryinterest is the variation in the support of a, and for simplicity we focus on the size of al.
15
equilibria, may be increasing or decreasing over a range of al depending on a country’srelative factor abundance and properties of the production functions. For relativelylow values of al, by contrast, the government always expropriates in this state and theoptimal resource contract results in no foreign investment in the manufacturing sector,while positive mineral rights are allocated to foreign investors to achieve the efficientinvestment level in the resource sector. This implies that resources FDI makes up 100%of all FDI. The efficient investment level in resources is achieved despite a positiveprobability of expropriation by offering much lower mineral concession prices, whichare paid in the event expropriation does not occur. These findings are summarized bythe following propositions:
Proposition 3.1. For all al ∈ [0, a), kRh = kRf = kR and kXh = kXf = kX .Furthermore, provided K is not too low, there exists a′ ∈ (0, a) such that
1. for al ∈ [0, a′), kR = kFBR , kX = kFBX , and Mf = minM,M − (K −kFBX L)/kFBR and Lf = 0; expropriation occurs if and only if a = al.
2. for al ∈ [a′, a), kR < kFBR , kX < kFBX and the host-country governmentis indifferent towards the allocation of Mf and corresponding equilibrium Lfthat are consistent with sector investment kXL and kRM ; expropriation neveroccurs.
Proof. See appendix.
The optimal resource contracts for a relatively high risk country allocates a rela-tively large share of the stock of mineral rights to foreign investors, which increasesdomestic capital available for investment in the other sector and raises the wage rate.This renders foreign investment in this sector unprofitable given the positive probabil-ity of expropriation. Efficient levels of investment are achieved in both sectors. Forthe relatively high risk group, ex post host-country income is unambiguously higherin the event that a = al (and expropriation occurs) compared to the income it wouldreceive if investment were chosen to satisfy (NE). However, this benefit is at the costof lower payments for mineral rights and income in the event expropriation does notoccur. When country risk is low, al is sufficiently high that the expected direct costof expropriating exceeds the cost of lower aggregate FDI compared to the case where(NE) does not bind. However, the allocation of mineral rights between domestic andforeign investors is not uniquely determined for this low risk group. Consequently,the model does not imply any specific relationship between exogenous country riskand the resource FDI share within this high risk group when the mineral output priceis constant. However, even in this simple example, the resource “average” FDI shareis unambiguously higher in the case of high risk ((NE) does not bind) compared tothe case where (NE) binds. A full characterization of variation in the share of FDI inresources at different levels of risk is provided in the following Lemma.
Lemma 3.2. If K > 0, the “average” share of FDI in the resource sector σR =med(kRfMf/(kXfLf +kRfMf )) across the set of all equilibria, is strictly higher fora relatively high-risk country (al ∈ [0, a′)) compared to low-risk country (al ∈ [a′, a)).Moreover, if K ≥ maxkFBX L, kFBR M, σR is non-increasing over both [0, a′) and
16
(a′, a). IfK < maxkFBX L, kFBR M and the elasticity of manufacturing sector invest-ment to an increase in al is at least as high as the resource sector investment elasticity,σR is non-increasing over [0, a′) and (a′, a) provided K/M is not too low.
Proof. See appendix.
Although the correlation between sector FDI shares and country risk implied byLemma 3.2 is ambiguous within risk categories due to a multiplicity of equilibria,Proposition 3.1 and Lemma 3.2 have a clear implication for the probability of expro-priation between risk categories. Specifically, in a sample of randomly chosen equilib-ria across the different risk categoryes, the average resource FDI share will be strictlyhigher in countries that have expropriated compared to countries that have not. Com-paring a very high risk country such as Bolivia to a very low risk country such asMalaysia, our results imply that the resource contract in the high risk country will tendto offer mineral rights more cheaply to foreign investors and is expected to have a largerproportion of aggregate FDI located in the resource sector.
This contrasts the equilibrium pattern that are predicted under a resource pricingscheme where the government does not influence investment intensity and domesticfactors are paid their marginal products. Denoting the profit-maximizing capital ratiosin each sector by kR and kX (which would be identical in this case given 1 + rh =(1 + r)/(1− π(θ)), equation (8) can be expressed as:
V (θ) =F (kX(θ), 1) + E[p]G(kR(θ), 1)M − (1 + r)[kX(θ) + kR(θ)M −K]
− π(θ)E[a|s ∈ D(θ)].
Therefore V (θ) does not depend on the allocation of labor or mineral rights betweendomestic and foreign firms. In particular, when (NE) does not bind and π = πl, thehost-country is indifferent in allocatingM , and a range of possible equilibria exist withthe bounds of “average” resource FDI share in Lemma 3.2 determined in the same wayfor relatively high risk and low risk group.
4. Equilibrium with Price UncertaintySo far we have not considered variation in resource output prices. In this section weintroduce random resource output prices and re-examine the average relationship be-tween FDI and risk. Price uncertainty has substantive implications for the optimalresource contract in moderate risk countries. Governments in countries in the moder-ate to low risk category aim to minimize the ex ante risk of expropriation by limitingFDI to the resource sector and maximizing non-resource FDI, while countries in themoderate to high risk group minimize the likelihood of expropriation by maximizingFDI in resources instead. Lemma 3.2 still serves to illustrate the key predictions forresource contracts in very high risk countries. In addition, introducing mineral outputprice variability allows us to consider the positive correlation between mineral pricesand the likelihood of expropriation observed in the data.
For simplicity, the cumulative distribution function for mineral output prices is as-sumed to be continuous and twice differentiable over a bounded (non-negative) inter-
17
val:p ∼ Z[p, p]
and a and p are assumed to be independent.The key implication of random prices in terms of player strategies is that the gov-
ernment’s expropriation decision can be summarized by a choice of cutoff values forresource price, one for each penalty a, above which it is optimal to expropriate. Thisimplies that the expropriation set is described by
D(p∗l (θ), p∗h(θ)) =
(p∗l (θ), p], (p
∗h(θ), p]
where p∗k(θ) is the cutoff resource price whenever expropriation penalty ak is realized.So, for instance, if the government strategy is to never expropriate when facing thehigh penalty, but to expropriate when the penalty is low and the price is above some p∗l ,p∗h(θ) = p, the expropriation set is simply D(p∗l (θ), p
∗h(θ)) = (p∗l (θ), p]. If, in addi-
tion, p∗l (θ) = p, this signifies that expropriation is never optimal and D(p∗l (θ), p∗h(θ))
is empty. The threshold values p∗k(θ) (k = l, h), are defined by the following systemof equations: for each k,
p∗k(θ) =
p if ak ≥ Y E(p, θ)− Y N (p, θ)p if ak < Y E(p, θ)− Y N (p, θ)
and for all other θ, p∗k(θ) is implicitly defined by
ak = Y E(p∗k, θ)− Y N (p∗k, θ) (10)
where the explicit expression for Y E(p, θ)−Y N (p, θ) is equation (9). The host-countrygovernment’s objective function is (8) as before, and the probability of expropriationcan be expressed as
π(θ) = π(p∗l (θ), p∗h(θ)) =πl
∫ p
p∗l (θ)
z(p)dp+ (1− πl)∫ p
p∗h(θ)
z(p)dp (11)
where z(p) = ∂Z(p)/∂p. In this environment with a continuum of random prices, verysmall changes in FDI have a negligible effect the expropriation probability defined byequations (9) and (11), conditional on positive foreign investment in the resource sec-tor. When there is foreign investment in resources, the competitive foreign investmentdecision in manufacturing satisfies FK(kX(θ), 1) = (1 + r)/(1− π(θ)).
Introducing price uncertainty does not have any impact on equilibrium for the veryhigh risk group, as these countries still expropriate whenever the low penalty is realized(regardless of the price). However, for the more moderate risk group, price uncertaintyhas an important effect on equilibrium outcomes. The main difference is that, whenthere is positive FDI in the resource sector, the potential for foreign investors to earnpositive (ex post) rents in this sector when their assets are not expropriated (above whatis earned by manufacturing firms) makes expropriating particularly attractive in somestates. Specifically, the direct gain from expropriating is increasing in the differencebetween the realized price of resource output and the effective marginal revenues re-
18
ceived by foreign investors, p − E[p|s /∈ D(p∗l (θ), p∗h(θ))]. The effective marginal
product determines the price paid for each resource concession, and hence also theshare of resource rents going to the host-country. Because these payments are not con-tingent on the price of output, investors earn high profits ex post when the price is highand assets are not expropriated. This results in a greater temptation to expropriate inhigh-price states, and this temptation increases in the amount of resource-based FDI.18
For those countries that anticipate relatively high expropriation penalties, reducingthe temptation to expropriate in a low penalty regime (which is costly) is the preferredstrategy. For the lowest level of country risk, this is achieved by funneling all domesticcapital into the resource sector. For higher risk countries (yet not so risky that the gov-ernment subsidizes resource FDI), concentrating FDI in the resource-sector minimizesexpropriation risk. The reason is that foreign firms in this sector, conditional on notbeing expropriated, earn low or negative returns in the low penalty regime compared toforeign firms in the non-resource sector. Increasing FDI in resources therefore raisesthe probability of expropriation by less than an equal increase in non-resource FDI.
To provide a sharper illustration of these relationships, consider the case where it isnever optimal to expropriate when sanctions are high (p∗h(θ) = p).19 For this case, thecharacteristics of the equilibrium solutions across varying levels of country risk al aresummarized by the following proposition:
Proposition 4.1. For all al ∈ [0, a), kXh = kXf = kX in equilibrium. Provided Kis not too low and under certain conditions on F (·), G(·), and Z(·) guaranteeing aunique solution to 2.1, the interval [0, a) can be partitioned into continuous subinter-vals AL, AM and AU such that
1. for al ∈ AL, kRh = kRf = kFBR , kX = kFBX , Mf = minM,M − (K −kFBX L)/kFBR and Lf = 0; expropriation occurs if and only if a = al.
2. for al ∈ AM , kRh < kRf < kFBR , kX < kFBX , Mf = minM,M − (K −kXL)/kRf and Lf ≥ 0; expropriation occurs if a = al and p > p0
l for somep∗l = p0
l ∈ [p, p).
3. for al ∈ AU , kRf < kRh < kFBR , kX < kFBX , Mf = max0,M − K/kRhand Lf > 0. If Mf > 0, expropriation occurs if a = al and p > p1
l for somep∗l = p1
l ∈ (p, p]. Otherwise expropriation never occurs.
Moreover, if AM is non-empty, AL < AM < AM (that is supAL = inf AM andsupAM = inf AU ) and p0
l < p1l . If instead AM is empty, AL < AU and supAL =
inf AU .
18A positive difference p − E[p|s /∈ D(p∗l (θ), p∗h(θ))] is related to “windfall” profits in the sense thatit captures the returns per unit of output in excess of what is received in the manufacturing sector (whenexpropriation does not occur). The average windfall profits could be reduced by setting a concession paymentschedule that varies positively with the resource output price. This is commonly a feature of the optimalcontract in a dynamic, complete markets framework.
19When only two possible penalties are assumed, this becomes the relevant case to consider. In ourcalibrated numerical exercise, p∗h(θ) < p occurs only when ah is sufficiently low and very close to al, andwhere there is a very large variance in the resource output price.
19
Proof. See appendix.
Although a detailed proof is provided in the appendix, we provide some additionalintuition here. For sufficiently low al (al ∈ AL), the equilibrium is as described inProposition 3.1.1 but where p0 = E[p]. In this case it is always optimal to expropriatewhen a = al, resource-based FDI is maximized and manufacturing FDI is zero. (SeeSection 3 for a complete description.)
At moderate risk levels, the government expropriates only when a = al and themineral output price exceeds a particular threshold price, conditional on positive FDIin the resource sector. (With no resource-based FDI, manufacturing FDI is determinedby the (NE) constraint and expropriation never occurs and, equivalently, p∗l = p.) Tounderstand how the optimal resource contract varies across levels of al for this moremoderate risk group, it is useful to define Q(x) = x− E[p|s /∈ D(x, p)], where Q(x)is strictly increasing in x for x ∈ [p, p] given Z. Evidently Q(p) > 0. Examiningequation (9) which implicitly defines the price above which expropriation occurs in thelow penalty regime, if al is relatively high (al ∈ AU ) then for any amount of resourceFDI, kRfMf , there is a unique p∗l > p satisfying this equality (taking into accountthe effects of p∗l on the probability of expropriation and manufacturing sector foreigninvestment) such that Q(p∗l ) ≥ 0. In this case it is optimal to lower Mf (to zero, if thedomestic capital stock is sufficient to attain desired investment in this sector), becausethis permits a rise in p∗l for a given quantity of aggregate FDI, and therefore raises totalFDI and V (θ). Expropriation risk is minimized, and the probability of expropriating iseven zero if there is sufficient domestic capital to optimally allocate all mineral rightsto domestic investors.
This policy is reversed whenever Q(p∗l ) < 0, given the maximum attainable aggre-gate FDI. This condition holds for countries having a relatively low al, but not so low,however, that it is always optimal to expropriate whenever al is realized (al ∈ AM ).In this case raising Mf is optimal, since this permits a rise in aggregate FDI. The rea-son for this is that, when Q(p∗l ) < 0, any “windfall profits” in the high-price, lowpenalty states are entirely appropriated by the host country in the low penalty regimewhen expropriation occurs. Conditional on not being expropriated in this state, the expost returns received by foreign firms in the resource sector are below that receivedby firms in the non-resource sector (and possibly even negative). Shifting FDI fromthe non-resource sector to the resource sector makes expropriation less attractive in thelow penalty regime, for a given level of aggregate FDI. However, for some functionalforms and parameter values it is possible that the threshold level of al for which it isalways optimal to expropriate in this state (supAL) is higher than the threshold levelof al such that Q(p∗l ) < 0 at the corresponding levels of investment, in which caseall countries would be classified in either the very high risk or very low risk groups(supAL = inf AU ).
The implied expropriation pattern for countries in the moderate risk group (al ∈AM ) generates a positive relationship, on average, between resource output prices andthe timing of expropriation. For this group, when a low penalty regime is realized,the host-country government expropriates if and only if the price exceeds the thresholdprice because this gives the host country higher ex post income/consumption given thesize of the penalty compared to not expropriating. In this static environment, this result
20
requires only that the objective function be strictly increasing in consumption/output.In a dynamic context where investors can threaten to cut off future investment if ex-propriation occurs, however, whether or not the host-country government in this groupwould be more tempted to expropriate when the resource output price is high or whenit is low will also depend on the degree of risk aversion implied by the objective func-tion, as shown in Cole and English (1991). In particular, in their dynamic one-sectormodel of expropriation where the relative value of domestic consumption and the con-tinuation values of consumption under the contract is stochastic, sufficient concavity ofthe objective function in consumption/output implies that it is optimal to expropriatewhenever the value of today’s consumption is relatively low. This is because the in-creased marginal utility of not-expropriating when the value of output and productionis low is high relative to the loss in future consumption from reduced foreign invest-ment. Therefore in a dynamic environment, the prediction that expropriation tends tocoincide with relatively high priced sates will depend on the government’s degree ofrisk aversion as well as the type of research contract.20
5. Ad Valorem and Other Royalty PaymentsIn this section we consider a generalized version the resource contract of the previoussection. This class of contracts includes a tax on the value of resource-sector output(rather than simply charging foreign investors a fixed price unit of mineral conces-sions). This type of payment arrangement is common under standard royalty contracts.We are interested such resource contracts because when resource output prices are vari-able it is conceivable that the fixed payment schedule assumed in the previous examplesexaggerates the risk associated with resource FDI compared to a royalty contract. Apure ad valorem royalty payment is perfectly correlated with the resource output price.This implies that the temptation of governments in moderate risk countries to expropri-ate when the price is high is, at least partially, reduced. We establish a sufficient con-dition for the optimal contract to result in the same equilibrium relationships betweencountry risk, allocation of mineral rights between foreign and domestic investors, andexpropriation established by Proposition 4.1. Moreover, we show that this condition issatisfied by all resource contracts that include any combination of ad valorem royaltypayments and fixed payments per unit of mineral concessions.
Denoting the total optimal resource sector tax payment for the representative for-eign firm by C(KRf ,Mf , p), the optimal contract renders the foreign investor indif-ferent between investing and not investing:
E[ΠRf ] =(1− π(θ))E[p|s /∈ D(θ)]G(KRf ,Mf )− (1 + r)KRf
− (1− π(θ))E[C(KRf ,Mf , p)|s /∈ D(θ)] = 0 (12)
where D(θ) and π(θ) are determined by price cutoff rule p∗l following the logic of the
20Specifically, in addition to concavity of the objective function, whether or not expropriation is predictedto occur in high or low price states should also depend on how the host-country’s share of current periodreturns relative to future expected returns varies in to the resource output price.
21
previous section. This resource payment is more general because it may now dependon p. For example, an ad valorem royalty ρf satisfying (12):
E[ΠRf ] =(1− π(θ))(1− ρf )E[p|s /∈ D(θ)]G(KRf ,Mf )− (1 + r)KRf = 0
results in the following ex post royalty payment which increases proportionately withrealizations of p:
C(KRf ,Mf , p) = ρf (θ)× pG(KRf ,Mf )
= p
(G(KRf ,Mf )−
(1 + r
1− π(θ)
)KRf
E[p|s /∈ D(θ)]
).
Note that the conditional expectationE[C(KRf ,Mf , p)|s /∈ D(θ)] is equal to expectedpayment under the contract of the previous section, τf (θ)Mf , defined by (7). In fact,any resource contract satisfying (12) corresponds to identical ex ante expected share ofresource sector returns for the host country and foreign investors:
E[C(KRf ,Mf , p)|s /∈ D(θ)] = E[p|s /∈ D(θ)]G(KRf ,Mf )− (1 + r)KRf
1− π(θ).
Therefore host-country income is given by (8) for any resource contract satisfying (12),and the host-country government problem differs across contracts only in terms of theex post expropriation decision, which in turn defines the cutoff rule p∗l . The generalform of condition (10) defining cutoff p∗l ∈ (p, p) is
(1 + r)KXf
1− π(θ)+ p∗lG(KRf ,Mf )− C(KRf ,Mf , p
∗l )− al = 0. (13)
It is possible to derive conditions on the resource contract that necessarily implythe same relationship between country risk, expropriation price thresholds, and mineralrights allocation that are already summarized by Proposition 4.1, assuming the contractsatisfies the conditions for a unique solution to the government problem. A sufficientcondition is established in the following lemma:
Lemma 5.1. Consider a continuous, differentiable payment schedule C(KRf ,Mf , p)that satisfies (12), such that the representative foreign investor in the resource sectorpays total amountC(KRf ,Mf , p) in the event it is not expropriated. Any such paymentschedule produces the equilibrium relationships between al, Mf , kX , kRf , kRh andthreshold resource price p∗l summarized in Proposition 4.1 whenever it satisfies thefollowing requirements:
p∗l > E[p|s ∈ D(θ)] ⇔ p∗lGK(KRf ,Mf )− CK(KRf ,Mf , p∗l ) >
1 + r
1− π(θ)
and
p∗l > E[p|s /∈ D(θ)] ⇒ p∗lGM (kRf , 1)− CM (KRf ,Mf , p∗l ) ≥ 0
p∗l < E[p|s /∈ D(θ)] ⇒ p∗lGM (kRf , 1)− CM (KRf ,Mf , p∗l ) ≤ 0.
22
where
CK(KRf ,Mf , p∗l ) =
∂C(KRf ,Mf , p)
∂KRf
∣∣∣∣p=p∗l
.
Moreover, a resource contract consisting of an ad valorem royalty, a fixed payment perunit of resource concessions, or a mixture of both that satisfies (12) will also satisfythese requirements.
Proof. See appendix.
Lemma 5.1 demonstrates that the equilibrium relationships outlined in the previoussection correspond to a wide variety of resource sector contracts, including combina-tions of ad valorem royalties and fixed payments per concession typically observed instandard mining contracts. Specifically, under this broad class of conditional paymentsfor mineral concessions, p∗l (θ) is decreasing and π(θ) is increasing in country risk and,whenever p∗l > E[p|s /∈ D(θ)], the optimal policy is to lower Mf towards zero (untilall domestic capital is located in the resource sector). When the opposite inequalityholds, but p∗l is above the threshold corresponding to the highest risk catogory, theoptimal policy is to raise Mf towards M until all manufacturing sector investment isdomestic capital. As a result, both the share of FDI in resources and the probability ofexpropriation are increasing in country risk for all such contracts, though investmentand output levels may vary under the different types of contract.21
An example of a resource contract that does not result in these equilibrium relation-ships is one where the the entire ex post value of resource sector production accruesto the host country, but where foreign investors deduct the risk-adjusted value of theircapital investments. Specifically, foreign investors pay, conditional on not being expro-priated,
C(KRf ,Mf , p) = pG(KRf ,Mf )−(
1 + r
1− π(θ)
)KRf
for all p ∈ P . This payment schedule satisfies (12): ex post foreign investor profitsin the resource sector equal π(θ)(1 + r)KRf/(1− π(θ)) when expropriation does notoccur, and equal −(1 + r)KRf when expropriation does occur.
Note that for any value of p,
pGK(KRf ,Mf )− CK(KRf ,Mf ) =1 + r
1− π(θ)
and pGM (KRf ,Mf ) − CM (KRf ,Mf , p) = 0, and therefore only one of the tworequirements for the condition outlined in Lemma 5.1 is satisfied. The reason is that,under such a contract, expropriation either always occurs in the low penalty regime or
21This suggests there are potential welfare implications from a choice over the type of resource paymentat different levels of country risk a model of expropriation such as this one. See Engel and Fischer (2010)for a theoretical analysis along these lines.
23
else never occurs:
Y E − Y N − al =
(1 + r
1− π(θ)
)(KXf +KRf )− al.
In other words, either p∗l = p (and (1 + r)[KXf +KRf ] > (1− πl)al) or p∗l = p (and(1 + r)[KXf +KRf ] ≤ al), as in the case with no resource-output price uncertainty.
6. Numerical ResultsWe illustrate the predicted relationships between country risk, sector production andFDI shares, and the probability of expropriation using a calibrated numerical examplebased on data for a sample of 38 developing and emerging economies over the period1990-2006.22 For this exercise, we assume that aggregate output in each sector isproduced using Cobb-Douglas production functions:
G(KRj ,Mj) = KαRjM
1−αj α ∈ (0, 1)
F (KXj , Lj) = KγXj(ALj)
1−γ γ ∈ (0, 1)
where A is a labor-augmenting productivity parameter. For simplicity, it is also as-sumed that prices are uniformly distributed over the interval [p, p]:
p ∼ U [p, p].
This distribution implies the following simple expression for the probability of expro-priation:
π(θ) =p− πlp∗l (θ)− (1− πl)p∗h(θ)
p− p.
Finally, we also maintain the simplifying assumption that ah is always sufficiently highthat p∗h(θ) = p. As discussed above, the qualitative results do not depend on changesin this assumption.
Technology parameters are chosen based on standard estimates in the literature,while country specific labor productivity, capital stocks and resource stocks are chosento match simulated sector production with aggregate capital and FDI stocks and sectorproduction shares in the data. Unless otherwise stated, all parameter estimates corre-spond to averages over 1990-2006 in the data. A government stability index is usedto construct a measure of country risk, summarised by penalty parameter al. The sim-ulated sector FDI shares for each country are then compared to empirical FDI sharesestimates, and the predicted probabilities of expropriation among different country riskgroups are compared to the corresponding country expropriation frequencies observed.
We assume γ is equal to 0.33 based on the non-resource (manufacturing and ser-vices) capital income shares estimated by Valentinyi and Herrendorf (2008) for the
22The sample of countries is limited predominantly by the availability of data on sector FDI stocks.
24
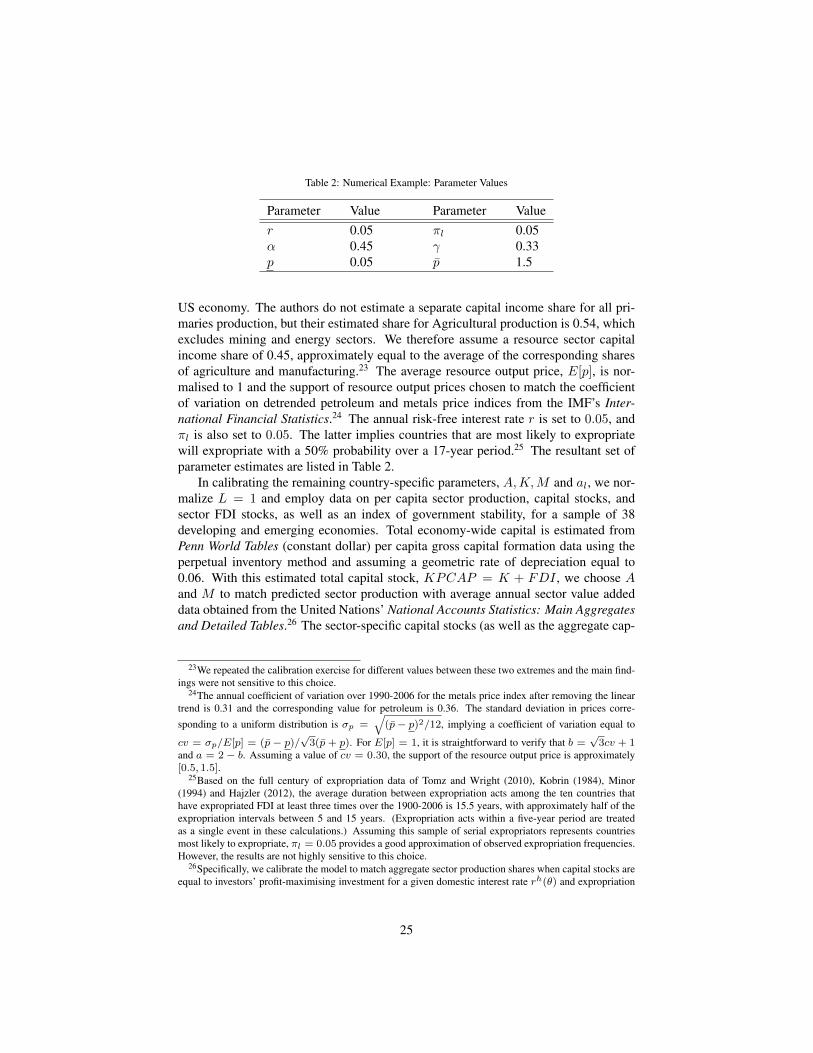
Table 2: Numerical Example: Parameter Values
Parameter Value Parameter Valuer 0.05 πl 0.05α 0.45 γ 0.33p 0.05 p 1.5
US economy. The authors do not estimate a separate capital income share for all pri-maries production, but their estimated share for Agricultural production is 0.54, whichexcludes mining and energy sectors. We therefore assume a resource sector capitalincome share of 0.45, approximately equal to the average of the corresponding sharesof agriculture and manufacturing.23 The average resource output price, E[p], is nor-malised to 1 and the support of resource output prices chosen to match the coefficientof variation on detrended petroleum and metals price indices from the IMF’s Inter-national Financial Statistics.24 The annual risk-free interest rate r is set to 0.05, andπl is also set to 0.05. The latter implies countries that are most likely to expropriatewill expropriate with a 50% probability over a 17-year period.25 The resultant set ofparameter estimates are listed in Table 2.
In calibrating the remaining country-specific parameters, A,K,M and al, we nor-malize L = 1 and employ data on per capita sector production, capital stocks, andsector FDI stocks, as well as an index of government stability, for a sample of 38developing and emerging economies. Total economy-wide capital is estimated fromPenn World Tables (constant dollar) per capita gross capital formation data using theperpetual inventory method and assuming a geometric rate of depreciation equal to0.06. With this estimated total capital stock, KPCAP = K + FDI , we choose Aand M to match predicted sector production with average annual sector value addeddata obtained from the United Nations’ National Accounts Statistics: Main Aggregatesand Detailed Tables.26 The sector-specific capital stocks (as well as the aggregate cap-
23We repeated the calibration exercise for different values between these two extremes and the main find-ings were not sensitive to this choice.
24The annual coefficient of variation over 1990-2006 for the metals price index after removing the lineartrend is 0.31 and the corresponding value for petroleum is 0.36. The standard deviation in prices corre-
sponding to a uniform distribution is σp =√
(p− p)2/12, implying a coefficient of variation equal to
cv = σp/E[p] = (p − p)/√
3(p + p). For E[p] = 1, it is straightforward to verify that b =√
3cv + 1and a = 2 − b. Assuming a value of cv = 0.30, the support of the resource output price is approximately[0.5, 1.5].
25Based on the full century of expropriation data of Tomz and Wright (2010), Kobrin (1984), Minor(1994) and Hajzler (2012), the average duration between expropriation acts among the ten countries thathave expropriated FDI at least three times over the 1900-2006 is 15.5 years, with approximately half of theexpropriation intervals between 5 and 15 years. (Expropriation acts within a five-year period are treatedas a single event in these calculations.) Assuming this sample of serial expropriators represents countriesmost likely to expropriate, πl = 0.05 provides a good approximation of observed expropriation frequencies.However, the results are not highly sensitive to this choice.
26Specifically, we calibrate the model to match aggregate sector production shares when capital stocks areequal to investors’ profit-maximising investment for a given domestic interest rate rh(θ) and expropriation
25
ital stock) used to evaluate the model’s predicted foreign investment patterns are fromHajzler (2012).
The penalty parameter al is a more challenging parameter to estimate given thatthere is no direct counterpart in the data. In the context of the model, the discrepancybetween al and ah (relative to optimal aggregate FDI) represents the magnitude in theshift in policy ideology between government regimes, at least with respect to foreigninvestment. The strategy we adopt is to estimate al from an index of governmentstability (GOV STAB) for each country in the sample using the following formula:
alFDI∗
= ν1 + ν2(GOV STAB)
where FDI∗ represents the efficient level of aggregate foreign investment implied bythe model given K, GOV STAB ∈ [0, 1], and ν2 > 0. When ν1 ≥ 0 and ν2 = 1,for example, this mapping implies the country with the highest stability index is ableto achieve the efficient level of investment without incurring any penalty in the modelof Section 4 (al ≥ FDI∗), while countries with a lower index will face lower overallinvestment or a positive penalty. The stability index is taken from the Political RiskServices’ International Country Risk Guide. This index is a score based on the levelof a country’s (i) government unity, (ii) legislative strength, and (ii) popular support.We normalize the index to take values between 0 and 1 based on the maximum andminimum values in our sample. The model is simulated for several different values ofν1 and ν2, and we present the results for the values that produce the closest fit withthe data in terms of matching predicted expropriation frequencies within the three riskcategories of Proposition 4.1 (ν1 = 0.2 and ν2 = 0.6).27
The predicted and empirical sector foreign investment shares as well as the pre-dicted probabilities of expropriation are compared for all countries in Table 3. Statisticsare grouped according to country risk categories: π(θ) = 0 (al ∈ AU ), π(θ) ∈ (0, πl)(al ∈ AM ) and π(θ) = πl (al ∈ AL). The first column reports the aggregate resource-sector investment shares predicted by a competitive, two-seater model calibrated to theempirical resource-sector value added for each country.28 If the government incentives
probability π(θ). This strategy involves guessing rh(θ) (and hence π(θ)), estimating domestic capital asthe difference between the estimated capital stock per person and FDI per person, and setting A and M tomatch estimated value added per person in each sector. The model is then solved for sector capital stocks(which in our model need not equal the approximated levels implied by profit-maximising investment) andthe domestic interest rate implied by the model. This process is repeated until convergence in the predictedinterest rate is achieved. Using this procedure we are able to match the empirical sector production shareswith a high degree accuracy (± 1 percentage point for all countries in the sample).
27It may appear that this strategy for estimating al is overly flexible in terms of the ability to match countryrisk levels and therefore resource FDI shares, the main variable of interest. However, provided ν2 > 0, themodel predictions are significantly disciplined by the ordinal ranking of countries according to the stabilityindex used, and the choice of ν1 and ν2 simultaneously influences the predicted expropriation thresholds forall countries in the sample.
28The equilibrium relationship between sector production and sector investment shares for Cobb-Douglastechnology is
KR
KX +KR=
αE[p]R
αE[p] + γX.
where R = Rh +Rf and X = Xh +Xf .
26
for allocating mineral rights between foreign and domestic investors predicted by ourmodel are ignored, this share also corresponds to the expected resources FDI share,providing a benchmark against which to test the predictions of the model. The secondcolumn reports the empirical resources FDI share, and the third column contains theresource FDI shares predicted by our calibrated model. The fourth column containsthe probability of expropriation implied by the model, and the final column contains anindicator variable that equals 1 if the country is recorded in the data to expropriate atleast once over the 1990-2006 sample period.
Comparing the first and second columns, we observe lower resource FDI shares inthe data compared to the investment shares implied by the standard competitive modelon average for countries in the top portion of the table (π(θ) = 0), and higher resourceshares compared to those implied by the standard model on average for countries inthe lower portions of the table (π(θ) > 0). Specifically, the empirical resource FDIshare for countries in the relatively low risk category is below the predicted equilib-rium investment shares for 4 of the 25 countries in this group (84% of countries). Theaverage discrepancy between predicted aggregate sector investment shares and esti-mated shares that is observed for relatively high risk countries is the opposite sign.Among countries with a positive predicted probability of expropriating in the model,the resource FDI share observed in the data exceeds the aggregate investment share for9 of the 13 countries (70% of countries). The bottom three rows of Table 3 report theaverage country shares for the three risk categories. The average empirical relationshipbetween country risk and resources FDI is not monotonic across the three groups (theaverage predicted share for the highest risk group is slightly below that of the moder-ate risk group), which appears to be partially explained by the relatively high resourceproduction shares among the intermediate country risk group in our sample. (Theseproduction shares, in turn, are largely pinned down by the stock of resource rights M ,which we take to be exogenous.) Nevertheless, when comparing the relatively low-risk country group and the highest risk group, predicted average resource FDI sharesare relatively large for the latter group even though the average differences in aggre-gate sector capital and production shares between the two groups are comparativelysmall. This coincides with the empirical relationship between risk and sector FDI andproduction shares documented in Hajzler (2012). The author compares sector FDIand production shares across expropriating and non-expropriating countries over thesame sample period and finds that the resource FDI share is significantly higher amongexpropriating countries compared to non-expropriating countries, even though sectorvalue-added shares differ little between country groups. Specifically, the difference inaverage resource FDI shares between expropriating and non-expropriating countries is24 percentage points, while the corresponding difference in resource output shares is-9 percent, as expropriating countries are slightly less resource-reliant. (See Table 4.)
The expropriation risk model with relative resource price uncertainty of Section 4can help explain this average tendency as shown in the third column; for the relativelylow risk (or politically stable) group, the host-country government has an incentive tominimize the allocation of mineral rights to foreign investors in order to maximize thequantity of aggregate FDI. Given the parameter estimates for our country sample, nomineral rights are allocated to foreign investors and the probability of expropriationis zero. Only when al is sufficiently low is it optimal to allocate mineral rights to
27
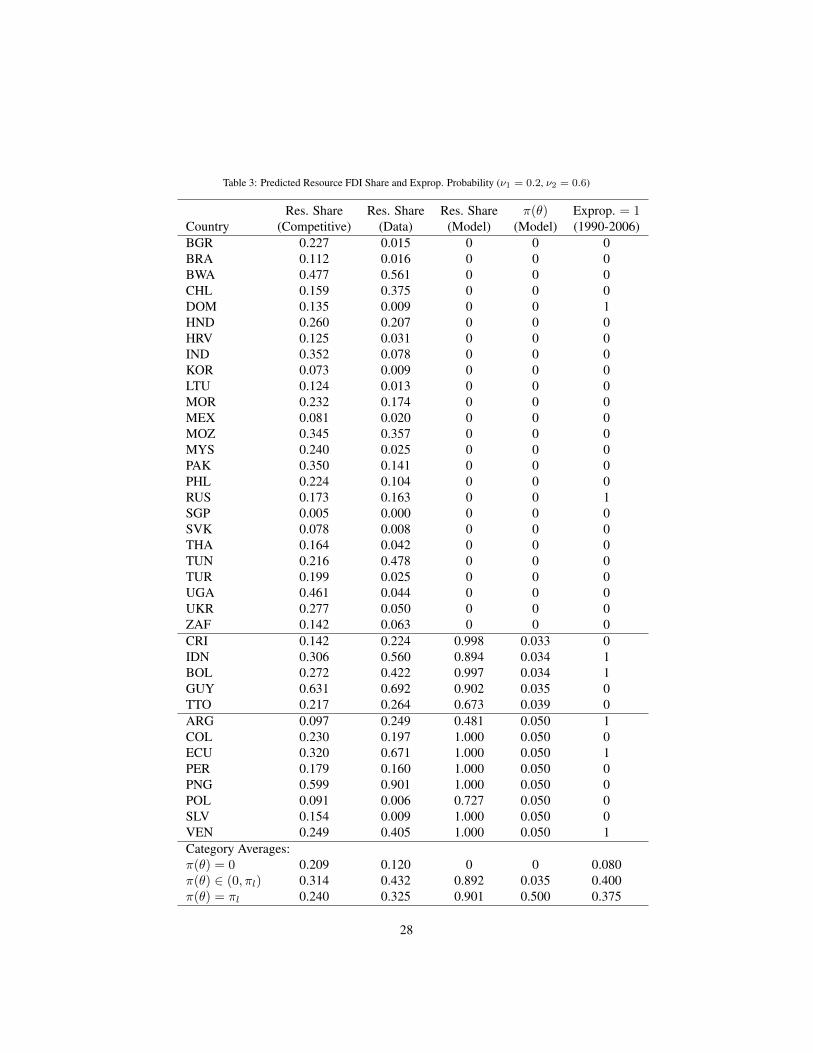
Table 3: Predicted Resource FDI Share and Exprop. Probability (ν1 = 0.2, ν2 = 0.6)
Res. Share Res. Share Res. Share π(θ) Exprop. = 1Country (Competitive) (Data) (Model) (Model) (1990-2006)BGR 0.227 0.015 0 0 0BRA 0.112 0.016 0 0 0BWA 0.477 0.561 0 0 0CHL 0.159 0.375 0 0 0DOM 0.135 0.009 0 0 1HND 0.260 0.207 0 0 0HRV 0.125 0.031 0 0 0IND 0.352 0.078 0 0 0KOR 0.073 0.009 0 0 0LTU 0.124 0.013 0 0 0MOR 0.232 0.174 0 0 0MEX 0.081 0.020 0 0 0MOZ 0.345 0.357 0 0 0MYS 0.240 0.025 0 0 0PAK 0.350 0.141 0 0 0PHL 0.224 0.104 0 0 0RUS 0.173 0.163 0 0 1SGP 0.005 0.000 0 0 0SVK 0.078 0.008 0 0 0THA 0.164 0.042 0 0 0TUN 0.216 0.478 0 0 0TUR 0.199 0.025 0 0 0UGA 0.461 0.044 0 0 0UKR 0.277 0.050 0 0 0ZAF 0.142 0.063 0 0 0CRI 0.142 0.224 0.998 0.033 0IDN 0.306 0.560 0.894 0.034 1BOL 0.272 0.422 0.997 0.034 1GUY 0.631 0.692 0.902 0.035 0TTO 0.217 0.264 0.673 0.039 0ARG 0.097 0.249 0.481 0.050 1COL 0.230 0.197 1.000 0.050 0ECU 0.320 0.671 1.000 0.050 1PER 0.179 0.160 1.000 0.050 0PNG 0.599 0.901 1.000 0.050 0POL 0.091 0.006 0.727 0.050 0SLV 0.154 0.009 1.000 0.050 0VEN 0.249 0.405 1.000 0.050 1Category Averages:π(θ) = 0 0.209 0.120 0 0 0.080π(θ) ∈ (0, πl) 0.314 0.432 0.892 0.035 0.400π(θ) = πl 0.240 0.325 0.901 0.500 0.375
28
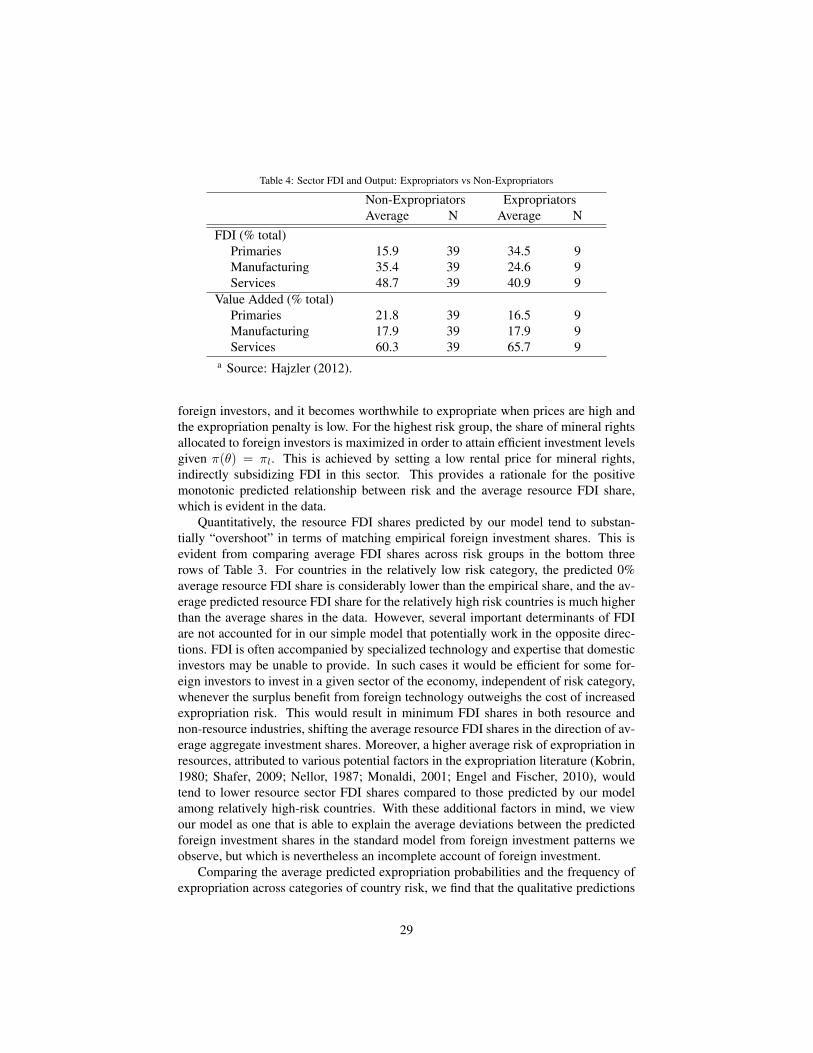
Table 4: Sector FDI and Output: Expropriators vs Non-Expropriators
Non-Expropriators ExpropriatorsAverage N Average N
FDI (% total)Primaries 15.9 39 34.5 9Manufacturing 35.4 39 24.6 9Services 48.7 39 40.9 9
Value Added (% total)Primaries 21.8 39 16.5 9Manufacturing 17.9 39 17.9 9Services 60.3 39 65.7 9
a Source: Hajzler (2012).
foreign investors, and it becomes worthwhile to expropriate when prices are high andthe expropriation penalty is low. For the highest risk group, the share of mineral rightsallocated to foreign investors is maximized in order to attain efficient investment levelsgiven π(θ) = πl. This is achieved by setting a low rental price for mineral rights,indirectly subsidizing FDI in this sector. This provides a rationale for the positivemonotonic predicted relationship between risk and the average resource FDI share,which is evident in the data.
Quantitatively, the resource FDI shares predicted by our model tend to substan-tially “overshoot” in terms of matching empirical foreign investment shares. This isevident from comparing average FDI shares across risk groups in the bottom threerows of Table 3. For countries in the relatively low risk category, the predicted 0%average resource FDI share is considerably lower than the empirical share, and the av-erage predicted resource FDI share for the relatively high risk countries is much higherthan the average shares in the data. However, several important determinants of FDIare not accounted for in our simple model that potentially work in the opposite direc-tions. FDI is often accompanied by specialized technology and expertise that domesticinvestors may be unable to provide. In such cases it would be efficient for some for-eign investors to invest in a given sector of the economy, independent of risk category,whenever the surplus benefit from foreign technology outweighs the cost of increasedexpropriation risk. This would result in minimum FDI shares in both resource andnon-resource industries, shifting the average resource FDI shares in the direction of av-erage aggregate investment shares. Moreover, a higher average risk of expropriation inresources, attributed to various potential factors in the expropriation literature (Kobrin,1980; Shafer, 2009; Nellor, 1987; Monaldi, 2001; Engel and Fischer, 2010), wouldtend to lower resource sector FDI shares compared to those predicted by our modelamong relatively high-risk countries. With these additional factors in mind, we viewour model as one that is able to explain the average deviations between the predictedforeign investment shares in the standard model from foreign investment patterns weobserve, but which is nevertheless an incomplete account of foreign investment.
Comparing the average predicted expropriation probabilities and the frequency ofexpropriation across categories of country risk, we find that the qualitative predictions
29
of the model are also broadly consistent with the data. Only 8% of countries in ourpredicted sample of relatively low risk countries have actually expropriated during theperiod under examination, while approximately 40% of countries in the medium andhigh risk countries are expropriators. (Dividing these averages by the 16 years of ob-servations provides a rough estimate of the empirical probability of expropriation in agiven year, though quantitatively we would expect these estimates to be imprecise dueto the small sample size.) The government stability index, in the context of our model,provides additional insight into the determinants of expropriation risk across countries.Specifically, our model predicts a monotonic, decreasing relationship between govern-ment stability and the probability of expropriation.
A final empirical prediction of the model deserving mention is between the resourceoutput price and the timing of expropriation. This positive relationship is driven by theexpropriation strategies of governments in moderate risk countries. When expropria-tion does occur, the resource output price tends to be above average. For the highestrisk group, there is no relationship between expropriation and the resource output pricebecause expropriation always occurs in a low penalty regime.
7. ConclusionsBy focusing on government choice of mineral contract in the context of a small, two-sector open economy where FDI is risky and the future costs and benefits of expropriat-ing are unknown, this paper provides a rationale for relatively high extractive industryFDI shares in countries most likely to expropriate. Specifically, the predictions of theincomplete markets model of FDI and expropriation considered in this paper recon-cile a number of stylized facts. These are (i) a high global share of resource sectorFDI in total expropriation compared to the sector’s average production share; (ii) apositive relationship between mineral output prices and the timing of resource-sectorexpropriation; and (iii) an average share of primaries in total FDI that is higher in ex-propriating countries compared to non-expropriating countries, particularly in miningand petroleum, even though on average these country groups do not differ significantlyin terms of sector production shares. The first two facts are well-documented in theliterature, and have been used to support and/or motivate explanations for why FDI inextractive sectors is more vulnerable to expropriation. The third fact presents some-what of a puzzle if expropriating countries are perceived by foreign investors as morelikely to expropriate, and if resource-based FDI is particularly risky. We argue that thecapacity (and incentive) for governments to offer mineral rights to foreign investorscheaply in countries characterized by a high degree political risk can help explain thispuzzle.
Exogenous political risk is captured by the difference in the expropriation penaltiesbetween high-penalty and low-penalty regimes, where expropriation in the low penaltyregime is very tempting for a relatively high risk country but still costly in a relativelylow risk country.29 We find that countries in the highest risk category benefit from pro-
29As discussed in section 2.1, it is immaterial whether we view the temptation to expropriate as being re-
30
moting FDI in the resource sector (and by lowering the cost of mineral rights) because,although this raises the likelihood that a future government will choose to expropriateand lowers FDI in the non-resource sector, the expected value of expropriated assetsmore than compensates for this loss. Governments in low and moderate risk countriesinstead aim to minimize the probability of expropriation for given levels of aggregateFDI. For the lower risk countries, this is accomplished by restricting resource-sectorFDI because higher-than-average prices result in “windfall profits,” and the temptationfor a low penalty regime to expropriate in these states. In contrast, governments ofmoderate risk countries manage risk by concentrating FDI in resources – in the lowpenalty regime, when the government is most tempted to expropriate, resource sectorfirms earn below-average returns on their investments (conditional on not being ex-propriated), and the government is less likely to expropriate as FDI is concentrated inresources. These patterns are robust to alternative types of resource contract (such as astandard royalty payment) provided investment levels are also specified and contractsare incomplete.
These predictions for government policy towards resource-based FDI imply a pos-itive average relationship between resource FDI shares and the probability of expropri-ation among countries of similar resource wealth and domestic capital stocks.30 Thisrelative concentration of FDI in resources among countries most likely to expropriateimplies that the total share of resource-based FDI in total assets expropriated globallywill be higher than the average share of this sector in GDP. Quantitatively, the theoryalso helps to explain deviations in observed country sector FDI patterns from thosepredicted by a standard, competitive two-sector model.
Finally, the findings suggest that countries that have a poor record of expropria-tion, such as Bolivia, Ecuador, and Venezuela, may find that promoting relatively largeamounts of FDI in resources is desirable and, for as long as default risk in these coun-tries remains high, this suggests that a cycle of privatization and nationalization willpersist. Moreover, because this implies that mineral rights should be offered to foreigninvestors on very favorable terms, this paper offers a novel perspective for the low gov-ernment take in resources that has been documented in many countries. That foreigninvestors must be compensated for political risk if they are willing to invest is evident.However, this paper emphasizes that (i) subsidies to foreign investment will be most ef-fective in resource sectors, where governments manage a key factor input and influenceinvestment, and (ii) this policy is not likely to produce desirable results for countries atall levels of default risk. In particular, very high risk countries are expected to benefitfrom subsidizing resource FDI, while countries characterized by relatively low defaultrisk do not. Governments of relatively low risk countries have a stronger incentive tominimize the ex ante risk of expropriating by restricting FDI in the resource sector ifthey anticipate the costs of expropriating will be high ex post.
lated to government regime characteristics or some other state of nature, such as the size of external sanctionsimposed.
30This relationship is predicted “on average” because there are multiple equilibria for some risk levels.Moreover, because it is not monotonic, it depends to some extent on how countries are distributed accordingto political risk.
31
8. ReferencesAlbuquerque, R., 2003. The composition of international capital flows: Risk sharing
through foreign direct investment. Journal of International Economics 61, 353–383.
Alfaro, L., Kalemli-Ozcan, S., Volosovych, V., 2008. Why Doesn’t Capital Flow fromRich to Poor Countries? An Empirical Investigation. The Review of Economics andStatistics 90 (2), 347–368.
Chang, R., Hevia, C., Loayza, N., 2010. Privatization and nationalization cycles. NBERworking paper 16126.
Cole, H. L., Dow, J., English, W. B., 1995. Default, settlement, and signalling: Lend-ing resumption in a reputational model of sovereign debt. International EconomicReview 36 (2), 365–385.
Cole, H. L., English, W. B., 1991. Expropriation and direct investment. Journal ofInternational Economics 30 (3-4), 201–227.
Duncan, R., 2005. Price or politics? an investigation of the causes of expropriation.Australian Journal of Agricultural and Resource Economics 50 (1), 85–101.
Eaton, J., Gersovitz, M., 1984. A theory of expropriation and deviations from perfectcapital mobility. The Economic Journal 94, 16–40.
Engel, E., Fischer, R. D., 2010. The Natural Resources Trap: Private Investment with-out Public Commitment. MIT Press, Cambridge, MA, Ch. Optimal Resource Ex-traction Contracts under Threat of Expropriation, pp. 161–196.
Gadano, N., 2010. The Natural Resources Trap: Private Investment without PublicCommitment. MIT Press, Cambridge, MA, Ch. Urgency and Betrayal: Three At-tempts to Foster Private Investment in Argentina’s Oil Industry, pp. 369–404.
Geiger, L. T., 1989. Expropriation and External Capital Flows. Economic Developmentand Cultural Change 37 (3), 535–556.
Guriev, S., Kolotilin, A., Sonin, K., June 2009. Determinants of Nationalization in theOil Sector: A Theory and Evidence from Panel Data. Journal of Law, Economics,and Organization, 1–23.
Hajzler, C., 2012. Expropriation of Foreign Direct Investments: Sectoral Patterns from1993 to 2006. Review of World Economics/Weltwirtschaftliches Archiv. 148 (1),119–149.
Hogan, W., Sturzenegger, F., Tai, L., 2010. The Natural Resources Trap: Private In-vestment without Public Commitment. MIT Press, Cambridge, MA, Ch. Contractsand Investment in Natural Resources, pp. 1–44.
IMF Capital Markets Consultative Group, 2003. Foreign Direct Investment in Emerg-ing Market Countries. International Monetary Fund, Washington, D.C.
32
Jensen, N., 2006. Nation-States and the Multinational Corporation: A Political Econ-omy of Foreign Direct Investment. Princeton University Press, New Jersey.
Johnston, D., 2007. Escaping the resource curse. Columbia University Press, Ch. Howto evaluate the fiscal terms of oil contracts, pp. 53–88.
Jones Jr, R. J., 1993. Multinational Corporations and Expropriation Risk. MultinationalBusiness Review 1 (1), 44–55.
Kobrin, S. J., 1980. Foreign Enterprise and Forced Divestment in LDCs. InternationalOrganization 34 (1), 65–88.
Kobrin, S. J., 1984. Expropriation as an Attempt to Control Foreign Firms in LDCs:Trends from 1960 to 1979. International Studies Quarterly 28 (3), 329–348.
Minor, M. S., 1994. The Demise of Expropriation as an Instrument of LDC Policy,1980-1992. Journal of International Business Studies 25 (1), 177–188.
Monaldi, F., 2001. Sunk-costs, Institutions, and Commitment: Foreign Investment inthe Venezuelan Oil Industry. Unpublished manuscript, Stanford University, Depart-ment of Political Science.
Nellor, D. C., 1987. Sovereignty and Natural Resource Taxation in Developing Coun-tries. Economic Development and Cultural Change 35 (2), 367–392.
Shafer, M., 2009. Capturing the Mineral Multinationals: Advantage or Disadvantage?International Organization 37 (01), 93–119.
Thomas, J., Worrall, T., 1994. Foreign direct Investment and the Risk of Expropriation.The Review of Economic Studies 61 (1), 81–108.
Tomz, M., Wright, M., 2010. The Natural Resources Trap: Private Investment withoutPublic Commitment. MIT Press, Cambridge, MA, Ch. Sovereign Theft: Theory andEvidence about Sovereign Default and Expropriation, pp. 69–110.
Truitt, F. J., 1970. Expropriation of Foreign Investment: Summary of the Post WorldWar II Experience of American and British Investors in the Less Developed Coun-tries. Journal of International Business Studies 1 (2), 21–34.
Valentinyi, A. V., Herrendorf, B., 2008. Measuring factor income shares at the sectorallevel. Review of Economic Dynamics 11, 820–835.
Wei, S. J., 2000. How taxing is corruption on international investors? Review of Eco-nomics and Statistics 82 (1), 1–11.
33
AppendicesA. Mathematical Appendix
A.A. Proof of Proposition 3.1The proof proceeds by describing the optimal investment and resource contract deci-sions when the no-expropriation binds (π(θ) = 0) and when this constraint is violated(π(θ) = πl) . These cases are shown to correspond to two distinct regions of countryrisk, defined over values of al, and the implied relationship between country risk andthe (expected) share of FDI located in the resource sector is considered in Lemma 3.2.
NE Binds and π(θ) = 0: Consider first the case where NE binds, and assume KXf >
0 and Lf > 0. From the no-expropriation constraint, kX(θ) =KXf
Lf=
al/(1+r)−KRf
Lf.
Similarly, the resource constraint for domestic capital implies kX(θ) = KXh
Lh= K−KRh
Lh.
Together, these conditions imply
kX(θ) =al
1+r +K −KRf −KRh
L
Substituting into expression (8) and setting E[p] = p0, homogeneity of F (·) impliesthat we can express the host country decision over resource contracts as
maxKRf ,KRh,Mf
V =F
(al
1 + r+K −KRf −KRh, L
)+ p0G(KRh,M −Mf )
+ p0G(KRf ,Mf )− al
V is strictly concave in each of the arguments, and the solution satisfies
FK(kX .1) = p0GK(kRh, 1)
FK(kX .1) = p0GK(kRf , 1)
GM (kRf .1) = GM (kRh, 1).
The first two conditions imply kRh = kRf = kR. The last condition is thereforeredundant, and Mf is not uniquely determined.
If instead KXf = Lf = 0, kX = kXh does not depend on optimal foreign invest-ment, and the decision over resource contracts is instead:
maxKRh,Mf
V =F (K −KRh, L) + p0G(KRh,M −Mf ) + p0G
(al
1 + r,Mf
)− al
and the solution satisfiesFK(kX , 1) = p0GK(kRh, 1) andGM (kRf , 1) = GM (kRh, 1),again implying kRh = kRf = kR.
34
In both cases, host country income can be expressed as
VNE = F (kX , 1)L+ p0G(kR, 1)M − al.
The marginal conditions indicate that aggregate investment and total sector specificfactors of production, which are equal in both cases, are allocated in the same propor-tions, resulting in identical values of kX and kR. Therefore the maximized values ofV are also equal and KXf = Lf = 0 is merely a special case of the general problemKXf , Lf ≥ 0. It follows thatMf and Lf are not uniquely determined, and equilibriumkR and kX satisfy
kXL+ kRM =al
1 + r+K = FDI +K
andFK(kX .1) = p0GK(kRh, 1).
NE Does Not Bind and π(θ) = πl: Now consider the case where NE is violated, andassume KXf , Lf > 0. Foreign and domestic investors optimally choose KXj and Ljto satisfy FK(kXj , 1) = (1 + r)/(1− πl), and the corresponding capital to labor ratioin this sector kcX < kFBX is determined by r and πl. The distribution of labor betweendomestic and foreign firms, in turn, depends on kcX and the resource contracts:
Lh =KXh
kcX=K −KRh
kcX, Lf = L− KXh
kcX=kcXL+KRh −K
kcX.
Using kXh = kXf = kcX and the resource constraints, the host country decision overresource contracts can be expressed as
maxKRf ,KRh,Mf
V =(F (kcX , 1)− (1 + r)kcX
)L+ p0G(KRh,M −Mf )
+ p0G(KRf ,Mf ) + (1 + r)(K −KRh −KRf )− πlal
The optimal contracts satisfy p0GK(kRh, 1) = p0GK(kRf , 1) = 1 + r which implieskRh = kRf = kFBR . The additional optimality condition GM (kRf .1) = GM (kRh, 1)is therefore redundant, and Mf is not uniquely determined.
If instead KXf = Lf = 0, kX = kXh, kX is determined by the resource contract,and the government problem is
maxKRf ,KRh,Mf
V =F (K −KRh, L) + p0G(KRh,M −Mf ) + p0G (KRf ,Mf )
− (1 + r)KRf − πlal.
The solution satisfies FK(kX .1) = p0GK(kRh, 1) and GM (kRf .1) = GM (kRh, 1),again implying kRh = kRf = kR. Finally, p0GK(kRf .1) = 1+r, implyingFK(kX .1) =1 + r. Therefore kX = kFBX and kR = kFBR , and optimal Mf is unique: Mf =minM,M − (K − kFBX L)/kFBR .
35
In both cases, expected host country income can be expressed as
Vπl=(F (kX , 1)− (1 + r)kX
)L+
(p0G(kR, 1)− (1 + r)kR
)M + (1 + r)K−πlal.
Note F (kX , 1)− (1+r)kX and p0G(kR, 1)− (1+r)kR are increasing for kX ≤ kFBXand kR ≤ kFBR . Because kcX < kFBX , maximum expected host-country income corre-sponds to KXf = Lf = 0 as long as domestic capital K exceeds kcXL. Below thisthreshold, restricting Lf = 0 results in sub-optimally low investment in the manufac-turing sector and the optimal contract instead results in positive foreign investment inthis sector with kX(θ) = kcX .
Two Regions of Country Risk: [0, a′) & [a′, a): Consider al = a − εa for εa ≈ 0.Then there exist εx and εr satisfying al = (1+ r)(kFBX L− εxL+kFBR M − εrM −K)such that
Vε =F(kFBX − εx, 1
)L+ p0G
(kFBR − εr, 1
)M
− (1 + r)((kFBX − εx)L+ (kFBR − εr)M −K
)>F
(kFBX , 1
)L+ p0G
(kFBR , 1
)M − (1 + r)
(kFBX L+ kFBR M −K
)− πlal
=Vπl
where Vπlis the income attainable when (NE) is violated. Therefore for sufficiently
high al, the optimal resource constraint satisfies (NE).Now consider some al < a and the corresponding optimal capital to labor ratios
kX and kR satisfying (NE) . Denote ∆kX = kFBX − kX , ∆kR = kFBR − kR, ∆X =
(F (kFBX , 1)− F (kX , 1))L and ∆R = p0(G(kFBR , 1)−G(kR, 1))M . Then
Vπl− VNE =∆X + ∆R+ (1− πl)al − a
=∆X + ∆R− (1 + r) (∆kXL+ ∆kRM)− πlal
Strict concavity of F (·) and G(·) implies that ∆X − ∆kXL and ∆R − ∆kRM arestrictly positive and decreasing over kX and kR for kX < kFBX and kR < kFBR . Thisimplies that, for penalties al below some threshold a′ > 0, Vπl
− VNE > 0.
A.B. Proof of Lemma 3.2When al ∈ [a′, a), (NE) binds, π(θ) = 0 and Mf is not uniquely determined. If K issufficiently large to cover optimal aggregate investment in either sector given kX andkR (K ≥ K∗ = maxkXL, kRM), the optimal range for Mf is [0,M ]. This impliesthat the share of FDI located in the resource sector, σR = kRMf/(kRMf + kXLf ),lies within the range [0.1]. We refer to the “average” resource FDI share as the midpointof this range: σR = 0.5. When al ∈ [0, a′), (NE) does not bind and π(θ) = πl. Inthis case Lf = 0 and therefore σR = σR = 1. Therefore σR is strictly greater foral ∈ [0, a′) compared to al ∈ [a′, a), conditional on K > K∗.
However, if al ∈ [a′, a) but K < kRM , the lower bound on Mf given kR and
36
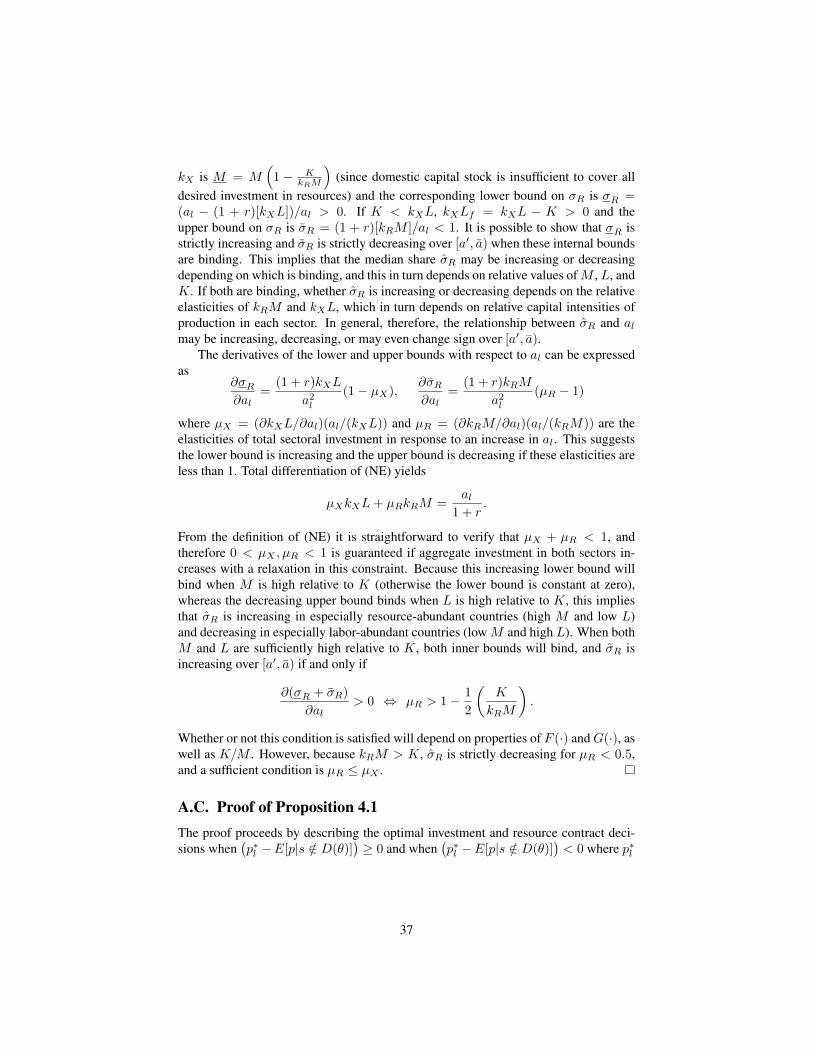
kX is M = M(
1− KkRM
)(since domestic capital stock is insufficient to cover all
desired investment in resources) and the corresponding lower bound on σR is σR =(al − (1 + r)[kXL])/al > 0. If K < kXL, kXLf = kXL − K > 0 and theupper bound on σR is σR = (1 + r)[kRM ]/al < 1. It is possible to show that σR isstrictly increasing and σR is strictly decreasing over [a′, a) when these internal boundsare binding. This implies that the median share σR may be increasing or decreasingdepending on which is binding, and this in turn depends on relative values ofM , L, andK. If both are binding, whether σR is increasing or decreasing depends on the relativeelasticities of kRM and kXL, which in turn depends on relative capital intensities ofproduction in each sector. In general, therefore, the relationship between σR and almay be increasing, decreasing, or may even change sign over [a′, a).
The derivatives of the lower and upper bounds with respect to al can be expressedas
∂σR∂al
=(1 + r)kXL
a2l
(1− µX),∂σR∂al
=(1 + r)kRM
a2l
(µR − 1)
where µX = (∂kXL/∂al)(al/(kXL)) and µR = (∂kRM/∂al)(al/(kRM)) are theelasticities of total sectoral investment in response to an increase in al. This suggeststhe lower bound is increasing and the upper bound is decreasing if these elasticities areless than 1. Total differentiation of (NE) yields
µXkXL+ µRkRM =al
1 + r.
From the definition of (NE) it is straightforward to verify that µX + µR < 1, andtherefore 0 < µX , µR < 1 is guaranteed if aggregate investment in both sectors in-creases with a relaxation in this constraint. Because this increasing lower bound willbind when M is high relative to K (otherwise the lower bound is constant at zero),whereas the decreasing upper bound binds when L is high relative to K, this impliesthat σR is increasing in especially resource-abundant countries (high M and low L)and decreasing in especially labor-abundant countries (low M and high L). When bothM and L are sufficiently high relative to K, both inner bounds will bind, and σR isincreasing over [a′, a) if and only if
∂(σR + σR)
∂al> 0 ⇔ µR > 1− 1
2
(K
kRM
).
Whether or not this condition is satisfied will depend on properties of F (·) andG(·), aswell as K/M . However, because kRM > K, σR is strictly decreasing for µR < 0.5,and a sufficient condition is µR ≤ µX .
A.C. Proof of Proposition 4.1The proof proceeds by describing the optimal investment and resource contract deci-sions when
(p∗l −E[p|s /∈ D(θ)]
)≥ 0 and when
(p∗l −E[p|s /∈ D(θ)]
)< 0 where p∗l
37
is implicitly defined by
(1− π(θ))(p∗l − E[p|s /∈ D(θ)]
)G(KRf ,Mf ) + (1 + r)(KXf +KRf )
− (1− π(θ))al = 0 (14)
in conjunction with the definition of π(θ) = π(p∗l , p) in equation (11). We show that(1− π(θ))
(p∗l − E[p|s /∈ D(θ)]
)is strictly increasing in p∗l and that (14) implies that
p∗l is strictly decreasing in al for p∗l ∈ (p, p), and therefore(p∗l −E[p|s /∈ D(θ)]
)≥ 0
and(p∗l − E[p|s /∈ D(θ)]
)< 0 correspond to two categories of country risk, al ≥ a′′
and al < a′′. Properties of equilibrium in each case are then discussed, assuming con-ditions for uniqueness are satisfied. It follows from Proposition 3.1 that, for sufficientlylow al, the equilibrium is as described in 3.1.1 but where p0 = E[p]. The thresholdlevel of country risk a′ below which this describes the equilibrium, however, does notnecessarily exceed a′′. This implies that it is possible for there to be only be two rel-evant categories of country risk,
(p∗l − E[p|s /∈ D(θ)]
)≥ 0 and p∗l = p. However,
provided that a′′ > a′, then(p∗l −E[p|s /∈ D(θ)]
)< 0 corresponds to a third, interme-
diate risk category. Whether there are two or three relevant categories of country risk,the share of resource FDI is increasing in country risk (and strictly increasing betweenbetween risk categories). Finally, sufficient conditions for uniqueness of equilibrium ateach level of country risk are established.
At the Optimal Contract, p∗l is Strictly Decreasing in al if KRf ,Mf > 0: Considerthe case where KRf > 0 and Mf > 0, implying that kX(θ) is implicitly defined by(1−π(θ))FK(kX , 1) = 1+r and foreign and domestic firms employ identical capital tolabor ratios.31 Aggregate manufacturing sector production is F (KXf +K −KRh, L),manufacturing FDI is
KXf (θ) = Γ(θ)− (K −KRh)
where Γ(θ) = F−1K
(1+r
1−π(θ)
). The government problem can be expressed as
maxKRf ,KRh,Mf
V =F(Γ(θ), L
)+ E[p]
(G(KRh,M −Mf ) +G (KRf ,Mf )
)− (1 + r)
(KRf + Γ(θ)− (K −KRh)
)− π(θ)al.
subject to the usual non-negativity/resource constraints, (14) and (11). Assume forthe moment an interior solution for both optimal KRf and KRh. Taking into accountthe effects of the choice of resource contracts on p∗l , π(θ) and KXf (θ), the first-order
31When KRf = 0, either π(θ) = 0 or π(θ) = πl and (NE) does not bind, and the equilibrium is asdescribed in Proposition 3.1.
38
conditions for the government problem are
∂V
∂KRf= E[p]GK(kRf , 1)− (1 + r)−ΨKRf = 0 (15)
∂V
∂KRh= E[p]GK(kRh, 1)− (1 + r)−ΨKRh = 0 (16)
∂V
∂Mf= E[p]
(GM (kRf , 1)−GM (kRh, 1)
)−ΨMf + (λ0 − λ1) = 0 (17)
where
ΨX =
(∂π(θ)
∂p∗l
∂p∗l∂X
)(al −
(FK(Γ(θ), L)− (1 + r)
)Γπ)
and where Γπ = ∂Γ(θ)/∂π < 0. λ0 ≥ 0 and λ1 ≥ 0 are the multipliers on constraintsMf ≥ M and Mf ≤ M respectively, where M = max0,M − K/kRh and M =max0,M − (K − kXL)/kRf. (These upper and lower bounds on Mf are definedby Proposition 3.1. For simplicity, we ignore cary out the analysis taking these boundsas given, and ignore any effect of government decision over KRf and KRh on V asa result of the potential effect on these bounds.) Complementary slackness impliesλ0(Mf −M) = 0 and λ1(M −Mf ) = 0. From (11), ∂π(θ)/∂p∗l = −πlz(p∗l ) < 0(given the assumption p∗h = p). Implicitly differentiating (14), we obtain the partialderivative of p∗l with respect to each choice variable:
∂p∗l∂KRf
= −(1− π(θ))
(p∗l − E[p|s /∈ D]
)GK(kRf , 1) + (1 + r)
Ω,
∂p∗l∂KRh
= − (1 + r)
Ω,
∂p∗l∂Mf
= −(1− π(θ))
(p∗l − E[p|s /∈ D]
)GM (kRf , 1)
Ω,
whereΩ = (1− π(θ))G(KRf ,Mf )− πlz(p∗l )
(al + (1 + r)Γπ
)is the slope of (14) with respect to p∗l , given that
∂
∂p∗l(1− π(θ))(p∗l − E[p|s /∈ D]) = 1− π(θ).
In the neighborhood of an equilibrium solution Ω > 0, implying that p∗l decreases,and hence π(θ) increases, as manufacturing sector FDI increases. This implies that∂p∗l /∂KRh < 0, since KXf is increasing in KRh given aggregate investment. Intu-itively, at the equilibrium level of manufacturing FDI, additional foreign investment inthis sector must raise the benefit of expropriation relative to the cost. (This condition isautomatically satisfied if, for instance, FK(KX , L)KX is strictly increasing.) HenceΨKRh > 0. We can also verify that ∂p∗l /∂KRf < 0 in equilibrium. To see why, con-sider a capital to labor ratio kRf < kFBR in the neighborhood of the foreign firm’s profitmaximizing level, such that 1 + r ≈ (1 − π(θ))E[p|s /∈ D]GK(kRf , 1). Evidently,
39
∂p∗l /∂KRf is strictly negative, approximately equaling:
−p∗l (1− π(θ))GK(kRf , 1)
Ω< 0
and only for kRf sufficiently below this ratio would there be a reversal in sign. How-ever, given that kX ≤ kFBX ,
Φ = −(∂π(θ)
∂p∗l
)(al −
(FK(Γ(θ), L)− (1 + r)
)Γπ
)> 0.
Therefore ∂p∗l /∂KRf > 0 would imply that ΨKRf = −(∂p∗l /∂KRf )Φ/Ω < 0, andcondition (15) in turn implies kRf > kFBR , a contradiction. Hence ∂p∗l /∂KRf < 0and ΨKRf > 0.
That (14) is strictly increasing in p∗l implies that p∗l is increasing and π(θ) is de-creasing in al.
Three Categories of Country Risk: The first order conditions also imply that eitherMf = M or Mf = M (λ0 > 0 or λ1 > 0). To see this, note that
∂p∗l∂Mf
=GM (kRf , 1)
GK(kRf , 1)
[∂p∗l∂KRf
− ∂p∗l∂KRh
].
Moreover, the conditions (15)-(16) imply
∂p∗l∂KRf
− ∂p∗l∂KRh
=
(∂π(θ)
∂p∗l
(al −
(FK(Γ(θ), L)− (1 + r)
)Γπ
))−1
×(GK(kRf , 1)−GK(kRh, 1)
).
Substituting these expressions for ∂p∗l /∂Mf in (17) and simplifying yields
GK(kRh, 1)
GK(kRf , 1)− GM (kRh, 1)
GM (kRf , 1)=
λ1 − λ0
GM (kRf , 1).
This equation implies that if kRh ≥ kRf then λ1 − λ0 < 0 and hence λ0 > 0 andMf = M . If kRh < kRf then Mf = M . Whether kRh > kRf depends on p∗l .Specifically, ΨKRf > 0 and ΨKRh > 0 are strictly decreasing in ∂p∗l /∂KRf and∂p∗l /∂KRh. Given (1 − π(θ))(p∗l − E[p|s /∈ D]) is strictly increasing in p∗l and non-negative if and only if p∗l ≥ E[p|s /∈ D],
p∗l ≥ E[p|s /∈ D] ⇔ ΨKRf ≥ ΨKRh ⇔ kRf ≤ kRh.
This implies that Mf = M when p∗l ≥ E[p|s /∈ D] and Mf = M when p∗l < E[p|s /∈D], conditional on optimal p∗l > p. Because p∗l is strictly decreasing in al over therange (p, p), these two scenarios correspond to two categories of country risk, wherea0l ∈ AU and a1
l ∈ AM implies a0l > a1
l .Note that if either M = 0 or M = M then KRf = 0 or KRh = 0. For the
40
former case, p∗l is no longer implicitly defined by (14), and instead the equilibriumis described by the previously considered case with no-price uncertainty when (NE)binds, but where KRf = Mf = 0. (In this case expropriation never occurs.) WhenKRf > 0, however, p∗l satisfies (14) and expropriation occurs whenever a = al andp > p∗l . Therefore when al ∈ AM and Mf = M , expropriation occurs with positiveprobability. For sufficiently low al, it is optimal to expropriate for any resource outputprice p and equilibrium is described by 3.1.1, providing a third category of country risksuch that a0
l ∈ AL and a1l ∈ AM implies a1
l > a0l . This will be true at a penalty
level a∗l above that for which p∗l = p satisfies equation (14). Therefore it is possi-ble that AM is empty, where supAL = inf AU . Otherwise, supAL = inf AM andsupAM = inf AU .
Sufficient Conditions for a Unique Solution to the Government Problem: We nowdescribe sufficient conditions under which the first order conditions correspond to aunique solution. Specifically, sufficient conditions for strict concavity of V are de-rived. These sufficient conditions for a unique solution are not necessary conditions,and a unique solution may still exist when they are violated. However, second ordernecessary conditions are not reducible to expressions that are easy to interpret, and wetherefore consider sufficient conditions instead.
V is strictly concave in KRf if (15) is strictly decreasing in KRf . It is convenientto rewrite (15) as
χGK(kRf , 1)− (1 + r)
(1 +
Φ
Ω
)= 0
where
χ =
(E[p]−
(Φ
Ω
)(1− π(θ))
(p∗l − E[p|s /∈ D]
)).
The derivative of (15) with respect to KRf . ∂2V/∂K2Rf , is
χGKK(KRf ,Mf )− 2
(∂p∗l∂KRf
· Φ
Ω
)(1− π(θ))GK(kRf , 1)−
(∂p∗l∂KRf
)2(Φ
Ω
)×
×(πlz(p
∗l )G(KRf ,Mf )− πlzp(p∗l )
(al + (1 + r)Γπ
)+ (πlz(p
∗l ))
2(1 + r)Γππ
−Ωzp(p
∗l )
z(p∗l )
)+ (πlz(p
∗l ))
2
(∂p∗l∂KRf
)2 (FK(Γ(θ), L)− (1 + r)
)Γππ
+ (πlz(p∗l ))
2
(∂p∗l∂KRf
)2
FKK(Γ(θ))(Γπ)2 (18)
whereGKK(KRf ,Mf ) = ∂2G(KRf ,Mf )/∂K2Rf , Γππ = ∂2Γ(θ)/∂π2 and zp(p∗l ) =
∂z(p∗l )/∂p∗l . Given Γπ < 0 and Γππ > 0, the above expression is negative if pro-
vided πlz(p∗l ) = −∂π(θ)/∂p∗l is not too large and Γ(θ) is not too small. To see
why, first observe that provided πlz(p∗l ) is not too large, χ > 0. For kRf ≤ kFBRf ,
41
E[p] ≥ (1 + r)/GK(kRf , 1), χ is bounded below by
1 + r
GK(kRf , 1)−(
Φ
Ω
)(1− π(θ))
(p∗l − E[p|s /∈ D]
).
Using the derived expression for ∂p∗l /∂KRf , it is straightforward to verify that thisexpression is strictly positive if
∂p∗l∂KRf
> −(1 + r)
(1 +
Ω
Φ
)(19)
whereΩ
Φ=
(1− π(θ))G(KRf ,Mf )− πlz(p∗l )(al + (1 + r)Γπ
)πlz(p∗l )
(al −
(FK(Γ(θ), L)− (1 + r)
)Γπ
) .
Because al −(FK(Γ(θ), L) − (1 + r)
)Γπ ≥ 0 and (1 − π(θ))G(KRf ,Mf ) < 0,
Ω/Φ is strictly decreasing in πlz(p∗l ), and therefore for the lower πlz(p∗l ) the morelikely (A.C) is satisfied. Evidently, as πlz(p∗l ) becomes small, Φ/Ω is also reduced andχGKK(KRf ,Mf ) < 0 in (18) must eventually dominate the sum of the remainingterms in this expression rendering the entire expression negative. However, even whereπlz(p
∗l ) exceeds this threshold level, a sufficient condition for (18) to be negative is
− πlz(p∗l )∂p∗l∂KRf
((1− (1− π(θ))zp(p
∗l )
πlz(p∗l )2
)G(KRf ,Mf ) + (πlz(p
∗l ))(1 + r)Γππ
)−(
Ω
Φ
)(πlz(p
∗l ))
2((Fk(Γ(θ))− (1 + r)
)Γππ + FKK(Γ(θ))(Γπ)2
)> 2(1− π(θ))GK(kRf , 1)
When zp(p∗l ) ≈ 0 and πlz(p∗l )Γππ ≈ 0, this condition is satisfied if
∂p∗l∂KRf
< −2(1− π(θ))GK(kRf , 1)
πlz(p∗l )G(KRf ,Mf ).
The derivative of (16) with respect to KRh, ∂2V/∂K2Rh, is
E[p]GKK(KRh,Mf )−(
∂p∗l∂KRh
)2(Φ
Ω
)×(πlz(p
∗l )G(KRf ,Mf )
− πlzp(p∗l )(al + (1 + r)Γπ
)+ (πlz(p
∗l ))
2(1 + r)Γππ − Ωzp(p
∗l )
z(p∗l )
)+ (πlz(p
∗l ))
2
(∂p∗l∂KRh
)2 ((FK(Γ(θ), L)− (1 + r)
)Γππ + FKK(Γ(θ))(Γπ)2
).
(20)
Because the first term in this expression is negative for all parameter values, for suf-ficiently low value of πlz(p∗l ) this expression is negative. Moreover, even where
42
πlz(p∗l ) exceeds this threshold level, it is straightforward to verify that zp(p∗l ) ≈ 0
and πlz(p∗l )Γππ ≈ 0 are also sufficient to ensure this expression is negative.
Finally, the derivative of (17) with respect to Mf . ∂2V/∂M2f , is
χGMM (KRf ,Mf ) + E[p]GMM (KRh,M −Mf )
− 2
(∂p∗l∂Mf
· Φ
Ω
)(1− π(θ))GM (kRf , 1)−
(∂p∗l∂Mf
)2(Φ
Ω
)×
×(πlz(p
∗l )G(KRf ,Mf )− πlzp(p∗l )
(al + (1 + r)Γπ
)+(πlz(p
∗l ))
2(1 + r)Γππ − Ωzp(p
∗l )
z(p∗l )
)+ (πlz(p
∗l ))
2
(∂p∗l∂Mf
)2 ((FK(Γ(θ), L)− (1 + r)
)Γππ + FKK(Γ(θ))(Γπ)2
).
(21)
Sufficient conditions for this expression to be negative are analogous to the conditionsderived for (18) < 0; note however that the conditions for (21) < 0 are not as strictgiven that the second term, E[p]GMM (KRh,M − Mf ), is strictly negative for allparameter values.
A.D. Proof of Lemma 5.1Equilibrium Properties of a General Class of Payment Schedules: Host-countryincome V (θ) is given by (8) for any resource contract corresponding to a paymentscheduleC(KRf ,Mf , p) satisfying (12), as in the case of the specific resource contractconsidered in Section 4, and p∗l is implicitly defined by (10) (for p∗l ∈ (p.p)) and π(θ) isdefined by (11). This implies that the first-order necessary conditions corresponding tothe government problem are identical to (15)-(17) of Proposition 4.1, given ∂p∗l /∂X ,X = KRf ,KRh,Mf. However, the general expression for (10) is given by (13),which produces the following expressions for ∂p∗l /∂X:
∂p∗l∂KRf
= −(1− π(θ))
(p∗lGK(kRf , 1)− CK(KRf ,Mf , p
∗l ))
Ω,
∂p∗l∂KRh
= − (1 + r)
Ω,
∂p∗l∂Mf
= −(1− π(θ))
(p∗lGM (kRf , 1)− CM (KRf ,Mf , p
∗l ))
Ω,
where
Ω =(1− π(θ) + πlz(p
∗l ))G(KRf ,Mf )− πlz(p∗l )
(al + (1 + r)Γπ
)+ πlz(p
∗l )C(KRf ,Mf , p
∗l )− (1− π(θ))Cp(KRf ,Mf , p
∗l )
43
and where ∂p∗l /∂KRh < 0 implies Ω > 0.Suppose for the moment that the resource contract satisfies the requirement p∗l >
E[p|s /∈ D(θ)] if and only if
(1− π(θ))(p∗lGK(kRf , 1)− CK(KRf ,Mf , p
∗l ))> (1 + r)
in equilibrium. This would imply p∗l > E[p|s /∈ D(θ)] if and only if −∂p∗l /∂KRf >−∂p∗l /∂KRh, and given equilibrium conditions (15)-(16):
p∗l > E[p|s /∈ D(θ)] ⇔ kRf < kRh. (22)
Inspection of condition (17) reveals that kRf < kRh implies
(λ0 − λ1)−ΨMf > 0
where λ0 and λ1 are the multipliers on the lower and upper bounds of Mf , and where
ΨMf =
(∂π(θ)
∂p∗l
∂p∗l∂Mf
)(al −
(FK(Γ(θ), L)− (1 + r)
)Γπ)
= −Φ
Ω
∂p∗l∂Mf
,
with Φ > 0. Therefore if, in addition to (22), p∗l > E[p|s /∈ D(θ)] should imply∂p∗l /∂Mf ≤ 0 and p∗l < E[p|s /∈ D(θ)] should imply ∂p∗l /∂Mf ≥ 0 is also arequirement satisfied by payment scheduleC(KRf ,Mf , p), then λ0 > 0 andMf = Mwhenever p∗l > E[p|s /∈ D(θ)] and λ1 > 0 and Mf = M whenever p∗l < E[p|s /∈D(θ)]. This second requirement reduces to
p∗l > E[p|s /∈ D(θ)] ⇒ p∗lGM (kRf , 1)− CM (KRf ,Mf , p∗l ) ≥ 0 (23)
p∗l < E[p|s /∈ D(θ)] ⇒ p∗lGM (kRf , 1)− CM (KRf ,Mf , p∗l ) ≤ 0.
Taken together, these two requirements on the resource contract are sufficient to gen-erate the equilibrium relationships summarized by Proposition 4.1.
Equilibrium Properties of Mixed Ad Valorem Royalty and Per Concession Pay-ments: We demonstrate that a payment schedule based on either a percentage of thevalue of output or per unit of mineral concessions employed, or any mixture of each,satisfies the above sufficient condition, implying that these payment schedules producethe equilibrium relationships summarized in Proposition (3.1), when the equilibriumdescribed is unique. Consider the payment schedule
C(KRf ,Mf , p) = ρfpG(KRf ,Mf ) + τfMf
for any τf ≥ 0 and ρf ∈ [0, 1) that also satisfy the investors’ zero profit condition,given KRf and Mf :
(1− ρf )E[p|s /∈ D(θ)]G(KRf ,Mf )− τfMf −1 + r
1− π(θ)KRf = 0.
44
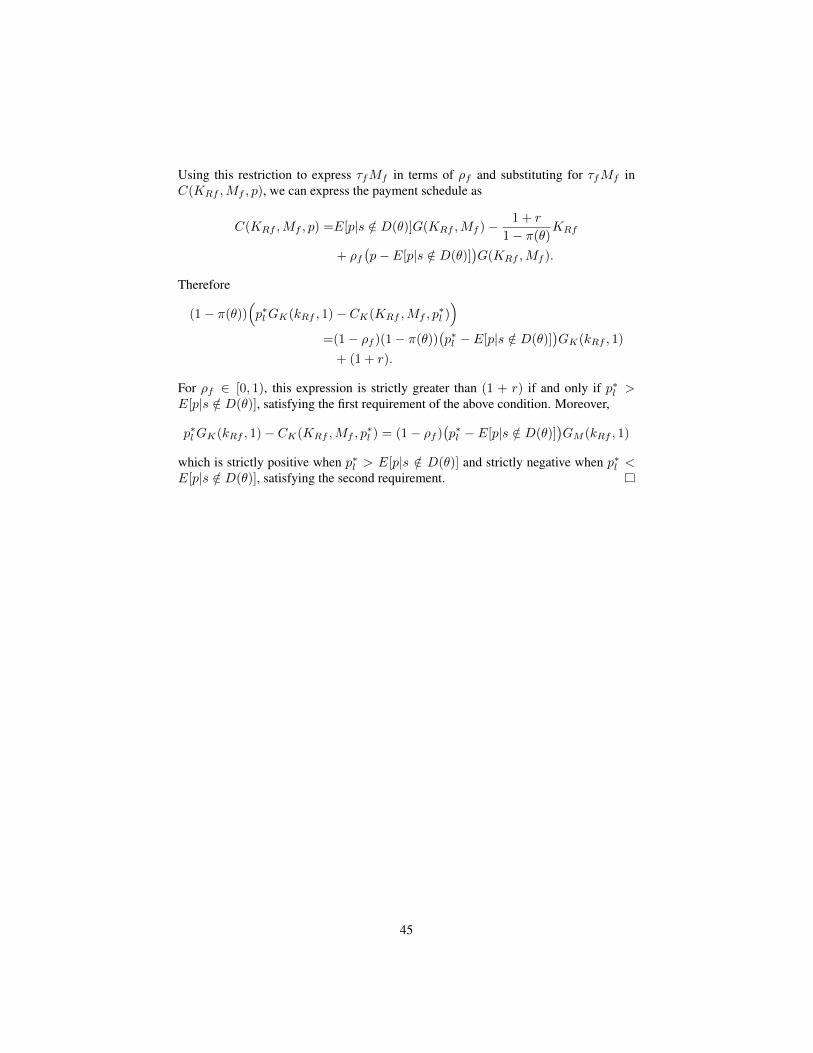
Using this restriction to express τfMf in terms of ρf and substituting for τfMf inC(KRf ,Mf , p), we can express the payment schedule as
C(KRf ,Mf , p) =E[p|s /∈ D(θ)]G(KRf ,Mf )− 1 + r
1− π(θ)KRf
+ ρf(p− E[p|s /∈ D(θ)]
)G(KRf ,Mf ).
Therefore
(1− π(θ))(p∗lGK(kRf , 1)− CK(KRf ,Mf , p
∗l ))
=(1− ρf )(1− π(θ))(p∗l − E[p|s /∈ D(θ)]
)GK(kRf , 1)
+ (1 + r).
For ρf ∈ [0, 1), this expression is strictly greater than (1 + r) if and only if p∗l >E[p|s /∈ D(θ)], satisfying the first requirement of the above condition. Moreover,
p∗lGK(kRf , 1)− CK(KRf ,Mf , p∗l ) = (1− ρf )
(p∗l − E[p|s /∈ D(θ)]
)GM (kRf , 1)
which is strictly positive when p∗l > E[p|s /∈ D(θ)] and strictly negative when p∗l <E[p|s /∈ D(θ)], satisfying the second requirement.
45