Embed Size (px)
Citation preview

Resource discoveries and FDI bonanzas:An illustration from Mozambique
Gerhard Toews†
Pierre-Louis Vezina‡
December 25, 2017
Abstract
We show that giant and unpredictable oil and gas discoveries indeveloping countries trigger FDI bonanzas. Across countries, wedocument a 58% increase in FDI in the 2 years following a giantdiscovery. This effect is driven by new projects in non-resource sectorssuch as manufacturing, retail, business services and construction. Weillustrate this mechanism using Mozambique’s recent post-discoveryFDI boom. We combine concurrent waves of household surveys andfirm censuses to estimate the local job multiplier of FDI projects. Ourestimates suggest that each FDI job results in 6.2 additional jobs, ofwhich 3.3 are informal. Our results thus link the offshore gas discoveryin Mozambique to widespread job creation via a diversified FDI boomand a large local multiplier.
JEL CODES: F21, F23, Q32, Q33Key Words: Natural resources, investment, local multiplier.
∗We are grateful to Fernando Aragon, Nicolas Berman, Markus Brueckner, Jim Cust,David Giles, Victoire Girard, Doug Gollin, Ricardo Hausmann, Beata Javorcik, GuyMichaels, Peter Neary, Rick van der Ploeg, Steven Poelhekke, Simon Quinn, Valerie Ramey,Michael Ross, Liugang Sheng, Brock Smith, Radek Stefanksi, Kevin Tsui, Tony Venables,Wessel Vermeulen and seminar participants at the OxCarre brown bag, the 2016 CSAEConference at Oxford, the 2016 NOVA Africa conference in Lisbon, at Paris Dauphine, atthe 2016 Resource and Governance workshop in Bergen, at Harvard Kennedy School, atthe 2017 IGC Workshop on Natural Resource Management and FDI in Maputo, at the2017 Royal Economic Society Meeting in Bristol, at the Legacy of Plenty 2017 workshopat King’s College London, at Dundee, at St-Andrews, at the 2017 International EconomicAssociation meeting in Mexico City, at the 2017 DEGIT XXII conference in Paris, at the2017 ETSG conference at EUI in Florence, and at the Paris School of Economics for manyconstructive comments. We also thank James Haynes, Jorrit Oppewal and Vincenzo Salvuccifor invaluable help with the data and the International Growth Centre for funding. Thispaper supersedes OxCarre Research Paper 177, “Resource discoveries and FDI bonanzas”.†Oxford Centre for the Analysis of Resource Rich Economies, Dept of Economics,
University of Oxford, OX1 3UQ, UK. Email: [email protected].‡Dept of Political Economy and Dept of International Development, King’s College
London, WC2R 2LS, UK. Email: [email protected].

1 INTRODUCTION
Natural resources are often thought of as a curse, slowing economic growth
in resource-rich developing countries (Sachs and Warner, 2001; van der
Ploeg, 2011; Ross, 2012; Venables, 2016). Resources have been found to
be associated with premature deindustrialization (Rodrik, 2016), a lack of
export diversification (Ross, 2017), lower foreign investment in non-resource
sectors (Poelhekke and van der Ploeg, 2013), and a deterioration of democratic
institutions (Tsui, 2011). It is a recent study by Arezki et al. (2017)
however that pointed out that discoveries themselves have short-run economic
consequences before windfalls start pouring in. This is because giant and
unexpected oil and gas discoveries may act as news shocks, driving the
business cycle.
In this paper we show that giant oil and gas discoveries in developing
countries trigger foreign direct investment (FDI) bonanzas in non-extraction
sectors, therefore highlighting an unexpected positive spillover from resource
discoveries. This result is in line with natural resource discoveries driving
investment cycles (Arezki et al., 2017), and with discovery countries, much
like boomtowns, being inundated with injections of capital in gold-rush fashion
(Jacobsen and Parker, 2014).1 We then illustrate this mechanism using
Mozambique’s recent experience, showing that an FDI bonanza followed a
giant offshore gas discovery and also that it created a large number of jobs,
notably via a local multiplier (Moretti, 2010). In so doing we also contribute
to the study of the local labor market effects of FDI (Atkin et al., 2015) and
1It’s also in line with recent evidence suggesting that resources can be associated withincreased service and manufacturing activity (Allcott and Keniston, 2014; James, 2015;Smith, 2014).
1

of large projects more generally (Aragon and Rud, 2013; Basker, 2005).
FDI has long been considered a key part of economic development by
economists and policymakers alike (Hirschman, 1957; De Mello Jr, 1997). It
has been found to be associated with growth takeoffs (Aizenman and Sushko,
2011), transfers of technology, skills, and higher wages (Javorcik, 2015), as
well as creating backward and forward linkages with local firms (Javorcik,
2004; Gorg and Strobl, 2001). Yet poor countries with weak institutions have
found it hard to attract FDI (Gourinchas and Jeanne, 2013; Alfaro et al.,
2008). Given the relevance of FDI for development and that resources are
often associated with a resource curse, we believe it is important to evaluate
how such discoveries affect FDI and in turn jobs in developing countries.
To examine the FDI response to natural resource discoveries we merge data
on giant oil and gas discoveries from Horn (2011) with a project-level FDI data
set compiled by fDiMarkets, part of the Financial Times Group. As the timing
of giant discoveries is unpredictable due to the uncertain nature of exploration
and as it precedes extraction by 5 years on average, it provides a plausibly
exogenous news shock (see Arezki et al. 2017) that allows us to identify the
causal effect of resource discoveries on FDI. In addition, the project-level
FDI database allows us to identify FDI flows which are unrelated to the
extraction of natural resources. This distinction is particularly important as
the development potential of FDI is mostly associated with quality FDI in
manufacturing and services rather than in extractive industries (Alfaro and
Charlton, 2013). We’re thus able to filter out the investment of oil and gas
companies directly related to the giant discovery and to decompose the FDI
effect into margins, i.e. the number of FDI projects, their average value, the
range of source countries and the number of targeted sectors. This allows us to
2

estimate the discovery effects on the amount of FDI and on its diversification.
We find that resource discoveries in developing countries cause FDI bonanzas.
Lower bound estimates suggest that in the 2 years following a large discovery,
non-extraction FDI inflows increase by 58%, the number of FDI projects
increases by 30%, the number of sectors targeted and of source countries
increase by around 19% and the number of jobs created increases by 54%.
What’s more, we find the effect to be stronger in poor countries with
weak governance. When we break down FDI by business activity and by
location, we find the strongest FDI effects in manufacturing, information and
communication technologies, and retail in the country’s largest city while in
the rest of the country the FDI effects are strongest in business services and
construction, as well as in electricity and extraction.
We then illustrate this mechanism using Mozambique’s recent experience.
The latter is a case in point as in late 2009, news of large natural gas discoveries
off its coast created much fanfare among economists and policymakers as it
became clear the country now had an incredible opportunity to grow out of
poverty. According to Arezki et al. (2017), Mozambique’s offshore natural
gas discoveries in the Rovuma basin since 2009 have been nothing short of
prolific, with a discounted net value around 50 times its GDP. While these
fields are still under development as of August 2017, fDiMarkets data suggests
that foreign firms moved in right after the first discovery in a multitude of
industries, creating around 10,000 jobs in the following 3 years, all across the
country. In 2014 alone it attracted $9 billion worth of FDI. A counterfactual
analysis suggests that none of this would have happened without the gas
discovery. Indeed, the number of jobs created by non-extraction FDI in a
synthetic control, a weighted average of FDI jobs in non-OECD countries
3

FIGURE 1The FDI effect of the Mozambique gas discovery
02
00
04
00
06
00
08
00
01
00
00
No
n−
extr
actio
n F
DI
job
s
2003 2005 2007 2009 2011 2013
MOZ synthetic MOZ
Note: The MOZ line is the estimated number of jobs created by FDI projects, as reportedby fDiMarkets. Synthetic MOZ is a synthetic counterfactual, i.e. a weighted average of FDIjobs in non-OECD countries with no discoveries that mimics Mozambique until its first largediscovery in 2009. See Abadie et al. (2010) for details on this method.
with no discoveries that mimics Mozambique before 2010, remains flat around
1,500 jobs per year (see Figure 1).
To gauge the direct as well as indirect job-creation effect of the Mozambique
FDI bonanza we link FDI projects from the fDiMarkets database (FT) as
well as data on firms from the 2002 and 2014 firm censuses (CEMPRE) to
household outcomes across districts, sectors, and periods using data from
two waves of Household Budget Surveys from 2002 to 2014. This allows us
to estimate FDI-job multipliers.2 Since FDI and employment vary across
these three dimensions we are able to estimate job multipliers using a triple
2Our matching of household survey data with FDI projects is akin to the methods usedby Atkin et al. (2015) and Basker (2005) to study the job effects of Walmart or those usedin studies of the local impact of resource extraction projects (see Cust and Poelhekke 2015).
4
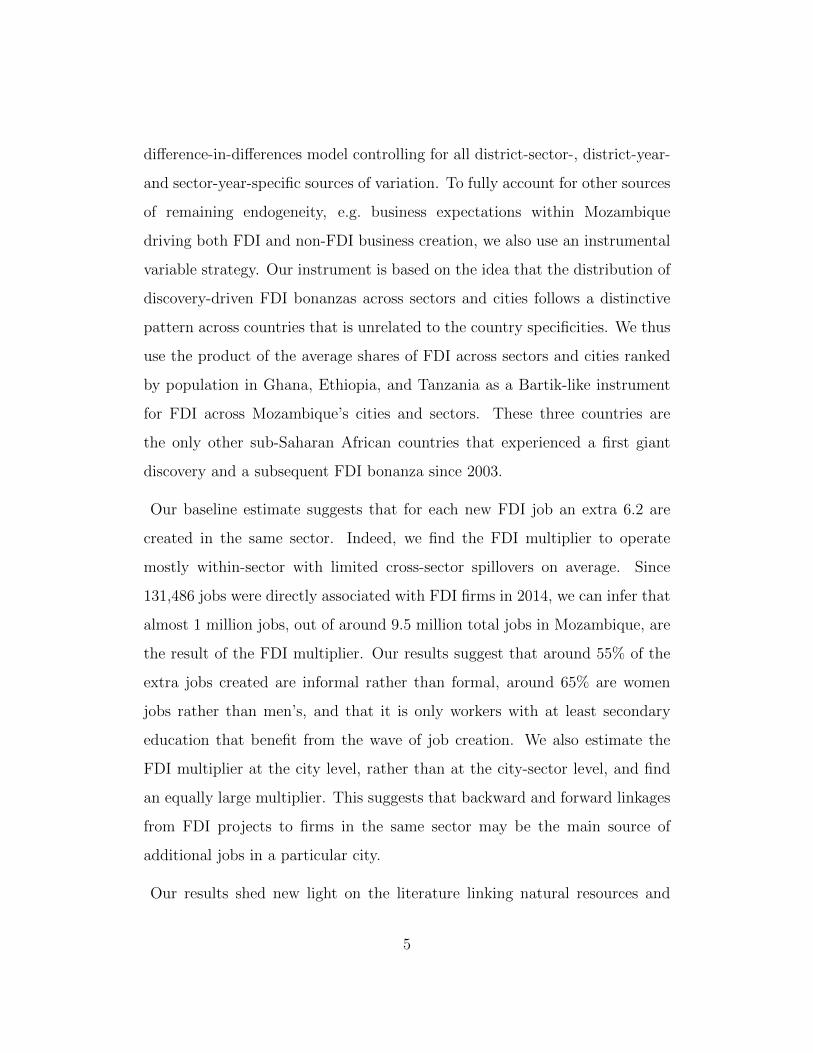
difference-in-differences model controlling for all district-sector-, district-year-
and sector-year-specific sources of variation. To fully account for other sources
of remaining endogeneity, e.g. business expectations within Mozambique
driving both FDI and non-FDI business creation, we also use an instrumental
variable strategy. Our instrument is based on the idea that the distribution of
discovery-driven FDI bonanzas across sectors and cities follows a distinctive
pattern across countries that is unrelated to the country specificities. We thus
use the product of the average shares of FDI across sectors and cities ranked
by population in Ghana, Ethiopia, and Tanzania as a Bartik-like instrument
for FDI across Mozambique’s cities and sectors. These three countries are
the only other sub-Saharan African countries that experienced a first giant
discovery and a subsequent FDI bonanza since 2003.
Our baseline estimate suggests that for each new FDI job an extra 6.2 are
created in the same sector. Indeed, we find the FDI multiplier to operate
mostly within-sector with limited cross-sector spillovers on average. Since
131,486 jobs were directly associated with FDI firms in 2014, we can infer that
almost 1 million jobs, out of around 9.5 million total jobs in Mozambique, are
the result of the FDI multiplier. Our results suggest that around 55% of the
extra jobs created are informal rather than formal, around 65% are women
jobs rather than men’s, and that it is only workers with at least secondary
education that benefit from the wave of job creation. We also estimate the
FDI multiplier at the city level, rather than at the city-sector level, and find
an equally large multiplier. This suggests that backward and forward linkages
from FDI projects to firms in the same sector may be the main source of
additional jobs in a particular city.
Our results shed new light on the literature linking natural resources and
5

development. While many studies have suggested resource-curse effects in
the long-run, we highlight a short-run FDI effect with a potential long-run
development implication. Indeed our results suggest discoveries may lead to
simultaneous investment in many sectors, possibly diversifying economies and
increasing capabilities (Hidalgo and Hausmann, 2009) and thus providing a
window of opportunity for a growth takeoff (Murphy et al., 1989; Sachs and
Warner, 1999; Aizenman and Sushko, 2011). The Mozambique experience
suggests that the FDI jobs are associated with a large multiplier, as each extra
FDI job is associated with 6.2 additional jobs in both the formal and informal
sectors. These findings add to our understanding of local multipliers (Moretti,
2010) and of the effects of FDI in developing countries (Atkin et al., 2015).
It also adds to our understanding of potential Dutch Disease effects. While
recent contributions such as Rodrik (2016), who suggested that newfound
resource wealth may lead to premature de-industrialization, and Gollin et al.
(2016), who suggested that resource discoveries lead to urbanization without
industrialization, our paper points to another mechanism at play in the short
run. Finally, our results add to our understanding of the determinants of FDI
by highlighting the under-appreciated role of resource discoveries.3
The rest of our paper is structured as follows. In Section 2 we present a
framework to analyse the effect of giant discoveries on firms’ expectations and
investment decisions. In Section 3 we present cross-country evidence on the
effect of giant discoveries on FDI. We then delve into the case of Mozambique
in Section 4 where we estimate the FDI job multiplier. We conclude in Section
5.
3A recent meta analysis of FDI determinants does not mention resource discoveries(Blonigen and Piger, 2014).
6

2 HOW DISCOVERIES AFFECT FDI:
A CONCEPTUAL FRAMEWORK
Economists have long claimed expectations of future demand to be an
important driver of investment, at least since Keynes (1936) (Eisner, 1978).
Recent empirical work has provided evidence in this direction. For example,
Gennaioli et al. (2016) have shown that investment is well explained by CFOs
expectations of earnings growth and Arif and Lee (2014) that aggregate
investment is associated with optimistic expectations of profits, measured
by analysts’ forecasts of one-year-ahead earnings. Yet the identification of
causality from expectations to investment has not been easy to establish as
both forecasts and investment may be driven by other firm attributes.
As argued by Arezki et al. (2017), giant discoveries provide an ideal natural
experiment to examine the effects of expectations on investment. Due to
their unexpected nature and to the long-delay between discoveries and actual
windfalls (see section 3), giant discoveries can be thought of as news shocks
that only change expectations about the discovery country. To illustrate how
multinationals’ expectations of future income may change after a discovery we
provide a simple analytical framework below.
We can think of a multinational choosing to invest in location i if it expects
high earnings, E[πi]. The expectation of earnings depends on both expected
revenues and expected costs. Expected revenues depend on expected local
consumption which can be linked to expected income E[Yi]. Expected costs
depend on the fixed cost Fi of establishing a plant and on the expected
marginal cost of production E[ci]. To keep it simple we can assume that fixed
costs are constant so that the expected earnings of a new FDI project boil
7

down to a function increasing in expected income, ∂E[πi]∂E[Yi]
> 0, and decreasing
in marginal production costs , ∂E[πi]∂E[ci]
< 0. We discuss in turn how both E[Yi]
and E[ci] can be affected by giant discoveries.
Recent research by Cust and Mihalyi (2017) suggests that across countries
IMF growth forecasts are on average 1 percentage point higher in the four years
following a giant discovery. The experience of Mozambique is again a case in
point. While at the time of the first giant discoveries in 2009-2010, growth
rates were around 6.5%, the IMF forecasted growth rates around 7.8% for the
2012-2016 period. This would suggest that ∂E[Yi]∂Discoveryi
> 0 and could explain
the observed FDI bonanza (Figure 2). The number of yearly FDI projects
quadrupled from 2010 to 2014 while the value of the investments and the
number of direct jobs created increased almost by a factor of 10. Mozambique
attracted $9 billion worth of FDI in 2014 alone, accounting for 30% of all of
sub-Saharan Africa’s FDI.4 The graphs in Figure 2 also show how the FDI
boom was spread across cities and across sectors. And while most projects
are from Portuguese, British and South African companies, companies from
32 countries invested in Mozambique since 2003.
Yet it is not obvious why discoveries would increase expectations of income in
the following years. As written in the introduction, oil discoveries increase the
incidence of internal armed conflict (Lei and Michaels, 2014) and deteriorate
democratic institutions (Tsui, 2011). They could thus also be associated
with lowered income expectations. Furthermore, while in the long run we
can confidently expect that the wealth discovered below the ground will be
transformed into windfalls trickling down to consumers, this will not happen
4Real estate projects led the pack for the first time in 2014 and included BelgiumPyloss dozen shopping malls around the country and South Africa’s Atterbury PropertyDevelopments various plans in Pemba, Beira and Nacala.
8

FIGURE 2The Mozambique FDI bonanza
0
.05
.1
.15
0
10
20
30
40
50
2002 2004 2006 2008 2010 2012 2014
Nb of projects (left axis)Share of sub-Sharan Africa
FDI projects
0
.05
.1
.15
0
10
20
30
40
50
2002 2004 2006 2008 2010 2012 2014
Nb of projects (left axis)Share of sub-Sharan Africa
Non-extraction FDI projects
0
.1
.2
.3
0
2000
4000
6000
8000
2002 2004 2006 2008 2010 2012 2014
Million USD (left axis)Share of sub-Sharan Africa
Non-extraction FDI
0
.05
.1
.15
0
2000
4000
6000
8000
10000
2002 2004 2006 2008 2010 2012 2014
Nb of jobs (left axis)Share of sub-Sharan Africa
Non-extraction FDI jobs
0
.02
.04
.06
.08
0
5
10
15
2002 2004 2006 2008 2010 2012 2014
Nb of countries (left axis)Share of sub-Sharan Africa
Non-extraction FDI source countries
0
.02
.04
.06
.08
0
5
10
15
2002 2004 2006 2008 2010 2012 2014
Nb of sectors (left axis)Share of sub-Sharan Africa
Non-extraction FDI sectors
0
.02
.04
.06
.08
0
5
10
15
20
25
2002 2004 2006 2008 2010 2012 2014
Nb of sub-sectors (left axis)Share of sub-Sharan Africa
Non-extraction FDI sub-sectors
0
.02
.04
.06
.08
.1
0
5
10
15
2002 2004 2006 2008 2010 2012 2014
Nb of host cities (left axis)Share of sub-Sharan Africa
FDI destination cities
9

in the four years following a discovery. Across countries the delay between
discovery and extraction is on average 5 years and in developing countries
this often exceeds a decade. As of August 2017 almost 8 years have passed
since Mozambique’s first discovery and the country is still a few years away
from extracting natural gas from the Rovuma basin. While IMF forecasts may
wrongly associate discoveries with immediate windfalls, especially in times of
high commodity prices, it is more likely that other economic variables are at
play in the short run.
Expectations of higher income following a discovery may be directly linked to
the activities of the oil companies. The years of preparation before extraction
may involve increased investment in infrastructure, an increased demand for
law firms and environmental consultancies, as well as a high-skilled labor force
flowing in from abroad. In other words, expectations of higher income may
be due to the expectation that investment in the resource sector will spillover
to the rest of the economy. Another possibility is that multinationals, or the
IMF for that matter, expect governments and consumers to bring forward
expenditure and investment by borrowing (van der Ploeg and Venables, 2013;
Wills, 2014), using the newly found wealth as collateral. Or firms might
also expect FDI bonanzas based on past experiences. Discoveries would thus
operate as a signal leading to a coordinated investment by many firms, possibly
amplified by herd behavior (Akerlof and Shiller, 2009). Last but not least,
interviews with multinationals that invested in Mozambique do suggest that
the gas discovery raised expected earnings and that this led to investment.
One of the most explicit links between Mozambique’s expected increase in
market size and the gas discovery comes from Carlos Moreno, Mozambique
manager of ALE, a company providing services in transportation: “As ALE
10

are continuing to grow and look for ways to better service our clients, we made
the decision to establish ourselves in Mozambique as the country is quickly
becoming a dominant location for the industry, particularly because of the
recently discovered massive gas reserves in northern Mozambique.”
While we might have a few reasons to believe that expected income goes up
with a giant discovery, the formation of expectations on the marginal cost
of production following a giant resource discovery, ∂E[ci]∂Discoveryi
, is less clear.
Standard theories of Dutch Disease would suggest that in situations in which
factors of production are fully employed a booming resource sector should
push up production costs due to supply constraints (Corden and Neary, 1982).
While discoveries are not synonymous with a booming resource sector, we
could expect them to cause similar effects in the short run. On the other
hand, the possible pre-boom boom, i.e. the coordinated increase in investment
across sectors occurring before resource windfalls, as well as the possible extra
infrastructure, may lead to a decrease in marginal costs via agglomeration
economies (Glaeser, 2010). Hence the effect of discoveries on expected earnings
can be decomposed as follows:
dE[πi]
d[Discoveryi]=
+︷ ︸︸ ︷∂E[πi]
∂E[Yi]
+︷ ︸︸ ︷dE[Yi]
d[Discoveryi]+
−︷ ︸︸ ︷∂E[πi]
∂E[ci]
?︷ ︸︸ ︷dE[ci]
d[Discoveryi](1)
While the effect of discoveries on expectations of production costs and even
of income may be ambiguous, our discussion above suggests that the expected
profitability of a project is likely to increase with discoveries as multinationals’
are likely to expect discoveries to raise income. Our empirical analysis in the
next section will provide evidence supportive of this hypothesis.
11

3 THE FDI EFFECT OF DISCOVERIES:
EVIDENCE ACROSS COUNTRIES
3.1 DATA AND IDENTIFICATION
To examine the FDI response to natural resource discoveries across countries
we merge data on giant oil and gas discoveries with a project-level FDI data
set.
The data on discoveries are reported by Horn (2011) in Giant Oil and Gas
Fields of the World. Giant discoveries are defined as fields containing at least
500 million barrels of ultimately recoverable oil equivalent. Figure 3 graphs
the net present value of giant oil and gas discoveries as a share of GDP in
non-OECD countries since 2003.5 In total, 74 giant discoveries have been
made in 29 countries between 2003 and 2014. Approximately half of the
countries made only one giant discovery in this period such that the remaining
59 discoveries have been made by 14 countries. This feature of discoveries, i.e.
that initial discoveries tend to trigger a number of subsequent discoveries, is
discussed further below. The average value of discoveries relative to GDP in
this period was around 90%.
The data on FDI projects is from fDiMarkets, part of fDi Intelligence, itself
part of the Financial Times Group (FT). fDiMarkets has been tracking and
verifying individual cross-border greenfield investment projects since 2003 and
is now a primary source of data for UNCTAD, the World Bank and the
5The the net present values are from Arezki et al. (2017) who calculated them as the“sum of gross oil revenue derived from an approximated oil production profile discountedby country-specific discounting factors, and valued at the oil price prevailing at the time ofthe discovery”. Due to FDI data constraints our period of study is 2003-2014. The onlyOECD countries with giant discoveries in that period are the US and Australia.
12

FIGURE 3Discoveries in non-OECD countries (since 2003)
AGO
AGO
AGO
ETH
GHA
GHA
LBRMOZ
MOZ
MOZ
MOZ
SLE
TZA
TZA
AZE
AZE
CHNCHN CHN
CHN CHN
CYP
IND
KAZ
MYS
VNM
VNM
VNM
RUSRUS
RUS
RUS
BOL
BRA
BRA
BRABRA
BRA
BRA BRA
COL VEN
EGY
IRN IRN
IRN
IRNIRN
IRN
IRN
IRNIRQ
IRQ
IRQ
IRQ
LBY
SAU
SAU
SDN
0
1
3
10
40
100
500
1500
Dis
cove
ry d
isco
unte
d ne
t val
ue (
GD
P=
100)
2002 2004 2006 2008 2010 2012
Note: The discounted net value is from Arezki et al. (2017) who calculated it as the “sumof gross oil revenue derived from an approximated oil production profile discounted bycountry-specific discounting factors, and valued at the oil price prevailing at the time of thediscovery”.
Economist Intelligence Unit (fDiIntelligence, 2016). The database provides
information on the value of investments and the estimated number of jobs
created.
Importantly, fDiMarkets provides information on the business activity of
every project. We use this information to identify FDI flows which are
unrelated to the extraction of natural resources. We define FDI projects
that are not in the “Extraction” Business Activity as non-extraction FDI.
This distinction is particularly important as it allows us to identify the FDI
flows driven by income expectations rather than the investment of oil and gas
companies directly related to the giant discovery. It also allows us to focus
on the type of FDI which has been associated with productivity spillovers
(Matsuyama, 1992; Gorg and Strobl, 2001) and which may have a higher
13

FIGURE 4FDI to discovery countries
0
100
200
300
400
500U
SD
bill
ion
2003 2005 2007 2009 2011 2013
Extraction FDI Total FDI
Note: Nominal value of FDI in discovery countries. Extraction FDI is as defined byfDiMarkets.
capacity to create jobs than the capital-intensive extraction sector (Ross,
2012). Indeed, the FDI data does suggest non-extraction projects create
more jobs on average. While there are large differences in project size across
countries, the number of jobs created by non-extraction projects is on average
four times larger than in extraction projects.
Figure 4 reveals that non-extraction FDI drawfs extraction FDI even in
countries with giant discoveries. During 2003-2014 FDI in non-extraction
activities oscillated around USD 300 billion a year while extraction FDI was
below USD 50 billion on average.
The data also allows for the analysis to go beyond the country or sector
FDI aggregates. It allows us to decompose FDI into extensive and intensive
14

margins, i.e. the number of projects vs. average value of projects, as well as
number of sectors and of source countries. In Figure 16 in the appendix A.1
we summarize the margins of FDI in discovery countries. Further summary
statistics can be found in Table 9 of the same section.
Our strategy to identify the causal effect of discoveries on the margins of
FDI inflows relies on the unpredictability of giant discoveries. As we detail in
this section, the uncertain nature of exploration creates a source of plausibly
exogenous variation that allows us to estimate the causal effect of giant oil
and gas discoveries. We thus use a simple difference-in-differences model to
compare FDI flows in the year of a giant discovery and in the two following
years to FDI in other years. Hence, the timing of a discovery is at the core of
our identification strategy.
Previous studies such as Arezki et al. (2017), Tsui (2011), and Lei and
Michaels (2014) have suggested that the timing of giant oil discoveries
is plausibly exogenous and unpredictable due to the uncertain nature of
exploration.6 To examine this claim further we matched the discovery data
with data on exploration wells from Wood Mackenzie (2015) and geological
basins from Robertson CGG (2016) for all non-OECD countries. This data
is mapped in Figure 5. Grey areas indicate basins where exploration drilling
has been particularly likely to result in giant discoveries (Mann et al., 2001).
It clearly shows that companies have not made large discoveries everywhere
they have drilled exploration wells.
6Similarly Cotet and Tsui (2013) and Cavalcanti et al. (2015) suggested that luck inexploration is random and allows for the causal identification of oil discoveries.
15

FIG
UR
E5
Bas
ins,
dri
llin
g,an
dgi
ant
dis
cove
ries
innon
-OE
CD
countr
ies
(sin
ce20
03)
Not
e:B
lack
dot
sar
eex
plo
rati
onw
ells
(Sou
rce:
Horn
(2011))
,re
dd
ots
gia
nt
dis
cove
ries
(Sou
rce:
Wood
Mack
enzi
e(2
015)
).G
rey
ind
icate
basi
ns
wer
eex
plo
rati
ond
rill
ing
isp
arti
cula
rly
like
lyto
resu
ltin
gia
nt
dis
cove
ries
.(S
ourc
e:S
hap
efile
has
bee
nco
nst
ruct
edby
Rob
erts
on
CG
G(2
016)
wh
ile
Man
net
al.
(200
1)p
rovid
ean
analy
sis
on
wh
ich
typ
eof
basi
nis
part
icu
larl
yli
kely
tore
sult
ina
gia
nt
dis
cove
ry.
Dri
llin
gact
ivit
yan
dgi
ant
dis
cove
ries
inO
EC
Dco
untr
ies
isex
clu
ded
from
the
Fig
ure
.
16

Oil and gas companies are always looking for particularly large, and preferably
giant, discoveries. This is because fixed costs represent a large share of total
costs in developing and operating a successful well (Adelman, 1962). Thus,
exploration wells drilled tend to cluster in areas which are considered to be
particularly productive (see Figure 5). While the data suggests that the
probability of a giant discovery conditional on exploration drilling is around
2%, there is no deterministic relationship between exploration and discovery.
Exploring for 100 years does not guarantee a giant discovery. This has already
been emphasized by Adelman (1962): “There is no amount of chronological
time which can be said to correspond to the exploration long run.” For
example, South Africa has been digging exploration wells since 1968 but has
still haven’t found a giant field. The Financial Times also provides a telling
example of the uncertain nature of the timing of discoveries (Kavanagh, 2013).
In 2010 Lundin Petroleum made the largest discovery of the year and one of
the biggest ever in Norway. It was found three meters away from where Elf
Aquitaine drilled but failed to find oil in 1971.
To evaluate the effect of giant discoveries on FDI flows we estimate the
following specification:
(2) FDIit = βDit + αi + σt + εit
where FDIit is a placeholder for different measures of FDI inflows in country i
in year t such as the total value of FDI inflows, the number of FDI projects, the
number of jobs created, the number of source countries and of target sectors.
To include observations where there is no FDI and thus include zeros we use
an inverse hyperbolic sine transformation instead of the log transformation
17

(Burbidge et al., 1988; MacKinnon and Magee, 1990). Dit is a dummy equal
to 1 in the year of the discovery and the two subsequent years. The coefficient
of interest is β.7 αi is a country fixed effect that picks up factors that do not
vary over time within countries such as geography as well as variables which
vary little year-on-year such as formal or informal institutions. And σt is a
year fixed effect that controls for global factors such as global risk or FDI
waves (Herger and McCorriston, 2016). εit represents the error term which we
allow to correlate arbitrarily across years within a country and across countries
within a year. In alternative specifications we limit the country sample to
countries with at least one exploration well, i.e. exploration countries, and to
countries with at least one giant discovery during 2003-2014, i.e. discovery
countries. These alternative country samples provide a more conservative
counterfactual in the event exploration is endogenous.
3.2 RESULTS AND ROBUSTNESS
Our main results are presented in Tables 1 and 2. The Tables provide estimates
of β (see equation 2) for seven different measures of FDI in three panels
based on three different country samples. The sample in Panel A includes
all non-OECD countries, while Panel B includes only exploration countries
and Panel C only discovery countries.
We find that non-extraction FDI inflows are 58% higher in the 2 years
following a giant discovery. This is the lower bound estimate from Panel C,
yet there is no significant difference in estimates across panels which suggests
7By taking the hyperbolic sine of β we get the percentage change in FDI due to a gaintdiscovery. We are extremely grateful to David Giles for his help in interpreting our regressioncoefficients.
18

Table 1: Non-extraction FDI
Panel A: All countries(1) (2) (3) (4)
FDI (USD million) Nb projects Avg project size Jobs createdDiscovery in past 2 years 0.616∗∗ 0.300∗∗ 0.341 0.571∗
(0.263) (0.123) (0.217) (0.261)N 1992 1992 1992 1992R-sq 0.75 0.91 0.48 0.75
Panel B: Only exploration countries(1) (2) (3) (4)
FDI (USD million) Nb projects Avg project size Jobs createdDiscovery in past 2 years 0.594∗∗ 0.303∗∗ 0.314 0.549∗
(0.264) (0.126) (0.211) (0.251)N 1080 1080 1080 1080R-sq 0.72 0.90 0.41 0.75
Panel C: Only discovery countries(1) (2) (3) (4)
FDI (USD million) Nb projects Avg project size Jobs createdDiscovery in past 2 years 0.551∗ 0.318∗∗ 0.245 0.519∗
(0.286) (0.140) (0.219) (0.267)N 300 300 300 300R-sq 0.73 0.90 0.37 0.75
Country and year fixed effects included in all regressions. Standard errors in parenthesisclustered by country and year. Non-dummy variables are in inverse-hyperbolic sines.
that the choice of counterfactual does not affect our main result. Using lower
bound estimates, we also find that the number of FDI projects increases by
30% and the number of jobs created by 54%, while the average size of projects
is not significantly affected. This suggests that the FDI effect is driven by the
extensive margin rather than the intensive margin. Results in Table 2 further
confirm that the extensive margin plays a key role in the response of FDI flows
to giant discoveries. We find that the number of FDI sub-sectors and source
countries increases by 19% in the 2 years following a giant discovery. These
results are again very similar across panels.
The results suggest that giant discoveries attract non-extraction FDI. The
19

Table 2: Extensive margins
Panel A: All countries(1) (2) (3)
Nb source countries Nb sub-sectors Nb sectorsDiscovery in past 2 years 0.204∗∗ 0.251∗∗ 0.192∗∗
(0.076) (0.082) (0.069)N 1992 1992 1992R-sq 0.87 0.90 0.87
Panel B: Only exploration countries
(1) (2) (3)Nb source countries Nb sub-sectors Nb sectors
Discovery in past 2 years 0.188∗∗ 0.193∗ 0.158∗∗
(0.078) (0.088) (0.071)N 1080 1080 1080R-sq 0.86 0.89 0.86
Panel C: Only discovery countries
(1) (2) (3)Nb source countries Nb sub-sectors Nb sectors
Discovery in past 2 years 0.197∗ 0.246∗∗ 0.189∗∗
(0.090) (0.095) (0.080)N 300 300 300R-sq 0.81 0.88 0.82
Country and year fixed effects included in all regressions. Standard errors in parenthesisclustered by country and year. Non-dummy variables are in inverse-hyperbolic sines.
FDI inflow occurs several years before production actually starts and, thus,
precede the potential oil boom (which occurs on average 5 years after a
discovery). As discussed above non-extraction FDI tends to be labor intensive
and, thus, giant discoveries have indirectly the potential to create many jobs,
a mechanism we explore further using Mozambique’s experience in the next
section. Also, this influx of FDI is driven by the extensive rather than intensive
margin such that it provides a source of diversification for the economy as jobs
are created across a variety of sectors. The increase in the number of source
20

countries is also consistent with the idea that giant discoveries act as news
shocks about future market size propagated across countries. Hence, giant
discoveries may work as a coordination device which exogenously determine
the timing of investment from different countries and sectors thereby providing
a window of opportunity for a big push.
Our results are in line with Arezki et al. (2017) who show that in a panel
of up to 180 countries during the period 1970-2012 that investment rises
robustly right after the news of a giant discovery arrives.8 And while our
results seem to go against Poelhekke and van der Ploeg (2013) it is worth
noting that the latter showed that resource rents, rather than discoveries,
crowded out non-resource FDI, and that was mostly in the longer run and
focusing on the period 1985-2002, i.e. before the latest boom. Our results are
thus complementary rather than contradicting.
Robustness In the next paragraphs we describe a battery of robustness
checks to reinforce our main result. Our first check is a falsification exercise
to highlight the importance of the timing of the discoveries across years. In
this check we generated placebo discoveries by shuffling the discovery years
randomly within discovery countries across years and used this “false” data
to re-estimate equation 2 500 times on our Panel A sample. As we show in
Figure 6, reshuffling the discoveries randomly does not give similar results.
Indeed, the distribution of 500 randomized discoveries is centred around zero,
8While Arezki et al. (2017) looked at private and public investment, their data did notallow them to distinguish extractive vs. non-extractive investment. Our FDI data is thusideal to complement our understanding of the effects of giant oil discoveries. The latter alsofind that employment decreases slightly after the news. While we find that FDI creates jobswe examine the effect on total employment in Mozambique and find no such jobs crowdingout.
21

FIGURE 6Distribution of 500 placebo discovery effects
Discoveryeffect
0.5
11.
52
Den
sity
−1 −.5 0 .5 1Estimated placebo coefficent
Note: The 500 placebo discoveries were generated by reshuffling randomly the discoveryyears within countries across years. Their effects on non-extraction FDI were estimatedusing our baseline specification in equation 2. The vertical red line gives our benchmarkestimate (column 1 of Table 1).
and only 19 random draws out of 500 came out positive and significant. Based
on the standard error of the placebo distribution, the probability of obtaining
our benchmark estimate of 0.616, as shown by the vertical line, is below 0.01.
This adds confidence in our identification based on the exogenous timing of
the discoveries.
As a second robustness check we experiment with various time horizons as our
2-year cut-off may be arbitrary. We estimate our baseline regression (Panel
A) but replacing our “Discovery in past 2 years” dummy with dummies for
alternate time horizons, i.e. from 1 to 5 years after the discovery. For example,
Discovery year+4 is a dummy equal to 1 in the Discovery year and the 4
subsequent ones. Our estimates, summarized in Figure 7, suggest that our
baseline results are robust to the choice of time horizon. FDI projects increase
significantly in the year of the discovery and in the following 5 years. It
22

FIGURE 7Discovery effect on FDI: Varying time horizons
Discovery year
Discovery year + 1
Discovery year + 2
Discovery year + 3
Discovery year + 4
Discovery year + 5
−.5 0 .5 1 1.5 −.5 0 .5 1 1.5 −.5 0 .5 1 1.5 −.5 0 .5 1 1.5
FDI (USD million) Nb projects Avg project size Jobs created
Note: The effects on non-extraction FDI are estimated in a specification akin to our baseline(Table 1) where the “Discovery in past 2 years” dummy is replaced with dummies foralternate time horizons. For example, Discovery year+4 is a dummy equal to 1 in theDiscovery year and the 4 subsequent ones. The dummy Discovery year+2 is thus the sameas in our baseline. The capped lines are 90% confidence intervals.
is only when considering only the year of the discovery and the following
year that we find less convincing effects, though the coefficients’ magnitude is
not statistically different. Indeed there is no significant differences across the
estimates using different time horizons.
In a third robustness check we restrain our sample to the years before and
the 3 years after the first giant discovery in each country in our sample. By
eliminating subsequent giant discoveries from our sample we can estimate a
more flexible specification which allows us to explore the dynamics of the
response in non-extraction FDI in more detail while avoiding potential biases
introduced by successive discoveries. We thus estimate equation 2 but we
replace Dit with 5 dummies (two lags, two leads and one dummy for the year
of the discovery). The results of this specification are presented in Figure 8. We
23

FIGURE 8
−2
−1
0
1
2
3
Effe
ct o
n F
DI
−2 −1 Discovery +1 +2
Note: The yearly effects on non-extraction FDI are estimated in a specification akin to ourbaseline (Table 1) where the 2-year discovery dummy is replaced with five dummies, one foreach year from 2 years before to 2 years after the discovery.
find a positive effect on non-extraction FDI two years after the discovery and
there is no evidence of higher non-extraction FDI flows in the years preceding
a discovery.
Our fourth robustness check is to re-estimate equation 2 using FDI data
from UNCTAD rather than from fDiMarkets. While UNCTAD is the most
commonly used source of FDI across countries, it does not allow us to isolate
non-extraction FDI nor to disaggregate FDI into margins. It does however
allow us to expand the sample period to 1970-2014. Results in Table 10 in
appendix A.2 confirm our baseline.
In additional robustness checks we show that our results also hold when we
include the number of previous discoveries as an additional control in equation
2 as in Arezki et al. (2017) (see Figure 9) or when we estimate a PPML (Silva
and Tenreyro, 2006) instead of a linear model (results available upon request).
24

Heterogeneity To examine further the effect of giant discoveries on FDI
we look at how it varies across destination countries based on their level of
development, the quality of their institutions, their distance from the discovery
country, as well as on their previous giant discoveries. To do so we augment
equation 2 by interacting the discovery dummy with real GDP per capita (in
2005 US dollars, from the World Development Indicators), with the number of
previous discoveries, and with measures of institutional quality, i.e. the CPIA
property rights and rule-based governance rating from the World Development
Indicators.9 We also check if the effect’s size depends on the geodesic distance
between the destination and the source countries. To do so we turn our main
specification into a gravity model with bilateral FDI flows, i.e. we include
FDI from each source country rather than aggregate them by destination
county (we include source-year and country-pair fixed effects but none for
destination-year as we want to estimate the effect of the discovery dummy).
The results are shown in Figure 9. We find the effect to be stronger and
statistically significant only in poor countries with an average GDP per capita
below $4,000 during 2003-2014. Weak institutions do not seem to affect the
relationship significantly, though if anything the resource effect is reduced by
better institutions. This may reflect the fact that poor countries have weak
institutions and it is in those countries that a giant discovery is a bigger deal.10
9CPIA stands for Country Policy and Institutional Assessment and it focuses only onlow-income countries. The results also hold if we use the rule of law index from the WorldBank Governance Indicators.
10This result also suggests that resources may provide a missing piece to the allocationpuzzle whereby low-productivity growth countries have higher FDI to GDP ratios(Gourinchas and Jeanne, 2013). While Alfaro et al. (2008) suggest that low institutionalquality is the leading explanation, our results point to resources as a third variable linkingFDI inflows and low productivity growth.
25

We also find that the effect is stronger on FDI from nearer countries, maybe as
the news of the discovery resonates more in neighbouring countries who also
have more information about the discovery country. Finally we find that the
effect is less strong when the country has had giant discoveries in the past,
though this relationship is not statistically significant.
Finally we explore the FDI response across business activities and location
by re-estimating equation 2 by business activity for both FDI to the country’s
metropolis and to the rest of the country.11. The results in Figure 10 suggest
that the strongest response comes from FDI in manufacturing, information
and communication technologies, and retail in the country’s largest city while
in the rest of the country the FDI effects are strongest in business services
and construction, as well as in electricity and extraction. Note that some of
those activities, in particular manufacturing, construction and retail are likely
to be labor intensive and provide the potential for the creation of many jobs in
developing countries. Also, the effect on business services might be linked to
the deepening of retail banking and thus ease financial constraints which are
frequently considered a strong impediment to development. Most importantly,
these findings add to our understanding of potential Dutch Disease effects.
While newfound resource wealth may lead to premature deindustrialization
(Rodrik, 2016) and urbanization without industrialization (Gollin et al., 2016),
our results suggest that another “industrialization” mechanism may be at play
in the short run. The reaction of FDI in manufacturing, construction and
in business services can be interpreted as “expectation-driven” FDI whereby
foreign firms flock in expecting future growth.
11We opted for business activity rather than sectors as these make a clear distinctionbetween manufacturing and services and also because it aggregates FDI projects into 18categories rather than 39 and thus ease the presentation of the results
26

FIGURE 9Heterogeneity of the FDI effects across countries
−1
0
1
2
3
Dis
cove
ry e
ffect
on
non−
extr
actio
n F
DI i
nflo
ws
0 2000 4000 6000 8000 10000
GDP per capita (2005 USD)
−.5
0
.5
1
1.5
Dis
cove
ry e
ffect
on
non−
extr
actio
n F
DI i
nflo
ws
0 5 10 15
Nb of previous discoveries
0
.2
.4
.6
.8
1
Dis
co
ve
ry e
ffe
ct
on
no
n−
extr
actio
n F
DI
inflo
ws
1 10 100 1000 5000 20000
Distance between FDI source and discovery countries (km)
−1
0
1
2
3
Dis
cove
ry e
ffect
on
non−
extr
actio
n F
DI i
nflo
ws
1.5 2 2.5 3 3.5 4
CPIA property rights and rule−based governance rating (1=low to 6=high)
Note: The dark solid line is the marginal effect of a giant discovery, the dash lines are95% confidence intervals. These are based on the specification of Table 1 where thediscovery dummy is interacted with the x-axis variable. The doted line is the densityestimate of the x-axis variable. The data on GDP per capita and on institutionalquality is from the World Bank Development indicators.
27

FIGURE 10Discovery effect on FDI by business activity
Largest city Rest of country
ExtractionLogisticsEducationTrainingDesignDevelopmentTestingRecyclingSalesMarketingSupportTechnicalSupportCentreElectricityMaintenanceServicingCustomerContactCentreHeadquartersResearchDevelopmentSharedServicesCentreBusinessServicesConstructionRetailICTInternetInfrastructureManufacturing
−3 −2 −1 0 1
Discovery effect
MaintenanceServicingEducationTrainingRecyclingTechnicalSupportCentreDesignDevelopmentTestingResearchDevelopmentCustomerContactCentreHeadquartersSharedServicesCentreManufacturingSalesMarketingSupportRetailLogisticsICTInternetInfrastructureBusinessServicesConstructionExtractionElectricity
−3 −2 −1 0 1 2
Discovery effect
Note: The bars show β coefficients estimated running regression 2 by business activity.Business activity is a level of aggregation above sectors in fDi Intelligence industryclassification system.
4 THE JOB EFFECTS OF AN FDI BONANZA:
THE CASE OF MOZAMBIQUE
4.1 DATA AND IDENTIFICATION
Our results so far suggest that giant oil and gas discoveries lead to FDI
bonanzas of new projects, in new sectors, from new source countries. As
discoveries precede production by 5 years on average, we argue that the
FDI effect is driven by expectations of higher income. The FDI bonanza
that followed the unprecedented giant gas discoveries off Mozambique but
precedes the actual field exploitation illustrates tellingly this FDI effect. It
thus provides a unique opportunity to go one step further and evaluate the
local job effects of the FDI projects. While most economists see FDI as a
28

key part of economic development (see De Mello Jr (1997)), the cross-country
evidence does not suggest a clear-cut positive effect of FDI on growth. For
example, Carkovic and Levine (2005) suggests that when FDI is instrumented
to rule out reverse casuality it has no robust positive influence on economic
growth. Borensztein et al. (1998) on the other hand suggests that FDI does
contribute to growth but only when the host country has a minimum stock of
human capital. Moreover, other studies have shown that countries undercut
each other’s labor and environmental standards to attract FDI in a race to the
bottom that may hurt development (Davies and Vadlamannati, 2013; Olney,
2013; Poelhekke and van der Ploeg, 2015). A recent study of FDI in Vietnam
(McLaren and Yoo, 2016) even suggests that FDI is associated with a decline
in living standards for households within a province if they do not have a
member employed by the foreign enterprises, and with only modest gains for
households who do. Hence it is not clear in advance whether the FDI bonanza
in Mozambique has been development-friendly, especially as it is one of the
poorest countries in the world.
Our aim here is to determine whether the FDI bonanza in Mozambique has
been job creating. Our focus on employment stems from our belief that
the development effect of FDI comes first and foremost from job creation.
Most micro-level studies cited above have focused on the wage or productivity
effects. But the employment effects are not so obvious. In its review of the
labor market effects of US FDI in developing countries, Lipsey (2004) suggests
that affiliates, while labor-intensive relative to their parent firm, generate less
employment than local firms as they are more productive and skill intensive.
In the same vein, Marelli et al. (2014) finds no positive effects of FDI on
employment in Southern and Central and Eastern European regions while
29

Axarloglou and Pournarakis (2007) finds that FDI inflows in manufacturing
have only weak effects on local employment across US states. Last but not
least, Atkin et al. (2015) estimate the effect of foreign supermarket entry
(mostly WalMart) on household welfare in Mexico and find little evidence
of changes in average municipality-level employment. Even across US States
it is not clear whether the expansion of WalMart has created or destroyed jobs.
Basker (2005) suggests that Wal-Mart entry increases retail employment by
100 jobs in the year of entry in a US county while Neumark et al. (2008) suggest
it reduces it by about 150 workers. Hence it is surely a worthy endeavour to
check whether the boom in FDI projects across Mozambique has increased
household employment or not.
Our approach to gauge the job-creation effect of the Mozambique FDI
bonanza is inspired by the local multiplier literature, i.e. the idea that “every
time a local economy generates a new job by attracting a new business,
additional jobs might also be created” (Moretti, 2010), as well as by empirical
studies on the local employment effect of mines such as Aragon and Rud
(2013) and Kotsadam and Tolonen (2016).
In our particular setting, we expect FDI jobs to have a multiplier effect due
to two distinct channels. First, the newly created FDI jobs are likely to be
associated with higher salaries (Javorcik, 2015). In the context of Sub-Saharan
Africa, Blanas et al. (2017) have shown that foreign-owned firms not only pay
higher wages to non-production and managerial workers but they also offer
more secure, i.e. less-temporary work. These newly created jobs are likely to
increase local income and in turn demand for local goods and services. For
example, the multinational employees might increase the demand for local
agricultural goods such as fruit and vegetables, as well as for services such as
30

housing, restaurants and bars. Such an increase in demand will be met by
local firms by adjusting production, creating more jobs and reinforcing the
initial increase in demand. Hence, the increased demand for local goods and
services pushes the economy to a new equilibrium by multiplying the initial
number of jobs directly created by multinationals (Hirschman, 1957; Moretti,
2010).12
Additionally, backward and forward linkages between multinationals and local
firms might increase the demand for local goods and services (Javorcik, 2004).
In particular, newly arrived multinationals might demand services such as
catering, driving and cleaning services, as well as services from local law firms
and consultancies which are more experienced with the economic and legal
environment. While both mechanisms may contribute to the job multiplier,
we expect linkages to be strongest within the sector of investment. Indeed,
previous work on Input-Output tables documents that linkages across firms
are predominantly formed within the same sector (Miller and Blair, 2009). On
the other hand the multiplier effect operating via the increased demand for
local goods and services should affect the local economy more equally across
sectors. We investigate this conjecture in our data analysis below.
To estimate such a multiplier we match the FDI projects to job numbers
across cities, sectors, and periods using data from two waves of Household
Surveys from 2002 to 2014. Since FDI and employment vary across three
dimensions, i.e. across districts, sectors, and periods, we are able to estimate
a triple difference-in-differences model controlling for all district-sector-,
12While in Moretti (2010) the increased demand for labor is met by a spatial reallocationof labor which is determined by local differences in wages and idiosyncratic preferences forlocations, in the context of a developing country, such as Mozambique, the increased demandmay also be met by a reserve of surplus labor as in Lewis (1954)
31

district-year- and sector-year-specific sources of endogeneity. Sector-year fixed
effects allow us to control for country-level trends such as the servicification
of the economy, district-year fixed effects capture market potential, and
district-sector fixed effects geographic factors that may influence FDI in some
sectors over others. More formally, we estimate the following specification:
Jobsijt = γFDIijt + αij + Ωit + λjt + εijt
where Jobsijt is the number of individuals employed in non-FDI jobs, whether
formal or informal, in district i in sector j in year t; FDIijt is the number of
jobs directly created by FDI projects, or the number of FDI projects; αij is a
sector-district fixed effect; Ωit is a sector-year fixed effect; λjt is a district-year
fixed effect and εijt is the error term which is clustered by district and sector.
The coefficient on γ thus captures the multiplier effect of FDI jobs.
While the exogenous nature of the FDI boom, i.e. it being the result of
the unexpected giant discovery, suggests that our triple diff-in-diff model
will provide quasi-causal estimates, we can nonetheless be worried that
its distribution across cities and sectors is driven by expectations within
Mozambique that also drive non-FDI business creation. To control for such
potential endogeneity we also use an instrumental variable strategy based
on the distribution of FDI booms across sectors and cities in three African
countries that also had their first giant discovery in the late 2000s. We detail
this strategy as a first robustness check after describing our baseline results.
While fDiMarkets provides yearly information on the location FDI projects
at the district level, 87 of the 215 projects listed from 2003 to 2014 have
unknown locations.13 We thus also use FDI data from the 2002 and 2014
13While this may be because the investment has been announced but not realized, 128
32

firm censuses (Censo de Empresas or CEMPRE) which was completed by the
national statistics institute (INE) as an alternate source of FDI data. The
firm census includes information on each firm’s share of foreign ownership,
which allows us to estimate the number of FDI firms, as well as the number
of employees in those firms. This information is available only from the 2014
census and thus refers to FDI stocks rather than flows. We are nonetheless able
to estimate yearly FDI flows using the registration year of the firms surveyed
in 2014. This estimate includes only firms that survived until 2014 and it
assumes that surviving foreign-owned firms in 2014 were foreign-owned since
their registration year, i.e. not acquired. This estimate suggests more than
four times more FDI projects than fDiMarkets. Hence while fDiMarkets is
most likely an underestimate of the number of FDI projects, our FDI flows
based on CEMPRE data may be an overestimate or an underestimate. For
robustness we use both FDI estimates in our regressions. We compare our two
sources of data on FDI in Figure 18 in appendix A.4.
To link the information on FDI projects to household-level data, we use two
individual waves of the household budget survey from 2002/2003 (IAF02),
and 2014/2015 (IOF14).14 Every survey contains information on the sector of
employment of each individual in the household. Since we are interested
in the effects of FDI inflows on employment we reduce our sample to
individuals between 15 and 59 years old. For a consistent matching of
FDI projects and households across districts and sectors we aggregate the
available information into 9 sectors, namely Construction, Manufacturing,
of the projects have been confirmed by internet searches. We use these 128 projects in ourregressions.
14The surveys were conducted by the National Statistical Institute. To collect theinformation, a series of interviews were conducted over a one-week period for each household.They are representative for the rural and urban zones and each of the ten provinces plusMaputo City.
33

Extraction, Transportation, Services, Agriculture, Education, Health, and
Administration.15 Quite conveniently, the census years of 2002 and 2014
match the household survey years.
We estimate the total number of jobs using the total number of people
reporting being employed in each district, sector and year and by grossing up
the weights provided in the survey (see Blundell et al. (2004) for an example of
grossing up weights).16 To estimate the number of informal jobs we subtract
from total jobs the number of formal local jobs as per the 2002 and 2014
firm censuses and the number of FDI jobs from either the firm censuses or
fDiMarkets, depending on which source of FDI data we use in the regression.
The job numbers, based on CEMPRE data are presented in Figure 11. The
larger majority of jobs in Mozambique are informal. Even in the capital and
biggest city, Maputo, the share of formal jobs is just around 50%. And while
most formal jobs are in services, FDI accounts for a larger share of formal jobs
in manufacturing. Further summary statistics and a detailed description of
the variables can be found in Table 12 and 11 in appendix A.3.
15Services include Business Services, Retail, Maintenance and Servicing, Headquarters,ICT and Internet Infrastructure, Sales Marketing and Support, and Electricity from thefDiMarkets categories. From the CEMPRE data it includes a wide array of activities fromwholesale and retail to hotels and restaurants, banking, consulting, real estate, arts andsports, as well as utilities such as water, gas and electricity. Our matching categories areavailable upon request.
16To make sure that our numbers add up at the country level and that survey attritionis not an issue we compared population estimates based on grossed up weights with thosefrom the national statistics institute (INE). Grossing up the weights of the 2002/2003 surveygives us population of 18.3 million. This is very close to the population estimates of INEin 2002 and 2003, at 18.1 million and 18.6 million respectively. Grossing up the weights of2014/2015 survey gives us a total of 25.6 million people, again in line with the INE estimatesfor 2014 and 2015, i.e. 25 million and 25.7 millon.
34

FIGURE 11Jobs in Mozambique in 2014
0 .5 1 1.5 2
Maputo City
Gaza
Inhambane
Niassa
Maputo
Cabo Delgado
Manica
Sofala
Tete
Nampula
Zambezia
Informal and formal jobs (millions)
Informal
Formal
0 50,000 100000 150000 200000
Niassa
Cabo Delgado
Inhambane
Manica
Gaza
Tete
Zambezia
Nampula
Sofala
Maputo
Maputo City
Formal jobs
Local jobs
FDI jobs
0 2 4 6 8
Extraction
Health
Transportation
Administration
Education
Construction
Manufacturing
Services
Agriculture
Informal and formal jobs (millions)
Informal
Formal
0 50,000 100000 150000 200000
Health
Extraction
Education
Transportation
Agriculture
Administration
Construction
Manufacturing
Services
Formal jobs
Local jobs
FDI jobs
Note: The numbers are based on Household Budget Survey (IOF14) and the firmcensus (CEMPRE).
35

4.2 RESULTS AND ROBUSTNESS
Results Our baseline estimates are presented in Table 3. The estimated
coefficients in the top panel give us the FDI-job multiplier, i.e. the number
of additional non-FDI jobs created by an extra FDI job. The bottom panel
estimates are for the multiplier associated with an extra FDI project. Using
FDI job numbers from the firm census (CEMPRE) suggests a multiplier of 6.2
(column 1) and the order of magnitude of this multiplier is confirmed by the
fDiMarkets (FT) data which suggests a multiplier of 6.7 (column 2). Columns
(3-6) break down non-FDI jobs into formal and informal jobs. It suggests
that out of the 6.2 additional jobs created by an FDI job, 2.9 are formal and
3.4 are informal. Again the estimates based on fDiMarkets suggest similar
numbers. These multipliers suggest large job-creation effects for FDI jobs but
are nonetheless of the same magnitude as the local multipliers estimated by
Moretti (2010) for high-skilled jobs.
The estimates in the bottom panel of Table 3 suggest that an extra FDI
project is associated with 120 non-FDI additional jobs, 50 in the formal
economy and 70 in the informal sector. It confirms the larger impact of FDI
on the informal sector than on the formal sector. The numbers are of a larger
magnitude when using FDI data from fDiMarkets. The latter suggests that
each extra FDI projects creates 1,846 additional jobs. This difference might
be explained by a selection of mostly large projects in the fDiMarkets data.
To investigate whether the FDI multiplier operates mostly within-sector or
if cross-sector spillovers play an important role, we estimate our baseline
regression but including FDI in other sectors as an additional explaining
variable. The coefficient on this variable captures the cross-sector spillovers
36
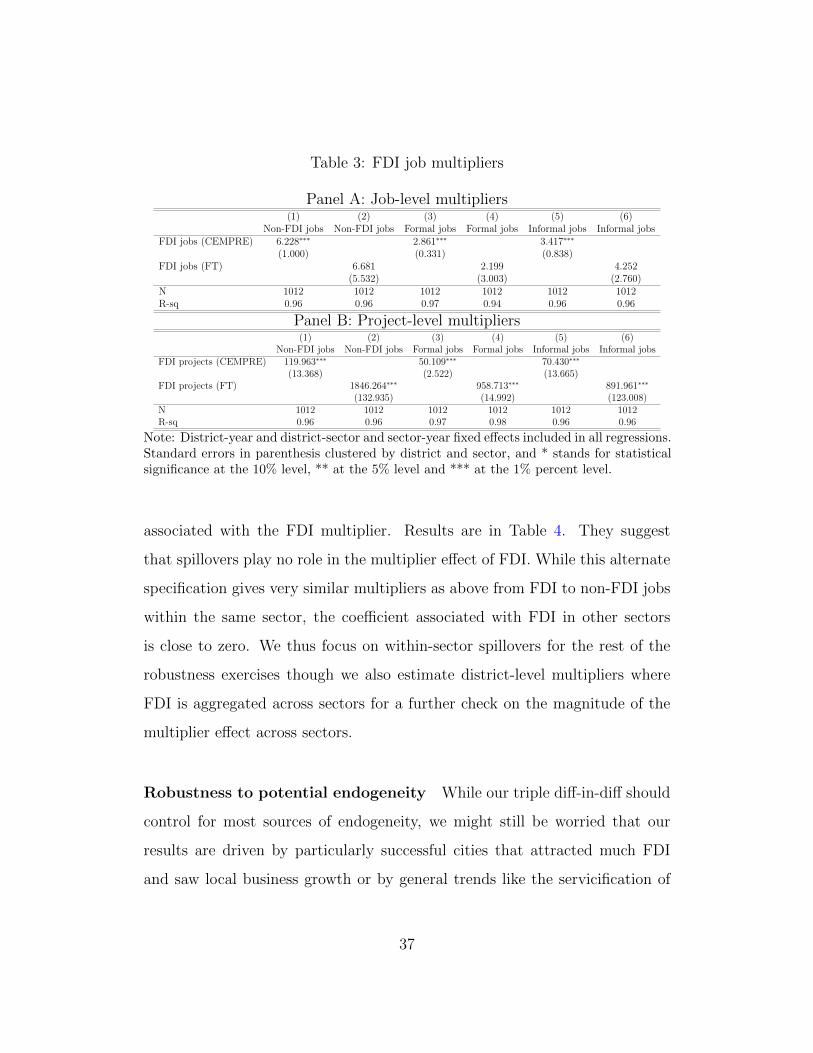
Table 3: FDI job multipliers
Panel A: Job-level multipliers(1) (2) (3) (4) (5) (6)
Non-FDI jobs Non-FDI jobs Formal jobs Formal jobs Informal jobs Informal jobsFDI jobs (CEMPRE) 6.228∗∗∗ 2.861∗∗∗ 3.417∗∗∗
(1.000) (0.331) (0.838)FDI jobs (FT) 6.681 2.199 4.252
(5.532) (3.003) (2.760)N 1012 1012 1012 1012 1012 1012R-sq 0.96 0.96 0.97 0.94 0.96 0.96
Panel B: Project-level multipliers(1) (2) (3) (4) (5) (6)
Non-FDI jobs Non-FDI jobs Formal jobs Formal jobs Informal jobs Informal jobsFDI projects (CEMPRE) 119.963∗∗∗ 50.109∗∗∗ 70.430∗∗∗
(13.368) (2.522) (13.665)FDI projects (FT) 1846.264∗∗∗ 958.713∗∗∗ 891.961∗∗∗
(132.935) (14.992) (123.008)N 1012 1012 1012 1012 1012 1012R-sq 0.96 0.96 0.97 0.98 0.96 0.96
Note: District-year and district-sector and sector-year fixed effects included in all regressions.Standard errors in parenthesis clustered by district and sector, and * stands for statisticalsignificance at the 10% level, ** at the 5% level and *** at the 1% percent level.
associated with the FDI multiplier. Results are in Table 4. They suggest
that spillovers play no role in the multiplier effect of FDI. While this alternate
specification gives very similar multipliers as above from FDI to non-FDI jobs
within the same sector, the coefficient associated with FDI in other sectors
is close to zero. We thus focus on within-sector spillovers for the rest of the
robustness exercises though we also estimate district-level multipliers where
FDI is aggregated across sectors for a further check on the magnitude of the
multiplier effect across sectors.
Robustness to potential endogeneity While our triple diff-in-diff should
control for most sources of endogeneity, we might still be worried that our
results are driven by particularly successful cities that attracted much FDI
and saw local business growth or by general trends like the servicification of
37

Table 4: FDI job multipliers - with spillovers
Panel A: Job-level multipliers and spillovers(1) (2) (3) (4) (5) (6)
Non-FDI jobs Non-FDI jobs Formal jobs Formal jobs Informal jobs Informal jobsFDI jobs (CEMPRE) 5.862∗∗∗ 2.692∗∗∗ 3.111∗∗∗
(1.196) (0.448) (0.896)FDI jobs in other sectors (CEMPRE) -0.016 -0.005 -0.012
(0.049) (0.005) (0.048)FDI jobs (FT) 5.903 2.948 2.787
(5.933) (3.307) (2.555)FDI jobs in other sectors (FT) 0.123 0.079∗ 0.041
(0.214) (0.038) (0.190)N 1052 1052 2484 1052 1052 1052R-sq 0.94 0.94 0.96 0.93 0.94 0.94
Panel B: Project-level multipliers and spillovers(1) (2) (3) (4) (5) (6)
Non-FDI jobs Non-FDI jobs Formal jobs Formal jobs Informal jobs Informal jobsFDI projects (CEMPRE) 119.573∗∗∗ 51.247∗∗∗ 67.702∗∗∗
(4.857) (1.651) (6.537)FDI projects in other sectors (CEMPRE) -0.254 0.011 -0.293
(1.231) (0.104) (1.204)FDI projects (FT) 1826.252∗∗∗ 995.159∗∗∗ 823.338∗∗∗
(43.612) (0.208) (51.891)FDI projects in other sectors (FT) 0.743 1.886 -1.640
(22.795) (2.683) (22.135)N 1052 1052 2484 1052 1052 1052R-sq 0.94 0.94 0.97 0.98 0.94 0.94
Note: District-sector and sector-year fixed effects included in all regressions. District-yearfixed effects are not included as they are collinear with the sum of the two explainingvariables. Standard errors in parenthesis clustered by district and sector, and * stands forstatistical significance at the 10% level, ** at the 5% level and *** at the 1% percent level.District-sector and sector-year fixed effects included in all regressions.
the economy. To test for this possibility we create 100 placebo FDI projects by
shuffling existing projects within sector-year (as well as within district-year).
Figure 12 gives the distribution of these placebo estimates. The fact that
these are distributed around zero and that our estimated multiplier of 6.2 is
far to the right of the distribution’s right tail increase our confidence that our
estimates are not picking up general city or sector effects. It suggests that the
FDI projects are not correlated with local jobs in all districts but only in the
districts where they actually take place.
As mentioned earlier we can nonetheless be worried that the distribution
of FDI projects and jobs across cities and sectors is driven by expectations
38

FIGURE 12Placebo FDI job multipliers
Baseline estimate
0
.5
1
1.5
−2 0 2 4 6 8
FDI job multiplier
100 shuffles within sector−year
100 shuffles within district−year
Note: The 100 placebo allocations of FDI jobs were generated by reshuffling randomly theFDI jobs within district-years and within sector-years. Their effects on non-FDI jobs wereestimated using our baseline specification (Panel A of Table 3). The vertical red line givesour baseline estimate (column 1).
within Mozambique that also drive non-FDI business and job creation. To
confirm that our results are robust to this potential endogeneity we use a
Bartik-like instrumental variable strategy. The latter is based on the idea that
the distribution of discovery-driven FDI bonanzas across sectors and cities
follows a distinctive pattern that is unrelated to the country specificities.
Figure 13 illustrates the effect of discoveries on FDI inflows for Ghana,
Ethiopia, Tanzania as well as Mozambique. These four sub-Saharan African
39

FIGURE 13FDI: Discovery countries vs. synthetic counterfactuals
020
0040
0060
0080
00N
on−
extr
actio
n F
DI
2003 2005 2007 2009 2011 2013
GHA synthetic GHA
010
0020
0030
0040
0050
00N
on−
extr
actio
n F
DI
2003 2005 2007 2009 2011 2013
ETH synthetic ETH
020
0040
0060
0080
00N
on−
extr
actio
n F
DI
2003 2005 2007 2009 2011 2013
MOZ synthetic MOZ
050
010
0015
0020
00N
on−
extr
actio
n F
DI
2003 2005 2007 2009 2011 2013
TZA synthetic TZA
Note: Discovery countries are defined as countries with at least one giant discoverysince 2003 (shown in Figure 3). Synthetic counterfactuals are weighted averagesof non-extraction FDI in other countries. The weights are generated so that thedifferences in FDI inflows between the country and its synthetic version are minimizedprior to the discovery. Each country is thus compared to a synthetic version of itself,similar in terms of FDI inflows prior to the discovery. See Abadie et al. (2010) fordetails on this method.
40

FIGURE 14FDI and FDI Jobs in post-discovery years
.2
.4
.6
.8
1
Cu
mu
lative
FD
I jo
b s
ha
re
0 5 10 15
City ranking
Ethiopia
Ghana
Mozambique
Tanzania
.2
.4
.6
.8
1
Cu
mu
lative
FD
I in
ve
st
sh
are
0 5 10 15
City ranking
Ethiopia
Ghana
Mozambique
Tanzania
0 .2 .4 .6 .8 1 0 .2 .4 .6 .8 1
Transportation
Services
Manufacturing
Extraction
Construction
Transportation
Services
Manufacturing
Extraction
Construction
Transportation
Services
Manufacturing
Extraction
Construction
Transportation
Services
Manufacturing
Extraction
Construction
Ethiopia Ghana
Mozambique Tanzania
Share of FDI jobs
0 .2 .4 .6 .8 0 .2 .4 .6 .8
Transportation
Services
Manufacturing
Extraction
Construction
Transportation
Services
Manufacturing
Extraction
Construction
Transportation
Services
Manufacturing
Extraction
Construction
Transportation
Services
Manufacturing
Extraction
Construction
Ethiopia Ghana
Mozambique Tanzania
Share of FDI
Note: Post-discovery years are as in Figure 13. The numbers are based on fDiMarkets data.
countries announced their first giant discoveries in the late 2000s. The
fDiMarkets data suggests that foreign firms moved in en masse in the years
following the first discovery and a counterfactual analysis suggests that this
FDI wave would not have happened without the giant discovery. Indeed,
the size of non-extraction FDI inflows in the synthetic controls, i.e. weighted
averages of non-extraction FDI in non-OECD countries with no discoveries,
remains flat.
The distribution of FDI booms, measured in FDI jobs as well as projects,
across sectors and cities in these four African countries is shown in Figure 14.
41

While the distributions of FDI jobs across cities ranked by population seem
to follow similar power laws across countries, the distribution of FDI jobs
across sectors is more random. Nonetheless, we can use the average shares
of FDI jobs by sectors and city rank in the three other African countries
to construct an instrument for FDI in Mozambique. The intuition is that
the common distributional features of FDI in countries with similar giant
discoveries provides variation across districts and sectors that is not driven
by Mozambique-specific expectations but rather by the usual pull forces at
play in discovery countries. We thus multiply the average of FDI shares
across sectors and city rank in post-discovery years in Ghana, Ethiopia and
Tanzania (we assume zero FDI jobs in 2002) and use it to instrument FDI
jobs in Mozambique. Our instrument can thus be thought of as Bartik-like,
but instead of using the usual initial local industry shares we use shares from
other countries as our instrument.17
The first stage results in column (1) of Table 5 confirm the relevance of our
instruments. For both FDI jobs and FDI projects the instrument effect is
significant at the 1% level and its F statistic is way above 10, confirming it
is not weak. The second-stage results in columns (2-4) are not statistically
different from our simple triple diff-in-diff estimates. The number of non-FDI
jobs caused by FDI jobs is estimated at 6.52 while FDI projects are found to
cause 117.4 extra jobs on average. We also confirm our previous results that
the multiplier effect is slightly larger on the informal sector. All in all these
IV estimates increase our confidence in our previous results and confirm the
large job-creating effects of FDI projects.
17See Goldsmith-Pinkham et al. (2017) for a recent review of Bartik instruments.
42

Table 5: FDI job multipliers - Instrumental variable estimates
Panel A: Job-level multipliers(1) (2) (3) (4)
FDI jobs (CEMPRE) Non-FDI jobs Formal jobs Informal jobsInstrument 1.492∗∗∗
(0.068)FDI jobs (CEMPRE) 6.515∗∗∗ 1.855∗∗∗ 4.166∗∗∗
(1.527) (0.153) (1.525)N 1012 1012 1012 1012R-sq 0.12 0.08 0.51 0.02F IV 476.65 476.65 476.65
Panel B: Project-level multipliers(1) (2) (3) (4)
FDI projects (CEMPRE) Non-FDI jobs Formal jobs Informal jobsInstrument 13.044∗∗∗
(0.238)FDI projects (CEMPRE) 117.408∗∗∗ 50.728∗∗∗ 66.504∗∗∗
(14.781) (1.298) (15.427)N 1012 1012 1012 1012R-sq 0.87 0.10 0.61 0.04F IV 2996.85 2996.85 2996.85
Note: District-year, district-sector and sector-year fixed effects included in all regressions.Standard errors in parenthesis clustered by district, and * stands for statistical significanceat the 10% level, ** at the 5% level and *** at the 1% percent level. The IV is the product ofthe average FDI job shares by sector and by ranked cities in post-discovery years in Ghana,Ethiopia, and Tanzania.
Additional results In Table 6 we further decompose the job multiplier by
gender and skills, where skilled individuals are those with at least a completed
secondary education. Since this information is only available in the household
survey, and not in the firm census, we can only divide total jobs by gender
and skills, rather than strictly non-FDI jobs. The multiplier in column (1)
in panel A suggests that an extra FDI job is associated with 7.2 total jobs,
i.e. the 6.2 additional jobs estimated above in Table 3, plus the FDI job
itself. The decomposition of this multiplier by gender suggests that FDI is
especially beneficial for women. It suggests a multiplier of 4.7 for women and
2.5 for men. Note that these numbers also include the FDI job itself. This
43

gender bias is robust to using fDiMarkets (FT) data as well as to using FDI
project numbers. In panel C the estimates suggest that an extra FDI project
is associated with around 135 new jobs, 42 for men and 94 for women. The
decomposition by skills suggest a skill-biased multiplier, with FDI jobs being
associated with a reduction in unskilled employment and a large increase in
skilled employment. The baseline numbers suggest that the 7.2 total jobs
created are 8.4 skilled jobs created and 1.2 unskilled jobs destroyed. This skill
bias also shows up in the 3 other specifications. To investigate this gender and
skill bias further we estimate our regression model but at the individual level
rather than aggregated by sector. Results are in appendix A.5.
In Table 8 we explore the relationship between the FDI bonanza and various
outcomes at the district level. Consistent with our previous results we find
that one additional FDI job is associated with nearly 6 additional jobs at
the district level (Column 2 in Panel B). Note that the total number of jobs
created at the district level is very close to the estimate from our baseline
specification in which we explore the number of jobs created within the same
sector as the FDI project. This suggests that backward and forward linkages
from multinationals to local firms may explain most of the multiplier effect.
Moreover, one additional FDI job increases the population by approximately
3.5 individuals and pulls on average slightly more than 3 individuals into the
labor force. At the same time, the number of unemployed increases by less than
1 implying a decrease in the unemployment rate. Thus, our results suggest
that most of the increase in the local labor force is absorbed by a large increase
in local labor demand.
In order to better grasp the magnitude of our benchmark estimate of a
multiplier of 6.2 we proceed with a thought experiment. If we removed all
44
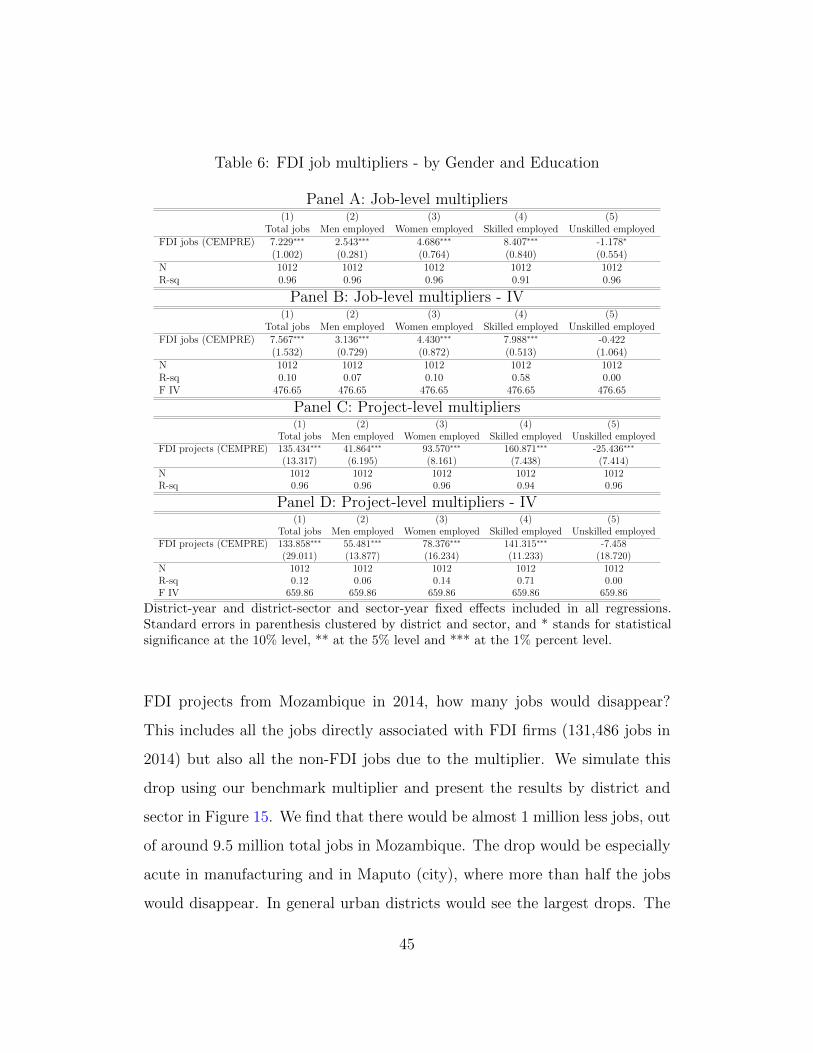
Table 6: FDI job multipliers - by Gender and Education
Panel A: Job-level multipliers(1) (2) (3) (4) (5)
Total jobs Men employed Women employed Skilled employed Unskilled employedFDI jobs (CEMPRE) 7.229∗∗∗ 2.543∗∗∗ 4.686∗∗∗ 8.407∗∗∗ -1.178∗
(1.002) (0.281) (0.764) (0.840) (0.554)N 1012 1012 1012 1012 1012R-sq 0.96 0.96 0.96 0.91 0.96
Panel B: Job-level multipliers - IV(1) (2) (3) (4) (5)
Total jobs Men employed Women employed Skilled employed Unskilled employedFDI jobs (CEMPRE) 7.567∗∗∗ 3.136∗∗∗ 4.430∗∗∗ 7.988∗∗∗ -0.422
(1.532) (0.729) (0.872) (0.513) (1.064)N 1012 1012 1012 1012 1012R-sq 0.10 0.07 0.10 0.58 0.00F IV 476.65 476.65 476.65 476.65 476.65
Panel C: Project-level multipliers(1) (2) (3) (4) (5)
Total jobs Men employed Women employed Skilled employed Unskilled employedFDI projects (CEMPRE) 135.434∗∗∗ 41.864∗∗∗ 93.570∗∗∗ 160.871∗∗∗ -25.436∗∗∗
(13.317) (6.195) (8.161) (7.438) (7.414)N 1012 1012 1012 1012 1012R-sq 0.96 0.96 0.96 0.94 0.96
Panel D: Project-level multipliers - IV(1) (2) (3) (4) (5)
Total jobs Men employed Women employed Skilled employed Unskilled employedFDI projects (CEMPRE) 133.858∗∗∗ 55.481∗∗∗ 78.376∗∗∗ 141.315∗∗∗ -7.458
(29.011) (13.877) (16.234) (11.233) (18.720)N 1012 1012 1012 1012 1012R-sq 0.12 0.06 0.14 0.71 0.00F IV 659.86 659.86 659.86 659.86 659.86
District-year and district-sector and sector-year fixed effects included in all regressions.Standard errors in parenthesis clustered by district and sector, and * stands for statisticalsignificance at the 10% level, ** at the 5% level and *** at the 1% percent level.
FDI projects from Mozambique in 2014, how many jobs would disappear?
This includes all the jobs directly associated with FDI firms (131,486 jobs in
2014) but also all the non-FDI jobs due to the multiplier. We simulate this
drop using our benchmark multiplier and present the results by district and
sector in Figure 15. We find that there would be almost 1 million less jobs, out
of around 9.5 million total jobs in Mozambique. The drop would be especially
acute in manufacturing and in Maputo (city), where more than half the jobs
would disappear. In general urban districts would see the largest drops. The
45

FIGURE 15FDI projects and job creation in 2014
0 2 4 6 8
Extraction
Health
Transportation
Administration
Education
Construction
Manufacturing
Services
Agriculture
Jobs by sector (millions)
Share due to FDI
Note: The dark red part in the bar graph indicates the number of jobs due to FDI as perour multiplier estimate of 6.228 (column (1) in Table 3). The heat map gives the share ofnon-FDI jobs due to the same FDI multiplier by district.
number of jobs in services and even agriculture would also drop substantially,
given the large number of people employed in these sectors.
As a final back-of-the-envelop calculation we can estimate the number of jobs
that are due only to the FDI caused by the discovery. Based on the fDiMarkets
job numbers and the counterfactual exercise in Figure 1, 21,500 jobs out of the
25,500 created by FDI in the 5 years following the first giant discovery in 2009
can be thought of as caused by the discovery. Hence, based on our multiplier
estimate of 6.2, around 133,300 extra jobs were caused by FDI projects that
would not have happened if it were not for the discovery. This is a lower bound
as it is based on the fDiMarkets job numbers.
46

5 CONCLUSION
This paper suggests that across countries giant oil and gas discoveries lead
to FDI bonanzas. FDI in non-extractive sectors increases by 58% in the
2 years following a giant discovery. This result is driven by the extensive
margin, i.e. by new projects, in new sectors, from new source countries. As
discoveries precede production by 5 years on average, we argue that the FDI
effect is driven by expectations. Giant oil and gas discoveries could thus act
as news shocks creating expectations of future income and driving an influx of
diversified investment which in turn could provide an opportunity for a growth
takeoff (Murphy et al., 1989). Our paper also suggests that FDI bonanzas
triggered by giant discoveries can have large job-creation effects. In the context
of Mozambique, our preferred estimate of the FDI multiplier suggests that
one extra FDI project creates around 120 additional non-FDI jobs in its host
district and sector. This result points to the importance of estimating FDI
multipliers in poor countries to better gauge the role of FDI in development.
Overall our results suggest that resources can be a blessing rather than a curse.
Yet this does not mean that growth and diversification follow automatically.
The Mozambique FDI bonanza occurred while the government accumulated
an unsustainable level of debt and many of the FDI projects may only have
short-run effects. According to O Pais the FDI boom in northern Mozambique
went from Eldorado to nightmare when a coal project failed to materialize.
FDI bonanzas do provide a growth opportunity but discoveries have other
side effects. Nonetheless the FDI channel needs to be taken into account when
analysing the effects of natural resources on economic development, especially
since the literature has mostly argued that resource wealth in developing
countries may lead to premature de-industrialization (e.g. Rodrik 2016).
47

Table 7: FDI multipliers - District level regressions
Panel A: Job-level multipliers(1) (2) (3) (4)
Total jobs Non-FDI jobs Formal jobs Informal jobsFDI jobs (CEMPRE) 5.278∗∗∗ 4.424∗∗∗ 2.071∗∗∗ 2.200∗
(1.351) (1.287) (0.576) (1.271)N 266 266 266 266R-sq 0.14 0.10 0.74 0.03
Panel B: Job-level multipliers - IV(1) (2) (3) (4) (5)
FDI jobs (CEMPRE) Total jobs Non-FDI jobs Formal jobs Informal jobsInstrument 4.459∗∗∗
(0.245)FDI jobs (CEMPRE) 5.903∗∗∗ 4.921∗∗∗ 2.712∗∗∗ 1.976∗∗
(0.821) (0.818) (0.083) (0.864)N 266 266 266 266 266R-sq 0.68 0.14 0.10 0.67 0.03F IV 331.15 331.15 331.15 331.15
Panel C: Project-level multipliers(1) (2) (3) (4)
Total jobs Non-FDI jobs Formal jobs Informal jobsFDI projects (CEMPRE) 133.524∗∗∗ 111.019∗∗∗ 59.646∗∗∗ 46.385
(29.650) (29.216) (3.174) (29.915)N 266 266 266 266R-sq 0.13 0.09 0.91 0.02
Panel D: Project-level multipliers - IV(1) (2) (3) (4) (5)
FDI projects (CEMPRE) Total jobs Non-FDI jobs Formal jobs Informal jobsInstrument 0.197∗∗∗
(0.010)FDI projects (CEMPRE) 133.772∗∗∗ 111.508∗∗∗ 61.448∗∗∗ 44.772∗∗
(19.738) (19.490) (1.649) (19.951)N 266 266 266 266 266R-sq 0.90 0.13 0.09 0.91 0.02F IV 356.61 356.61 356.61 356.61
District and year fixed effects included in all regressions. Standard errors in parenthesisclustered by district and sector, and * stands for statistical significance at the 10% level,** at the 5% level and *** at the 1% percent level.
48

Table 8: Additional district level regressions
Panel A: The effect of an FDI job
(1) (2) (3) (4)Pop (15-59) Employed Unemployed Inactive
FDI jobs (CEMPRE) 3.726∗∗ 5.278∗∗∗ 0.761∗∗∗ -2.312∗∗
(1.587) (1.348) (0.245) (0.916)N 266 266 266 266R-sq 0.96 0.92 0.94 0.97
Panel B: The effect of an FDI job - IV
(1) (2) (3) (4)Pop (15-59) Employed Unemployed Inactive
FDI jobs (CEMPRE) 3.518∗∗∗ 5.903∗∗∗ 0.822∗∗∗ -3.207∗∗∗
(1.207) (0.819) (0.261) (0.292)N 266 266 266 266R-sq 0.96 0.92 0.94 0.97F IV 332.40 332.40 332.40 332.40
Panel C: The effect of an FDI project
(1) (2) (3) (4)Pop (15-59) Employed Unemployed Inactive
FDI projects (CEMPRE) 85.569∗∗ 133.524∗∗∗ 22.817∗∗ -70.772∗∗∗
(39.735) (29.594) (9.284) (7.532)N 266 266 266 266R-sq 0.96 0.92 0.94 0.98
Panel D: The effect of an FDI project - IV
(1) (2) (3) (4)Pop (15-59) Employed Unemployed Inactive
FDI projects (CEMPRE) 79.717∗∗∗ 133.772∗∗∗ 18.625∗∗∗ -72.680∗∗∗
(27.903) (19.700) (5.971) (6.449)N 266 266 266 266R-sq 0.96 0.92 0.94 0.98F IV 357.97 357.97 357.97 357.97
District and year fixed effects included in all regressions. Standard errors in parenthesisclustered by district and sector, and * stands for statistical significance at the 10% level,** at the 5% level and *** at the 1% percent level.
49

References
Abadie, A., A. Diamond, and J. Hainmueller (2010): “Synthetic
Control Methods for Comparative Case Studies: Estimating the Effect of
Californias Tobacco Control Program,” Journal of the American Statistical
Association, 105, 493–505.
Adelman, M. (1962): “Petroleum Production Costs in General,” Journal of
Industrial Economics, 3–24.
Aizenman, J. and V. Sushko (2011): “Capital flows: Catalyst or Hindrance
to economic takeoffs?” NBER Working Papers 17258, National Bureau of
Economic Research, Inc.
Akerlof, G. and R. Shiller (2009): Animal Spirits: How Human
Psychology Drives the Economy, and Why It Matters for Global Capitalism,
Princeton University Press.
Alfaro, L. and A. Charlton (2013): “Growth and the Quality of Foreign
Direct Investment,” in The Industrial Policy Revolution I: The Role of
Government Beyond Ideology, ed. by J. E. Stiglitz and J. Y. Lin, London:
Palgrave Macmillan UK, 162–204.
Alfaro, L., S. Kalemli-Ozcan, and V. Volosovych (2008): “Why
Doesn’t Capital Flow from Rich to Poor Countries? An Empirical
Investigation,” The Review of Economics and Statistics, 90, 347–368.
Allcott, H. and D. Keniston (2014): “Dutch Disease or Agglomeration?
The Local Economic Effects of Natural Resource Booms in Modern
America,” Working Paper 20508, National Bureau of Economic Research.
50

Aragon, F. M. and J. P. Rud (2013): “Natural Resources and Local
Communities: Evidence from a Peruvian Gold Mine,” American Economic
Journal: Economic Policy, 5, 1–25.
Arezki, R., V. A. Ramey, and L. Sheng (2017): “News Shocks in Open
Economies: Evidence from Giant Oil Discoveries*,” The Quarterly Journal
of Economics, 132, 103.
Arif, S. and C. M. C. Lee (2014): “Aggregate Investment and Investor
Sentiment,” The Review of Financial Studies, 27, 3241–3279.
Atkin, D., B. Faber, and M. Gonzalez-Navarro (2015): “Retail
Globalization and Household Welfare: Evidence from Mexico,” Working
Paper 21176, National Bureau of Economic Research.
Axarloglou, K. and M. Pournarakis (2007): “Do All Foreign Direct
Investment Inflows Benefit the Local Economy?” The World Economy, 30,
424–445.
Basker, E. (2005): “Job Creation or Destruction? Labor Market Effects
of Wal-Mart Expansion,” The Review of Economics and Statistics, 87,
174–183.
Blanas, S., A. Seric, and C. Viegelahn (2017): “Jobs, FDI and
Institutions in Sub-Saharan Africa: Evidence from Firm-Level Data,” Tech.
rep.
Blonigen, B. A. and J. Piger (2014): “Determinants of foreign direct
investment,” Canadian Journal of Economics, 47, 775–812.
51

Blundell, R., M. Brewer, A. Duncan, H. Reed, and A. Shephard
(2004): “The employment impact of recent labour market reforms: A Bank
of England Report,” .
Borensztein, E., J. D. Gregorio, and J.-W. Lee (1998): “How does
foreign direct investment affect economic growth?” Journal of International
Economics, 45, 115 – 135.
Burbidge, J. B., L. Magee, and A. L. Robb (1988): “Alternative
Transformations to Handle Extreme Values of the Dependent Variable,”
Journal of the American Statistical Association, 83, pp. 123–127.
Carkovic, M. and R. Levine (2005): “Does foreign direct investment
accelerate economic growth,” in Does Foreign Direct Investment Promote
Development?, Institute for International Economics, 195–220.
Cavalcanti, T., D. D. Mata, and F. Toscani (2015): “Winning the
Oil Lottery: The Impact of Natural Resource Extraction on Growth,” Tech.
rep.
Corden, W. M. and J. P. Neary (1982): “Booming sector and
de-industrialisation in a small open economy,” The economic journal,
825–848.
Cotet, A. M. and K. K. Tsui (2013): “Oil and conflict: what does
the cross country evidence really show?” American Economic Journal:
Macroeconomics, 5, 49–80.
Cust, J. and S. Poelhekke (2015): “The Local Economic Impacts of
Natural Resource Extraction,” Annual Review of Resource Economics.
52

Cust, J. F. and D. Mihalyi (2017): “Evidence for a presource curse ?
oil discoveries, elevated expectations, and growth disappointments,” Policy
Research Working Paper Series 8140, The World Bank.
Davies, R. B. and K. C. Vadlamannati (2013): “A race to the bottom
in labor standards? An empirical investigation,” Journal of Development
Economics, 103, 1 – 14.
De Mello Jr, L. R. (1997): “Foreign direct investment in developing
countries and growth: A selective survey,” The Journal of Development
Studies, 34, 1–34.
Eisner, R. (1978): Factors in Business Investment, National Bureau of
Economic Research, Inc.
fDiIntelligence (2016): “THE fDi REPORT 2016: Global greenfield
investment trends,” Report, The Financial Times Ltd.
Gennaioli, N., Y. Ma, and A. Shleifer (2016): “Expectations and
Investment,” NBER Macroeconomics Annual, 30, 379–431.
Glaeser, E. (2010): Agglomeration Economics, National Bureau of
Economic Research Conference Report, University of Chicago Press.
Goldsmith-Pinkham, P., I. Sorkin, and H. Swift (2017): “Bartik
Instruments: What, When, Why, and How,” Tech. rep.
Gollin, D., R. Jedwab, and D. Vollrath (2016): “Urbanization with
and without industrialization,” Journal of Economic Growth, 21, 35–70.
53

Gorg, H. and E. Strobl (2001): “Multinational Companies and
Productivity Spillovers: A Meta-analysis,” Economic Journal, 111,
F723–39.
Gourinchas, P.-O. and O. Jeanne (2013): “Capital Flows to Developing
Countries: The Allocation Puzzle,” The Review of Economic Studies, 80,
1484.
Herger, N. and S. McCorriston (2016): “Horizontal, Vertical, and
Conglomerate Cross-Border Acquisitions,” IMF Economic Review, 64,
319–353.
Hidalgo, C. A. and R. Hausmann (2009): “The building blocks of
economic complexity,” Proceedings of the National Academy of Sciences,
106, 10570–10575.
Hirschman, A. O. (1957): “Investment Policies and ”Dualism” in
Underdeveloped Countries,” The American Economic Review, 47, 550–570.
Horn, M. M. K. (2011): “Giant Oil and Gas Fields of the World,”
http://www.datapages.com/AssociatedWebsites/GISOpenFiles/HornGiantFields.aspx.
Jacobsen, G. D. and D. P. Parker (2014): “The economic aftermath
of resource booms: evidence from boomtowns in the American West,” The
Economic Journal.
James, A. (2015): “The resource curse: A statistical mirage?” Journal of
Development Economics, 114, 55–63.
Javorcik, B. S. (2004): “Does Foreign Direct Investment Increase the
Productivity of Domestic Firms? In Search of Spillovers Through Backward
Linkages,” American Economic Review, 94, 605–627.
54

——— (2015): “Does FDI Bring Good Jobs to Host Countries?” World Bank
Research Observer, 30, 74–94.
Kavanagh, M. (2013): “Abandoned oil discoveries enjoy revival,” Financial
Times.
Keynes, J. (1936): The general theory of employment, interest and money,
Books for college libraries, Harcourt, Brace.
Kotsadam, A. and A. Tolonen (2016): “African Mining, Gender, and
Local Employment,” World Development, 83, 325 – 339.
Lei, Y.-H. and G. Michaels (2014): “Do giant oilfield discoveries
fuel internal armed conflicts?” Journal of Development Economics, 110,
139–157.
Lewis, W. A. (1954): “Economic Development with Unlimited Supplies of
Labour,” The Manchester School, 22, 139–191.
Lipsey, R. E. (2004): The labour market effects of US FDI in developing
countries, International Labour Organization.
MacKinnon, J. G. and L. Magee (1990): “Transforming the Dependent
Variable in Regression Models,” International Economic Review, 31, 315–39.
Mann, P., L. Gahagan, and M. B. Gordon (2001): “Tectonic setting of
the world’s giant oil fields,” World Oil, 222, 78–84.
Marelli, E., L. Resmini, and M. Signorelli (2014): “The effects of
inward FDI on regional employment in Europe,” Romanian Journal of
Regional Science, 8, 1–23.
55

Matsuyama, K. (1992): “Agricultural productivity, comparative advantage,
and economic growth,” Journal of Economic Theory, 58, 317–334.
McLaren, J. and M. Yoo (2016): “FDI and Inequality in Vietnam: An
Approach with Census Data,” Working Paper 22930, National Bureau of
Economic Research.
Miller, R. E. and P. D. Blair (2009): Input-output analysis: foundations
and extensions, Cambridge University Press.
Moretti, E. (2010): “Local Multipliers,” American Economic Review, 100,
373–377.
Murphy, K. M., A. Shleifer, and R. W. Vishny (1989):
“Industrialization and the Big Push,” Journal of Political Economy, 97,
1003–26.
Neumark, D., J. Zhang, and S. Ciccarella (2008): “The effects
of Wal-Mart on local labor markets,” Journal of Urban Economics, 63,
405–430.
Olney, W. W. (2013): “A race to the bottom? Employment protection and
foreign direct investment,” Journal of International Economics, 91, 191 –
203.
Poelhekke, S. and F. van der Ploeg (2013): “Do Natural Resources
Attract Nonresource FDI?” The Review of Economics and Statistics, 95,
1047–1065.
——— (2015): “Green Havens and Pollution Havens,” The World Economy,
38, 1159–1178.
56
Robertson CGG (2016): “Tellus sedimentary basins of the world,”
http://www.robertson-cgg.com/products/tellus/, accessed: 2016-05-03.
Rodrik, D. (2016): “Premature deindustrialization,” Journal of Economic
Growth, 21, 1–33.
Ross, M. L. (2012): The Oil Curse: How Petroleum Wealth Shapes the
Development of Nations, Princeton University Press.
——— (2017): “What Do We Know About Economic Diversification in
Oil-Producing Countries?” Tech. rep.
Sachs, J. D. and A. M. Warner (1999): “The big push, natural resource
booms and growth,” Journal of Development Economics, 59, 43 – 76.
——— (2001): “The curse of natural resources,” European Economic Review,
45, 827–838.
Silva, J. M. C. S. and S. Tenreyro (2006): “The Log of Gravity,” The
Review of Economics and Statistics, 88, 641–658.
Smith, B. (2014): “Dutch Disease and the Oil and Boom and Bust,” Tech.
rep.
Tsui, K. K. (2011): “More Oil, Less Democracy: Evidence from Worldwide
Crude Oil Discoveries,” Economic Journal, 121, 89–115.
van der Ploeg, F. (2011): “Natural Resources: Curse or Blessing?” Journal
of Economic Literature, 49, 366–420.
van der Ploeg, F. and A. J. Venables (2013): “Absorbing a windfall
of foreign exchange: Dutch disease dynamics,” Journal of Development
Economics, 103, 229–243.
57

Venables, A. J. (2016): “Using Natural Resources for Development: Why
Has It Proven So Difficult?” Journal of Economic Perspectives, 30, 161–84.
Wills, S. (2014): “Optimal Monetary Responses to News of an Oil
Discovery,” OxCarre Working Papers 121, Oxford Centre for the Analysis
of Resource Rich Economies, University of Oxford.
Wood Mackenzie (2015): “Upstream Data Tool,”
http://www.woodmac.com/, accessed: 2015-05-03.
58

A FOR ONLINE PUBLICATION: APPENDIX
A.1 Additional descriptive statistics - Cross country data
Table 9 summarizes the key variables of our cross country analysis. It is particularlyinformative to compare the means of variables calculated using all FDI projects and meansof variables which are calculated using only non-extractive FDI. First, the descriptivesconfirm that the number of extractive projects is much smaller relative to the totalnumber of non-extractive projects. Second, while extractive projects are larger on average,non-extractive projects have much greater potential to generate jobs. This is consistentwith our prior that the resource sector is capital intensive relative to other sectors.
Table 9: Summary statisticsVariable N Mean SD Min Max
Total FDI (USD million) 1992 3046 9781 0 1.28e+05Non-extraction FDI (USD million) 1992 2713 9446 0 1.25e+05FDI projects 1992 43 135 0 1624Non-extraction FDI projects 1992 42 134 0 1613Jobs created 1992 9538 35492 0 4.50e+05Jobs created (non-extraction) 1992 9219 35267 0 4.49e+05Avg project size 1992 92 211 0 4000Avg non-extraction project size 1992 68 173 0 4000Nb source countries 1992 8.50 10.30 0 55Nb sub-sectors 1992 16.33 27.70 0 186Nb sectors 1992 8.30 9.57 0 39FDI (USD Million, UNCTAD) 1992 3283 11263 0 1.29e+05Discovery in past 2 years 1992 0.07 0.25 0 1
In Figure 16 we summarize the number of FDI projects, source countries and targetsectors in discovery countries. China and India received more than 500 FDI projectsper year during 2003-2014 while smaller countries such as Colombia and Egypt receivedbetween 50 and 100 projects. The right panel shows that larger countries receive FDIfrom a larger number of countries and in more sectors. For example, Brazil and Vietnamreceived FDI from around 30 source countries and in 30 target sectors out of 39 possiblesectors.
A.2 fDiMarkets vs. UNCTAD FDI data
As an additional robustness test we employ UNCTAD data in our analysis. WhileUNCTAD is the most commonly used source of FDI across countries, it does not allow us
59

FIGURE 16The extensive margins of FDI in discovery countries
1335
752
0 100 200 300 400 500
Non−extraction projects
LBRSLEBOLSDNCYPETHIRNLBYVENMOZTZAIRQ
AGOAZEGHAKAZEGYCOLSAUMYSVNMBRARUSIND
CHN
0 10 20 30 40 50
LBRSLESDNBOLCYPLBYETHIRN
MOZTZAVENIRQ
AGOGHAAZEKAZEGYSAUCOLMYSVNMBRARUSIND
CHN
Sectors Source countries
Note: The bars show the average number of projects, source countries and target sectors in discoverycountries in the period 2003-2014. There are a total of 39 sectors in the fDiMarkets data.
to isolate non-extraction FDI nor to disaggregate FDI into margins. It does however allowus to expand the sample period to 1970-2014 and, thus, increase the external validityof our results. Comparing fDiMarkets data to UNCTAD data in Figure 17 we find ahigh correlation of 0.6 between the two series. Their distributions suggest that none issystematically larger and plotting them against each other reveals that most data pointsare around the 45 degree line, suggesting the difference between the two is zero on average.We continue by re-estimating our main specification 2 using the UNCTAD data. Theresults in Table 10 confirm our baseline. We find that, irrespective of the counterfactualsample of countries, discoveries lead to a 55% increase in Total FDI. We find similarresults if we constrain the data to our main study period (2003-2014) even though thestandard errors become larger.
60

FIGURE 17FDI: UNCTAD vs fDiMarkets
45° line
0
5
10
15
UN
CT
AD
0 5 10 15
fDi Intelligence
FDI inflows
0
.05
.1
.15
0 5 10 15
UNCTAD fDi Intelligence
Note: FDI data from UNCTAD and from fDiMarkets for our sample period (2003-2014). Observationsare around the 45 degree line suggest there is no systematic difference between the two series. The rightpanel shows the similar distributions of the two variables.
A.3 Additional descriptive statistics - Mozambique
Some descriptive statistics and a precise definition of the key variables are provided inTable 12 and Table 11, respectively. Focusing on the first five rows of Table 12 there aretwo things to note. First, the discrepancies in the data on FDI jobs and FDI projectsfrom fDiMarkets and CEMPRE in 2002 and 2014. In 2002 the discrepancy arises becausefDiMarkets started collecting data in 2003 such that the reported values are equal tozero. In 2014, the discrepancy is partly because FDI projects before 2003 are not takeninto account and partly due to the fact that fDiMarkets only collects information ongreenfield FDI. We discuss the discrepancies in greater detail below. Second, notice thatthe total number of jobs created by FDI more than doubled (when accounting for theincreased number of cross sections), while the number of projects more than quadrupled.While the increase in FDI projects and employment has been substantial in absoluteterms the number of FDI jobs remained small in relative terms. Comparing the totalnumber of FDI jobs to the total number of jobs suggests that in 2002 only 1 out of 100workers was employed by a multinational. In 2014, the total number of FDI jobs addedup to slightly more than 1%. Interestingly, our calculations suggest that the size of theinformal economy is particularly large and adds up to around 95% of total employmentin both years. In the subsequent four rows of Table 12 we provide descriptives on thecharacteristics of workers by focusing on gender and education. The data suggests thatwomen are a substantial part of the labor force. In fact, women make up more than 50%of the active labor force in both years. Comparing the number of skilled and unskilled
61

Table 10: Robustness to UNCTAD data and longer time period
Period 1970-2014
(1) (2) (3)FDI FDI FDI
Discovery in past 2 years 0.484∗∗ 0.486∗∗ 0.434∗∗
(0.185) (0.185) (0.166)N 8731 7523 6527R-sq 0.73 0.74 0.75Sample countries Non-OECD Exploration Discovery
Period 2003-2014
(1) (2) (3)FDI FDI FDI
Discovery in past 2 years 0.488 0.460 0.525(0.301) (0.299) (0.307)
N 1992 1080 300R-sq 0.81 0.74 0.65Sample countries Non-OECD Exploration Discovery
Note: FDI is from UNCTAD and is in current USD. Country and year fixed effects included in allregressions. Standard errors in parenthesis clustered by country and year.
workers in the active labor force suggests that Mozambique experienced an educationalboom since the share of skilled workers increased from less than 5% to around 25% in12 years. Finally, the last four rows suggest that the labor force participation increasedfrom 83% to 86%, and that it was accompanied by a doubling of the unemployment ratefrom 3.5% to 6.5%.
A.4 fDiMarkets vs. CEMPRE FDI data
We compare our two sources of FDI data in Figure 18. The FDI stock in 2014 is muchlarger in the census data than in fDiMarkets. As mentioned above, this is partly becausefDi markets started collecting data on FDI projects in 2003 and partly because they do notcollect information on brownfield FDI. On the other hand, the firms census of 2014 includesinformation on each firm’s share of foreign ownership, and the registration year of thesurveyed firm. This allows us to estimate the number of FDI firms, as well as the number
62

Table 11: VariablesVariable Notes
FDI projects(CEMPRE)
Sum of FDI projects in district i in sector j in period t according to firmcensus (CEMPRE).
FDI jobs(CEMPRE)
Sum of FDI jobs in district i in sector j in period t according to firmcensus (CEMPRE).
FDI projects(FT)
Sum of FDI projects in district i in sector j in period t according tofDiMarkets.
FDI jobs(FT)
Sum of FDI jobs in district i in sector j in period t according tofDiMarkets.
Instrument Product of the average FDI job shares by sector and by ranked cities(biggest 15 cities) based on FDI bonanzas in Ghana, Ethiopia, andTanzania following a resource discovery.
Total jobs Sum of individuals between 15 and 59 employed according to theHousehold Survey in district i in sector j in period t.
Non-FDI jobs Sum of individuals between 15 and 59 employed according to theHousehold Survey minus the sum of FDI jobs according to the censusin district i in sector j in period t.
Formal Jobs Sum of total jobs minus the sum of FDI jobs according to the census indistrict i in sector j in period t.
Informal Jobs Sum of individuals between 15 and 59 employed according to theHousehold Survey minus sum of jobs according to the census in districti in sector j in period t.
Menemployed
Sum of men employed in district i in sector j in period t according to theHousehold Survey.
Womenemployed
Sum of women employed in district i in sector j in period t according tothe Household Survey.
Unskilledemployed
Sum of total individuals with no or a primary education employed indistrict i in sector j in period t according to the Household Survey.
Skilledemployed
Sum of total individuals with a secondary or tertiary education employedin district i in sector j in period t according to the Household Survey.
Population(15-59)
Sum of individuals between 15 and 59 in location i in period t accordingto the Household Survey.
Unemployed Sum of individuals between 15 and 59 reporting to be available for workbut not having a job in location i in period t according to the HouseholdSurvey.
Inactive Sum of total individuals between 15 and 59 reporting to be not availablefor work location i in period t according to the Household Survey.Individuals report to be not available for work due to studies, domesticresponsibilities, permanent sickness, disabilities or age.
63

Table 12: Summary statistics for 2002 and 20142002 2014
N Mean SD N Mean SD(1) (2) (3) (4) (5) (6)
FDI measureFDI projects (CEMPRE) 721 0.8 8.01 979 3.7 33.1FDI jobs (CEMPRE) 721 88.8 898.7 979 149.2 1249.8FDI projects (FT) 721 0 0 979 0.2 1.6FDI jobs (FT) 721 0 0 979 19 166.6Instrument 721 0 0 979 8.6 100.9
Jobs MeasureTotal jobs 721 11190.5 23034.3 979 10568.8 25770.4Non-FDI jobs 721 11107.4 22793.1 979 10439.1 25342.8Formal Jobs 721 348.1 2436.6 979 385.8 3304.5Informal Jobs 721 10789.5 22182.6 979 10063.1 24395.8
Workers CharacteristicsWomen 721 6174.10 15213.92 979 6065.49 15893.14Men 721 5196.01 10492.63 979 5284.96 11230.43Skilled 721 471.31 2137.58 979 2857.57 10083.75Unskilled 721 10898.80 24038.56 979 8492.87 21208.42
City LevelPopulation 135 60724.79 70813.13 135 82311.78 86494.22Total Jobs 135 49072.45 44080.63 135 66152.53 59177.10Unemployed 135 1775.60 9213.01 135 4654.45 12601.06Inactive 135 9876.75 23955.87 135 11504.79 19583.24
64

FIGURE 18Comparing the FDI datasets
0 200 400 600 800
Zambezia
Tete
Sofala
Niassa
Nampula
Maputo
Manica
Inhambane
Gaza
Cabo Delgado
FDI projects in Services (2003-2014)
fDi MarketsFirm census
0 50 100 150
Zambezia
Tete
Sofala
Niassa
Nampula
Maputo
Manica
Inhambane
Gaza
Cabo Delgado
FDI projects in Manufacturing (2003-2014)
fDi MarketsFirm census
0 5,000 10,000 15,000
Zambezia
Tete
Sofala
Niassa
Nampula
Maputo
Manica
Inhambane
Gaza
Cabo Delgado
FDI jobs in Services (2003-2014)
fDi MarketsFirm census
0 2,000 4,000 6,000
Zambezia
Tete
Sofala
Niassa
Nampula
Maputo
Manica
Inhambane
Gaza
Cabo Delgado
FDI jobs in Manufacturing (2003-2014)
fDi MarketsFirm census
0
100
200
300
FDI p
roje
cts
2000 2005 2010 2015
fDi MarketsFirm census
Services
0
10
20
30
FDI p
roje
cts
2000 2005 2010 2015
fDi MarketsFirm census
Manufacturing
0
1000
2000
3000
4000
FDI j
obs
2000 2005 2010 2015
fDi MarketsFirm census
Services
0
2000
4000
6000
8000
FDI j
obs
2000 2005 2010 2015
fDi MarketsFirm census
Manufacturing
65

of employees in those firms in 2014 and 2002 by assuming that surviving foreign-ownedfirms in 2014 were foreign-owned since their registration year, i.e. not brownfield FDI.Thus, the number of FDI projects recorded by fDiMarkets is most likely an underestimateof the true number of FDI projects, while the FDI numbers based on the firm census maybe an overestimate or an underestimate. Keeping these issues in mind we proceed bycomparing the total number of FDI projects and FDI jobs created between 2003 and2014. As expected, the results in Figure 18 suggest that in most cases fDiMarkets seemto underestimate the inflow of FDI, except in the case of manufacturing where fDiMarketsdata suggests that more than 6,000 jobs were created in 2013. Thus, while it is apparentfrom Figure 18 that the FDI numbers are correlated across sectors, across cities and acrosstime, we need to keep in mind that fDiMarkets systematically underestimates the totalnumber of FDI projects and FDI jobs when interpreting the results.
A.5 Additional results: The effect of FDI on wages
To investigate this gender and skill bias further we adjust our estimation strategy byfocusing on the individual level rather than aggregated by sector. In particular, weestimate the following specification:
yil = c+ FDIl + Ei +Gi + α(Ei ×Gi) + β(FDIl ×Gi) + γ(FDIl × Ei) + X′λil + εil
yil is a placeholder for the logged wage of individual i in location l or a dummy whichis equal to 1 if individual i reports to be employed and 0 otherwise. FDIl is our usualmeasure for FDI in location l, while G and E are gender and post-primary educationdummies, respectively. Depending on the specification X just contains age and age squaredof individual i or additionally includes sector fixed effects, which are not used in theemployment specification. This specification allows us to estimate how the probabilityof an individual being employed in 2014, as well as how its wage, depend on its gender,skills, and on how much FDI flowed to its district and sector since 2002. These estimatesconfirm the gender and skill bias of the FDI multiplier. Not only are skilled individualsmore likely to be employed when there are more FDI projects in their district, but theyalso see their wages rise more. This is true for both men and women and points to FDIincreasing wage inequality between the skilled and unskilled. The marginal effects suggestthat 10 extra FDI projects in a district-sector increase the probability of skilled women tobe employed by 0.6 percentage points, while it increases the probability for unskilled menby less than 0.2 (the average probability of being employed is 73%, whether formally orinformally). The wage regression on the other hand suggest that 100 extra FDI projectsin your district and sector is associated with 0.01% higher wages.
66

FIGURE 19The role of education and gender - 2014 individual level regressions
0
.0002
.0004
.0006
.0008
Unskilled Skilled Unskilled Skilled
Female Male
Average marginal effects of an FDI projecton the probability of being employed
−.0001
0
.0001
.0002
Unskilled Skilled Unskilled Skilled
Female Male
Percent increase in wagesassociated with an extra FDI project
Note: The left figure shows the estimated marginal effects based on an individual-level linearprobability model. The left-hand side variable is a dummy equal to one if the individualis employed, and zero otherwise. The right hand side includes interactions between theindividual’s education and skills with FDI in its district controlling for its age and age squared.We use the provided survey weights and cluster standard errors by district. The right figureshows the semi-elasticities of a similar regression with ln(wage) on the left-hand side and wheredistrict and sector fixed effects are included.
67