Embed Size (px)
Citation preview
20
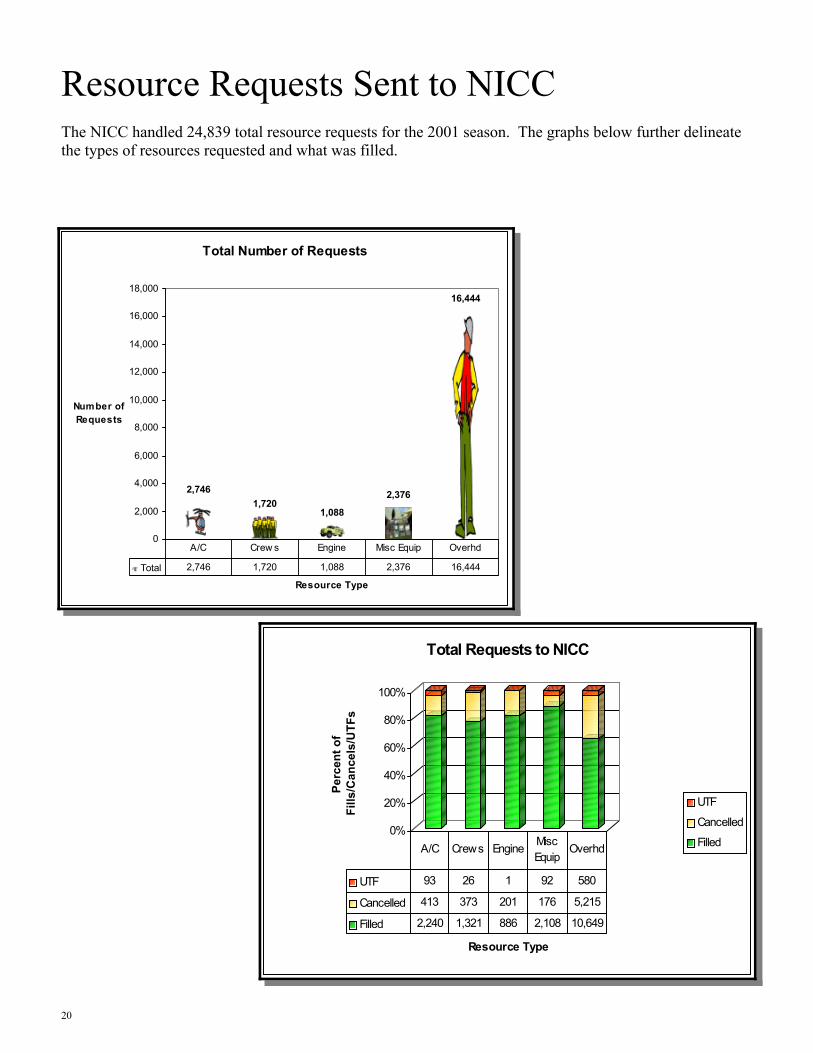
Resource Requests Sent to NICC The NICC handled 24,839 total resource requests for the 2001 season. The graphs below further delineate the types of resources requested and what was filled.
0%
20%
40%
60%
80%
100%
Perc
ent o
f Fi
lls/C
ance
ls/U
TFs
Resource Type
Total Requests to NICC
UTF
Cancelled
Filled
UTF 93 26 1 92 580
Cancelled 413 373 201 176 5,215
Filled 2,240 1,321 886 2,108 10,649
A/C Crews Engine Misc Equip
Overhd
Total Number of Requests
2,7461,720
1,088
2,376
16,444
0
2,000
4,000
6,000
8,000
10,000
12,000
14,000
16,000
18,000
Resource Type
Number of Requests
Total 2,746 1,720 1,088 2,376 16,444
A/C Crew s Engine Misc Equip Overhd
21
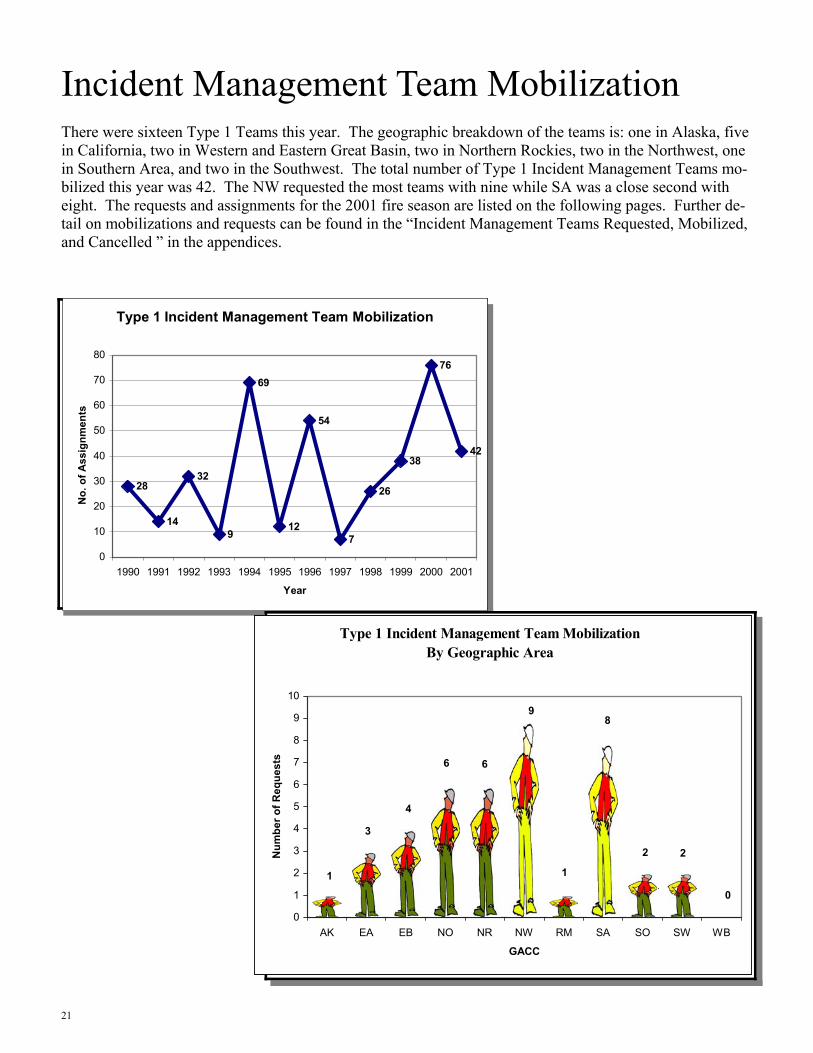
Incident Management Team Mobilization There were sixteen Type 1 Teams this year. The geographic breakdown of the teams is: one in Alaska, five in California, two in Western and Eastern Great Basin, two in Northern Rockies, two in the Northwest, one in Southern Area, and two in the Southwest. The total number of Type 1 Incident Management Teams mo-bilized this year was 42. The NW requested the most teams with nine while SA was a close second with eight. The requests and assignments for the 2001 fire season are listed on the following pages. Further de-tail on mobilizations and requests can be found in the “Incident Management Teams Requested, Mobilized, and Cancelled ” in the appendices.
Type 1 Incident Management Team Mobilization
28
14
32
9
69
12
54
7
26
38
76
42
0
10
20
30
40
50
60
70
80
1990 1991 1992 1993 1994 1995 1996 1997 1998 1999 2000 2001
Year
No.
of A
ssig
nmen
ts
Type 1 Incident Management Team Mobilization By Geographic Area
98
2 2
0
1
66
4
3
1
0
1
2
3
4
5
6
7
8
9
10
AK EA EB NO NR NW RM SA SO SW WB
GACC
Num
ber o
f Req
uest
s
22
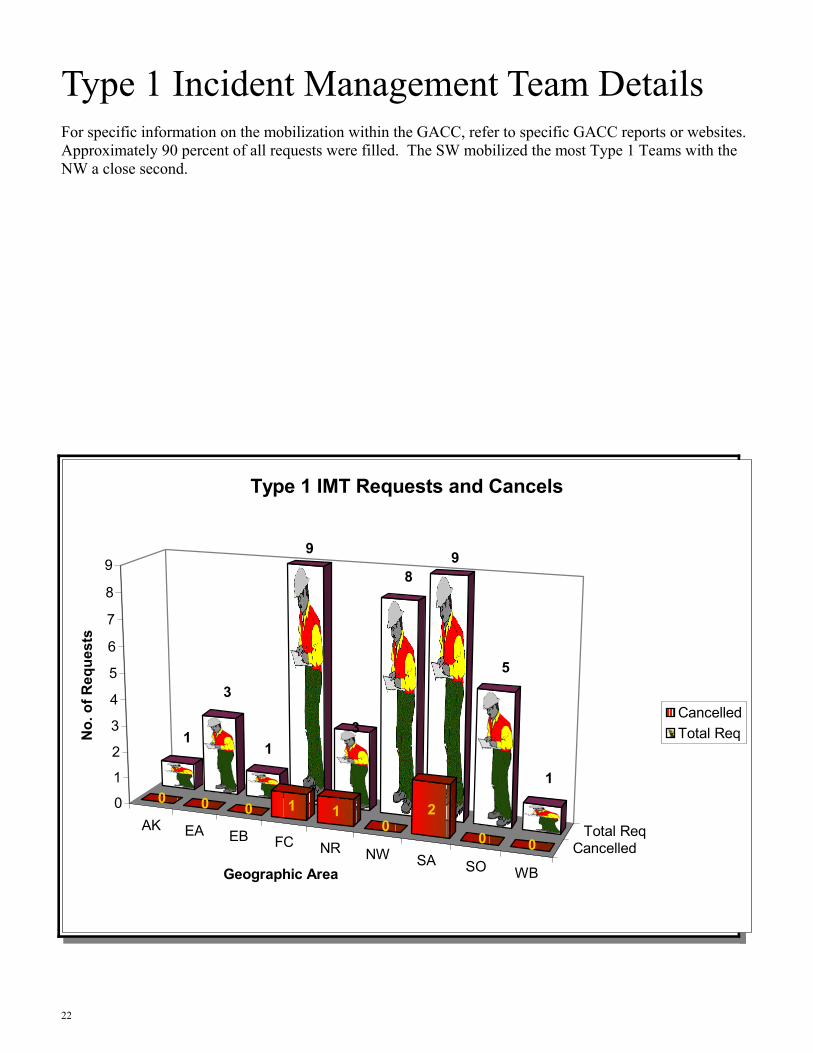
Type 1 Incident Management Team Details For specific information on the mobilization within the GACC, refer to specific GACC reports or websites. Approximately 90 percent of all requests were filled. The SW mobilized the most Type 1 Teams with the NW a close second.
AK EA EB FC NR NW SA SO WB
CancelledTotal Req
1
3
1
9
3
89
5
10 0 0 1 1
02
0 0
0
1
2
3
4
5
6
7
8
9
No.
of R
eque
sts
Geographic Area
Type 1 IMT Requests and Cancels
CancelledTotal Req
23
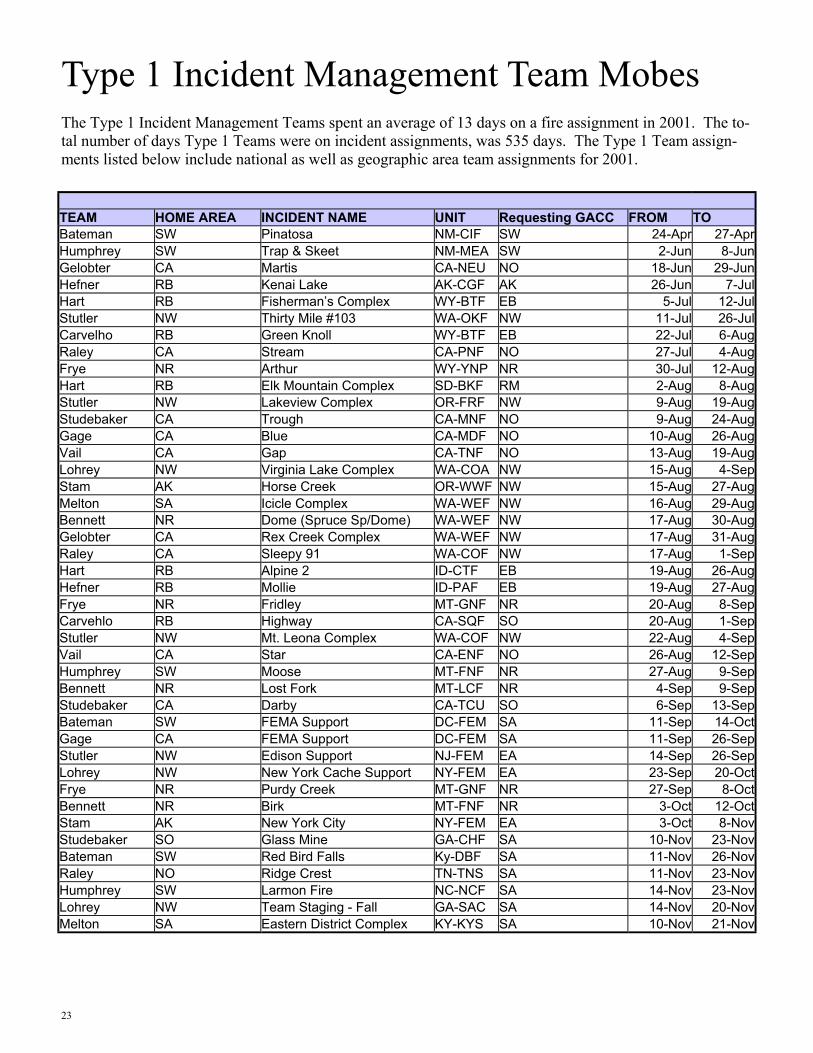
TEAM HOME AREA INCIDENT NAME UNIT Requesting GACC FROM TO Bateman SW Pinatosa NM-CIF SW 24-Apr 27-Apr Humphrey SW Trap & Skeet NM-MEA SW 2-Jun 8-Jun Gelobter CA Martis CA-NEU NO 18-Jun 29-Jun Hefner RB Kenai Lake AK-CGF AK 26-Jun 7-Jul Hart RB Fisherman’s Complex WY-BTF EB 5-Jul 12-Jul Stutler NW Thirty Mile #103 WA-OKF NW 11-Jul 26-Jul Carvelho RB Green Knoll WY-BTF EB 22-Jul 6-Aug Raley CA Stream CA-PNF NO 27-Jul 4-Aug Frye NR Arthur WY-YNP NR 30-Jul 12-Aug Hart RB Elk Mountain Complex SD-BKF RM 2-Aug 8-Aug Stutler NW Lakeview Complex OR-FRF NW 9-Aug 19-Aug Studebaker CA Trough CA-MNF NO 9-Aug 24-Aug Gage CA Blue CA-MDF NO 10-Aug 26-Aug Vail CA Gap CA-TNF NO 13-Aug 19-Aug Lohrey NW Virginia Lake Complex WA-COA NW 15-Aug 4-Sep Stam AK Horse Creek OR-WWF NW 15-Aug 27-Aug Melton SA Icicle Complex WA-WEF NW 16-Aug 29-Aug Bennett NR Dome (Spruce Sp/Dome) WA-WEF NW 17-Aug 30-Aug Gelobter CA Rex Creek Complex WA-WEF NW 17-Aug 31-Aug Raley CA Sleepy 91 WA-COF NW 17-Aug 1-Sep Hart RB Alpine 2 ID-CTF EB 19-Aug 26-Aug Hefner RB Mollie ID-PAF EB 19-Aug 27-Aug Frye NR Fridley MT-GNF NR 20-Aug 8-Sep Carvehlo RB Highway CA-SQF SO 20-Aug 1-Sep Stutler NW Mt. Leona Complex WA-COF NW 22-Aug 4-Sep Vail CA Star CA-ENF NO 26-Aug 12-Sep Humphrey SW Moose MT-FNF NR 27-Aug 9-Sep Bennett NR Lost Fork MT-LCF NR 4-Sep 9-Sep Studebaker CA Darby CA-TCU SO 6-Sep 13-Sep Bateman SW FEMA Support DC-FEM SA 11-Sep 14-Oct Gage CA FEMA Support DC-FEM SA 11-Sep 26-Sep Stutler NW Edison Support NJ-FEM EA 14-Sep 26-Sep Lohrey NW New York Cache Support NY-FEM EA 23-Sep 20-Oct Frye NR Purdy Creek MT-GNF NR 27-Sep 8-Oct Bennett NR Birk MT-FNF NR 3-Oct 12-Oct Stam AK New York City NY-FEM EA 3-Oct 8-Nov Studebaker SO Glass Mine GA-CHF SA 10-Nov 23-Nov Bateman SW Red Bird Falls Ky-DBF SA 11-Nov 26-Nov Raley NO Ridge Crest TN-TNS SA 11-Nov 23-Nov Humphrey SW Larmon Fire NC-NCF SA 14-Nov 23-Nov Lohrey NW Team Staging - Fall GA-SAC SA 14-Nov 20-Nov Melton SA Eastern District Complex KY-KYS SA 10-Nov 21-Nov
Type 1 Incident Management Team Mobes The Type 1 Incident Management Teams spent an average of 13 days on a fire assignment in 2001. The to-tal number of days Type 1 Teams were on incident assignments, was 535 days. The Type 1 Team assign-ments listed below include national as well as geographic area team assignments for 2001.
24
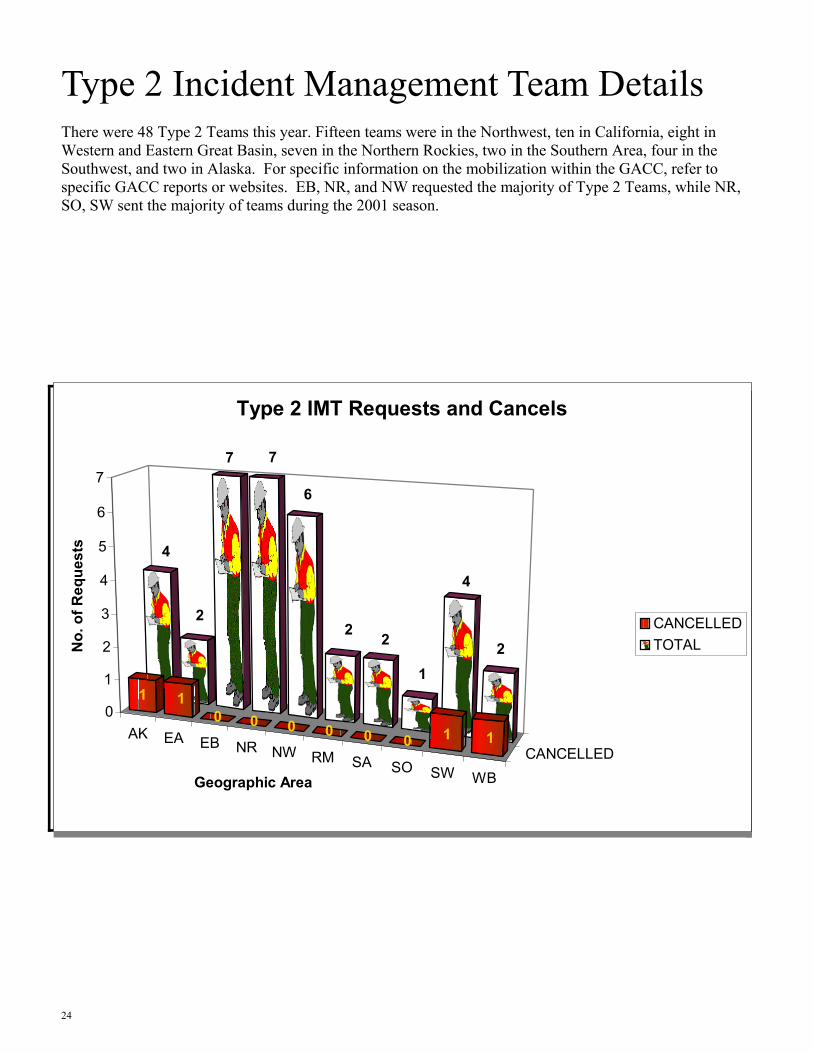
Type 2 Incident Management Team Details There were 48 Type 2 Teams this year. Fifteen teams were in the Northwest, ten in California, eight in Western and Eastern Great Basin, seven in the Northern Rockies, two in the Southern Area, four in the Southwest, and two in Alaska. For specific information on the mobilization within the GACC, refer to specific GACC reports or websites. EB, NR, and NW requested the majority of Type 2 Teams, while NR, SO, SW sent the majority of teams during the 2001 season.
AK EA EB NR NW RM SA SO SW WBCANCELLED
4
2
7 7
6
2 2
1
4
2
1 10 0 0 0 0 0 1 1
0
1
2
3
4
5
6
7
No.
of R
eque
sts
Geographic Area
Type 2 IMT Requests and Cancels
CANCELLEDTOTAL
25
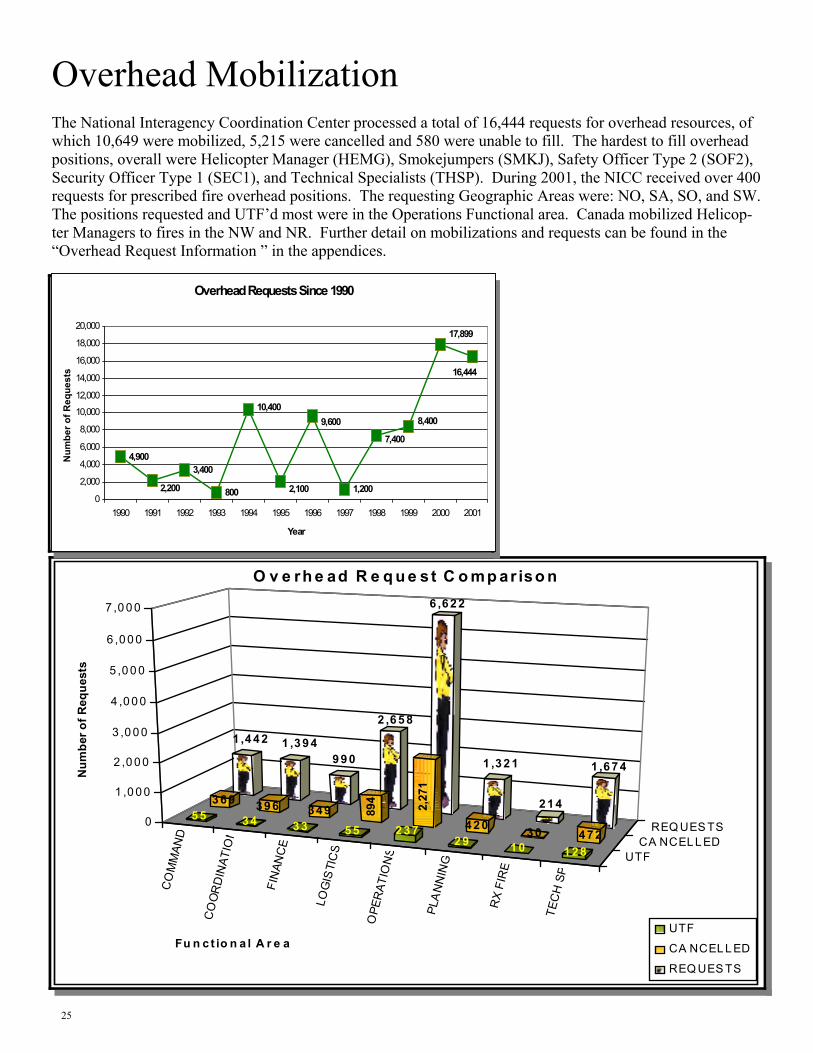
Overhead Mobilization The National Interagency Coordination Center processed a total of 16,444 requests for overhead resources, of which 10,649 were mobilized, 5,215 were cancelled and 580 were unable to fill. The hardest to fill overhead positions, overall were Helicopter Manager (HEMG), Smokejumpers (SMKJ), Safety Officer Type 2 (SOF2), Security Officer Type 1 (SEC1), and Technical Specialists (THSP). During 2001, the NICC received over 400 requests for prescribed fire overhead positions. The requesting Geographic Areas were: NO, SA, SO, and SW. The positions requested and UTF’d most were in the Operations Functional area. Canada mobilized Helicop-ter Managers to fires in the NW and NR. Further detail on mobilizations and requests can be found in the “Overhead Request Information ” in the appendices.
Overhead Requests Since 1990
4,9003,400
800 1,2002,200 2,100
10,4009,600 8,400
7,400
17,899
16,444
0
2,000
4,000
6,000
8,000
10,000
12,000
14,000
16,000
18,000
20,000
1990 1991 1992 1993 1994 1995 1996 1997 1998 1999 2000 2001
Year
Num
ber o
f Req
uest
s
CO
MM
AND
CO
OR
DIN
ATIO
N
FIN
ANC
E
LOG
ISTI
CS
OPE
RAT
ION
S
PLA
NN
ING
RX
FIR
E
TEC
H S
P
UTFCA NCEL LED
REQ UES TS
1 ,4 4 2 1 ,3 9 49 9 0
2 ,6 5 8
6 ,6 22
1 ,3 2 1
2 1 4
1 ,6 7 4
3 6 9 3 9 6 34 9 894 2,27
1
4 2 0 3 0 4 7 25 5 34 3 3 5 5 2 3 7
2 9 1 0 12 8
0
1 ,0 0 0
2 ,0 0 0
3 ,0 0 0
4 ,0 0 0
5 ,0 0 0
6 ,00 0
7 ,0 0 0
Num
ber o
f Req
uest
s
Fu n c t io n a l A r e a
O v e rh e ad R e q u e st C o mp ar iso n
UTF
CA NCEL L ED
REQ UES TS
26
14
1
29
42
26
59
24
13
52
126
20
0
20
40
60
80
100
120
140
Num
ber o
f Req
uest
s
AK EA EB NO NR NW RM SA SO SW WB
Geographic Areas
Type 1 Crews Filled by GACC
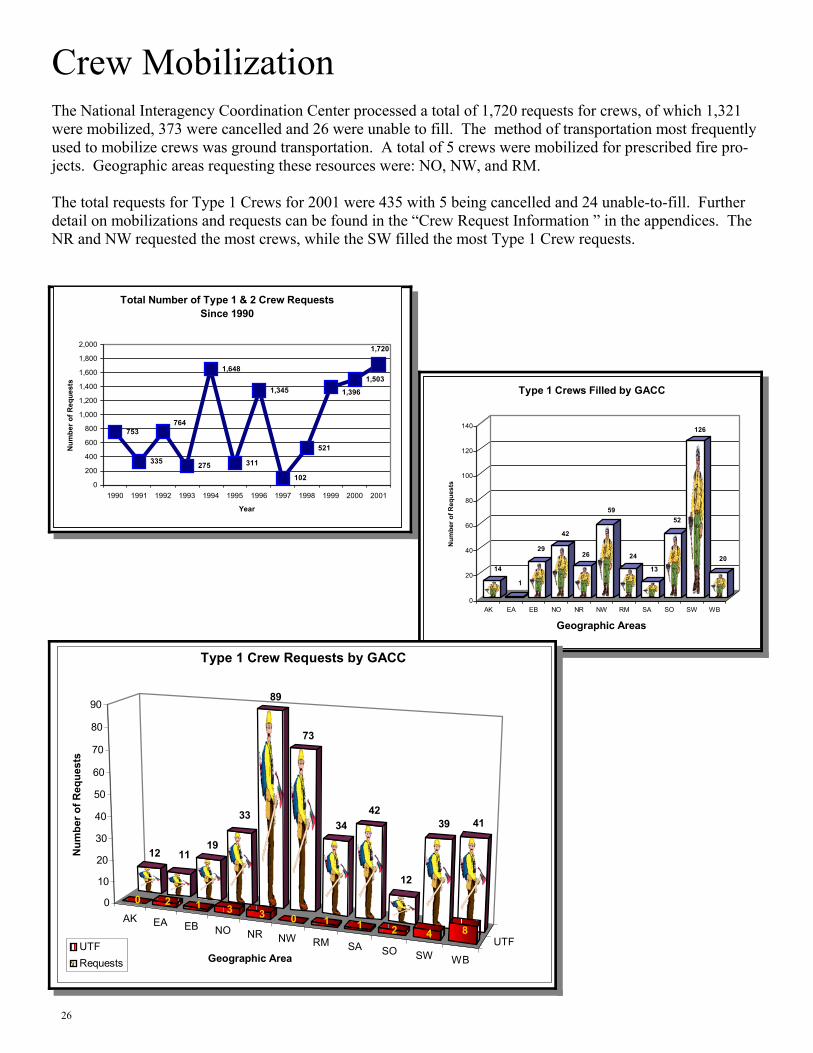
Crew Mobilization The National Interagency Coordination Center processed a total of 1,720 requests for crews, of which 1,321 were mobilized, 373 were cancelled and 26 were unable to fill. The method of transportation most frequently used to mobilize crews was ground transportation. A total of 5 crews were mobilized for prescribed fire pro-jects. Geographic areas requesting these resources were: NO, NW, and RM. The total requests for Type 1 Crews for 2001 were 435 with 5 being cancelled and 24 unable-to-fill. Further detail on mobilizations and requests can be found in the “Crew Request Information ” in the appendices. The NR and NW requested the most crews, while the SW filled the most Type 1 Crew requests.
Total Number of Type 1 & 2 Crew Requests Since 1990
753
335 275
1,648
311
1,345
102
521
1,503
1,720
764
1,396
0
200
400
600
800
1,000
1,200
1,400
1,600
1,800
2,000
1990 1991 1992 1993 1994 1995 1996 1997 1998 1999 2000 2001
Year
Num
ber o
f Req
uest
s
AK EA EB NO NR NW RM SA SO SW WB
UTF
12 1119
33
89
73
3442
12
39 41
0 2 1 3 3 0 1 1 2 4 8
0
10
20
30
40
50
60
70
80
90
Num
ber o
f Req
uest
s
Geographic Area
Type 1 Crew Requests by GACC
UTFRequests
27
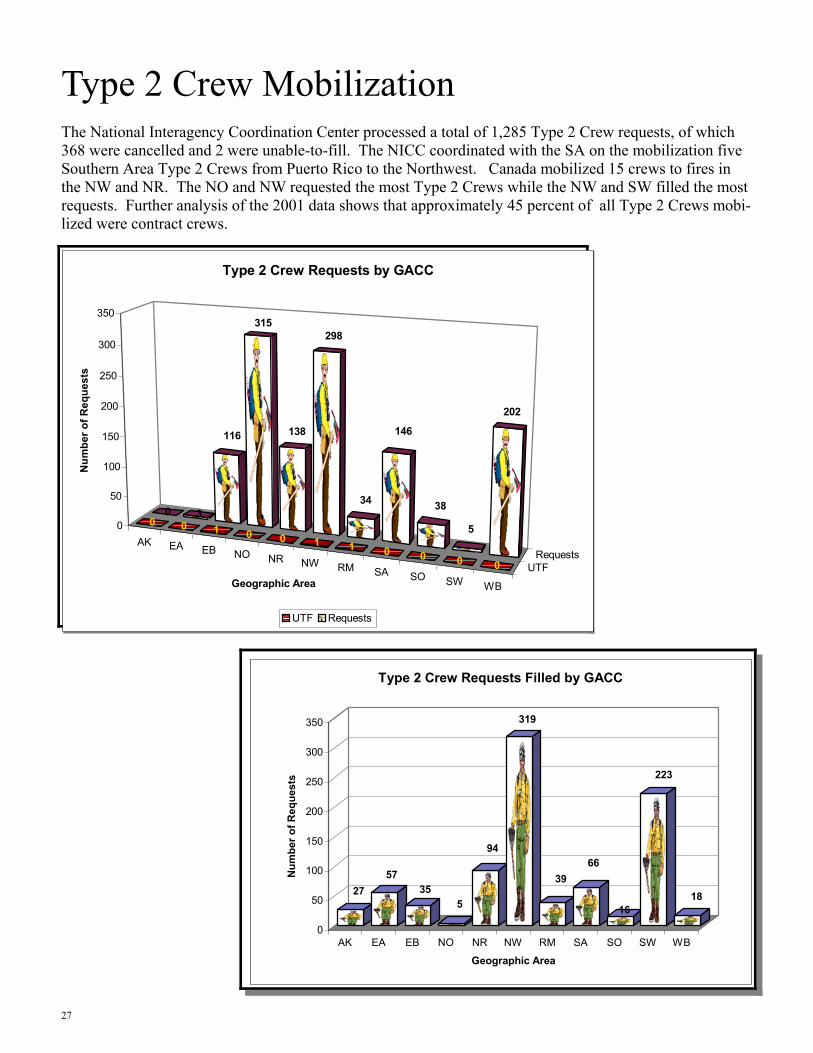
Type 2 Crew Mobilization The National Interagency Coordination Center processed a total of 1,285 Type 2 Crew requests, of which 368 were cancelled and 2 were unable-to-fill. The NICC coordinated with the SA on the mobilization five Southern Area Type 2 Crews from Puerto Rico to the Northwest. Canada mobilized 15 crews to fires in the NW and NR. The NO and NW requested the most Type 2 Crews while the NW and SW filled the most requests. Further analysis of the 2001 data shows that approximately 45 percent of all Type 2 Crews mobi-lized were contract crews.
AK EA EB NO NR NW RM SA SO SW WB
UTFRequests
0 3
116
315
138
298
34
146
38
5
202
0 0 1 0 0 1 1 0 0 0 0
0
50
100
150
200
250
300
350
Num
ber o
f Req
uest
s
Geographic Area
Type 2 Crew Requests by GACC
UTF Requests
2757
355
94
319
3966
16
223
18
0
50
100
150
200
250
300
350
Num
ber o
f Req
uest
s
AK EA EB NO NR NW RM SA SO SW WB
Geographic Area
Type 2 Crew Requests Filled by GACC
28
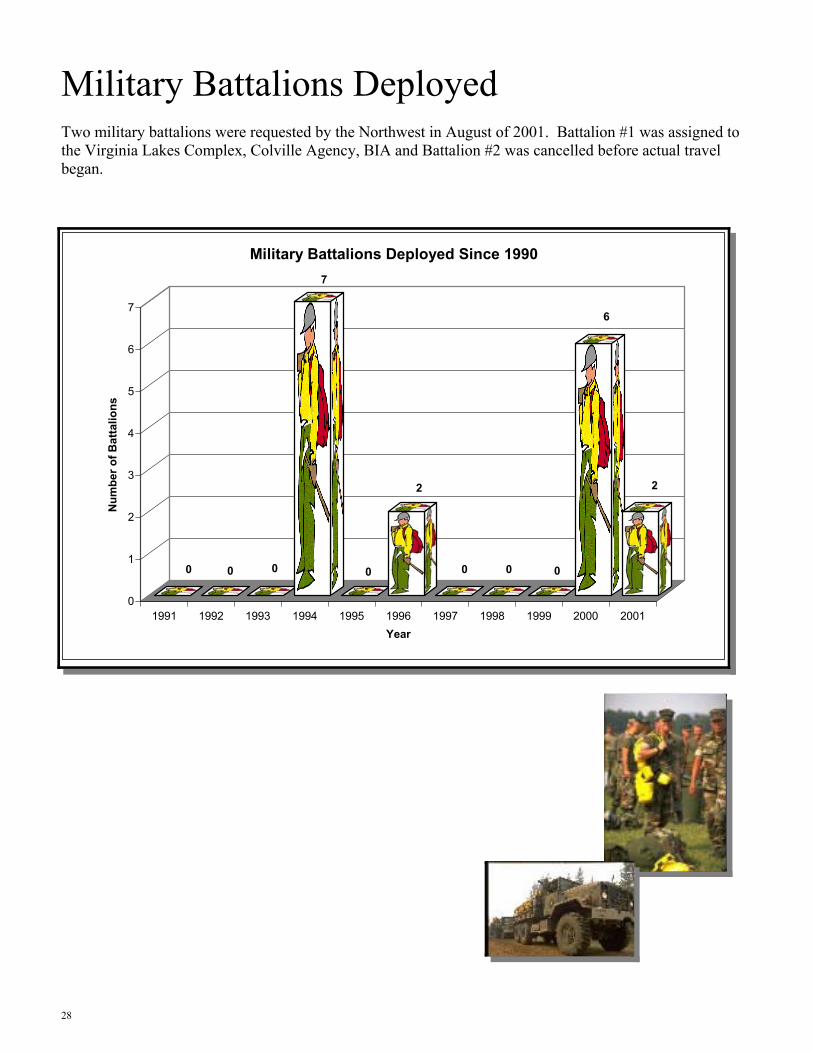
Military Battalions Deployed Two military battalions were requested by the Northwest in August of 2001. Battalion #1 was assigned to the Virginia Lakes Complex, Colville Agency, BIA and Battalion #2 was cancelled before actual travel began.
0 0 0
7
0
2
0 0 0
6
2
0
1
2
3
4
5
6
7
Num
ber o
f Bat
talio
ns
1991 1992 1993 1994 1995 1996 1997 1998 1999 2000 2001Year
Military Battalions Deployed Since 1990
29
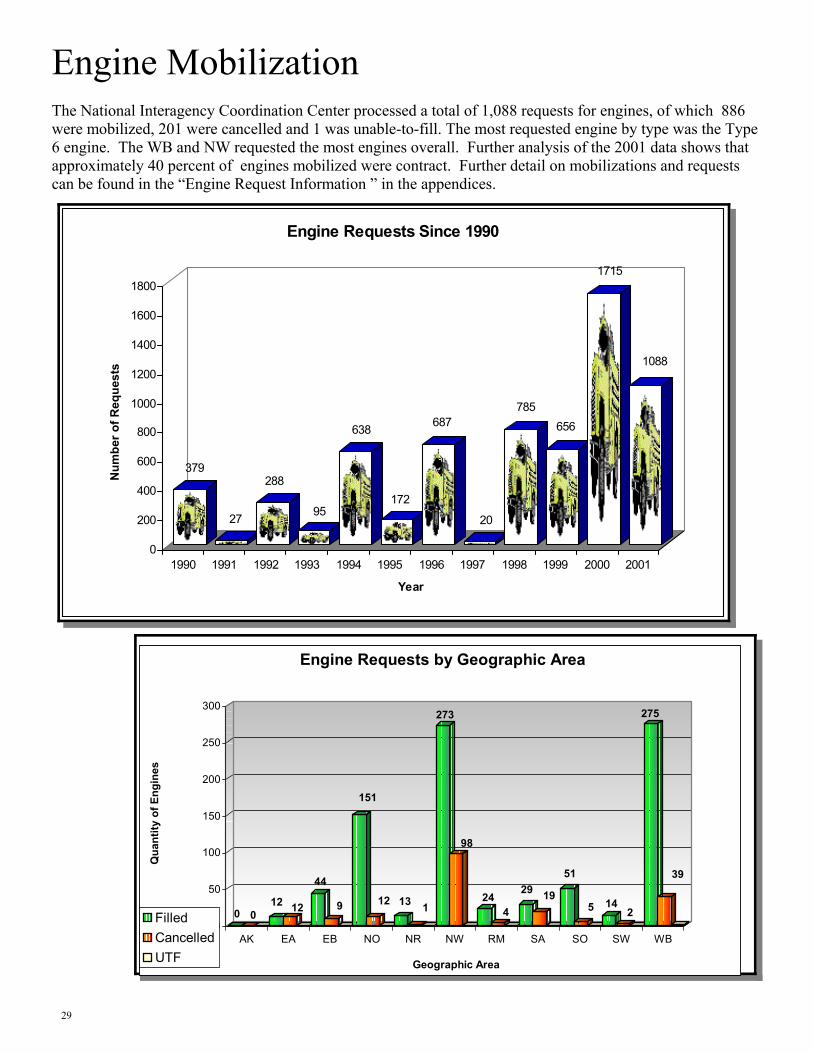
Engine Mobilization The National Interagency Coordination Center processed a total of 1,088 requests for engines, of which 886 were mobilized, 201 were cancelled and 1 was unable-to-fill. The most requested engine by type was the Type 6 engine. The WB and NW requested the most engines overall. Further analysis of the 2001 data shows that approximately 40 percent of engines mobilized were contract. Further detail on mobilizations and requests can be found in the “Engine Request Information ” in the appendices.
379
27
288
95
638
172
687
20
785656
1715
1088
0
200
400
600
800
1000
1200
1400
1600
1800
Num
ber o
f Req
uest
s
1990 1991 1992 1993 1994 1995 1996 1997 1998 1999 2000 2001
Year
Engine Requests Since 1990
0 012 12
44
9
151
12 13 1
273
98
244
29 19
51
5 142
275
39
0
50
100
150
200
250
300
Qua
ntity
of E
ngin
es
AK EA EB NO NR NW RM SA SO SW WB
Geographic Area
Engine Requests by Geographic Area
FilledCancelledUTF
30
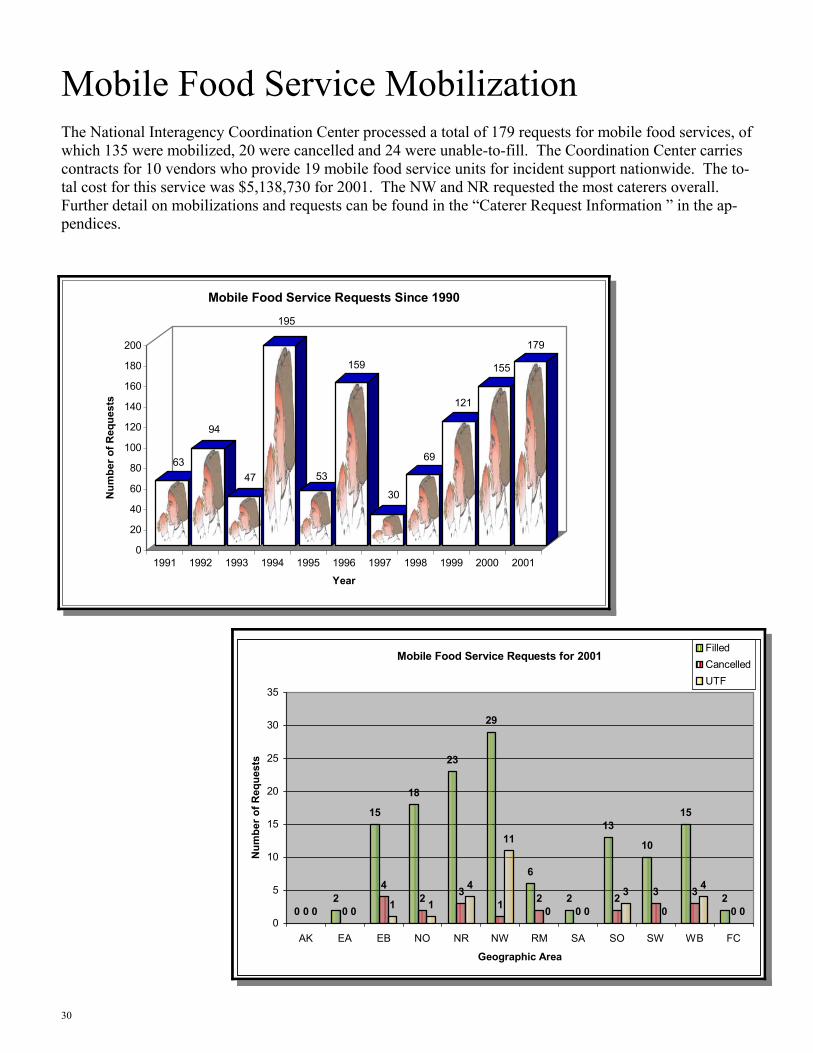
Mobile Food Service Mobilization The National Interagency Coordination Center processed a total of 179 requests for mobile food services, of which 135 were mobilized, 20 were cancelled and 24 were unable-to-fill. The Coordination Center carries contracts for 10 vendors who provide 19 mobile food service units for incident support nationwide. The to-tal cost for this service was $5,138,730 for 2001. The NW and NR requested the most caterers overall. Further detail on mobilizations and requests can be found in the “Caterer Request Information ” in the ap-pendices.
Mobile Food Service Requests for 2001
02
15
18
23
29
6
2
13
10
15
20 0
42 3
1 20
2 3 3
00 0 1 1
4
11
0 0
3
0
4
00
5
10
15
20
25
30
35
AK EA EB NO NR NW RM SA SO SW WB FC
Geographic Area
Num
ber o
f Req
uest
s
FilledCancelledUTF
63
94
47
195
53
159
30
69
121
155
179
0
20
40
60
80
100
120
140
160
180
200
Num
ber o
f Req
uest
s
1991 1992 1993 1994 1995 1996 1997 1998 1999 2000 2001Year
Mobile Food Service Requests Since 1990
31
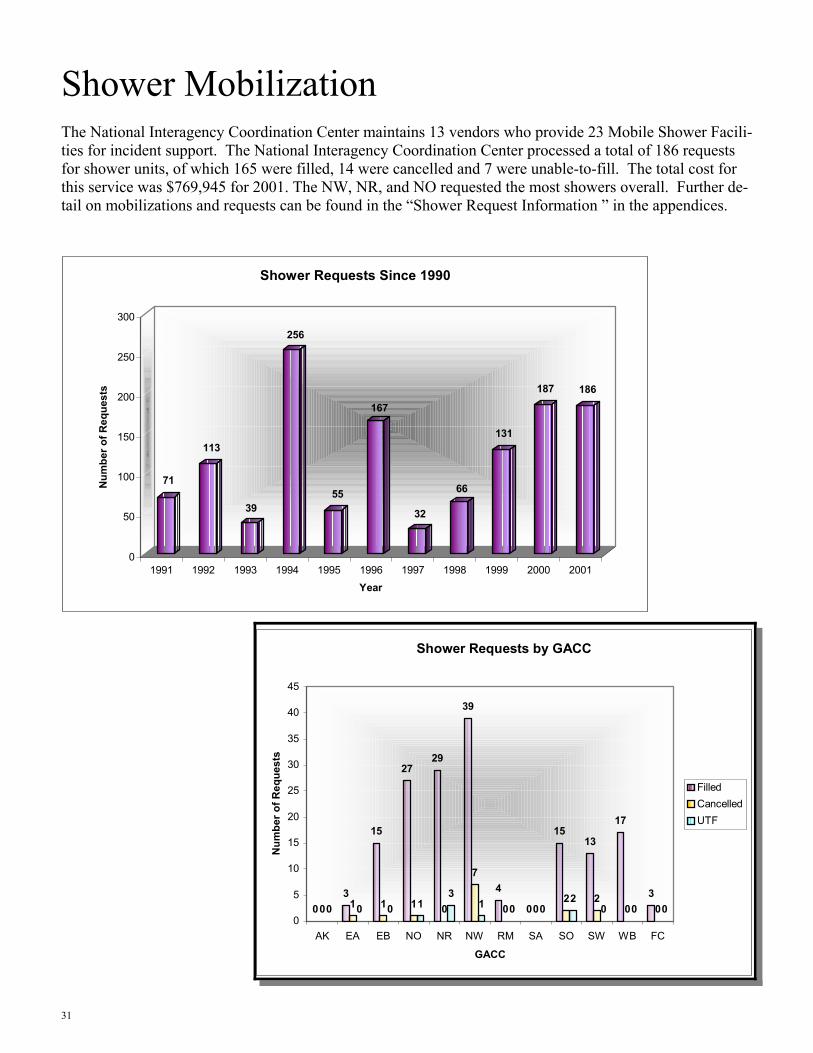
Shower Mobilization The National Interagency Coordination Center maintains 13 vendors who provide 23 Mobile Shower Facili-ties for incident support. The National Interagency Coordination Center processed a total of 186 requests for shower units, of which 165 were filled, 14 were cancelled and 7 were unable-to-fill. The total cost for this service was $769,945 for 2001. The NW, NR, and NO requested the most showers overall. Further de-tail on mobilizations and requests can be found in the “Shower Request Information ” in the appendices.
71
113
39
256
55
167
32
66
131
187 186
0
50
100
150
200
250
300
Num
ber o
f Req
uest
s
1991 1992 1993 1994 1995 1996 1997 1998 1999 2000 2001Year
Shower Requests Since 1990
Shower Requests by GACC
03
15
2729
39
4
0
1513
17
30 1 1 1 0
7
0 02 2
0 00 0 0 13
1 0 02
0 0 00
5
10
15
20
25
30
35
40
45
AK EA EB NO NR NW RM SA SO SW WB FC
GACC
Num
ber o
f Req
uest
s
FilledCancelledUTF
32
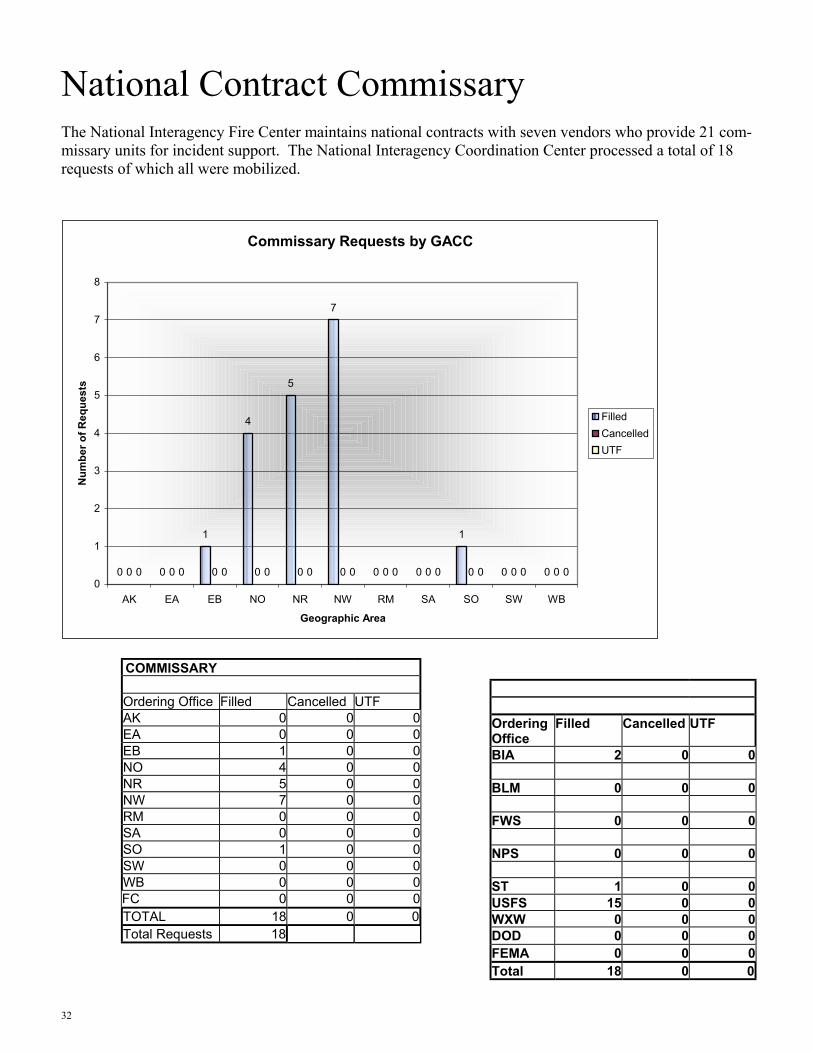
National Contract Commissary The National Interagency Fire Center maintains national contracts with seven vendors who provide 21 com-missary units for incident support. The National Interagency Coordination Center processed a total of 18 requests of which all were mobilized.
Commissary Requests by GACC
0 0
1
4
5
7
0 0
1
0 00 0 0 0 0 0 0 0 0 0 00 0 0 0 0 0 0 0 0 0 00
1
2
3
4
5
6
7
8
AK EA EB NO NR NW RM SA SO SW WB
Geographic Area
Num
ber o
f Req
uest
s
FilledCancelledUTF
COMMISSARY
Ordering Office Filled Cancelled UTF AK 0 0 0 EA 0 0 0 EB 1 0 0 NO 4 0 0 NR 5 0 0 NW 7 0 0 RM 0 0 0 SA 0 0 0 SO 1 0 0 SW 0 0 0 WB 0 0 0 FC 0 0 0 TOTAL 18 0 0 Total Requests 18
Ordering Office
Filled Cancelled UTF
BIA 2 0 0
BLM 0 0 0
FWS 0 0 0
NPS 0 0 0
ST 1 0 0 USFS 15 0 0 WXW 0 0 0 DOD 0 0 0 FEMA 0 0 0 Total 18 0 0
33
0 0
6
2
5
11
1
8
0
10
4
2
0
2
4
6
8
10
12
Num
ber o
f Kits
AK EA EB NO NR NW RM SA SO SW WB FC
Geographic Area
ATMU'S (1836) Mobilized by GACC
10
4
23
20
34
57
1517
12
29
24
2
0
10
20
30
40
50
60
Num
ber o
f Kits
AK EA EB NO NR NW RM SA SO SW WB FC
Geographic Area
Radio Starter Kits (4390) Mobilized
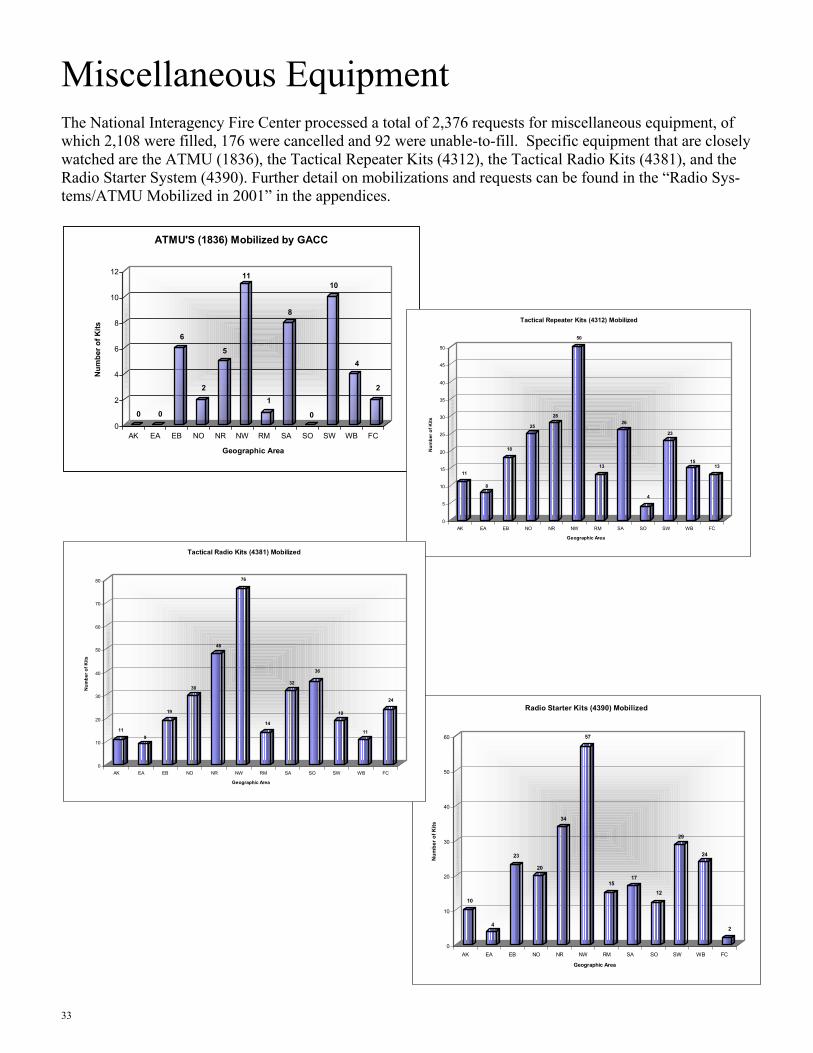
Miscellaneous Equipment The National Interagency Fire Center processed a total of 2,376 requests for miscellaneous equipment, of which 2,108 were filled, 176 were cancelled and 92 were unable-to-fill. Specific equipment that are closely watched are the ATMU (1836), the Tactical Repeater Kits (4312), the Tactical Radio Kits (4381), and the Radio Starter System (4390). Further detail on mobilizations and requests can be found in the “Radio Sys-tems/ATMU Mobilized in 2001” in the appendices.
11
8
18
25
28
50
13
26
4
23
1513
0
5
10
15
20
25
30
35
40
45
50
Num
ber o
f Kits
AK EA EB NO NR NW RM SA SO SW WB FC
Geographic Area
Tactical Repeater Kits (4312) Mobilized
119
19
30
48
76
14
32
36
19
11
24
0
10
20
30
40
50
60
70
80
Num
ber o
f Kits
AK EA EB NO NR NW RM SA SO SW WB FC
Geographic Area
Tactical Radio Kits (4381) Mobilized
34
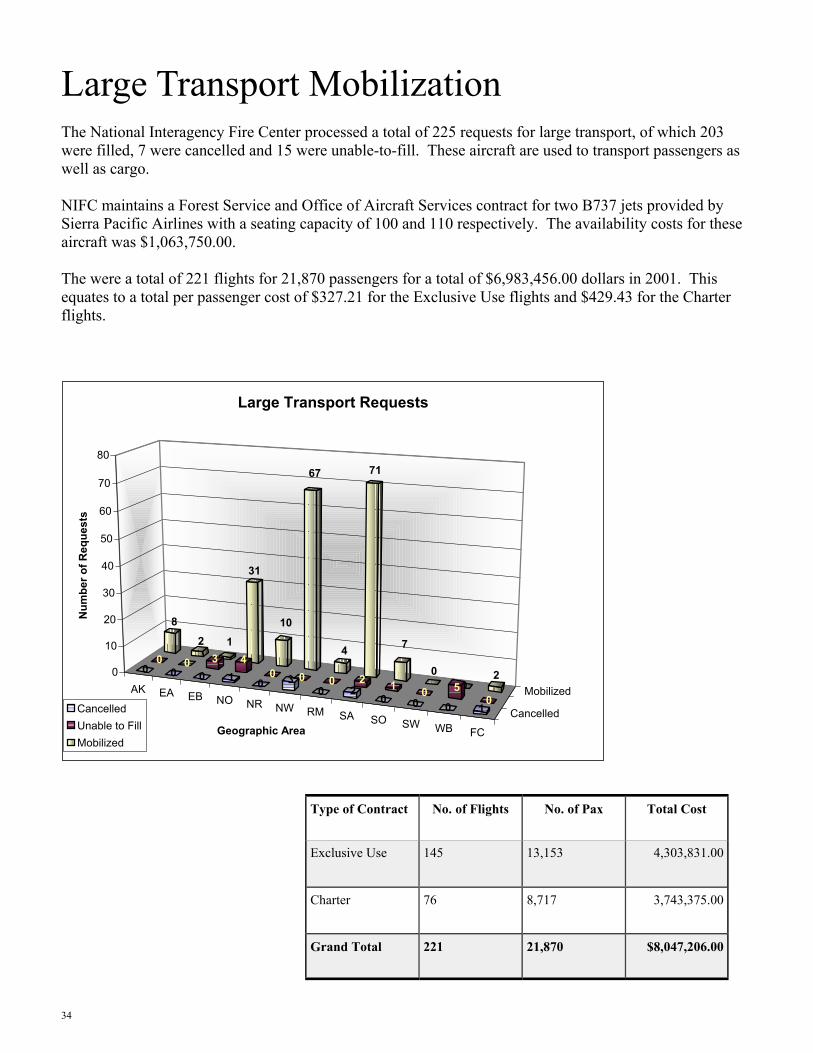
Large Transport Mobilization The National Interagency Fire Center processed a total of 225 requests for large transport, of which 203 were filled, 7 were cancelled and 15 were unable-to-fill. These aircraft are used to transport passengers as well as cargo. NIFC maintains a Forest Service and Office of Aircraft Services contract for two B737 jets provided by Sierra Pacific Airlines with a seating capacity of 100 and 110 respectively. The availability costs for these aircraft was $1,063,750.00. The were a total of 221 flights for 21,870 passengers for a total of $6,983,456.00 dollars in 2001. This equates to a total per passenger cost of $327.21 for the Exclusive Use flights and $429.43 for the Charter flights.
AK EA EB NO NR NW RM SA SO SW WB FC
Cancelled
Mobilized
82 1
31
10
67
4
71
7
00
20 0 3 4
0 0 0 2 1 0 50
0 0 0 1 0 30 2
0 0 0 1
0
10
20
30
40
50
60
70
80
Num
ber o
f Req
uest
s
Geographic Area
Large Transport Requests
CancelledUnable to FillMobilized
Type of Contract No. of Flights No. of Pax Total Cost
Exclusive Use 145 13,153 4,303,831.00
Charter 76 8,717 3,743,375.00
Grand Total 221 21,870 $8,047,206.00
35
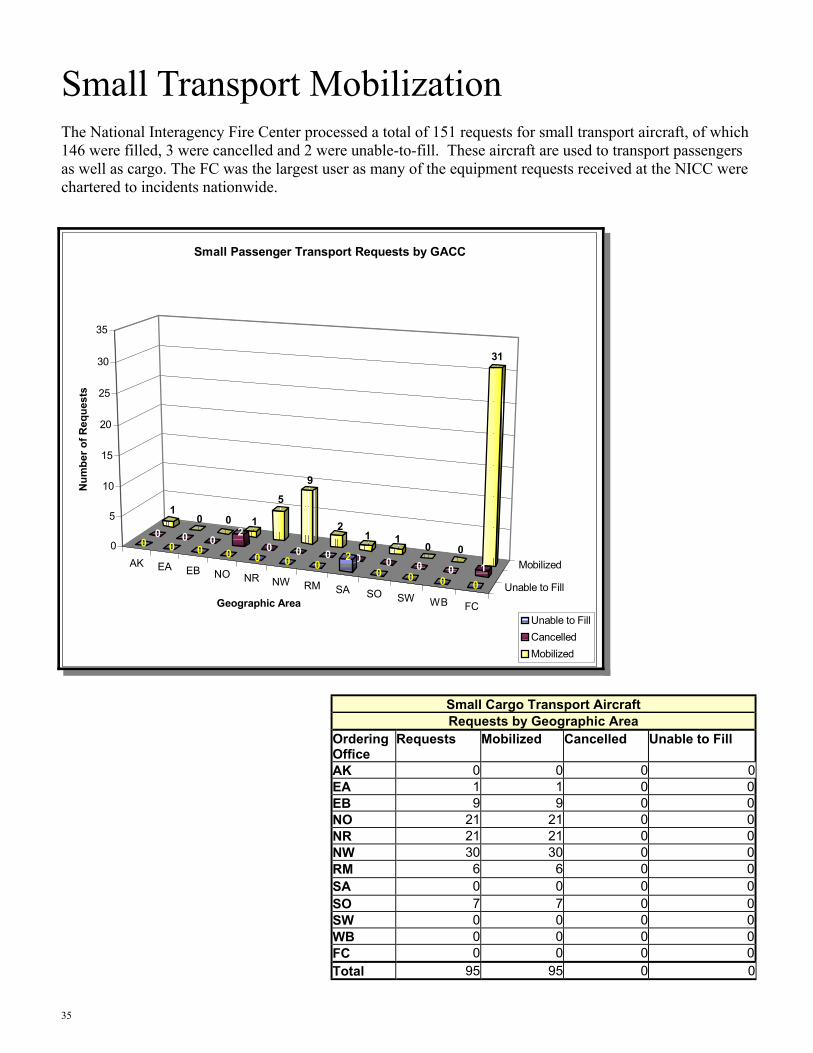
Small Transport Mobilization The National Interagency Fire Center processed a total of 151 requests for small transport aircraft, of which 146 were filled, 3 were cancelled and 2 were unable-to-fill. These aircraft are used to transport passengers as well as cargo. The FC was the largest user as many of the equipment requests received at the NICC were chartered to incidents nationwide.
AK EA EB NO NR NW RM SA SO SW WB FC
Unable to Fill
Mobilized
10 0 1
5
9
21 1
0 0
31
0 0 02
0 0 0 0 0 0 0 1
0 0 0 0 0 0 02
0 0 0 0
0
5
10
15
20
25
30
35
Num
ber o
f Req
uest
s
Geographic Area
Small Passenger Transport Requests by GACC
Unable to FillCancelledMobilized
Small Cargo Transport Aircraft
Ordering Office
Requests Mobilized Cancelled Unable to Fill
AK 0 0 0 0 EA 1 1 0 0 EB 9 9 0 0 NO 21 21 0 0 NR 21 21 0 0 NW 30 30 0 0 RM 6 6 0 0 SA 0 0 0 0 SO 7 7 0 0 SW 0 0 0 0 WB 0 0 0 0 FC 0 0 0 0 Total 95 95 0 0
Requests by Geographic Area
36
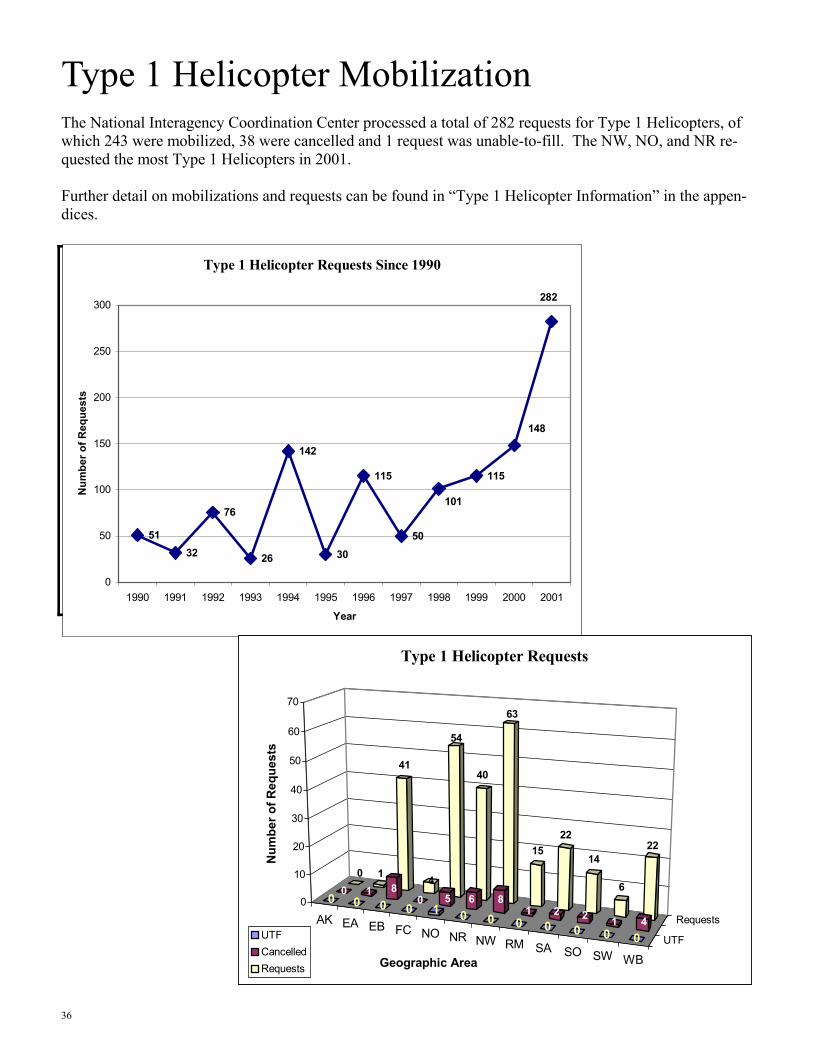
Type 1 Helicopter Mobilization The National Interagency Coordination Center processed a total of 282 requests for Type 1 Helicopters, of which 243 were mobilized, 38 were cancelled and 1 request was unable-to-fill. The NW, NO, and NR re-quested the most Type 1 Helicopters in 2001. Further detail on mobilizations and requests can be found in “Type 1 Helicopter Information” in the appen-dices.
Type 1 Helicopter Requests Since 1990
5132
76
26
142
30
115
50
115
282
148
101
0
50
100
150
200
250
300
1990 1991 1992 1993 1994 1995 1996 1997 1998 1999 2000 2001
Year
Num
ber o
f Req
uest
s
AK EA EB FC NO NR NW RM SA SO SW WBUTF
Requests
0 1
41
4
54
40
63
1522
14
6
22
0 1 80 5 6 8
1 2 2 1 4
0 0 0 0 1 0 0 0 0 0 0 0
0
10
20
30
40
50
60
70
Num
ber o
f Req
uest
s
Geographic Area
Type 1 Helicopter Requests
UTFCancelledRequests
37
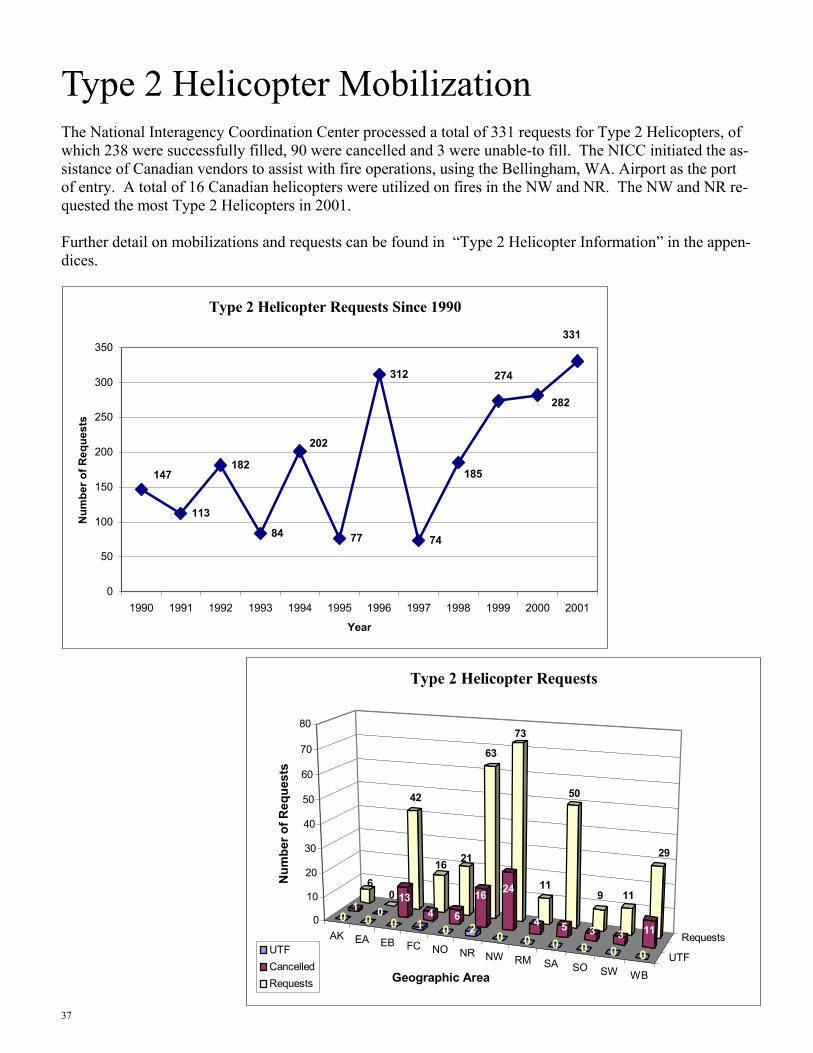
Type 2 Helicopter Mobilization The National Interagency Coordination Center processed a total of 331 requests for Type 2 Helicopters, of which 238 were successfully filled, 90 were cancelled and 3 were unable-to fill. The NICC initiated the as-sistance of Canadian vendors to assist with fire operations, using the Bellingham, WA. Airport as the port of entry. A total of 16 Canadian helicopters were utilized on fires in the NW and NR. The NW and NR re-quested the most Type 2 Helicopters in 2001. Further detail on mobilizations and requests can be found in “Type 2 Helicopter Information” in the appen-dices.
AK EA EB FC NO NR NW RM SA SO SW WBUTF
Requests
60
42
16 21
63
73
11
50
9 11
29
1 013
4 6
16 24
4 5 3 3 110 0 0 1 0 2 0 0 0 0 0 0
0
10
20
30
40
50
60
70
80
Num
ber o
f Req
uest
s
Geographic Area
Type 2 Helicopter Requests
UTFCancelledRequests
Type 2 Helicopter Requests Since 1990
113
182
84 77
312
74
185
282
331
274
147
202
0
50
100
150
200
250
300
350
1990 1991 1992 1993 1994 1995 1996 1997 1998 1999 2000 2001
Year
Num
ber o
f Req
uest
s
38
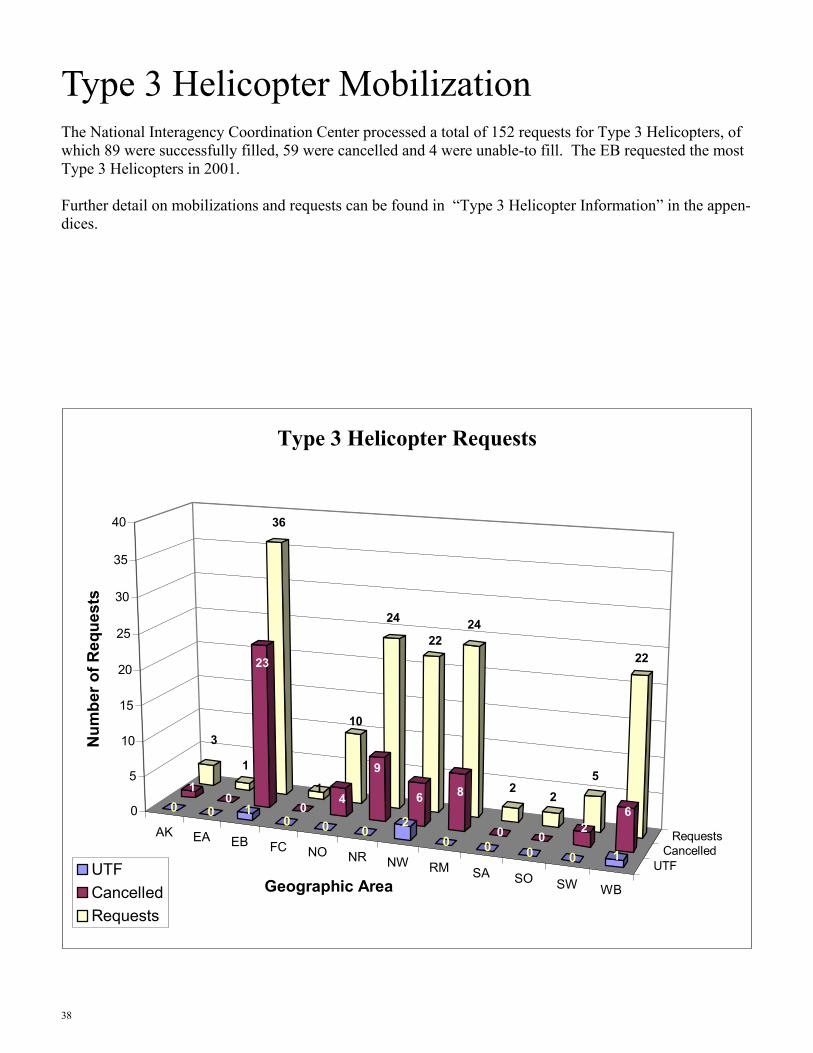
Type 3 Helicopter Mobilization The National Interagency Coordination Center processed a total of 152 requests for Type 3 Helicopters, of which 89 were successfully filled, 59 were cancelled and 4 were unable-to fill. The EB requested the most Type 3 Helicopters in 2001. Further detail on mobilizations and requests can be found in “Type 3 Helicopter Information” in the appen-dices.
AK EA EB FC NO NR NW RM SA SO SW WB
UTFCancelled
Requests
3
1
36
1
10
24
2224
22
5
22
10
23
04
9
6 8
0 02
60 0 10 0 0
20 0 0 0 1
0
5
10
15
20
25
30
35
40
Num
ber o
f Req
uest
s
Geographic Area
Type 3 Helicopter Requests
UTFCancelledRequests
39
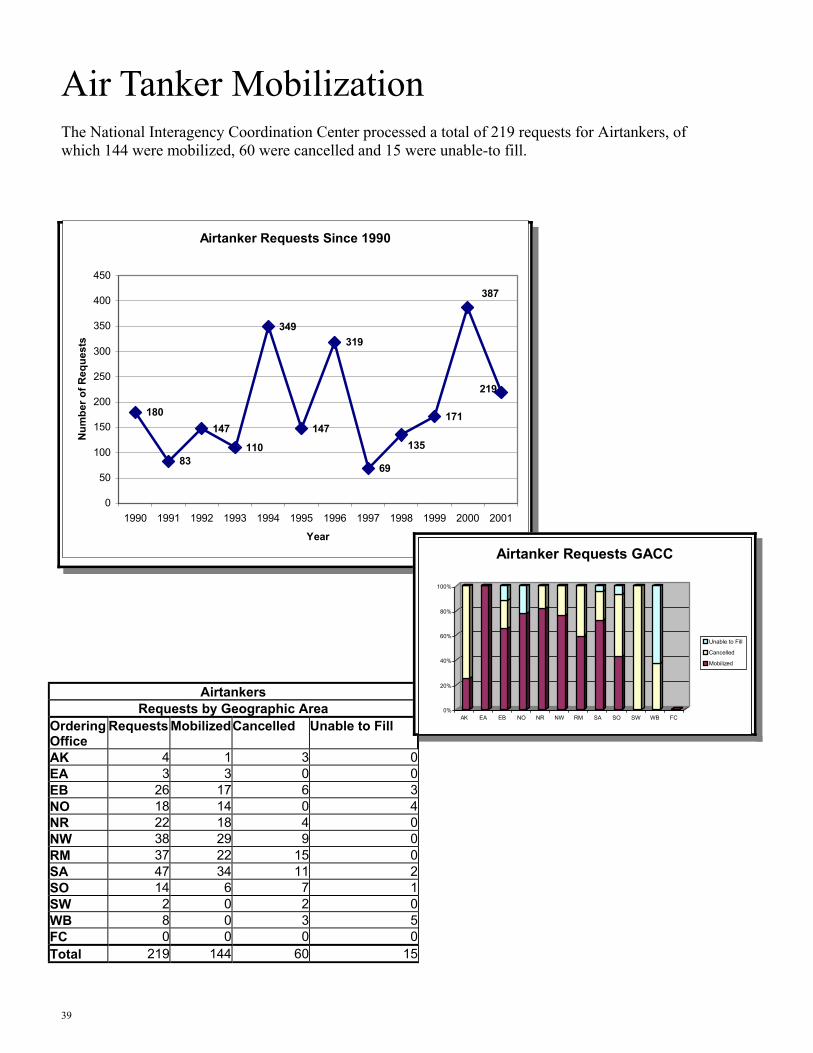
Air Tanker Mobilization The National Interagency Coordination Center processed a total of 219 requests for Airtankers, of which 144 were mobilized, 60 were cancelled and 15 were unable-to fill.
Airtanker Requests Since 1990
180
83
147
110
349
147
319
69
171
135
387
219
0
50
100
150
200
250
300
350
400
450
1990 1991 1992 1993 1994 1995 1996 1997 1998 1999 2000 2001
Year
Num
ber o
f Req
uest
s
Airtankers
Ordering Office
Requests Mobilized Cancelled Unable to Fill
AK 4 1 3 0 EA 3 3 0 0 EB 26 17 6 3 NO 18 14 0 4 NR 22 18 4 0 NW 38 29 9 0 RM 37 22 15 0 SA 47 34 11 2 SO 14 6 7 1 SW 2 0 2 0 WB 8 0 3 5 FC 0 0 0 0 Total 219 144 60 15
Requests by Geographic Area 0%
20%
40%
60%
80%
100%
AK EA EB NO NR NW RM SA SO SW WB FC
Airtanker Requests GACC
Unable to Fill
Cancelled
Mobilized
40
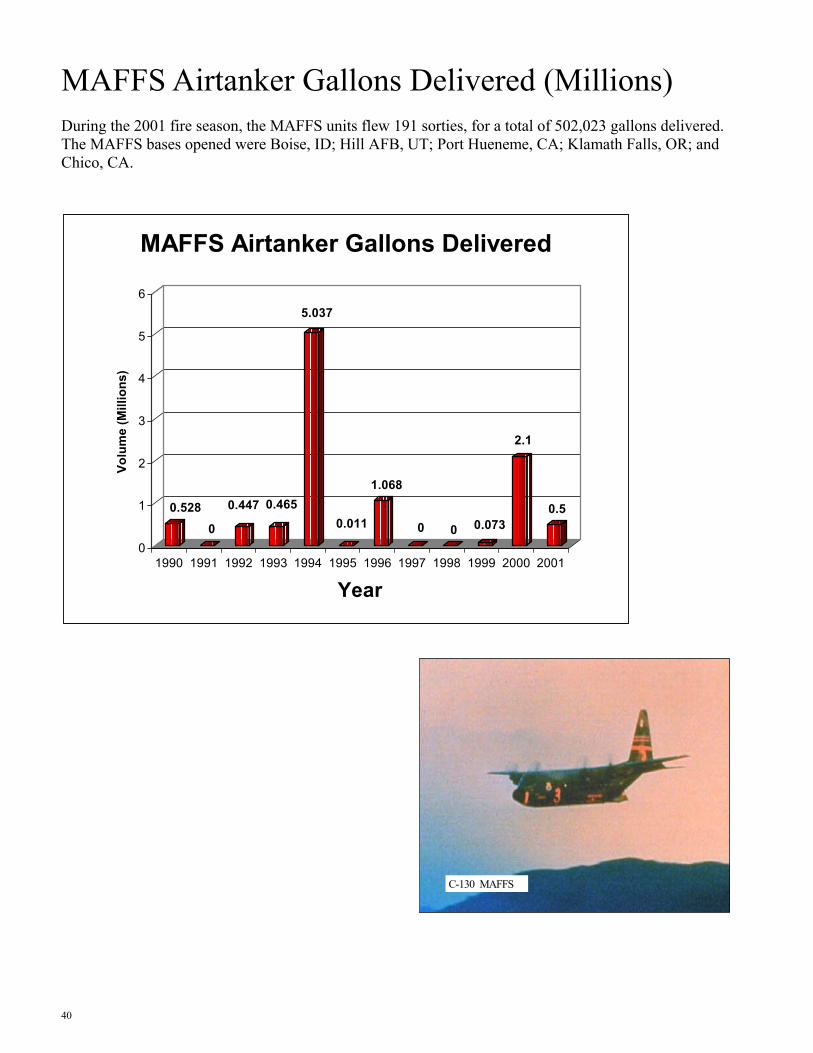
MAFFS Airtanker Gallons Delivered (Millions) During the 2001 fire season, the MAFFS units flew 191 sorties, for a total of 502,023 gallons delivered. The MAFFS bases opened were Boise, ID; Hill AFB, UT; Port Hueneme, CA; Klamath Falls, OR; and Chico, CA.
C-130 MAFFS
0.5280
0.447 0.465
5.037
0.011
1.068
0 0 0.073
2.1
0.5
0
1
2
3
4
5
6
Volu
me
(Mill
ions
)
1990 1991 1992 1993 1994 1995 1996 1997 1998 1999 2000 2001
Year
MAFFS Airtanker Gallons Delivered
41
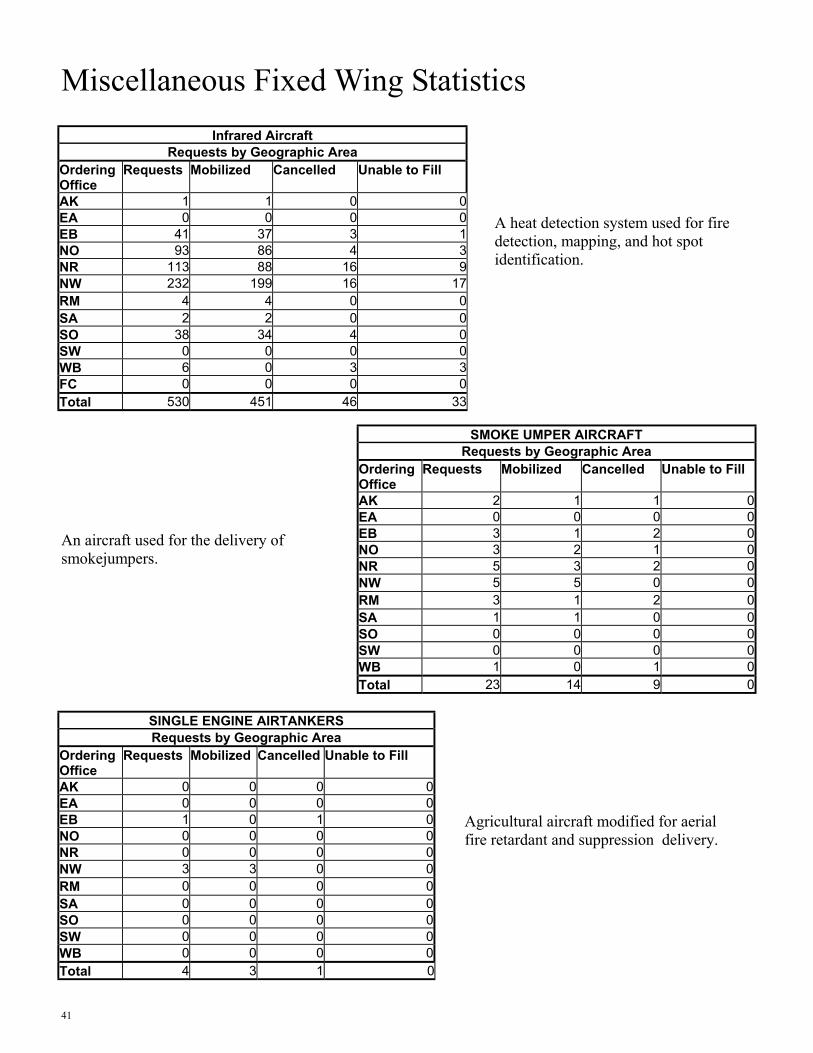
Miscellaneous Fixed Wing Statistics
SMOKE UMPER AIRCRAFT
Ordering Office
Requests Mobilized Cancelled Unable to Fill
AK 2 1 1 0 EA 0 0 0 0 EB 3 1 2 0 NO 3 2 1 0 NR 5 3 2 0 NW 5 5 0 0 RM 3 1 2 0 SA 1 1 0 0 SO 0 0 0 0 SW 0 0 0 0 WB 1 0 1 0 Total 23 14 9 0
Requests by Geographic Area
SINGLE ENGINE AIRTANKERS
Ordering Office
Requests Mobilized Cancelled Unable to Fill
AK 0 0 0 0 EA 0 0 0 0 EB 1 0 1 0 NO 0 0 0 0 NR 0 0 0 0 NW 3 3 0 0 RM 0 0 0 0 SA 0 0 0 0 SO 0 0 0 0 SW 0 0 0 0 WB 0 0 0 0 Total 4 3 1 0
Requests by Geographic Area
Infrared Aircraft
Ordering Office
Requests Mobilized Cancelled Unable to Fill
AK 1 1 0 0 EA 0 0 0 0 EB 41 37 3 1 NO 93 86 4 3 NR 113 88 16 9 NW 232 199 16 17 RM 4 4 0 0 SA 2 2 0 0 SO 38 34 4 0 SW 0 0 0 0 WB 6 0 3 3 FC 0 0 0 0 Total 530 451 46 33
Requests by Geographic Area
A heat detection system used for fire detection, mapping, and hot spot identification.
An aircraft used for the delivery of smokejumpers.
Agricultural aircraft modified for aerial fire retardant and suppression delivery.
42
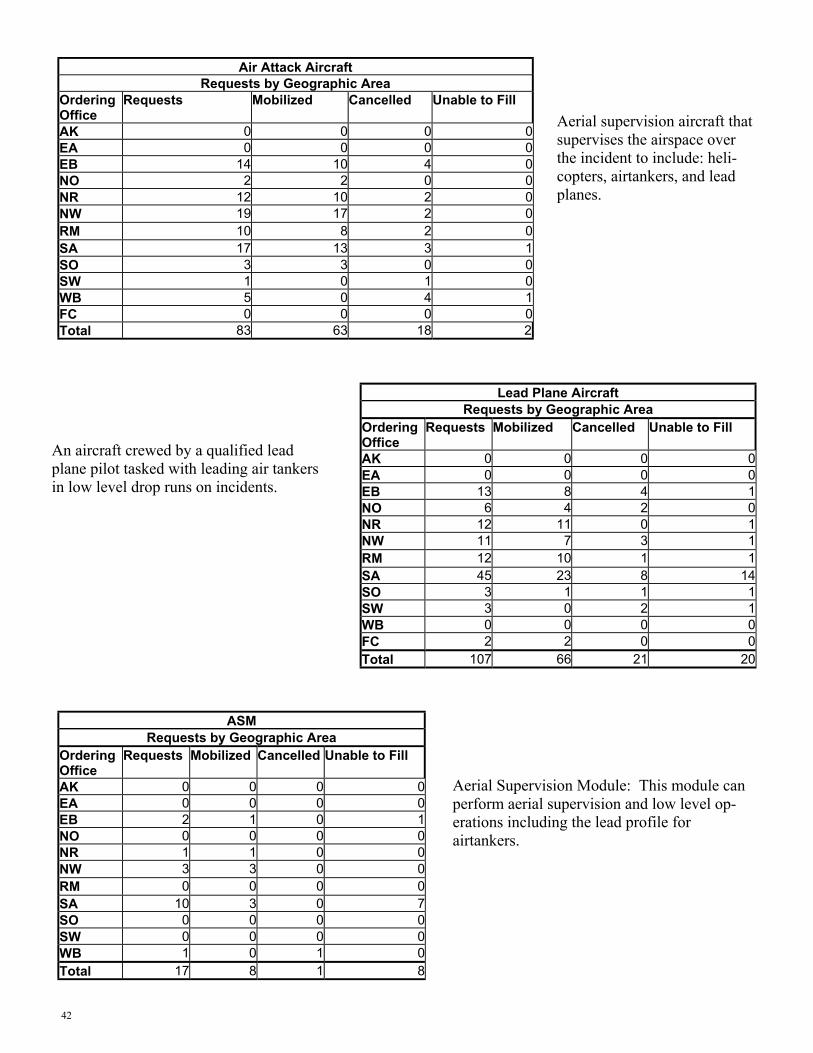
Air Attack Aircraft
Ordering Office
Requests Mobilized Cancelled Unable to Fill
AK 0 0 0 0 EA 0 0 0 0 EB 14 10 4 0 NO 2 2 0 0 NR 12 10 2 0 NW 19 17 2 0 RM 10 8 2 0 SA 17 13 3 1 SO 3 3 0 0 SW 1 0 1 0 WB 5 0 4 1 FC 0 0 0 0 Total 83 63 18 2
Requests by Geographic Area
Lead Plane Aircraft
Ordering Office
Requests Mobilized Cancelled Unable to Fill
AK 0 0 0 0 EA 0 0 0 0 EB 13 8 4 1 NO 6 4 2 0 NR 12 11 0 1 NW 11 7 3 1 RM 12 10 1 1 SA 45 23 8 14 SO 3 1 1 1 SW 3 0 2 1 WB 0 0 0 0 FC 2 2 0 0 Total 107 66 21 20
Requests by Geographic Area
Requests by Geographic Area Ordering Office
Requests Mobilized Cancelled Unable to Fill
AK 0 0 0 0 EA 0 0 0 0 EB 2 1 0 1 NO 0 0 0 0 NR 1 1 0 0 NW 3 3 0 0 RM 0 0 0 0 SA 10 3 0 7 SO 0 0 0 0 SW 0 0 0 0 WB 1 0 1 0 Total 17 8 1 8
ASM
Aerial supervision aircraft that supervises the airspace over the incident to include: heli-copters, airtankers, and lead planes.
An aircraft crewed by a qualified lead plane pilot tasked with leading air tankers in low level drop runs on incidents.
Aerial Supervision Module: This module can perform aerial supervision and low level op-erations including the lead profile for airtankers.