Embed Size (px)
Citation preview
Resource use and the nutritional status of sable antelopein the Okavango Delta region of northern Botswana
Michael C. Hensman1, Norman Owen-Smith1, Francesca Parrini1* andCasper M. Bonyongo2
1Centre for African Ecology, School of Animal, Plant and Environmental Sciences, University of the Witwatersrand, Wits, 2050, South Africa and2Okavango Research Institute, University of Botswana, Private Bag 285, Maun, Botswana
Abstract
The resource-use patterns and nutritional status of sable
antelope herds were investigated in the Okavango Delta
region of northern Botswana for comparison with those
documented for declining sable antelope populations
elsewhere in southern Africa. GPS collars recorded the
relative use of floodplain, upland and wooded grassland
habitats by the sable herds while VHF beacons facilitated
locating the herds for direct observations on feeding.
Surprisingly, the sable herds made greatest use of upland
grasslands, rather than the floodplain grasslands exposed
after floodwater had receded, during the dry season
months. In the upland grasslands, they exploited tall,
fibrous grass species that retained quite high levels of
greenness through the dry season. This ability, together
with partial use of the floodplain and some browsing on
new leaves and flowers, helped maintain dietary nitrogen
and phosphorus levels, as indicated by faecal nutrient
levels, above maintenance thresholds through the dry
season. Hence, the sable herds in the study region did not
seem to be limited nutritionally under the rainfall and
flooding conditions prevailing during the study.
Key words: Botswana, Hippotragus niger, nutritional status,
Okavango Delta, resource use
R�esum�e
Les sch�emas d’utilisation des ressources et le statut
nutritionnel de hardes d’antilopes sable ont �et�e �etudi�es
dans la r�egion du delta de l’Okavango, dans le nord du
Botswana, pour les comparer �a ceux qui sont document�es
pour d’autres populations de ces antilopes qui sont en
d�eclin ailleurs en Afrique australe. Des colliers GPS ont
enregistr�e la fr�equentation relative des habitats de plaines
inondables, des terres sur�elev�ees et de prairies arbor�ees
par les antilopes sable tandis que des balises VHF
facilitaient la localisation des hardes pour observer leur
alimentation en direct. �Etonnamment, pendant la saison
s�eche, les hardes de sable fr�equentaient surtout les
prairies �elev�ees, plutot que celles des plaines inondables
expos�ees apr�es la d�ecrue. Dans les prairies sur�elev�ees, elles
consommaient des esp�eces d’herbes hautes et fibreuses qui
restaient assez vertes pendant toute la saison s�eche. Cette
capacit�e, tout comme la fr�equentation partielle de la
plaine inondable et la consommation d’une certaine
quantit�e de jeunes feuilles et de fleurs, a permis de
maintenir le taux d’azote et de phosphore du r�egime
alimentaire, comme l’indique le taux f�ecal de ces nutri-
ments, au-dessus du seuil requis, pendant toute la saison
s�eche. Donc, les antilopes sable de la r�egion �etudi�ee n’ont
pas sembl�e etre limit�ees, au point de vue nutritionnel, par
les conditions dues aux chutes de pluie et aux inondations
observ�ees pendant l’�etude.
Introduction
Sable antelope (Hippotragus niger) have recently declined
substantially in abundance in South Africa’s Kruger
National Park (Ogutu & Owen-Smith, 2005; Owen-Smith
et al., 2012a), raising questions about possible causes.
Particularly in contention is whether this decline was
(1) an outcome of habitat desiccation following several
years of consistently low rainfall, or (2) a consequence of
heightened predation or competition, due to the augmen-
tation of water points which spread the presence of water-
dependent grazers such as zebra (Equus quagga) and buffalo
(Syncerus caffer) into the sable range. Our study was aimed*Correspondence: E-mail: [email protected]
© 2013 John Wiley & Sons Ltd, Afr. J. Ecol. 1
at investigating the resource dependency of sable antelope
in a part of their distribution range where the species had
remained generally abundant. Periodic aerial counts
showed little overall change in sable numbers in northern
Botswana since 1990 (Department of Wildlife and
National Parks, unpublished data), apart from a local
decline in the Okavango Delta region. Changing surface-
water availability would not be a factor in this region, nor
had the abundance of predators or competing grazers
changed. Accordingly, our study was focused on the
procurement of food resources in terms of the grass species
consumed and the retention of green foliage by these
grasses through the dry season. Uplands soils derived from
Kalahari sand are infertile and support predominantly
unpalatable grass species. Grazing ungulates are restricted
to the upland regions during peak flooding through the
early dry season, but later in the dry season, the receding
floodwaters expose regenerating green foliage in the
temporarily inundated grasslands. The availability of this
green foliage should alleviate the nutritional stress that is
normally most intense for grazers towards the end of the
dry season.
In the Kruger National Park, sable antelope consume a
wide range of grass species, but select strongly for
greener grass during dry season months (Macandza,
Owen-Smith & Cain, 2012a; Owen-Smith, le Roux &
Macandza, 2013). Elsewhere, sable depends on grassy
valleys termed ‘dambos’ to provide green forage through
the dry season, especially following burning (Estes &
Estes, 1974; Grobler, 1981; Magome et al., 2008; Parrini
& Owen-Smith, 2010). Although dependent on access to
surface water during the dry season, sable drink at
intervals of 3–4 days and can travel several kilometres to
and from water points (Cain, Owen-Smith & Macandza,
2012). Other grazers favouring relatively tall grass may
compete with sable for food (Macandza, Owen-Smith &
Cain, 2012b). The overall distribution of sable antelope
within the Kruger Park appeared negatively related to
the abundance of ungulates serving as principal prey
species for lions (Panthera leo), emphasizing the impor-
tance of predation as a limiting factor (Chirima et al.,
2013).
Accordingly, we expected that:
1 Sable would concentrate on floodplain grasses during
the late dry season months when the receding flood waters
promoted green grass regrowth, and utilize both upland
and floodplain grasslands during the wet season when
green grass was widely available.
2 Sable would feed on a wide range of grass species during
the wet season months, but restrict their diet to those grass
species that remained greenest during the dry season.
3 Through accessing the green grass on the floodplain
during the dry season, sable would maintain faecal
nitrogen and phosphorus levels in their dung above
maintenance levels throughout the year.
Methods
Study area
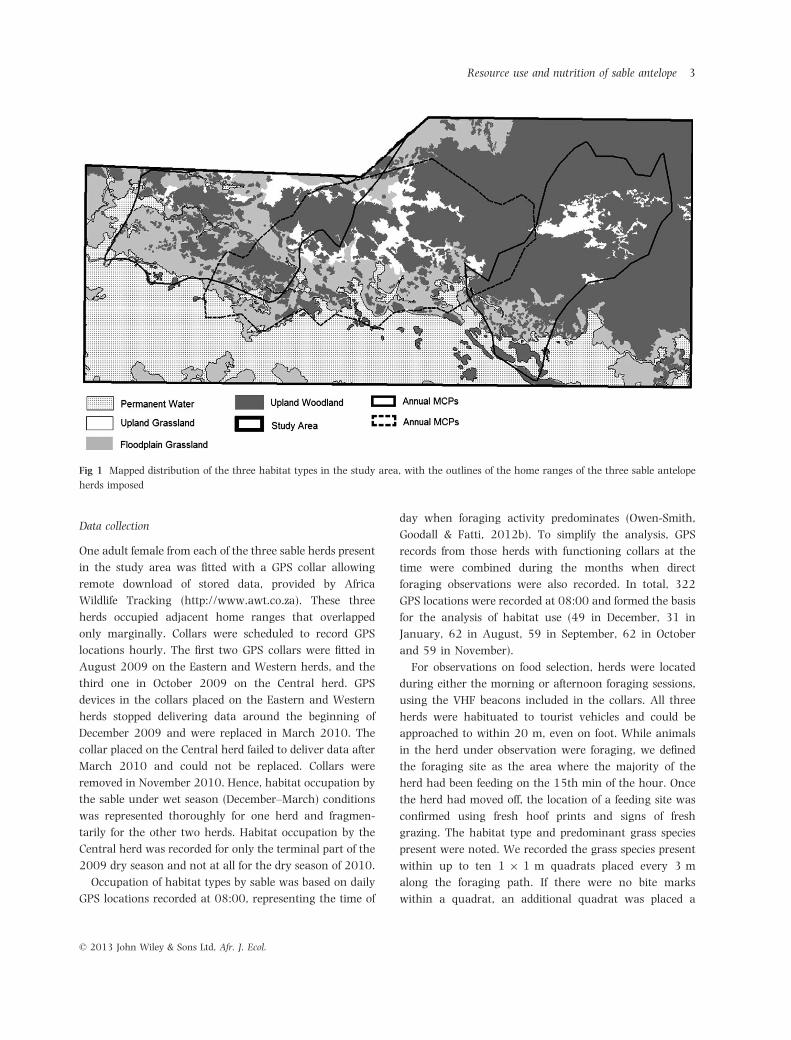
The study was situated in the Kwedi, Duba Plains and
Mapula concessions, located in the north-east of the
Okavango Delta in northern Botswana. Specific details of
the region and vegetation types are provided elsewhere
(Hensman, 2012). Annual rainfall recorded at Vumbura
Camp amounted to 500 mm in 2009 and 436 mm in
2010, compared with the long-term mean of 513 mm
recorded nearby at Shakawe and Maun (1964–1994,
McCarthy, Bloem & Larkin, 1998). The first rainfall ending
the dry season occurred at the end of October in 2009 and
during mid-November in 2010. In both 2009 and 2010,
the Okavango Delta experienced exceptionally high floods
due to high rainfall in the catchment in Angola. The
floodwater reached its peak in the Kwedi concession in
mid-May 2010, after which water levels remained high
until the beginning of July. Thereafter, flooding subsided
until the floodplain was completely exposed in mid-
September 2010. This pattern was similar in 2009,
although not documented specifically.
Vegetation types were mapped using Google Earth
(CNES/SPOT image dated 31/05/2008). For the purposes
of this study, the eight vegetation types distinguished by
Hensman (2012) were grouped into three habitat types
differing in the composition of the grass layer: upland
grassland, upland woodland and floodplain grassland
(Fig. 1). Digitizing errors were fixed using standard topol-
ogy generation procedures implemented in ArcMap 10.0.
Temporal changes in greenness within these habitat types
were obtained using 16-day composites of MODIS
Normalized Difference Vegetation Index (NDVI) images
(MODISv5), representing December 2009, January 2010
and August 2010 to November 2010. Comparisons of
greenness were restricted to the upland and floodplain
grassland habitats because of the potentially confounding
influence of greenness in the tree layer on greenness in the
upland woodland.
© 2013 John Wiley & Sons Ltd, Afr. J. Ecol.
2 Michael C. Hensman et al.
Data collection
One adult female from each of the three sable herds present
in the study area was fitted with a GPS collar allowing
remote download of stored data, provided by Africa
Wildlife Tracking (http://www.awt.co.za). These three
herds occupied adjacent home ranges that overlapped
only marginally. Collars were scheduled to record GPS
locations hourly. The first two GPS collars were fitted in
August 2009 on the Eastern and Western herds, and the
third one in October 2009 on the Central herd. GPS
devices in the collars placed on the Eastern and Western
herds stopped delivering data around the beginning of
December 2009 and were replaced in March 2010. The
collar placed on the Central herd failed to deliver data after
March 2010 and could not be replaced. Collars were
removed in November 2010. Hence, habitat occupation by
the sable under wet season (December–March) conditions
was represented thoroughly for one herd and fragmen-
tarily for the other two herds. Habitat occupation by the
Central herd was recorded for only the terminal part of the
2009 dry season and not at all for the dry season of 2010.
Occupation of habitat types by sable was based on daily
GPS locations recorded at 08:00, representing the time of
day when foraging activity predominates (Owen-Smith,
Goodall & Fatti, 2012b). To simplify the analysis, GPS
records from those herds with functioning collars at the
time were combined during the months when direct
foraging observations were also recorded. In total, 322
GPS locations were recorded at 08:00 and formed the basis
for the analysis of habitat use (49 in December, 31 in
January, 62 in August, 59 in September, 62 in October
and 59 in November).
For observations on food selection, herds were located
during either the morning or afternoon foraging sessions,
using the VHF beacons included in the collars. All three
herds were habituated to tourist vehicles and could be
approached to within 20 m, even on foot. While animals
in the herd under observation were foraging, we defined
the foraging site as the area where the majority of the
herd had been feeding on the 15th min of the hour. Once
the herd had moved off, the location of a feeding site was
confirmed using fresh hoof prints and signs of fresh
grazing. The habitat type and predominant grass species
present were noted. We recorded the grass species present
within up to ten 1 9 1 m quadrats placed every 3 m
along the foraging path. If there were no bite marks
within a quadrat, an additional quadrat was placed a
Fig 1 Mapped distribution of the three habitat types in the study area, with the outlines of the home ranges of the three sable antelope
herds imposed
© 2013 John Wiley & Sons Ltd, Afr. J. Ecol.
Resource use and nutrition of sable antelope 3
metre further along the path until fresh bite marks were
enclosed. In each quadrat, we noted those grass species
that had been grazed and counted the number of bites
taken from each tuft. A grass species scored as grazed if
at least one fresh bite was found on any of the tufts
within any of the quadrats. A bite was defined as an area
of cropped grass that could be covered by a closed fist. All
sedges were grouped as ‘sedges’ (including Cyperus
denudatus, C. haspan, C. longus, Fimbristylis longiculmus
and Schoenoplectus corymbosus). Tuft greenness was
estimated as the proportion of leaves in the tuft that
were green, classified into eight categories (0%; 1–10%,
11–25%, 26–50%, 51–75%, 76–90%, 91–99%, 100%).
Direct observations of foraging made during morning or
afternoon sessions were assumed to be independent
samples of food choices. Foraging observations were
switched to a different herd at least every third day of
data collection. In total, 158 independent samples were
collected: 83 during December 2009–January 2010 and
75 during August 2010–November 2010. Palatability
ratings for grass species were taken from van Oudtshoorn
(1999). For assessing nutritional status from faecal
samples, dung pellets deposited during foraging observa-
tions were collected later from the top of the piles to
avoid soil contamination. Samples were air-dried in
brown paper bags and submitted to BemLab (http://
www.bemlab.co.za) for analysis for nitrogen (N) and
phosphorus (P). A Leco instrument and Bray II extraction
were used, respectively, followed by analysis on an
inductively coupled plasma spectrometer. Results were
expressed as percentage of dry matter. Six samples per
month (two from each herd) were collected from
December 2009 to January 2010 and from September
2010 to November 2010. Only four samples were
collected during August 2010 as the Central herd could
not be located then.
Data analysis
Use of upland grassland, upland woodland and floodplain
was determined by counting the number of GPS locations
at 08:00 in each habitat type each month as a proportion
of the total number of GPS locations at this time recorded
in all habitat types each month. The availability of each
grass species in each habitat type was estimated as the
number morning or afternoon foraging sites where the
species was present divided by the total number of samples
in these habitats. Following Owen-Smith and Cooper
(1987), the seasonal acceptability of each grass species
was estimated as the number of samples where a grass
species was eaten divided by the number of samples where
the grass species was present in each season. Forage
species that did not occur in ten or more foraging sites in at
least one of the habitats or seasons were excluded from the
analyses. The seasonal dietary contribution of each grass
species was assessed as the number of bites recorded from
each species divided by the total number of bites recorded
across all species in each season. Chi-squared tests were
used to compare these estimates between seasons, but
derived P-values must be evaluated conservatively because
bites are not independent. A greenness value for each
species was obtained by averaging the mid-point greenness
values for each species across all quadrats containing that
species in each foraging site within each season. A one-
way ANOVA with season as a factor was used to compare
faecal N and P content between seasons. The sample size
was too low to establish differences between herds in these
nutritional measures. All statistical analyses were carried
out in R (R Development Core Team 2008), version
2.13.1.
Results
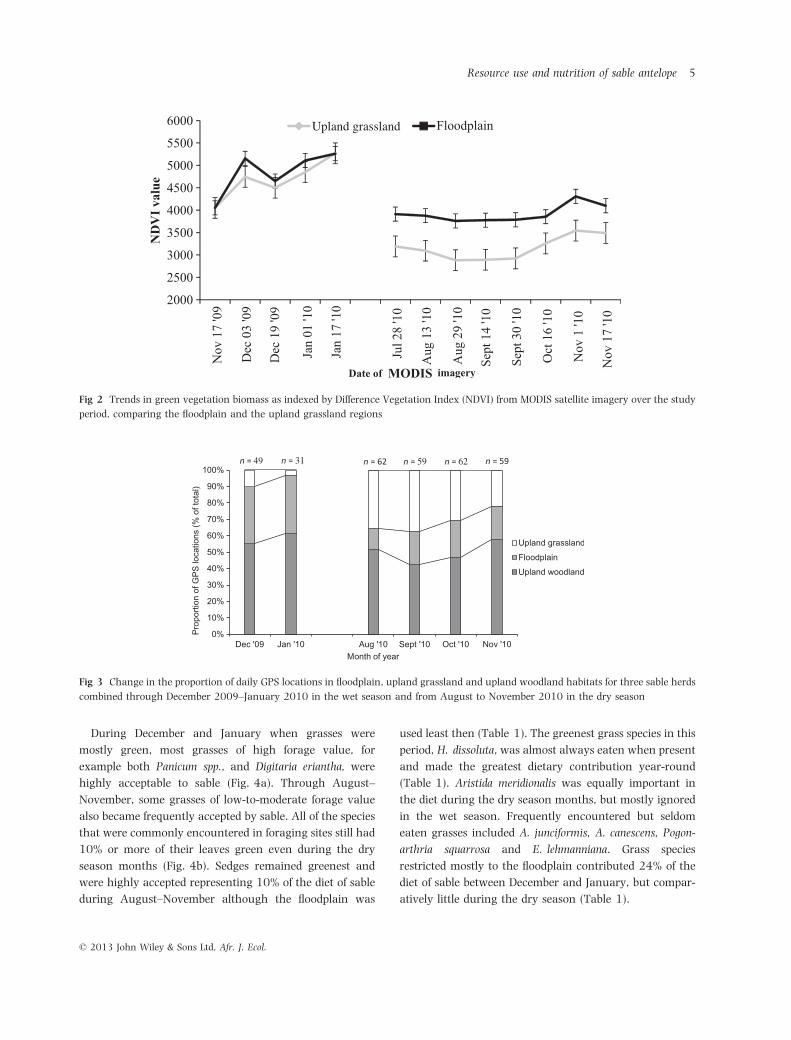
The upland and floodplain grasslands exhibited closely
similar levels of greenness, as represented by NDVI, from
November 2009 through January 2010 in the wet season.
The floodplain grasslands remained partially inundated
during August into the beginning of September. From
later July through mid-November 2010, the floodplain
remained consistently much greener than the upland
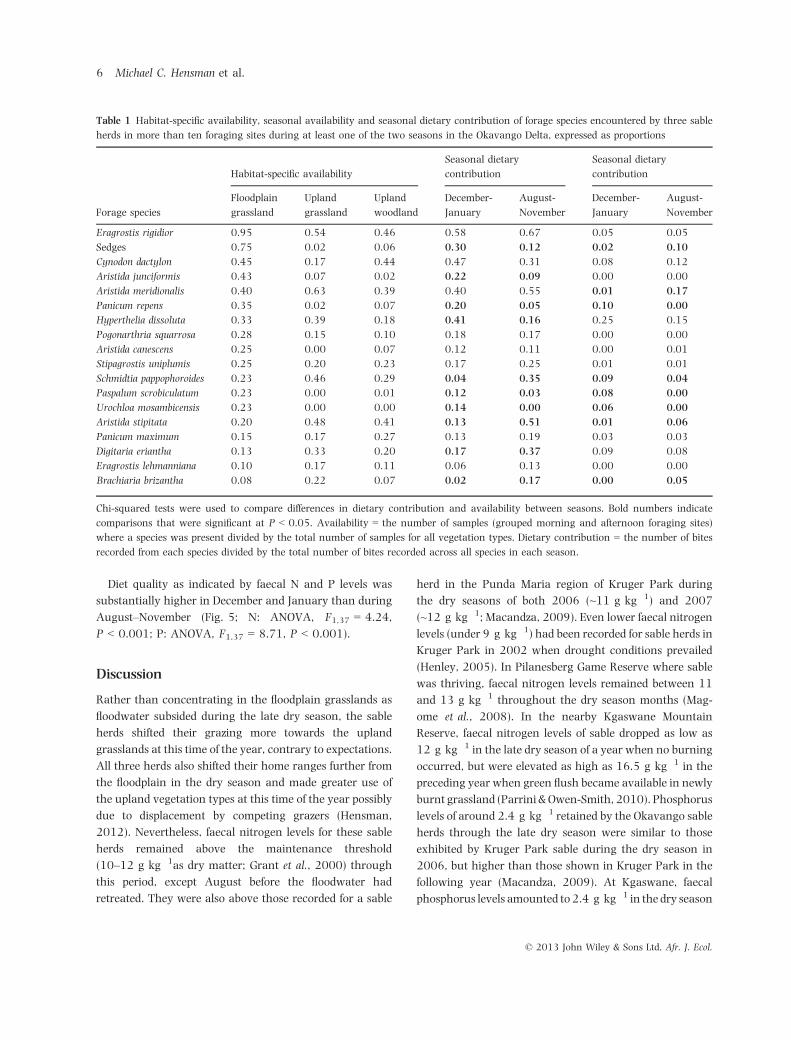
grassland (Fig. 2). The sable herds occupied mainly the
upland woodland and floodplain during the wet season but
shifted their foraging time to the upland grassland, at the
expense of both of the former habitats, through the dry
season months (Fig. 3).
Of the 46 different grass species encountered in foraging
sites, 17 grass species occurred in more than ten foraging
sites in at least one of the two seasons (Table 1). Urochloa
mosambicensis, Paspalum scrobiculatum, Panicum repens and
sedges were available mostly on the floodplain, and
Brachiaria brizantha plus Schmidtia pappophoroides mostly
in the upland grassland (Table 1). Panicum maximum had
greatest availability in upland woodland, while Aristida
meridionalis, Eragrostis rigidior and Hyperthelia dissoluta
were commonly available in all three habitat types
(Table 1).
© 2013 John Wiley & Sons Ltd, Afr. J. Ecol.
4 Michael C. Hensman et al.
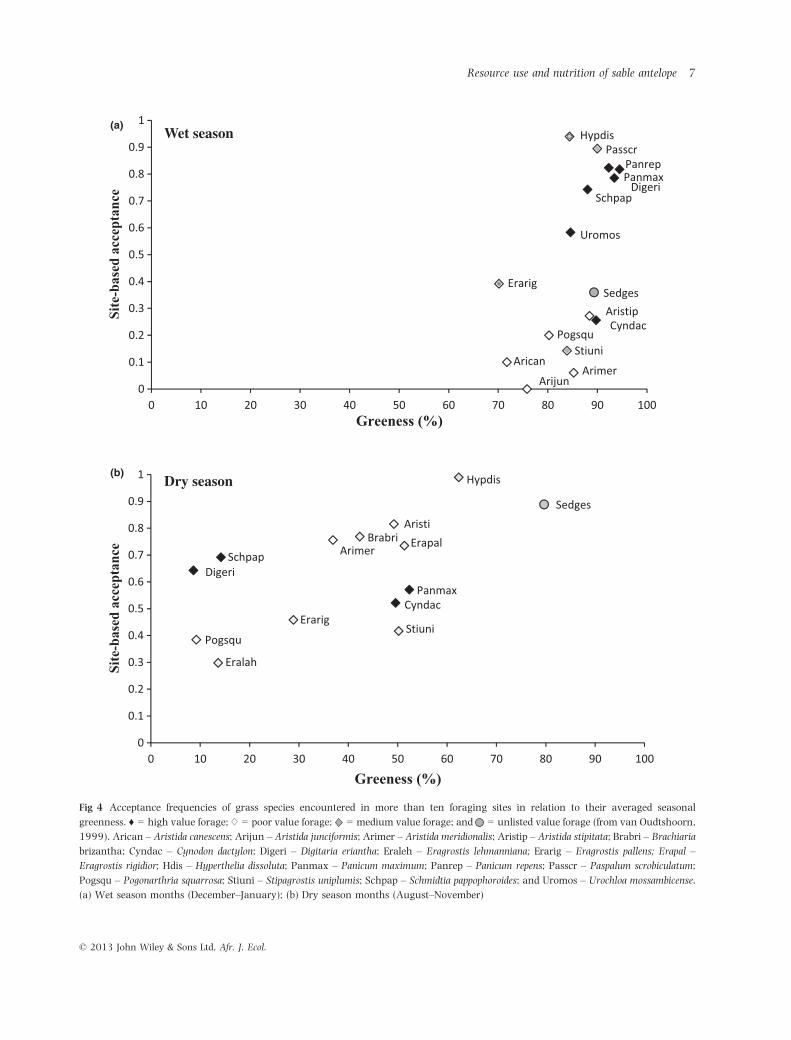
During December and January when grasses were
mostly green, most grasses of high forage value, for
example both Panicum spp., and Digitaria eriantha, were
highly acceptable to sable (Fig. 4a). Through August–
November, some grasses of low-to-moderate forage value
also became frequently accepted by sable. All of the species
that were commonly encountered in foraging sites still had
10% or more of their leaves green even during the dry
season months (Fig. 4b). Sedges remained greenest and
were highly accepted representing 10% of the diet of sable
during August–November although the floodplain was
used least then (Table 1). The greenest grass species in this
period, H. dissoluta, was almost always eaten when present
and made the greatest dietary contribution year-round
(Table 1). Aristida meridionalis was equally important in
the diet during the dry season months, but mostly ignored
in the wet season. Frequently encountered but seldom
eaten grasses included A. junciformis, A. canescens, Pogon-
arthria squarrosa and E. lehmanniana. Grass species
restricted mostly to the floodplain contributed 24% of the
diet of sable between December and January, but compar-
atively little during the dry season (Table 1).
Fig 3 Change in the proportion of daily GPS locations in floodplain, upland grassland and upland woodland habitats for three sable herds
combined through December 2009–January 2010 in the wet season and from August to November 2010 in the dry season
Fig 2 Trends in green vegetation biomass as indexed by Difference Vegetation Index (NDVI) from MODIS satellite imagery over the study
period, comparing the floodplain and the upland grassland regions
© 2013 John Wiley & Sons Ltd, Afr. J. Ecol.
Resource use and nutrition of sable antelope 5
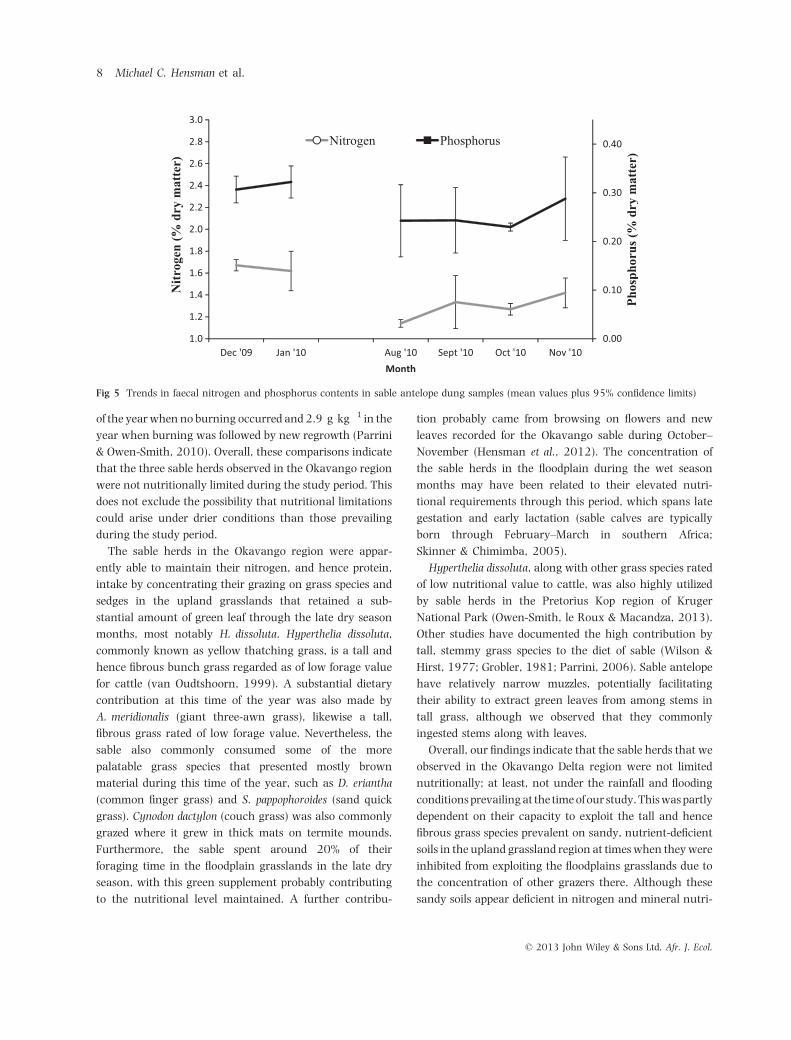
Diet quality as indicated by faecal N and P levels was
substantially higher in December and January than during
August–November (Fig. 5; N: ANOVA, F1,37 = 4.24,
P < 0.001; P: ANOVA, F1,37 = 8.71, P < 0.001).
Discussion
Rather than concentrating in the floodplain grasslands as
floodwater subsided during the late dry season, the sable
herds shifted their grazing more towards the upland
grasslands at this time of the year, contrary to expectations.
All three herds also shifted their home ranges further from
the floodplain in the dry season and made greater use of
the upland vegetation types at this time of the year possibly
due to displacement by competing grazers (Hensman,
2012). Nevertheless, faecal nitrogen levels for these sable
herds remained above the maintenance threshold
(10–12 g kg�1as dry matter; Grant et al., 2000) through
this period, except August before the floodwater had
retreated. They were also above those recorded for a sable
herd in the Punda Maria region of Kruger Park during
the dry seasons of both 2006 (~11 g kg�1) and 2007
(~12 g kg�1; Macandza, 2009). Even lower faecal nitrogen
levels (under 9 g kg�1) had been recorded for sable herds in
Kruger Park in 2002 when drought conditions prevailed
(Henley, 2005). In Pilanesberg Game Reserve where sable
was thriving, faecal nitrogen levels remained between 11
and 13 g kg�1 throughout the dry season months (Mag-
ome et al., 2008). In the nearby Kgaswane Mountain
Reserve, faecal nitrogen levels of sable dropped as low as
12 g kg�1 in the late dry season of a year when no burning
occurred, but were elevated as high as 16.5 g kg�1 in the
preceding year when green flush became available in newly
burnt grassland (Parrini &Owen-Smith, 2010). Phosphorus
levels of around 2.4 g kg�1 retained by the Okavango sable
herds through the late dry season were similar to those
exhibited by Kruger Park sable during the dry season in
2006, but higher than those shown in Kruger Park in the
following year (Macandza, 2009). At Kgaswane, faecal
phosphorus levels amounted to 2.4 g kg�1 in the dry season
Table 1 Habitat-specific availability, seasonal availability and seasonal dietary contribution of forage species encountered by three sable
herds in more than ten foraging sites during at least one of the two seasons in the Okavango Delta, expressed as proportions
Forage species
Habitat-specific availability
Seasonal dietary
contribution
Seasonal dietary
contribution
Floodplain
grassland
Upland
grassland
Upland
woodland
December-
January
August-
November
December-
January
August-
November
Eragrostis rigidior 0.95 0.54 0.46 0.58 0.67 0.05 0.05
Sedges 0.75 0.02 0.06 0.30 0.12 0.02 0.10
Cynodon dactylon 0.45 0.17 0.44 0.47 0.31 0.08 0.12
Aristida junciformis 0.43 0.07 0.02 0.22 0.09 0.00 0.00
Aristida meridionalis 0.40 0.63 0.39 0.40 0.55 0.01 0.17
Panicum repens 0.35 0.02 0.07 0.20 0.05 0.10 0.00
Hyperthelia dissoluta 0.33 0.39 0.18 0.41 0.16 0.25 0.15
Pogonarthria squarrosa 0.28 0.15 0.10 0.18 0.17 0.00 0.00
Aristida canescens 0.25 0.00 0.07 0.12 0.11 0.00 0.01
Stipagrostis uniplumis 0.25 0.20 0.23 0.17 0.25 0.01 0.01
Schmidtia pappophoroides 0.23 0.46 0.29 0.04 0.35 0.09 0.04
Paspalum scrobiculatum 0.23 0.00 0.01 0.12 0.03 0.08 0.00
Urochloa mosambicensis 0.23 0.00 0.00 0.14 0.00 0.06 0.00
Aristida stipitata 0.20 0.48 0.41 0.13 0.51 0.01 0.06
Panicum maximum 0.15 0.17 0.27 0.13 0.19 0.03 0.03
Digitaria eriantha 0.13 0.33 0.20 0.17 0.37 0.09 0.08
Eragrostis lehmanniana 0.10 0.17 0.11 0.06 0.13 0.00 0.00
Brachiaria brizantha 0.08 0.22 0.07 0.02 0.17 0.00 0.05
Chi-squared tests were used to compare differences in dietary contribution and availability between seasons. Bold numbers indicate
comparisons that were significant at P < 0.05. Availability = the number of samples (grouped morning and afternoon foraging sites)
where a species was present divided by the total number of samples for all vegetation types. Dietary contribution = the number of bites
recorded from each species divided by the total number of bites recorded across all species in each season.
© 2013 John Wiley & Sons Ltd, Afr. J. Ecol.
6 Michael C. Hensman et al.
(a)
(b)Dry season
Wet season
Fig 4 Acceptance frequencies of grass species encountered in more than ten foraging sites in relation to their averaged seasonal
greenness. ♦ = high value forage; ♢ = poor value forage; = medium value forage; and = unlisted value forage (from van Oudtshoorn,
1999). Arican – Aristida canescens; Arijun – Aristida junciformis; Arimer – Aristida meridionalis; Aristip – Aristida stipitata; Brabri – Brachiaria
brizantha; Cyndac – Cynodon dactylon; Digeri – Digitaria eriantha; Eraleh – Eragrostis lehmanniana; Erarig – Eragrostis pallens; Erapal –
Eragrostis rigidior; Hdis – Hyperthelia dissoluta; Panmax – Panicum maximum; Panrep – Panicum repens; Passcr – Paspalum scrobiculatum;
Pogsqu – Pogonarthria squarrosa; Stiuni – Stipagrostis uniplumis; Schpap – Schmidtia pappophoroides; and Uromos – Urochloa mossambicense.
(a) Wet season months (December–January); (b) Dry season months (August–November)
© 2013 John Wiley & Sons Ltd, Afr. J. Ecol.
Resource use and nutrition of sable antelope 7
of the yearwhen no burning occurred and 2.9 g kg�1 in the
year when burning was followed by new regrowth (Parrini
& Owen-Smith, 2010). Overall, these comparisons indicate
that the three sable herds observed in the Okavango region
were not nutritionally limited during the study period. This
does not exclude the possibility that nutritional limitations
could arise under drier conditions than those prevailing
during the study period.
The sable herds in the Okavango region were appar-
ently able to maintain their nitrogen, and hence protein,
intake by concentrating their grazing on grass species and
sedges in the upland grasslands that retained a sub-
stantial amount of green leaf through the late dry season
months, most notably H. dissoluta. Hyperthelia dissoluta,
commonly known as yellow thatching grass, is a tall and
hence fibrous bunch grass regarded as of low forage value
for cattle (van Oudtshoorn, 1999). A substantial dietary
contribution at this time of the year was also made by
A. meridionalis (giant three-awn grass), likewise a tall,
fibrous grass rated of low forage value. Nevertheless, the
sable also commonly consumed some of the more
palatable grass species that presented mostly brown
material during this time of the year, such as D. eriantha
(common finger grass) and S. pappophoroides (sand quick
grass). Cynodon dactylon (couch grass) was also commonly
grazed where it grew in thick mats on termite mounds.
Furthermore, the sable spent around 20% of their
foraging time in the floodplain grasslands in the late dry
season, with this green supplement probably contributing
to the nutritional level maintained. A further contribu-
tion probably came from browsing on flowers and new
leaves recorded for the Okavango sable during October–
November (Hensman et al., 2012). The concentration of
the sable herds in the floodplain during the wet season
months may have been related to their elevated nutri-
tional requirements through this period, which spans late
gestation and early lactation (sable calves are typically
born through February–March in southern Africa;
Skinner & Chimimba, 2005).
Hyperthelia dissoluta, along with other grass species rated
of low nutritional value to cattle, was also highly utilized
by sable herds in the Pretorius Kop region of Kruger
National Park (Owen-Smith, le Roux & Macandza, 2013).
Other studies have documented the high contribution by
tall, stemmy grass species to the diet of sable (Wilson &
Hirst, 1977; Grobler, 1981; Parrini, 2006). Sable antelope
have relatively narrow muzzles, potentially facilitating
their ability to extract green leaves from among stems in
tall grass, although we observed that they commonly
ingested stems along with leaves.
Overall, our findings indicate that the sable herds that we
observed in the Okavango Delta region were not limited
nutritionally; at least, not under the rainfall and flooding
conditionsprevailingat the timeofour study.Thiswaspartly
dependent on their capacity to exploit the tall and hence
fibrous grass species prevalent on sandy, nutrient-deficient
soils in the upland grassland region at timeswhen theywere
inhibited from exploiting the floodplains grasslands due to
the concentration of other grazers there. Although these
sandy soils appear deficient in nitrogen and mineral nutri-
Fig 5 Trends in faecal nitrogen and phosphorus contents in sable antelope dung samples (mean values plus 95% confidence limits)
© 2013 John Wiley & Sons Ltd, Afr. J. Ecol.
8 Michael C. Hensman et al.
ents, the water infiltration that they allow seems to promote
a greater retention of green foliage through the dry season
than is typical of the more palatable grasses prevalent on
clayey soils. The ability of sable antelope to exploit these
conditions, less attractive to other grazers, contributes to the
distinct grazing niche that they occupy.
Acknowledgements
Financial support was provided by the National Research
Foundation (NRF) of South Africa, the University of the
Witwatersrand, the Wilderness Wildlife Trust, Classic
Africa and the Conservation Foundation. Logistic support
was provided by Wilderness Safaris in various ways and by
the Okavango Research Institute of the University of
Botswana. MODIS NDVI data were provided by the
Agricultural Research Councils Institute for Soil Climate
and Water, South Africa.
References
Cain, J.W. III, Owen-Smith, N. & Macandza, V.A. (2012) The costs
of drinking: comparative water dependency of sable antelope
and zebra. J. Zool. 286, 58–67.
Chirima, G.J., Owen-Smith, N., Erasmus, B.F.N. & Parrini, F. (2013)
Distributional niche of relatively rare sable antelope in a South
African savanna: habitat versus biotic relationships. Ecography
36, 68–79.
Estes, R.D. & Estes, R.K. (1974) The biology and conservation of
the giant sable antelope, Hippotragus niger variani (Thomas
1961). Proc. Acad. Nat. Sci. Phila. 126, 73–104.
Grant, C.C., Peel, M.J.S., Zambatis, N. & van Ryssen, J.B.J. (2000)
Nitrogen and phosphorus concentration in faeces: an indicator
of range quality as a practical adjunct to existing range
evaluation methods. Afr. J. Range Forage Sci. 17, 81–92.
Grobler, J.H. (1981) Feeding behaviour of sable Hippotragus niger
niger (Harris, 1838) in the Rhodes Matopos National Park,
Zimbabwe. S. Afr. J. Zool. 16 50–58.
Henley, S. (2005) Habitat Dependency and Nutritional Ecology of
Sable Antelope in Two Regions of the Kruger National Park. Report
to South African National parks, Skukuza.
Hensman, M.C. (2012) Home range and habitat use of sable
antelope (Hippotragus niger) in the Okavango Delta. MSc thesis,
University of the Witwatersrand, Johannesburg.
Hensman, M.C., Owen-Smith, N., Parrini, F. & Erasmus, B.F.N.
(2012) Dry season browsing by sable antelope in northern
Botswana. Afr. J. Ecol. 50, 513–516.
Macandza, V.A. (2009) Resource Partitioning Between Low-
Density and High-Density Grazers: Sable Antelope, Zebra and
Buffalo. PhD thesis, University of the Witwatersrand,
Johannesburg.
Macandza, V.A., Owen-Smith, N. & Cain, J.W. III (2012a) Habitat
and resource partitioning between abundant and relatively rare
grazing ungulates. J. Zool. 287, 175–185.
Macandza, V.A., Owen-Smith, N. & Cain, J.W. III (2012b) Dynamic
spatial partitioning and coexistence among tall grass grazers in
an African savanna. Oikos 121, 891–898.
Magome, H., Cain, J.W. III, Owen-Smith, N. & Henley, S.R. (2008)
Forage selection of sable antelope in Pilanesberg Game Reserve,
South Africa. S. Afr. J. Wildl. Res. 38, 35–41.
McCarthy, T.S., Bloem, A. & Larkin, P.A. (1998) Observations on
the hydrology and geohydrology of the Okavango Delta. S. Afr.
J. Geol. 101, 101–117.
Ogutu, J.O. & Owen-Smith, N. (2005) Oscillations in large mammal
populations: are they related to predation or rainfall? Afr. J. Ecol.
43, 332–339.
Owen-Smith, N. & Cooper, S.M. (1987) Palatability of woody plants
to browsing ruminants in a South African Savanna. Ecology 68,
319–331.
Owen-Smith, N., Chirima, G.J., Macandza, V. & le Roux, E. (2012a)
Shrinking sable antelope numbers in Kruger National Park:
what is suppressing population recovery? Anim. Conserv. 15,
195–204.
Owen-Smith, N. & Cooper, S.M., (1987) Palatability of woody
plants to browsing ruminants in a South African Savanna.
Ecology 68, 319–331.
Owen-Smith, N., Goodall, V. & Fatti, F. (2012b) Applying mixture
models to derive activity states from movement rates of large
herbivores obtained using GPS telemetry. Wildl. Res. 39,
452–462.
Owen-Smith, N., Le Roux, E. & Macandza, V. (2013) Are relatively
rare antelope narrowly selective feeders? A sable antelope –
zebra comparison. J. Zool. doi: 10.1111/jzo.12058.
Parrini, F. (2006) Nutritional and social ecology of the sable
antelope in the Magaliesberg Nature Reserve. PhD thesis,
University of the Witwatersrand, Johannesburg.
Parrini, F. & Owen-Smith, N. (2010) The importance of post-fire
regrowth for sable antelope in a Southern African savanna. Afr.
J. Ecol. 48, 526–534.
R Development Core Team (2008) R: A Language and Environment
for Statistical Computing. R Foundation for Statistical
Computing, Vienna, Austria. Available at: http://www.
R-project.org.
Skinner, J.D. & Chimimba, C.T. (2005) The Mammals of the Southern
African Subregion, 3rd edn. Cambridge University Press, Cape
Town.
van Oudtshoorn, F. (1999) Guide to Grasses of Southern Africa,
3rd edn. Briza Publications, Pretoria.
Wilson, D.E. & Hirst, S.M. (1977) Ecology and factors limiting
roan and sable antelope populations in South Africa. Wildl.
Monogr. 54, 3–111.
(Manuscript accepted 26 June 2013)
doi: 10.1111/aje.12113
© 2013 John Wiley & Sons Ltd, Afr. J. Ecol.
Resource use and nutrition of sable antelope 9