Embed Size (px)
Citation preview

97Resources and Energy Quarterly March 2021
10.1 Summary Higher prices are expected to push the value of Australia’s gold exports
up to a record of $29 billion in 2020–21. Earnings (in real terms) are then projected to decline to $22 billion in 2025–26, as gold prices ease back.
Export volumes are forecast to fall by 1.8% to 344 tonnes in 2020–21, as high gold prices reduce gold demand. Volumes are projected to reach 418 tonnes by 2025–26, as demand recovers (see Australia section).
An effective COVID-19 vaccine rollout and consequent global economic rebound is projected to see the gold price slide from US$1,700 in 2021 to US$1,210 an ounce in 2026 in real terms.
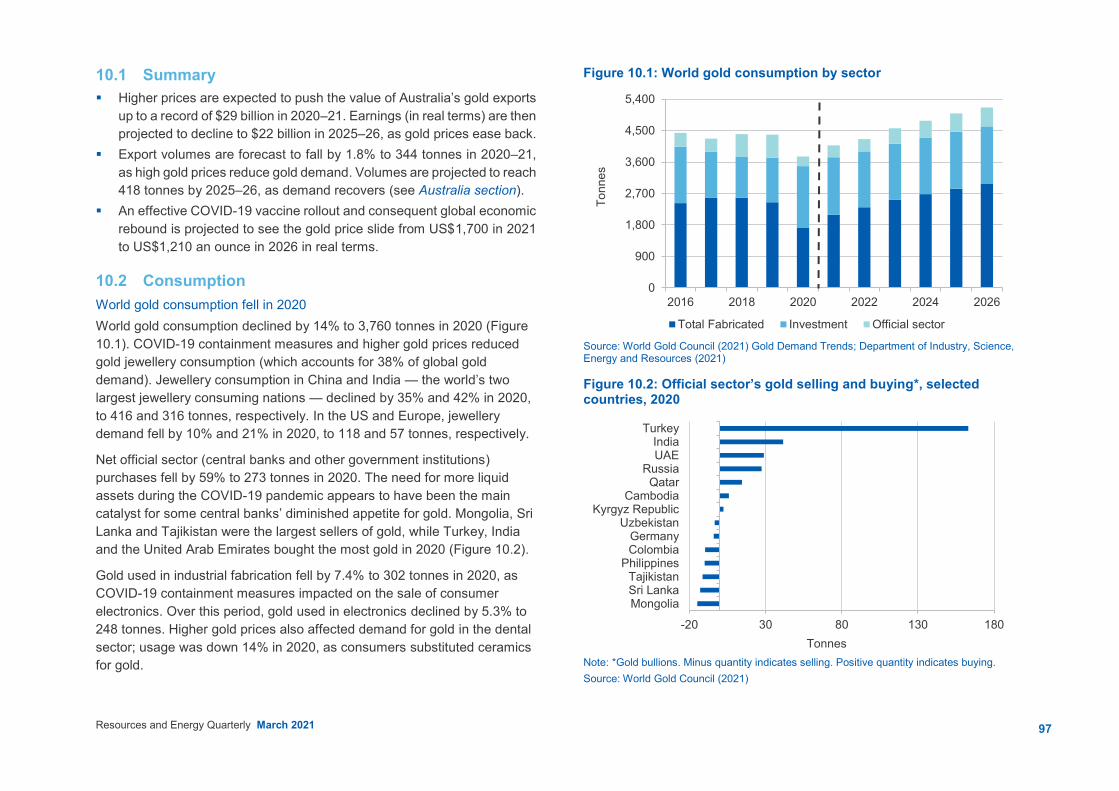
10.2 Consumption World gold consumption fell in 2020 World gold consumption declined by 14% to 3,760 tonnes in 2020 (Figure 10.1). COVID-19 containment measures and higher gold prices reduced gold jewellery consumption (which accounts for 38% of global gold demand). Jewellery consumption in China and India — the world’s two largest jewellery consuming nations — declined by 35% and 42% in 2020, to 416 and 316 tonnes, respectively. In the US and Europe, jewellery demand fell by 10% and 21% in 2020, to 118 and 57 tonnes, respectively.
Net official sector (central banks and other government institutions) purchases fell by 59% to 273 tonnes in 2020. The need for more liquid assets during the COVID-19 pandemic appears to have been the main catalyst for some central banks’ diminished appetite for gold. Mongolia, Sri Lanka and Tajikistan were the largest sellers of gold, while Turkey, India and the United Arab Emirates bought the most gold in 2020 (Figure 10.2).
Gold used in industrial fabrication fell by 7.4% to 302 tonnes in 2020, as COVID-19 containment measures impacted on the sale of consumer electronics. Over this period, gold used in electronics declined by 5.3% to 248 tonnes. Higher gold prices also affected demand for gold in the dental sector; usage was down 14% in 2020, as consumers substituted ceramics for gold.
Figure 10.1: World gold consumption by sector
Source: World Gold Council (2021) Gold Demand Trends; Department of Industry, Science, Energy and Resources (2021)
Figure 10.2: Official sector’s gold selling and buying*, selected countries, 2020
Note: *Gold bullions. Minus quantity indicates selling. Positive quantity indicates buying. Source: World Gold Council (2021)
0
900
1,800
2,700
3,600
4,500
5,400
2016 2018 2020 2022 2024 2026
Tonn
es
Total Fabricated Investment Official sector
-20 30 80 130 180
MongoliaSri LankaTajikistan
PhilippinesColombiaGermany
UzbekistanKyrgyz Republic
CambodiaQatar
RussiaUAEIndia
Turkey
Tonnes
98Resources and Energy Quarterly March 2021
Offsetting falling gold consumption in the jewellery, official and industrial sectors, gold-backed exchange traded funds (ETF) holdings rose by 120% in 2020 to 877 tonnes (equivalent to US$48 billion) — the largest inflows ever. The COVID-19 pandemic, low interest rate environment, and weaker equity markets in the first half of 2020 drove the flows into the ETFs.
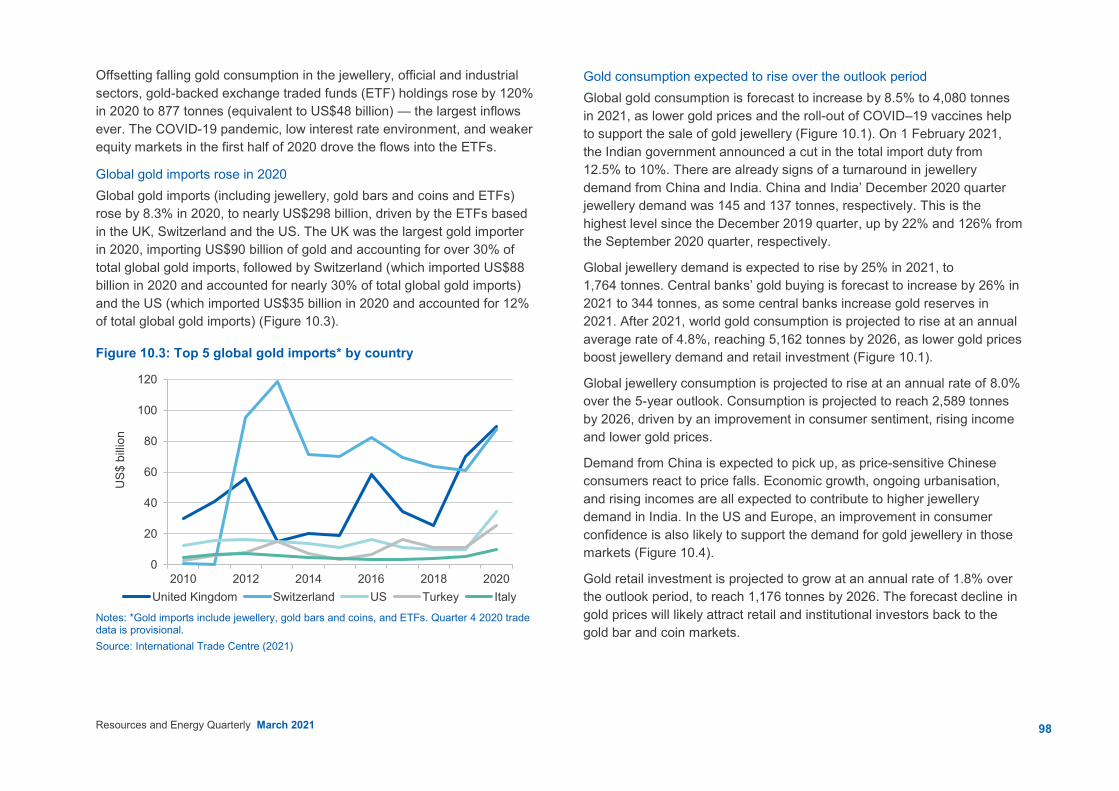
Global gold imports rose in 2020 Global gold imports (including jewellery, gold bars and coins and ETFs) rose by 8.3% in 2020, to nearly US$298 billion, driven by the ETFs based in the UK, Switzerland and the US. The UK was the largest gold importer in 2020, importing US$90 billion of gold and accounting for over 30% of total global gold imports, followed by Switzerland (which imported US$88 billion in 2020 and accounted for nearly 30% of total global gold imports) and the US (which imported US$35 billion in 2020 and accounted for 12% of total global gold imports) (Figure 10.3).
Figure 10.3: Top 5 global gold imports* by country
Notes: *Gold imports include jewellery, gold bars and coins, and ETFs. Quarter 4 2020 trade data is provisional. Source: International Trade Centre (2021)
Gold consumption expected to rise over the outlook period Global gold consumption is forecast to increase by 8.5% to 4,080 tonnes in 2021, as lower gold prices and the roll-out of COVID–19 vaccines help to support the sale of gold jewellery (Figure 10.1). On 1 February 2021, the Indian government announced a cut in the total import duty from 12.5% to 10%. There are already signs of a turnaround in jewellery demand from China and India. China and India’ December 2020 quarter jewellery demand was 145 and 137 tonnes, respectively. This is the highest level since the December 2019 quarter, up by 22% and 126% from the September 2020 quarter, respectively.
Global jewellery demand is expected to rise by 25% in 2021, to 1,764 tonnes. Central banks’ gold buying is forecast to increase by 26% in 2021 to 344 tonnes, as some central banks increase gold reserves in 2021. After 2021, world gold consumption is projected to rise at an annual average rate of 4.8%, reaching 5,162 tonnes by 2026, as lower gold prices boost jewellery demand and retail investment (Figure 10.1).
Global jewellery consumption is projected to rise at an annual rate of 8.0% over the 5-year outlook. Consumption is projected to reach 2,589 tonnes by 2026, driven by an improvement in consumer sentiment, rising income and lower gold prices.
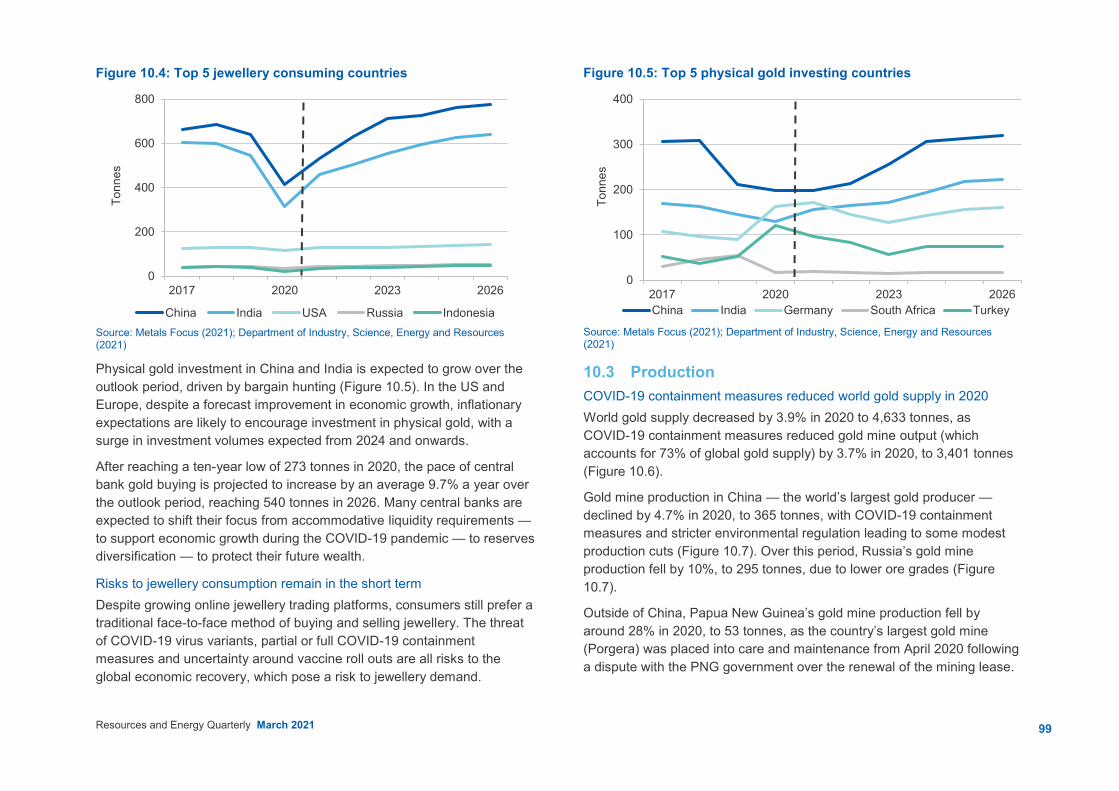
Demand from China is expected to pick up, as price-sensitive Chinese consumers react to price falls. Economic growth, ongoing urbanisation, and rising incomes are all expected to contribute to higher jewellery demand in India. In the US and Europe, an improvement in consumer confidence is also likely to support the demand for gold jewellery in those markets (Figure 10.4).
Gold retail investment is projected to grow at an annual rate of 1.8% over the outlook period, to reach 1,176 tonnes by 2026. The forecast decline in gold prices will likely attract retail and institutional investors back to the gold bar and coin markets.
0
20
40
60
80
100
120
2010 2012 2014 2016 2018 2020
US$
billi
on
United Kingdom Switzerland US Turkey Italy
99Resources and Energy Quarterly March 2021
Figure 10.4: Top 5 jewellery consuming countries
Source: Metals Focus (2021); Department of Industry, Science, Energy and Resources (2021)
Physical gold investment in China and India is expected to grow over the outlook period, driven by bargain hunting (Figure 10.5). In the US and Europe, despite a forecast improvement in economic growth, inflationary expectations are likely to encourage investment in physical gold, with a surge in investment volumes expected from 2024 and onwards.
After reaching a ten-year low of 273 tonnes in 2020, the pace of central bank gold buying is projected to increase by an average 9.7% a year over the outlook period, reaching 540 tonnes in 2026. Many central banks are expected to shift their focus from accommodative liquidity requirements — to support economic growth during the COVID-19 pandemic — to reserves diversification — to protect their future wealth.
Risks to jewellery consumption remain in the short term Despite growing online jewellery trading platforms, consumers still prefer a traditional face-to-face method of buying and selling jewellery. The threat of COVID-19 virus variants, partial or full COVID-19 containment measures and uncertainty around vaccine roll outs are all risks to the global economic recovery, which pose a risk to jewellery demand.
Figure 10.5: Top 5 physical gold investing countries
Source: Metals Focus (2021); Department of Industry, Science, Energy and Resources (2021)
10.3 Production COVID-19 containment measures reduced world gold supply in 2020 World gold supply decreased by 3.9% in 2020 to 4,633 tonnes, as COVID-19 containment measures reduced gold mine output (which accounts for 73% of global gold supply) by 3.7% in 2020, to 3,401 tonnes (Figure 10.6).
Gold mine production in China — the world’s largest gold producer — declined by 4.7% in 2020, to 365 tonnes, with COVID-19 containment measures and stricter environmental regulation leading to some modest production cuts (Figure 10.7). Over this period, Russia’s gold mine production fell by 10%, to 295 tonnes, due to lower ore grades (Figure 10.7).
Outside of China, Papua New Guinea’s gold mine production fell by around 28% in 2020, to 53 tonnes, as the country’s largest gold mine (Porgera) was placed into care and maintenance from April 2020 following a dispute with the PNG government over the renewal of the mining lease.
0
200
400
600
800
2017 2020 2023 2026
Tonn
es
China India USA Russia Indonesia
0
100
200
300
400
2017 2020 2023 2026
Tonn
es
China India Germany South Africa Turkey

100Resources and Energy Quarterly March 2021
Figure 10.6: World gold supply
Source: World Gold Council (2021) Gold Demand Trends; Department of Industry, Science, Energy and Resources (2021)
Gold mine production in Australia — the world’s second largest gold producer — was largely unaffected by COVID-19 containment measures, rising by 0.6% to 328 tonnes in 2020 (Figure 10.7).
Movement restrictions during the COVID-19 pandemic discouraged gold recycling activities. Jewellery store closures reduced the physical exchange of gold for cash. In 2020, gold scrap supply grew at a slower pace (up 1.2% to 1,297 tonnes) than in 2019 (up 12%) (Figure 10.6).
World gold supply expected to peak in 2023 World gold supply is forecast to reach a peak of 5,051 tonnes in 2023, and then decline moderately to 4,893 tonnes in 2026. In the short term, increasing total gold supply will be propelled by higher mine production.
Global mine production is forecast to increase by 5.5% (to 3,588 tonnes) in 2021, by 3.0% (to 3,696 tonnes) in 2022, and by 2.0% (to 3,769 tonnes) in 2023 (Figure 10.6). The global rollout of COVID-19 vaccines is expected to minimise disruption to gold mine production after 2022.
Figure 10.7: Top 10 global gold producing countries
Source: Metals Focus (2021); S&P Market Intelligence (2021); Department of Industry, Science, Energy and Resources (2021)
In 2021, gold mine production in Central and South America and Africa is expected to recover, following heavy losses in 2020. Production in Mexico is forecast to increase by 24% in 2021 to 128 tonnes, Peru (up 35% to 136 tonnes) and South Africa (up 24% to 124 tonnes).
A solid pipeline of projects in Australia and Canada are all likely to drive higher global gold mine output in the short term, with miners focusing on expansions and extending the life of existing mines.
Australia is expected to overtake China as the world’s largest gold producer in 2021, producing 384 tonnes (Figure 10.7), as miners respond to high gold prices (see Section 10.5 Australia’s exports and production). In China, stricter environmental regulations are likely to keep Chinese gold mine output at about 370 tonnes a year over the outlook period.
World gold mine production is projected to decline at an annual rate of 0.8% in 2025 and 2026, to 3,746 tonnes in 2026 (Figure 10.6), as ore grades decline and operational costs increase.
0
900
1,800
2,700
3,600
4,500
5,400
2016 2018 2020 2022 2024 2026
Tonn
es
Mine production Scrap
0
100
200
300
400
500
2010 2012 2014 2016 2018 2020 2022 2024 2026
Tonn
es
China Australia Russia USCanada Ghana Peru MexicoSouth Africa Brazil
101Resources and Energy Quarterly March 2021
Figure 10.8: Gold exports, selected top 5 producing countries
Notes: Quarter 4 2020 trade data is provisional. Source: International Trade Centre (2021)
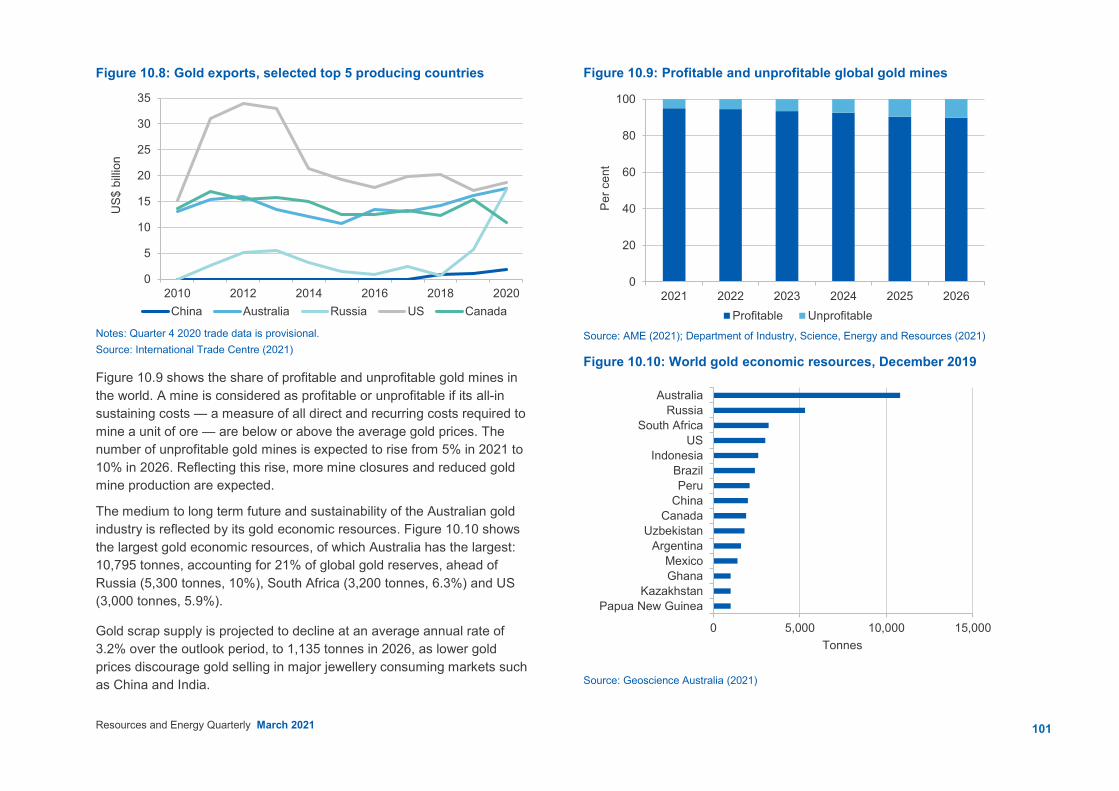
Figure 10.9 shows the share of profitable and unprofitable gold mines in the world. A mine is considered as profitable or unprofitable if its all-in sustaining costs — a measure of all direct and recurring costs required to mine a unit of ore — are below or above the average gold prices. The number of unprofitable gold mines is expected to rise from 5% in 2021 to 10% in 2026. Reflecting this rise, more mine closures and reduced gold mine production are expected.
The medium to long term future and sustainability of the Australian gold industry is reflected by its gold economic resources. Figure 10.10 shows the largest gold economic resources, of which Australia has the largest: 10,795 tonnes, accounting for 21% of global gold reserves, ahead of Russia (5,300 tonnes, 10%), South Africa (3,200 tonnes, 6.3%) and US (3,000 tonnes, 5.9%).
Gold scrap supply is projected to decline at an average annual rate of 3.2% over the outlook period, to 1,135 tonnes in 2026, as lower gold prices discourage gold selling in major jewellery consuming markets such as China and India.
Figure 10.9: Profitable and unprofitable global gold mines
Source: AME (2021); Department of Industry, Science, Energy and Resources (2021)
Figure 10.10: World gold economic resources, December 2019
Source: Geoscience Australia (2021)
0
5
10
15
20
25
30
35
2010 2012 2014 2016 2018 2020
US$
billi
on
China Australia Russia US Canada
0
20
40
60
80
100
2021 2022 2023 2024 2025 2026
Per c
ent
Profitable Unprofitable
0 5,000 10,000 15,000
Papua New GuineaKazakhstan
GhanaMexico
ArgentinaUzbekistan
CanadaChinaPeru
BrazilIndonesia
USSouth Africa
RussiaAustralia
Tonnes

102Resources and Energy Quarterly March 2021
10.4 Prices Gold prices rose strongly in 2020 The London Bullion Market Association (LBMA) gold price averaged US$1,805 an ounce in 2020, a rise of 26% from 2019 (Figure 10.11). An US dollar record of US$2,064 an ounce was reached on 6 August 2020 — and the Australian dollar gold price — reached A$2,861 an ounce on 7 August 2020.
Gold has benefited from its status as a safe haven asset during the COVID-19 pandemic. The close correlation between lower real bond yields and the US dollar gold price has persisted; low (and negative) real yields caused a rush of investor money into gold in 2020, more than offsetting the impact of weaker demand from jewellery consumers and central banks (Figure 10.12).
Gold prices to fall in the short to medium term In 2021, the rollout of COVID-19 vaccines and the global economic recovery has lifted real bond yields, and is expected to undermine some of gold’s appeal to institutional and retail investors. Funds are expected to move out of safe haven assets like gold and into riskier assets such as equities and real estate. Reflecting this, the US gold price is forecast to decrease by 5.7% (in real terms) in 2021, averaging US$1,700 an ounce, with the Australian gold price forecast to fall by 16% (in real terms) in 2021, averaging A$2,200 an ounce (Figure 10.11).
After 2021, gold prices are projected to fall by an average 6.6% a year, to US$1,208 an ounce in 2026 in real terms, due to the recovery of the global economy and a higher interest rate environment (Figure 10.11). The high interest rate environment is likely to be a major factor in curbing institutional investment demand for gold. With (real) interest rates increasing, the opportunity cost of holding gold is high, lowering its attractiveness as an investment asset. The lower US dollar gold price, in combination with a higher Australian dollar, is expected to push the Australian dollar gold price lower over the outlook period, to an average of A$1,610 an ounce (real terms) in 2026.
Figure 10.11: US and Australian dollar real gold prices
Source: LBMA (2021) Gold price PM; Department of Industry, Science, Energy and Resources (2021)
Figure 10.12: US dollar gold price and real US 10-Year Treasury yield
Source: Bloomberg (2021)
0
600
1,200
1,800
2,400
3,000
0
400
800
1,200
1,600
2,000
2016 2018 2020 2022 2024 2026
2021
pric
es A
$ an
oun
ce
2021
pric
es U
S$ a
n ou
nce
Real US dollar gold price Real Australian dollar gold price (rhs)
-1.2-0.7-0.20.30.81.31.82.32.83.33.8200
400600800
1,0001,2001,4001,6001,8002,0002,200
Mar–05 Mar–09 Mar–13 Mar–17 Mar–21
Per c
ent
US$
a tr
oy o
unce
US$ gold price Real US 10 Year Treasury bond yield (inverted, rhs)
103Resources and Energy Quarterly March 2021
There are several risks to the gold price assessment, including the effectiveness of COVID-19 vaccines now being rolled out across the world. Some new strains of the virus are much more infectious than others.
Another risk to the price assessment includes a possible correction in the global equity markets — which are at record levels and vulnerable to a rise in bond yields. A correction in equity markets may drive institutional investors back towards gold. A rise in the US dollar would put downward pressure on the US gold price. The US dollar may rally if growth in the US economy outpaces other major nations.
Geopolitical issues are expected to remain over the outlook period. Tensions in the Middle East and parts of the Indo-Pacific are not expected to be resolved within a short timeframe. There is uncertainty around the levels of world trade protection, as countries may look to support domestic manufacturing industries to aid economic recovery from the COVID-19 pandemic.
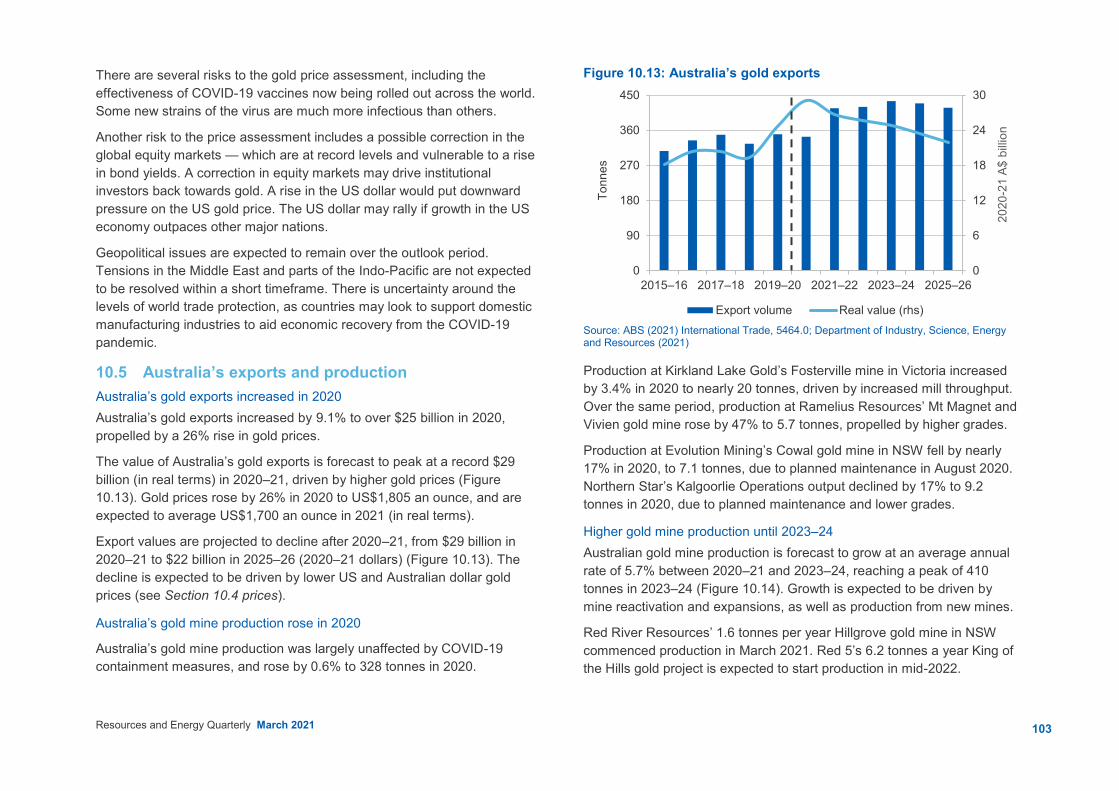
10.5 Australia’s exports and production Australia’s gold exports increased in 2020 Australia’s gold exports increased by 9.1% to over $25 billion in 2020, propelled by a 26% rise in gold prices.
The value of Australia’s gold exports is forecast to peak at a record $29 billion (in real terms) in 2020–21, driven by higher gold prices (Figure 10.13). Gold prices rose by 26% in 2020 to US$1,805 an ounce, and are expected to average US$1,700 an ounce in 2021 (in real terms).
Export values are projected to decline after 2020–21, from $29 billion in 2020–21 to $22 billion in 2025–26 (2020–21 dollars) (Figure 10.13). The decline is expected to be driven by lower US and Australian dollar gold prices (see Section 10.4 prices).
Australia’s gold mine production rose in 2020
Australia’s gold mine production was largely unaffected by COVID-19 containment measures, and rose by 0.6% to 328 tonnes in 2020.
Figure 10.13: Australia’s gold exports
Source: ABS (2021) International Trade, 5464.0; Department of Industry, Science, Energy and Resources (2021)
Production at Kirkland Lake Gold’s Fosterville mine in Victoria increased by 3.4% in 2020 to nearly 20 tonnes, driven by increased mill throughput. Over the same period, production at Ramelius Resources’ Mt Magnet and Vivien gold mine rose by 47% to 5.7 tonnes, propelled by higher grades.
Production at Evolution Mining’s Cowal gold mine in NSW fell by nearly 17% in 2020, to 7.1 tonnes, due to planned maintenance in August 2020. Northern Star’s Kalgoorlie Operations output declined by 17% to 9.2 tonnes in 2020, due to planned maintenance and lower grades.
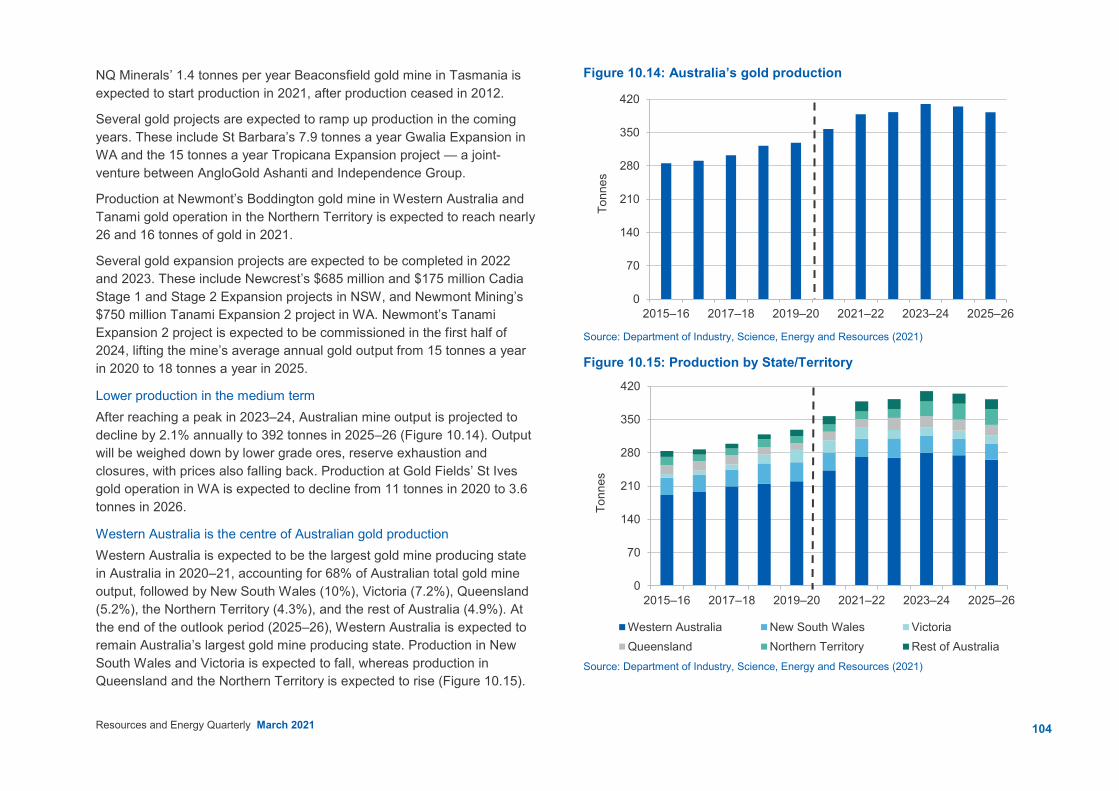
Higher gold mine production until 2023–24 Australian gold mine production is forecast to grow at an average annual rate of 5.7% between 2020–21 and 2023–24, reaching a peak of 410 tonnes in 2023–24 (Figure 10.14). Growth is expected to be driven by mine reactivation and expansions, as well as production from new mines.
Red River Resources’ 1.6 tonnes per year Hillgrove gold mine in NSW commenced production in March 2021. Red 5’s 6.2 tonnes a year King of the Hills gold project is expected to start production in mid-2022.
0
6
12
18
24
30
0
90
180
270
360
450
2015–16 2017–18 2019–20 2021–22 2023–24 2025–26
2020
-21
A$ b
illion
Tonn
es
Export volume Real value (rhs)
104Resources and Energy Quarterly March 2021
NQ Minerals’ 1.4 tonnes per year Beaconsfield gold mine in Tasmania is expected to start production in 2021, after production ceased in 2012.
Several gold projects are expected to ramp up production in the coming years. These include St Barbara’s 7.9 tonnes a year Gwalia Expansion in WA and the 15 tonnes a year Tropicana Expansion project — a joint-venture between AngloGold Ashanti and Independence Group.
Production at Newmont’s Boddington gold mine in Western Australia and Tanami gold operation in the Northern Territory is expected to reach nearly 26 and 16 tonnes of gold in 2021.
Several gold expansion projects are expected to be completed in 2022 and 2023. These include Newcrest’s $685 million and $175 million Cadia Stage 1 and Stage 2 Expansion projects in NSW, and Newmont Mining’s $750 million Tanami Expansion 2 project in WA. Newmont’s Tanami Expansion 2 project is expected to be commissioned in the first half of 2024, lifting the mine’s average annual gold output from 15 tonnes a year in 2020 to 18 tonnes a year in 2025.
Lower production in the medium term After reaching a peak in 2023–24, Australian mine output is projected to decline by 2.1% annually to 392 tonnes in 2025–26 (Figure 10.14). Output will be weighed down by lower grade ores, reserve exhaustion and closures, with prices also falling back. Production at Gold Fields’ St Ives gold operation in WA is expected to decline from 11 tonnes in 2020 to 3.6 tonnes in 2026.
Western Australia is the centre of Australian gold production Western Australia is expected to be the largest gold mine producing state in Australia in 2020–21, accounting for 68% of Australian total gold mine output, followed by New South Wales (10%), Victoria (7.2%), Queensland (5.2%), the Northern Territory (4.3%), and the rest of Australia (4.9%). At the end of the outlook period (2025–26), Western Australia is expected to remain Australia’s largest gold mine producing state. Production in New South Wales and Victoria is expected to fall, whereas production in Queensland and the Northern Territory is expected to rise (Figure 10.15).
Figure 10.14: Australia’s gold production
Source: Department of Industry, Science, Energy and Resources (2021)
Figure 10.15: Production by State/Territory
Source: Department of Industry, Science, Energy and Resources (2021)
0
70
140
210
280
350
420
2015–16 2017–18 2019–20 2021–22 2023–24 2025–26
Tonn
es0
70
140
210
280
350
420
2015–16 2017–18 2019–20 2021–22 2023–24 2025–26To
nnes
Western Australia New South Wales VictoriaQueensland Northern Territory Rest of Australia

105Resources and Energy Quarterly March 2021
Australia’s gold mine production costs expected to rise in the medium term
Figure 10.16 shows gold production all-in sustaining costs (AISC) — a measure of all direct and recurring costs required to mine a unit of ore — of selected major gold producing nations between 2021 and 2026.
Australia’s gold mine production costs are forecast to be lower than the world average costs in the short term, but are expected to be above the world average in the medium term. Australian gold miners are less competitive (have a higher AISC) than Chinese, Russian, and North American producers.
Figure 10.16: Gold mine AISC costs, by country
Source: AME (2021)
Exploration expenditure continued to rise in 2020 Australia’s gold exploration expenditure increased by nearly 16% in 2020 to nearly $1.3 billion — accounting for 47% of Australia’s total minerals exploration expenditure during the year — driven by high US dollar and Australian dollar gold prices. Western Australia remained the centre of gold exploration activity in Australia, accounting for nearly 70% (or $908 million) of total gold exploration expenditure (Figure 10.17).
Figure 10.17: Australian gold exploration expenditure
Source: ABS (2021) Mineral and Petroleum Exploration, Australia, 8412.0
Revisions to the outlook The forecast for Australian gold export volumes in 2020–21 has been revised down by 5.5%, to 344 tonnes, from the forecast in the December 2020 Resources and Energy Quarterly. The downward revision reflects the lower than expected export volumes to the United States in the December quarter 2020, down 32% quarter-on-quarter. As a result of the export volume revision, the forecast for Australian gold export values in 2020–21 has been revised down to $29 billion, down around $1.0 billion from the forecast in the December 2020 Resources and Energy Quarterly.
500
600
700
800
900
1,000
2021 2022 2023 2024 2025 2026
US$
an
ounc
e
China Australia RussiaUS Canada World
0
200
400
600
800
1,000
2010 2012 2014 2016 2018 2020
A$ m
ilion
WA Rest of Australia
106Resources and Energy Quarterly March 2021
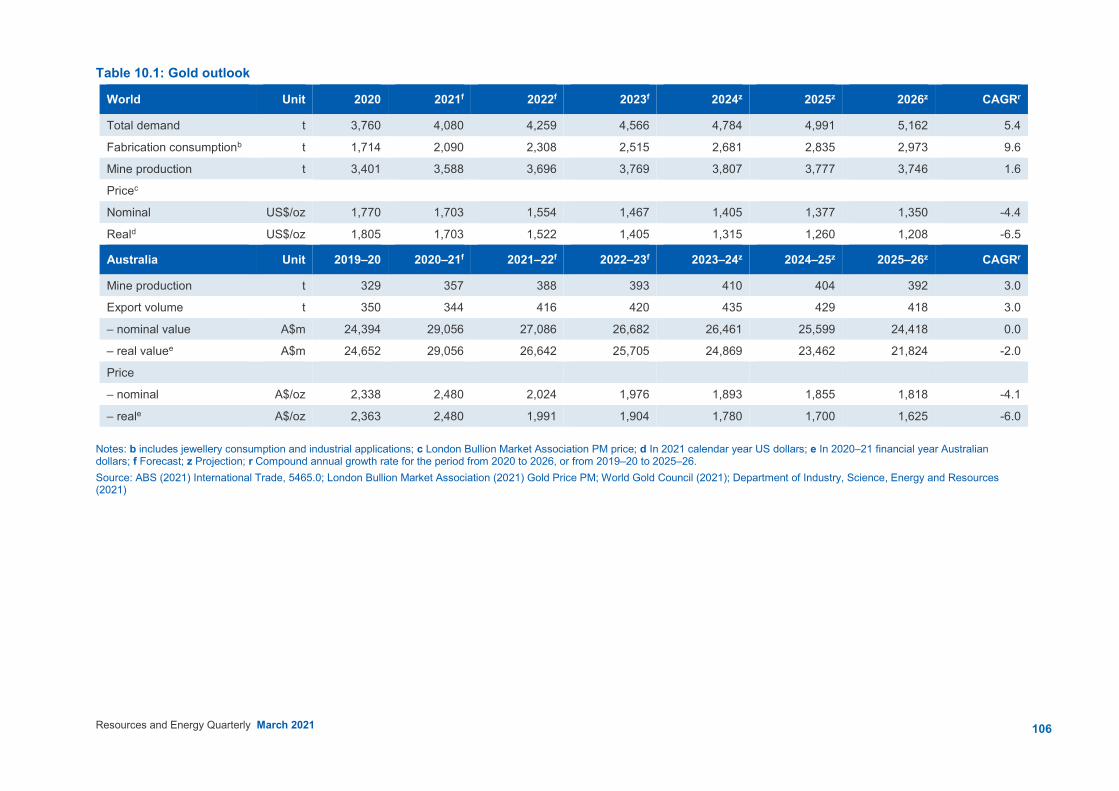
Table 10.1: Gold outlook
World Unit 2020 2021f 2022f 2023f 2024z 2025z 2026z CAGRr
Total demand
Fabrication consumptionb
Mine production
Pricec
t
t
t
3,760
1,714
3,401
4,080
2,090
3,588
4,259
2,308
3,696
4,566
2,515
3,769
4,784
2,681
3,807
4,991
2,835
3,777
5,162
2,973
3,746
5.4
9.6
1.6
Nominal
Reald
US$/oz
US$/oz
1,770
1,805
1,703
1,703
1,554
1,522
1,467
1,405
1,405
1,315
1,377
1,260
1,350
1,208
-4.4
-6.5
Australia Unit 2019–20 2020–21f 2021–22f 2022–23f 2023–24z 2024–25z 2025–26z CAGRr
Mine production
Export volume
– nominal value
t
t
A$m
329
350
24,394
357
344
29,056
388
416
27,086
393
420
26,682
410
435
26,461
404
429
25,599
392
418
24,418
3.0
3.0
0.0
– real valuee A$m 24,652 29,056 26,642 25,705 24,869 23,462 21,824 -2.0
Price
– nominal
– reale
A$/oz
A$/oz
2,338
2,363
2,480
2,480
2,024
1,991
1,976
1,904
1,893
1,780
1,855
1,700
1,818
1,625
-4.1
-6.0 Notes: b includes jewellery consumption and industrial applications; c London Bullion Market Association PM price; d In 2021 calendar year US dollars; e In 2020–21 financial year Australian dollars; f Forecast; z Projection; r Compound annual growth rate for the period from 2020 to 2026, or from 2019–20 to 2025–26. Source: ABS (2021) International Trade, 5465.0; London Bullion Market Association (2021) Gold Price PM; World Gold Council (2021); Department of Industry, Science, Energy and Resources (2021)