Embed Size (px)
Citation preview

The Westpac–Department of Industry, Innovation and Science China Resources Quarterly
Southern winter ~ Northern summer 2016
The Westpac–Department of Industry, Innovation and Science China Resources QuarterlyThe Westpac–Department of
Industry, Innovation and Science China Resources Quarterly 1

© Commonwealth of Australia 2016
Creative Commons licence
With the exception of the Coat of Arms, this publication is licensed under a Creative Commons Attribution 3.0 Australia Licence. Creative Commons Attribution 3.0 Australia Licence is a standard form license agreement that allows you to copy, distribute, transmit and adapt this publication provided that you attribute the work.
A summary of the licence terms is available from: http://creativecommons.org/licenses/by/3.0/au/deed.en
The full licence terms are available from: http://creativecommons.org/licenses/by/3.0/au/legalcode
The Commonwealth’s preference is that you attribute this publication (and any material sourced from it) using the following wording: Source: Licensed from the Commonwealth of Australia under a Creative Commons Attribution 3.0 Australia Licence.
ISSN 978-1-921516-05-4 [Print]
ISSN 978-1-921516-07-8 [PDF]
This work is copyright. Apart from any use as permitted under the Copyright Act 1968, no part may be reproduced or altered by any process without prior written permission from the Australian Government. Requests and inquiries concerning reproduction and rights should be addressed to:
Department of Industry, Innovation and ScienceGPO Box 9839, Canberra ACT 2601
or by emailing [email protected]
The Westpac–Department of Industry, Innovation and Science China Resources QuarterlyThe Westpac–Department of
Industry, Innovation and Science China Resources Quarterly 2

AcknowledgementsThis publication was jointly undertaken by the Westpac Institutional Bank, a division of the Westpac Group, and the Australian Government Department of Industry, Innovation and Science. The relationship is non–commercial. The report was previously published under the title of the Westpac–BREE China Resources Quarterly.
Editors
Westpac: Elliot Clarke and Justin Smirk
Department of Industry, Innovation and Science: Gayathiri Bragatheswaran, Nicole Thomas, Nikolai Drahos, Thuong Nguyen, Monica Philalay, Joseph Moloney, Jay Hammond, Mark Gibbons and Ross Lambie.
Design and production
Julie Doel
Cover image
Shutterstock
This report was finalised on 8 August 2016.
The Westpac–Department of Industry, Innovation and Science China Resources QuarterlyThe Westpac–Department of
Industry, Innovation and Science China Resources Quarterly 3

ContentsThe Westpac–Department of Industry, Innovation and Science China
Resources Quarterly
1. Executive summary
2. Recent developments in the Chinese economy
2.1 The real estate sector
2.2 Monetary & financial conditions
3. Steel
4. Iron ore
5. Metallurgical coal
6. Developments in China’s energy policy
6.1 Electricity trends
7. Thermal coal
8. Oil
9. Gas
10. Uranium
11. Gold
12. Silver
13. Copper
14. Aluminium
15. Alumina
16. Bauxite
17. Nickel
The Westpac–Department of Industry, Innovation and Science China Resources QuarterlyThe Westpac–Department of
Industry, Innovation and Science China Resources Quarterly 4

18. Zinc
19. Lead
20. Tin
21. Molybdenum
22. Tungsten
23. Cobalt
24. Antimony
25. Platinum & Palladium
26. Mineral Sands
27. China’s exports of rare earth oxides
28. Magnesium & Cadmium
29. Diamonds and Magnesium
30. China maps
31. Terms and conditions.
The Westpac–Department of Industry, Innovation and Science China Resources QuarterlyThe Westpac–Department of
Industry, Innovation and Science China Resources Quarterly 5
Acronyms and abbreviationsABS Australian Bureau of Statistics
ASEAN Association of Southeast Asian Nations
AUD, $A Australian dollar
bcm billion cubic metres
CEIC Chinese Economic Information Company
CFR Cost including freight
CNY, CNH Chinese yuan (onshore & off shore)
cm cubic metres
dltu dry long tonne unit
FDI foreign direct investment
FOB free on board
FX Foreign exchange
G3 United States, Europe and Japan
GDP gross domestic product
GFC global financial crisis
GFCF gross fixed capital formation
The Westpac–Department of Industry, Innovation and Science China Resources QuarterlyThe Westpac–Department of
Industry, Innovation and Science China Resources Quarterly 6

GCF gross capital formation
IEA International Energy Agency
IMF International Monetary Fund
koe, mtoe kilogram of oil equivalent, million tonnes of oil equivalent
kgpp kilograms per person
kWh kilowatt hour
LNG liquefied natural gas
Mt million tonnes
na not available
NAR net as received
NIEs Newly Industrialised Economies (Singapore, Taiwan, Hong Kong, South Korea)
ODI outward direct investment
OECD Organisation for Economic Cooperation and Development
OPEC Organisation of Petroleum Exporting Countries
PMI Purchasing Managers Index
PPP purchasing–power parity
ppt percentage point
RMB Chinese Renminbi
SHIBOR Shanghai Interbank Offered Rate
Sq km square kilometres
USD, US$ United States dollar
The Westpac–Department of Industry, Innovation and Science China Resources QuarterlyThe Westpac–Department of
Industry, Innovation and Science China Resources Quarterly 7

1. Executive summary The Chinese economy lost momentum through 2015 and in Q1 2016. However, since the previous edition of the CRQ, aggregate growth stabilised at 6.7% in Q2 2016. This respite may prove short lived as a result of substantial downside risks.
The secondary sector remains the principal source of concern, i.e. manufacturing and construction. Nominal growth did pick up in Q2, but it remains weak at just 3.5%yr. Contrast this result to the 2012–2014 average of 7.0%yr and 2009–2011’s 15.0%yr.
For manufacturing, weak external demand and domestic construction are the primary headwinds. For the former, a sustained depreciation on a trade-weighted basis over the past year has done little to boost momentum.
For construction, while we have seen a material improvement in residential property prices and consequent robust growth in new residential construction, this activity has been concentrated in the developed tier-1 cities and a few of the larger, well-located tier-2 cities.
To prove sustainable and justify a follow-up expansion of capacity by manufacturers and servicerelated firms, this momentum must broaden geographically. Yet there is little evidence of this taking place. Annual price gains in tier-2 cities are a fraction of those in tier-1, while price growth in tier-3 cities is little better than flat.
The Westpac–Department of Industry, Innovation and Science China Resources QuarterlyThe Westpac–Department of
Industry, Innovation and Science China Resources Quarterly 8

Regardless, supporting urbanisation, the public sector continues to invest heavily in key infrastructure, offsetting the absence of private spending. Worthy of note is that state-owned enterprises are currently responsible for over 80% of total investment. Utilities capex remains the focus for authorities; but growth in transport infrastructure is also robust.
Turning to services, growth has maintained a solid pace in 2016 to date, annual growth coming in at 10.6%yr in Q2 2016. However, within this sector, there remains a diverse range of circumstances. Growth in financial services has slowed abruptly, offsetting strengthening momentum in real estate services. Also, an uptrend in wholesale & retail trade is in place, but it remains modest. The outlook for aggregate activity; employment; and wages depends on this burgeoning sector of the economy.
On matters financial, the past three months have seen much calmer market conditions, both with respect to the Renminbi and Chinese equities. This is in part due to the more sanguine global backdrop; but Chinese authorities have also played their part, improving China’s competitiveness by depreciating the currency.
Following the declines of 2014–2015, commodity prices have experienced a sharp rally which has been sustained since the last CRQ. The real demand backdrop; inventory levels; and anecdotes all indicate that speculation has provided considerable support to prices during this period. If this is true, and weak end-demand persists, these gains will reverse.
Australian bulk commodity producers have taken great strides in lowering their production costs and increasing capacity, putting them in a strong position to weather adverse conditons. Those further up the cost curve are in a much more precarious position.
The Westpac–Department of Industry, Innovation and Science China Resources QuarterlyThe Westpac–Department of
Industry, Innovation and Science China Resources Quarterly 9

2. Recent developments in the Chinese economy
Many questions remain regarding China. Aggregate momentum continues to depend heavily on the services sector, with manufacturing restricted by soft global conditions and construction by an unwillingness amongst firms and developers to invest outside tier-1 cities.
Following the reported 1.2% lift in GDP in Q1, Q2’s 1.8% result means average quarterly growth through the first half of 2016 stands at 1.5%, two ticks lower than 2015’s 1.7% quarterly-average.
Annual growth in real GDP of 6.7% over the year to Q2 2016 is unchanged from Q1 and contrasts poorly with 6.8%yr at Q4 2015; 7.0%yr at Q2 2015; and 7.5%yr at Q2 2014. Taking a longer historical perspective, annual growth through the first half of 2016 is the weakest it has been since Q3 2009 and before that Q4 1999.
Nominal growth has seen an improvement over the past six months, the annual gain rising from 6.4%yr to Q4 2015 to 7.3%yr to Q2 2016.
Having surged in Q1 2016 on the back of a rebound in commodity prices, annual nominal growth in the primary sector moderated in Q2, from 13.3%yr to 6.4%yr. But offsetting this deceleration in primary sector momentum was robust growth in the services sector (10.6%yr) and a lift in the secondary sector impulse, from 1.0%yr to 3.5%yr.
The Westpac–Department of Industry, Innovation and Science China Resources QuarterlyThe Westpac–Department of
Industry, Innovation and Science China Resources Quarterly 10

In a structural sense, the consumer continues to take over as the driver of aggregate growth. Year-todate in 2016, consumption has added 4.9ppts to annual growth, twice investment’s contribution of 2.5ppts. Contrast the current experience to that of two years ago, when consumption and investment respectively contributed a roughly equal 4.0ppts and 3.6ppts to headline growth.
Nominal investment in heavy industrial and extractive industries remains weak but is being partly offset by utilities and transport as well as (concentrated) gains for housing in tier-1 cities. To see aggregate growth strengthen, there needs to be a greater willingness amongst private firms to invest and less crowding out of those firms who do want to borrow by the public sector. Note that over 80% of investment is currently being undertaken by State-owned Enterprises.
Figures 1–3
Please refer to page 2 of The Westpac-DIIS China Resources Quarterly PDF version.
It is constructive to complement the national accounts with a range of alternative indicators which also correlate with overall activity. Doing so provides a richer and more complete picture of key macroeconomic trends.
Beginning with the People’s Bank of China’s corporate survey, we see that the largest firms across the nation believe conditions remained challenging in the second quarter of 2016 – an improvement in domestic orders notwithstanding.
The survey’s ‘business situation’ measure has now been below its long–run average for ten consecutive quarters – and twelve of the past thirteen. Weakness in domestic orders has been a key factor, so the Q2 bounce gives hope that conditions are stabilising and that a sustained improvement might be in view. But risks to the outlook are clearly skewed to the downside.
Other measures of aggregate activity point to still-weak conditions in the old bellwether sectors of manufacturing and construction. Q1 gains for cement (following a sharp contraction) already seem to be fading; meanwhile, growth in electricity and steel production also remains historically weak. Sluggish investment by the private sector and the narrow focus of property investment in tier-1 cities lead us to expect continued soft demand for these materials.
As noted in our discussion of GDP, in stark contrast to weak conditions in the secondary sector, services momentum is robust.
Being job intensive, and given China’s stage of development, services growth is the key to sustained income gains for the urbanising population.
However, there is clearly room for improvement. Growth in financial services has slowed abruptly from 26.6%yr in Q2 2015 to 7.7%yr, as financial market exuberance petered out. Real estate services growth has only provided a partial offset, strengthening from 10.6%yr to 15.0%yr, having peaked at
The Westpac–Department of Industry, Innovation and Science China Resources QuarterlyThe Westpac–Department of
Industry, Innovation and Science China Resources Quarterly 11

17.6%yr in Q1. Further, the uptrend in wholesale & retail trade has been modest, only improving from 5.8%yr to 6.9%yr.
Figures 4–6
Please refer to page 3 of The Westpac-DIIS China Resources Quarterly PDF version.
2.1 The real estate sector
Real estate investment itself is split roughly 70/30 between residential and non–residential. State– Owned Enterprises represent circa 16% of the total.
In the previous edition of the CRQ, we noted that the real estate slowdown (which directly accounted for 47% of the near 5ppt deceleration in investment growth in 2015) had partly reversed, with year-to-date growth in real estate investment strengthening from 2.5% at end-2015 to 8.2% in March 2016.
It was hoped that this momentum would strengthen further in Q2, but to no avail. Having peaked at 8.4% in April, year-to-date growth has since eased back to 7.2%. Further highlighting the headwinds this sector faces, sales and starts volumes also look to have lost momentum in recent months. Annual growth looks to have peaked in early-Q2 at a pace broadly in line with 2013.
Key for housing is the geographical breadth of activity. This is best highlighted by the 70-city house price detail.
Splitting the 70 cities into three development-based tiers, tier-1 clearly continues to experience a robust pace of price growth, an average of 28.5%yr for new housing and 30.6%yr for the secondary market.
Within this tier, Shenzhen new property price growth has slowed from 62.5%yr in April to (a still very strong) 46.8%yr; Shanghai has plateaued circa 28%yr; while Beijing and Guangzhou have strengthened modestly, to around 19.5%yr. Similar trends are apparent in the established market.
Tier-2 cities saw starkly lower price growth for new and established housing, 7.1%yr and 6.2%yr respectively. The uptrend is intact but modest. This is even more the case in tier-3, where new and secondary house prices rose by just 3.1%yr and 2.1%yr.
Until such time as the growth impulse broadens, housing’s contribution to growth will remain fragile and limited in scale. Of course demand for housing in these cities depends heavily on job opportunities. Here there is considerable work to be done.
Figures 7–9
Please refer to page 4 of The Westpac-DIIS China Resources Quarterly PDF version.
The Westpac–Department of Industry, Innovation and Science China Resources QuarterlyThe Westpac–Department of
Industry, Innovation and Science China Resources Quarterly 12

2.2 Monetary & financial conditions
The monetary policy stance has had a basic tightening posture since 2011, related to the unwinding of the stimulus–era legacy periodically interrupted by a cyclical need to underpin growth and/or accommodate smooth refinancing. The annual flow of credit to GDP peaked at 40% in late 2009; hit a local trough of 25% of GDP in early 2012; rebounded to 33% of GDP in early 2013; then fell to a new low circa 21% of GDP at Q2 2016. While traditional bank loans were a major contributor to the stimulus package, much of the cyclical amplitude since has been related to shadow finance, dominated by the off–balance sheet activity of the banks themselves.
Turning to the currency, last August authorities altered the way in which the Renminbi was managed, focusing on stability against a basket of currencies rather than the USD bilateral rate.
However, what has transpired since has been a sustained depreciation, with the Renminbi around 7% lower against the USD and almost 8% on a trade-weighted basis.
Coupled with real interest rates which are marginally below average, the actions taken by authorities on the currency have improved domestic financial conditions, reducing pressure on Chinese exporters. More recently, their management of the currency has also seen the downtrend in China’s FX reserves abate, further reducing uncertainty over the near-term outlook.
However, it is also worth bearing in mind that global financial conditions have been more supportive of authorities aims of late. A renewed spate of global risk aversion and/or anxieties over growth in China could once again put pressure on FX reserves.
Taking a longer-term perspective, it should be kept in mind that there are other factors restricting China’s FX reserve accumulation, namely: a rise in foreign loans made by Chinese banks and outward FDI by Chinese corporates and citizens at a time of weaker export receipts. As development and internationalisation proceeds, bank–related activity; outward direct investment; rapid growth in portfolio flows (from a very low base); and a growing services deficit will all become increasingly important avenues for goods’ surplus recycling.
Figures 10–12
Please refer to page 5 of The Westpac-DIIS China Resources Quarterly PDF version.
The Westpac–Department of Industry, Innovation and Science China Resources QuarterlyThe Westpac–Department of
Industry, Innovation and Science China Resources Quarterly 13

Table 1: General macroeconomic data
Jun–13 Sep–13 Dec–13Mar–
14 Jun–14 Sep–14 Dec–14 Mar–15 Jun–15 Sep–15 Dec–15 Mar–16 Jun–16
Real GDP %yr 7.5 7.9 7.6 7.3 7.4 7.1 7.2 7 7 6.9 6.8 6.7 6.7
Nominal GDP %yr 9.4 10.2 10.4 8.3 8.5 8.3 7.5 6.6 7 6.2 6 7.1 7.3
Contributions to real GDP percentage points ytd
Final consumption expenditure 3.4 3.5 3.6 5.5 4.0 3.6 3.6 4.5 4.2 4.0 4.1 5.7 4.9
Gross capital formation 4.1 4.3 4.3 3.1 3.6 3.0 3.4 1.2 2.6 3.0 2.9 2.4 2.5
Net exports 0.1 –0.1 –0.1 –1.2 –0.2 0.8 0.3 1.3 0.3 –0.1 –0.1 –0.4 -0.7
Secondary industry %ytd 7.7 7.9 8.0 7.6 7.7 7.6 7.4 6.3 6.2 6.1 6.1 5.9 6.1
Tertiary industry %ytd 8.3 8.4 8.3 7.6 7.6 7.6 7.8 8.0 8.3 8.4 8.3 7.6 7.5
Current Account %GDP 4qma 2.3 1.8 1.5 1.3 1.7 2.1 2.7 3.3 3.2 3.1 3.1 2.6 1.8
GDP deflator %yr 1.7 2.4 2.9 1.0 1.2 1.3 0.2 –0.3 0.2 –0.9 –0.7 0.4 0.6
Fixed investment deflator %yr –0.1 0 0.9 1.1 0.6 0.4 –0.1 –0.9 –1.2 –2.3 –2.9 –2.7 –0.8
Land price index %yr 5.1 6.2 7 7.5 7.2 6.1 5.2 3.8 3.4 3.5 3.2 3.6 3.9
Consumer price index %yr 2.4 2.8 2.9 2.3 2.2 2.0 1.5 1.2 1.4 1.7 1.5 2.1 2.1
Non–food %yr –2.7 –1.7 –1.4 –2.0 –1.5 –1.3 –2.8 –4.6 –4.7 –5.7 –5.9 –4.8 –2.9
Central revenue 4qma %yr 10.1 10.8 10.2 10.8 10.8 9.7 8.7 7.3 7.5 8.2 8.5 9.2 7.8
Central expenditures 4qma %yr 10.8 7.5 11.2 11.3 13.4 14.1 8.5 7.6 7.1 11.1 15.9 17.4 12.8
Central operating position 4qma %GDP –1.7 –1.4 –1.8 –1.8 –2.3 –2.4 –1.8 –1.9 –2.2 –3 –3.5 –3.8 –3.4
Money supply M2 %yr 14 14.2 13.6 12.1 14.7 12.9 12.2 11.6 11.8 13.1 13.3 13.4 11.8Bank loans (stock) %yr 14.2 14.3 14.1 13.9 14 13.2 13.6 14.7 14.4 15.8 15.0 14.7 14.3Total credit supply (new, rolling annual) %GDP 32.1 31.1 29.1 27.7 28.6 25.7 25.6 23.7 22.2 23.1 22.5 25.0 23.1
The Westpac–Department of Industry, Innovation and Science China Resources QuarterlyThe Westpac–Department of Industry, Innovation and Science China Resources Quarterly
14

Jun–13 Sep–13 Dec–13 Mar–14 Jun–14 Sep–14 Dec–14 Mar–15 Jun–15 Sep–15 Dec–15 Mar–16 Jun–16
Exports %yr 4.1 3.9 7.5 –4.7 5 13 8.6 10 –2.2 –5.9 –5.3 –8.6 –4.3
to G3 –4.9 2.6 9.4 2.8 9.3 10.5 3.8 7.6 –1.0 –3.3 –4.2 –6.4 –6.3
to Asia ex Japan 15.2 7.5 6.9 –10.3 2.8 16.2 13.3 9.9 –2.6 –7.4 –4.1 –9.0 –2.0
to Australia –5.3 3 –1.5 1.1 4.8 4.1 5.3 14.4 4.2 1 2 –1.0 –9.4
to non–Asian emerging markets 0.4 –1.4 5.9 –3.3 3.9 14.6 10 16.6 –5.0 –10.0 –14.7 –16.1 –6.6
Imports %yr 5.2 8.4 7.2 3.3 1.5 1.2 –1.4 –17.9 –13.5 –14.2 –12.0 –13.4 –6.6
from G3 –0.1 4.3 8.1 11.5 7.4 4.3 2.4 –11.8 –10.2 –13.0 –11.0 –9.8 –3.3
from Asia ex Japan 8.1 7.3 1.5 –4.7 1.7 3.5 –0.4 –14.1 –11.4 –14.5 –9.2 –12.9 –7.2
from Australia 9.1 19 33.5 24.8 2.4 –1.9 –20.5 –26.5 –30.9 –20.5 –18.5 –30.8 –0.3
from non–Asian emerging markets –6.8 4.9 6.3 2.4 4.5 0.8 –4.4 –36.7 –27.6 –20.5 –23.0 –11.3 –6.4
Trade balance USDbn 65.7 61.5 90.5 16.6 85.9 128.1 149.5 123.7 139.5 163.6 174.8 125.7 143.4
Change in FX reserves USDbn 54 166 159 127 45 –106 –45 –113 –36 –180 –184 –118 –7
Enterprise survey – net balance, 50 base
Business conditions57.1 56.3 58.1 55.3 55.4 54.9 54.5 52.8 51.8 49.4 48.4 46.7 48.3
Profitability55.6 55.1 57.6 50.9 54.1 55 55 51 52.8 51.1 50.5 47.2 52.7
Domestic orders50.3 48.2 49.4 44.4 48.5 46.9 46.5 42.5 46.3 43.3 42.5 39.1 46.6
Foreign orders49.9 50.1 48.7 45.4 49.7 49.9 47.9 44.2 48.7 46.3 43.7 41 46.5
Banking climate – % of average
Demand for loans92.6 95.4 95 99.9 91.3 85.1 82.9 87.9 77.2 72.4 72.6 80.1 72.4
Ease of policy stance91.5 72.6 73.6 68.7 74.1 84.3 90.3 96.9 118.7 110.1 121 115.2 109.7
Bankers’ confidence level116 110.4 129.1 122.4 97.2 107 95 86 78.6 73.5 68.6 69 79.1
The Westpac–Department of Industry, Innovation and Science China Resources QuarterlyThe Westpac–Department of Industry, Innovation and Science China Resources Quarterly
15

Westpac MNI Consumer Sentiment* – % of average
Headline composite101.9 96.5 103.3 99.1 97.7 95 93.1 94.3 93.1 97.2 93.7 95.8 96.8
Expected family finances103.9 97.1 104.3 98.3 99.9 95.4 92.7 94.6 93.6 99.6 93.9 97.1 95.5
House price expectations99.6 103.6 102.1 105.6 104.4 105.6 104.4 106.3 105.2 107.3 103.7 105.4 103.7
Employment outlook107.9 97.3 110.2 99.6 99.7 94.7 93.3 93.8 93.1 90.7 90 88.1 93.2
Sources: Westpac Economics, CEIC, MNI.
The Westpac–Department of Industry, Innovation and Science China Resources QuarterlyThe Westpac–Department of Industry, Innovation and Science China Resources Quarterly
16

Table 2: Resource related economic indicators
Jul–15 Aug–15 Sep–15 Oct–15 Nov–15 Dec–15 Jan–16 Feb–16 Mar–16 Apr–16 May–16 Jun–16
Industrial production %yr 3mma 6.3 6.3 5.9 5.8 5.8 5.9 5.8 5.6 5.9 6.1 6.3 6.1
Electricity 2.6 2.8 1.6 1.4 1.4 1.4 n.a. n.a. 5.9 2.9 2.5 1.6
Processed crude oil 6.2 5.6 4.7 3.3 2.2 2.8 n.a. n.a. 0.5 2.1 1.6 2.8
Cement* –5.7 –5.1 –4.1 –3.6 –4.3 –4.3 n.a. n.a. 24.8 14.2 10.4 2.9
Steel products* –0.2 –0.9 –1.4 –0.9 0 –0.7 n.a. n.a. 1.7 1 1 1.2
Non–ferrous metals* 22.6 21.2 18.4 16.1 13.6 9.9 n.a. n.a. 3.8 2.8 2.1 0
Automobiles* –8.9 –10.6 –12.3 –7.0 0.1 8.8 n.a. n.a. 4.2 4.6 4.8 6.2
Civilian ships* –1.9 –0.7 –2.3 0.3 –9.8 –9.1 n.a. n.a. –14.7 –20.9 –20.2 –17.9
Metal cutting tools* 2.5 –1.7 –14.9 –16.4 n.a. n.a. n.a. n.a. n.a. n.a. n.a. n.a.
Fixed asset investment %yr 3mma 10.5 10.2 8.6 8.4 9 9 9.3 9.1 10.5 10.5 9.6 8.3
Manufacturing, of which 8.7 7.7 6.4 6.8 7.4 7.4 7.1 6.5 6.9 6.2 4.1 2.1
Heavy industry 6.2 5.4 3.4 4.9 4.9 5.7 4.4 4.1 4.4 4 2.6 –0.6
Hard infrastructure, of which 17.3 18.8 16.6 15.5 16.7 15.4 16.3 13.9 17.8 19.4 20.8 20.7
Highways 18.4 14.9 12.2 13.8 15.7 13.4 10.8 7.6 8.9 10.3 11.6 14.6
Railways 26.7 12.3 3.4 –10.2 –10.7 –13.6 –13.4 –17.4 –8.7 3.1 18.7 30.4
Utilities 15.8 15.8 14.2 12.8 14.5 17.5 18.8 18.1 19 23.4 22.9 24.5
Real estate, of which 2.9 1.7 –0.4 –2.2 –3.5 –3.1 –1.3 1.4 5.2 7.5 8.6 6.6
Dwellings 2.3 1.7 –0.1 –1.8 –2.9 –3.0 –1.9 0.3 3.8 6.8 8.8 6.9
Non–residential 4.3 1.9 –1.1 –3.0 –4.8 –3.4 –0.2 3.6 8.2 8.9 8.3 5.9
Off–market urban construction –29.8 –27.2 –37.5 –6.5 17 –6.8 –24.0 –46.5 –32.9 –30.2 –32.1 –37.0
Value of new project starts
Number of new project starts –4.5 –3.8 1.2 –0.2 3.9 5.7 19.2 27.6 40.3 38.4 31.1 21.1
Local government projects 18 17.5 23.6 23.3 27.9 24 32.1 41.8 46.8 38.6 28.4 25.8
Central government projects 10.8 10.7 8.9 9.1 9.8 9.2 9.5 9.2 11 10.6 9.3 7.9
State owned enterprise investment 2.8 0.3 3.2 –3.0 –4.0 5.3 4.4 5.1 0.1 9.9 15.1 17.7
The Westpac–Department of Industry, Innovation and Science China Resources QuarterlyThe Westpac–Department of Industry, Innovation and Science China Resources Quarterly
17

Jul–15 Aug–15 Sep–15 Oct–15 Nov–15 Dec–15 Jan–16 Feb–16 Mar–16 Apr–16 May–16 Jun–16
Volume of housing starts –16.4 –17.7 –7.6 –8.6 –10.0 –17.4 –4.7 6.9 18.1 22.1 21.1 13.8
Volume of housing sales 16.6 16.6 14.2 9.7 7.7 5.2 12.8 19.3 31.3 36.6 35.3 27.6
Value of housing sales – Nationwide 11.6 16.1 17.9 18.3 18 17.5 27.9 38.3 52.9 57 58.4 53.1
Eastern provinces 17 22.9 25.1 25.4 24.7 23.7 36.2 48.9 67.8 72.7 73.7 65
Central provinces 5.9 9 10.8 12 13.2 13.6 21.2 28.3 37.1 41 44.4 45.1
Western provinces 1.7 3.9 4.5 4.4 4.1 3.9 9.4 14.7 21.6 23.2 24.2 22.5
Volume of land sales –30.6 –32.6 –33.6 –37.1 –34.9 –26.6 –21.8 –19.6 –11.3 –2.0 2.9 3.7
70 city new house prices net % rising m–o–m 1.4 18.6 28.6 –8.6 11.4 20 20 45.7 77.1 85.7 80 64.3
Auto sales 34.3 34.3 30 27.1 34.3 14.3 17.1 8.6 58.6 58.6 51.4 48.6
Excavator sales –3.3 –4.1 –2.7 3.6 11.3 15.8 14.5 7.5 5.3 4.8 8.4 10.4
Bulldozer sales –2.9 –4.4 –2.2 4.4 13.4 18.5 17.2 8.8 5.9 5 9.3 12
Terrestrial freight –32.2 –32.3 –31.0 –31.6 –29.2 –28.4 –17.8 4 19.7 14.5 1.9 –2.2
Aquatic freight 4.7 4 4 3.9 4.4 5.3 1 –4.6 –8.6 –7.7 –5.8 –5.6
International air freight 4.1 4.1 4.6 5.3 5.9 4.7 2 0.5 0.9 2.2 2.3 2.2
Manufacturing PMI – index – of which
Output 50 49.7 49.8 49.8 49.6 49.7 49.4 49 50.2 50.1 50.1 50
New orders 52.4 51.7 52.3 52.2 51.9 52.2 51.4 50.2 52.3 52.2 52.3 52.5
New export orders 49.9 49.7 50.2 50.3 49.8 50.2 49.5 48.6 51.4 51 50.7 50.5
Order backlog 47.9 47.7 47.9 47.4 46.4 47.5 46.9 47.4 50.2 50.1 50 49.6
Raw material inventories 48.4 48.3 47.5 47.2 47.1 47.6 46.8 48 48.2 47.4 47.6 47
Finished goods inventories 47.4 47.2 46.8 47.2 46.7 46.1 44.6 46.4 46 45.5 46.8 46.5
Purchases of inputs 50.3 49.4 48.6 48.8 48.3 50.3 49 47.9 52.6 51 51.2 50.5
Imports 47.8 47.2 48.1 47.5 46.7 47.6 46.4 45.8 50.1 49.5 49.6 49.1
New orders to finished goods inventories ratio 1.05 1.05 1.07 1.07 1.07 1.09 1.11 1.05 1.12 1.12 1.08 1.09
Sources: Westpac Economics, CEIC.* Output for these sectors was not released for the months of January and February. As a consequence, we have entered na for those two months and reported the unsmoothed year–ended rate for March.
The Westpac–Department of Industry, Innovation and Science China Resources QuarterlyThe Westpac–Department of Industry, Innovation and Science China Resources Quarterly
18

3. SteelSteel prices continued to increase at the start of Q2 as a result of the Chinese government’s stimulus measures implemented at the start of the year and efforts to reduce excess capacity. The rebar price peaked on 26 April at RMB3150, the highest it has been since November 2014.
• Despite ongoing issues of domestic overcapacity, a modest recovery in prices has been supported by sustained demand from the property sector, reflected in very low inventories (down 32%yr in Q2).
• China’s steel production increased 1.3%yr in Q2 to 209 Mt—the highest level in two years. Despite higher production, China’s steel consumption fell marginally by 0.1%yr in Q2.
Figures 13–15
Please refer to page 10 of The Westpac-DIIS China Resources Quarterly PDF version.
Table 3: Steel prices (quarterly averages)
Domestic RMB/tMar-
14Jun-14 Sep-14 Dec-14 Mar-15 Jun-15 Sep-15 Dec-15 Mar-
16Jun-16
Rebar 3348 3258 3078 2940 2577 2435 2226 2055 2180 2597
Hot-rolled sheet 3399 3392 3272 3008 2636 2425 2071 1882 2188 2725
Cold-rolled sheet 4214 4096 4001 3898 3582 3160 2719 2423 2892 3271
Plate 3433 3448 3270 2962 2588 2404 2091 1916 2202 2621
Wire rod 3394 3347 3155 2952 2605 2471 2265 2083 2196 2657
Benchmarks USD/t
Rebar benchmarker 454 431 408 392 344 314 274 251 261 319
HRC benchmarker 466 454 442 410 359 325 271 245 274 350
CRC benhmarker 597 562 551 534 489 424 356 322 364 429
Source: Bloomberg.
Production in Hebei, accounting for a quarter of steel production in China, increased 7%yr in Q2. At the end of Q2, Baosteel and Wuhan Iron & Steel, two of China’s top steel producers, announced the start of ‘strategic restructuring’ talks. The possible merger could make significant inroads to consolidating the domestic steel industry.
• Despite ongoing concerns from global competitors in regard to unfair competition, China’s steel exports continued to grow 11%yr to 29 Mt in Q2.
Figures 16–20
Please refer to page 11 of The Westpac-DIIS China Resources Quarterly PDF version.

4. Iron oreIron ore prices averaged US$55 a tonne (CFR) in Q2, up 12%qtr but down 5%yr, because of higher demand from China’s steel sector.
• Price volatility remained high in Q2 and into early Q3, with iron ore trading between a peak of US$70/t on 21 April and a low of $US48/t on 2 June. Speculative activity on the Dalian Commodities exchange, which may have contributed to the volatility, has since slowed because of measures implemented by exchanges to address overheating markets, including trading restrictions and increased commission fees and margin requirements.
• Prices steadily increased in early Q3 and while prices have been somewhat volatile, in responce to weakening sentiment towards China’s property market due to an absence of any further government stimulus, they were around US60/t on August 5.
• Import demand from the domestic steel industry has grown, supported by a fall in China’s iron ore production (run of mine), which was down 5%yr in Q2.
• Iron ore production from Rio Tinto increased 8%yr in Q2, while production from Vale and BHP Billiton fell 2.8%yr and 7%yr, respectively.
• China’s imports of iron ore increased by 12%yr in Q2, due to growth in imports from Australia (up 7%yr), Brazil (up 14%yr), and the rest of the world (up 27%yr). Australia’s share of the seaborne market was 62% in Q2, compared with 19% for Brazil and 18% for the rest of the world.
• Iron ore port stocks increased 6%qtr and 28%yr to 95 Mt in Q2.
• Australia’s iron ore export volumes into China increased 8%qtr and 7%yr to 165 Mt. Export earnings increased by 26%qtr and by 14%yr to A$10.8 billion.
Figures 21–33
Please refer to pages 12–14 of The Westpac-DIIS China Resources Quarterly PDF version.
Table 4: Iron ore prices (USD/t, 62% ferrous metal content unless otherwise indicated).
Qingdao spot price, CFRMar-
14Jun-
14Sep-
14Dec-
14Mar-
15Jun-
15Sep-
15Dec-
15Mar-
16Jun-
16
Quarter average 121 103 90 74 62 58 55 47 49 55
Quarter end 117 94 78 71 51 59 56 44 54 56
Quarter high 135 120 98 84 71 66 59 57 64 70
Quarter low 104 89 78 67 51 47 45 38 40 48
Qingdao price in CNY terms, CFR
736 642 558 457 390 363 346 299 318 363
Sources: Bloomberg. CFR is cost including freight
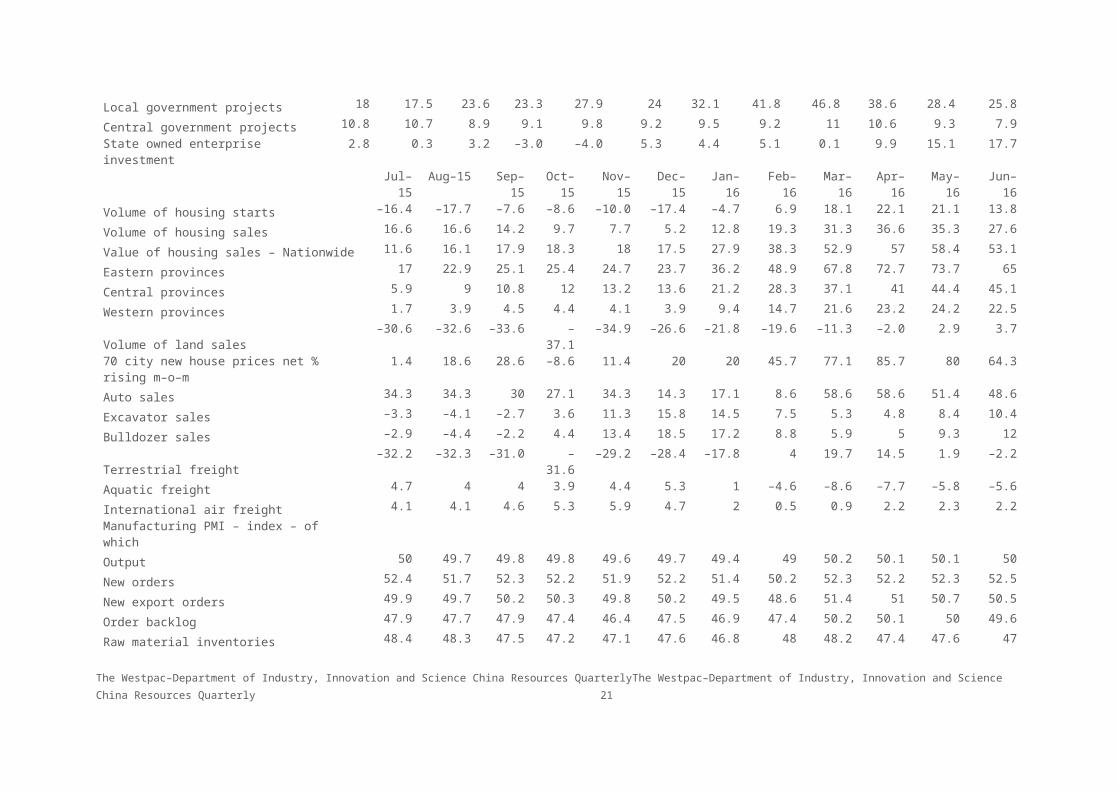
Table 5: Iron ore & metallurgical coal summary dataIron ore Sep-14 Dec-14 Mar-15 Jun-15 Sep-15 Dec-15 Mar-16 Jun-16
China iron ore imports Mt 242.1 233.6 227.1 226.0 246.3 253.9 241.6 252.3
Australia Mt 149.4 142.7 144.4 146.8 158.5 157.9 150.1 157.4
Brazil Mt 44.7 45.8 41.8 42.3 50.1 57.5 53.6 48.3
valueUSDbn
21.9 18.5 15.8 13.2 14.8 14.1 10.8 14.2
Raw production * Mt 410.6 389.3 280.6 350.2 381.6 362.6 260.0 331.2
Iron ore stocks at ports, end of qtr Mt
103.2 95.2 93.3 74.1 80.9 89.3 89.4 94.9
weeks of imports weeks 6.1 5.6 5.5 4.4 4.8 5.3 5.3 5.6
Exports to China Mt 149.7 152.2 143.7 154.6 163.9 161.9 152.4 165.4
valueAUDbn
11.9 10.9 9.8 9.5 10.5 9.1 8.6 10.8
Metallurgical coal
China met coal imports Mt 13.4 18.0 10.9 10.7 14.8 11.6 11.4 15.6
valueUSDbn
1270 1736 980 883 1163 791 742 982
Australian exports to China Mt
11.2 13.4 7.7 11.0 8.6 9.1 9.3 10.4
valueAUDmn
1143 1514 957 1160 926 892 953 1050
Sources: Bloomberg, ABS, CEIC. * Raw mine output with a low iron content.
5. Metallurgical coalAfter declining over the previous few quarters, spot prices for metallurgical coal increased over Q2, driven by increased activity in China’s construction

and steel making sectors. Australian premium hard coking coal (FOB) averaged US$91 a tonne, up 15%qtr and 1%yr.
• Australian benchmark prices for high-quality metallurgical coal delivered in Q3 2016 settled higher than expected at US$92.50 a tonne, up from around US$84 a tonne in Q2.
• China imported 15.6 Mt of metallurgical coal in Q2, up 46%yr. Australia remained the primary source of China’s metallurgical coal imports, accounting for 46%. China’s imports from Mongolia, China’s second largest source of imported metallurgical coal, increased 89%yr to 5.9 Mt.
• Australia exported 10.4 Mt of metallurgical coal to China in Q2, an increase of 12%qtr but a decline of 6%yr. Export values declined 9%yr to $A1.1 billion, however increased 10%qtr due to higher prices.
Figures 34–36
Please refer to page 16 of The Westpac-DIIS China Resources Quarterly PDF version.
Table 6: Metallurgical coal prices (quarterly average spot prices).Jun-
14Sep-
14Dec-
14Mar-
15Jun-
15Sep-
15Dec-
15Mar-
16Jun-
16Aus Premium Hard FOB East Coast
USD/t
115 114 113 108 90 84 77 79 91
Aus Premium Hard CFR East Coast to China
USD/t
125 123 122 114 96 91 83 82 95
Source: Bloomberg
Figures 37–41
Please refer to page 17 of The Westpac-DIIS China Resources Quarterly PDF version.
6. Developments in China’s energy policy The National Energy Administration (NEA) has urged China’s northeast region to cancel or postpone coal-fired power generation projects with a joint capacity of over 7.5 million kilowatts due to excess power generation. An 800 kilovolt direct current power transmission project in the northeast region will

be completed in 2017 to send the region’s power to other parts of the country.
• During Angela Merkel’s visit to Beijing in June for the fourth-round of China-Germany intergovernmental consultation, Premier Li Keqiang called for both countries to use innovation to expand common interests and energy cooperation.
• To improve Beijing’s air quality, the Beijing Municipal Environmental Protection Bureau announced in June that subsidies will be provided to gas boilers that are able to reduce emission of nitrogen by at least 50 percent from their renovations. The subsidies will cover one fourth to one third of renovation costs. To reach an emission standard of no more than 80 milligrams per cubic meter by April 2017, 10,000 gas-fired boilers in the city proper, mainly in the six urban districts, will be renovated.
• In June, through the 7th Clean Energy Ministerial global forum, President Xi Jinping outlined China’s policy intention to continue boosting and coordinating innovative green and low-carbon developments. While President Jinping was unable to attend the forum, he sent a letter which highlighted China’s plans to optimise its industrial structure, set up a low-carbon energy system, promote green buildings and low-carbon transport, and establish a national carbon emission trading market.
• In late May, the State owned, China Southern Power Grid announced that it will install 25,000 charging posts for electric vehicles by 2020. This follows a similar decision in December 2015 by northern China’s distributor State Grid Corp to install 120,000 charging posts over the next few years. The 3 billion yuan plan for 25,000 posts would require building 674, multiple-post charging stations in the provinces of Guangdong, Yunnan, Guizhou and Hainan and the Guangxi Zhuang Autonomous Region.
• During the 13th meeting of the China-Russia Energy Cooperation Committee in May, Chinese Vice-Premier Zhang Gaoli and his Russian counterpart, Arkady Dvorkovich, agreed to increase and build energy cooperation between the countries. This agreement comes on the back of development of energy trade between the countries and substantial progress on major strategic energy projects since the last meeting in November 2015.
• The National Government Offices Administration announced in May that over half the new vehicles in China’s Central State Departments will be new energy vehicles (partially or fully powered by electricity) within five years to encourage environmentally friendly means of travel.
6.1 Electricity trends
China generated 1.4 trillion kWh of electricity in Q2, a 1.7%yr increase relative to the same period in 2015. Over the same period, generation increased across all energy sources except for thermal, which declined by 1.7%yr. Hydro, nuclear and wind electricity generation increased by 11%yr, 18%yr and 26.4%yr respectively.

• Investment in new generation capacity decreased 9.5%yr in Q2 relative to the same period in 2015, to RMB 277.6 billion. Investment declined in hydro, thermal and wind electricity generation by 19%yr, 9%yr, and 34%yr respectively. Conversely, investment in nuclear generation capacity was up by 5.8%yr.
• Overall electricity consumption in China increased 3.8%yr to 1422 billion kWh in Q2 relative to the same period in 2015. Consumption across all sectors increased with primary, secondary, tertiary and residential electricity use up by 8%yr, 3%yr, 7%yr and 4%yr respectively..
Figures 42–47
Please refer to page 19 of The Westpac-DIS China Resources Quarterly PDF version
7. Thermal coalWhile key thermal coal FOB prices in Q2 are down on the previous year, Q2 prices increased relative to the previous quarter, attributable to coal mine closures and cut backs and increased import demand from China. Newcastle spot prices increased 1%qtr and Richard’s Bay increased 4.7%qtr.
• As part of the Chinese Government’s supply side structural reform agenda, China’s Premier publicly reiterated in late June that China will take action to reduce its excess coal capacity. Market reports indicate that China is well on its way in achieving its target of eliminating 500 million tonnes of coal production over the next three to five years.
Figures 48–50
Please refer to page 20 of The Westpac-DIIS China Resources Quarterly PDF version.
Table 7: Thermal coal prices
Jun-14
Sep-14
Dec-14
Mar-15
Jun-15
Sep-15
Dec-15
Mar-16
Jun-16
Newcastle 6000 kcal USD/t
73.1 68.6 63.7 65.7 59.1 58.8 53.0 50.5 51.2
Newcastle 6000 kcal AUD/t
78.2 74.0 75.1 83.8 76.1 81.3 73.5 69.9 68.6
Source: Bloomberg.
While China’s coal fired power plants under construction will proceed, China’s National Development and Reform Commission has banned approvals for all new coal-fired power projects in oversupplied regions.
• China’s imports of thermal coal increased 9%yr to 44 Mt in Q2, reflective of domestic capacity closures. Indonesia accounted for the majority of China’s total thermal coal imports in Q2, at 51%, while Australia accounted for 22%.

• Australia’s exports to China decreased by 10%yr to 9 Mt in Q2 and values declined 18%yr to $510 million.
Figures 51–55
Please refer to page 21 of The Westpac-DIIS China Resources Quarterly PDF version.
Table 8: Thermal coal summary data
Jun-
14Sep-
14Dec-
14Mar-
15Jun-
15Sep-
15Dec-
15Mar-
16Jun-
16
China imports Mt 58.1 49.7 50.4 38.1 40.1 41.7 36.2 37.0 43.9
valueUSDmn
4069.3
3346.4
3156.3
2254.7
2243.5
2095.8
1682.0
1567.6
1903.2
EOQ stocks at ports Mt
31.4 26.3 29.4 32.4 27.8 23.3 16.3 14.8 15.1
weeks of imports weeks 7.0 6.9 7.6 11.0 9.0 7.2 5.9 5.2 4.5
Exports to China Mt 12.9 11.8 11.1 10.0 10.0 8.1 6.9 6.6 9.0
valueAUDmn
870.7 742.0 708.2 664.3 622.2 493.0 391.0 360.9 509.8
Sources: ABS; CEIC; Bloomberg.
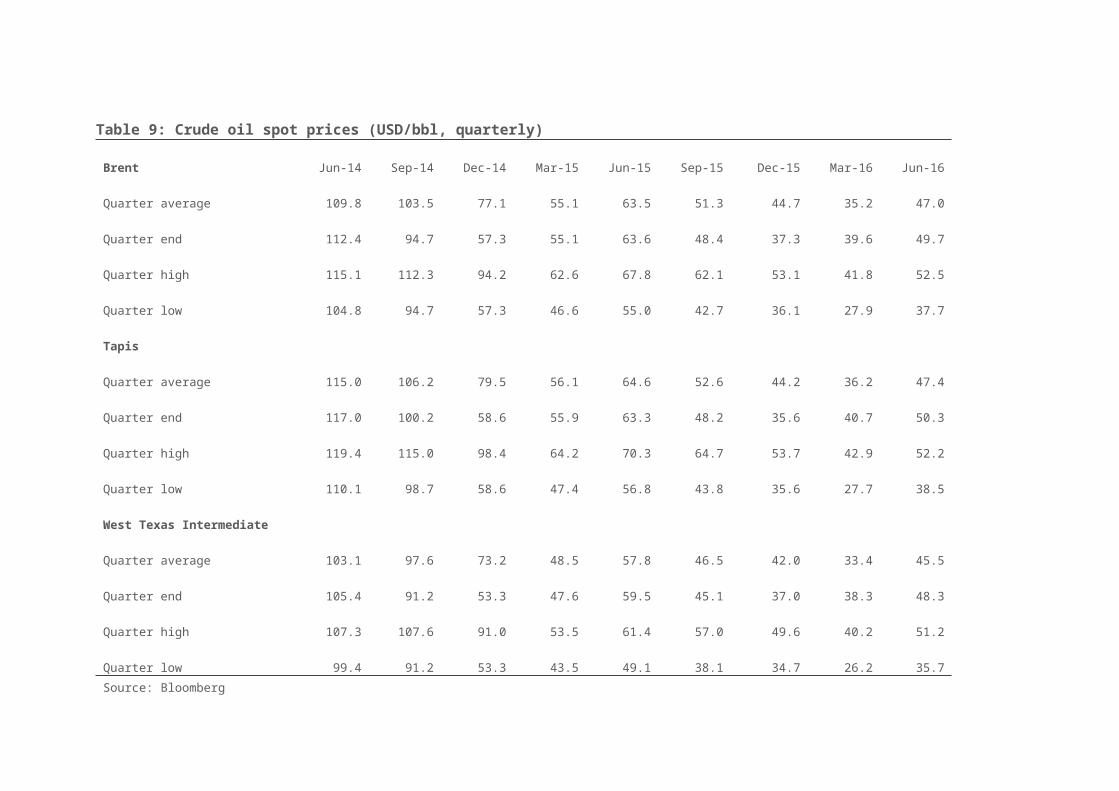
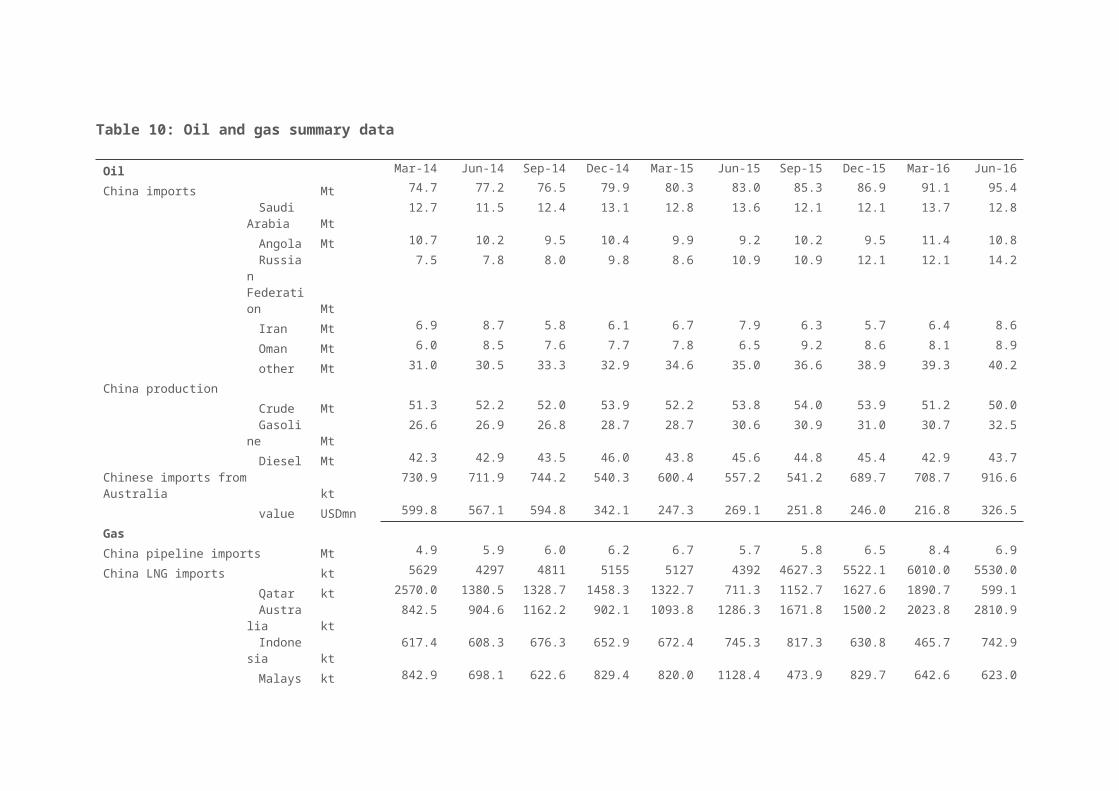
8. OilOil prices increased in Q2 as concerns about the outlook for global consumption abated slightly, and unscheduled production outages in Canada and a number of OPEC economies relieved pressure on storage capacity.
• WTI prices increased 36%qtr to average US$46/bbl. Brent prices increased 34%qtr to average US$47/bbl, and Tapis increased 31%qtr to average US$47/bbl. However, oil prices remained well down on the levels recorded a year earlier.
• China’s benchmark gasoline and diesel prices were raised several times in Q2 by the National Development and Reform Commission (NDRC). China’s benchmark gasoline prices ended Q2 7%qtr higher while diesel prices increased 8%qtr.
Figures 56–58
Please refer to page 23 of The Westpac-DIIS China Resources Quarterly PDF version.

Table 9: Crude oil spot prices (USD/bbl, quarterly)
Brent Jun-14 Sep-14 Dec-14 Mar-15 Jun-15 Sep-15 Dec-15 Mar-16 Jun-16
Quarter average 109.8 103.5 77.1 55.1 63.5 51.3 44.7 35.2 47.0
Quarter end 112.4 94.7 57.3 55.1 63.6 48.4 37.3 39.6 49.7
Quarter high 115.1 112.3 94.2 62.6 67.8 62.1 53.1 41.8 52.5
Quarter low 104.8 94.7 57.3 46.6 55.0 42.7 36.1 27.9 37.7
Tapis
Quarter average 115.0 106.2 79.5 56.1 64.6 52.6 44.2 36.2 47.4
Quarter end 117.0 100.2 58.6 55.9 63.3 48.2 35.6 40.7 50.3
Quarter high 119.4 115.0 98.4 64.2 70.3 64.7 53.7 42.9 52.2
Quarter low 110.1 98.7 58.6 47.4 56.8 43.8 35.6 27.7 38.5
West Texas Intermediate
Quarter average 103.1 97.6 73.2 48.5 57.8 46.5 42.0 33.4 45.5
Quarter end 105.4 91.2 53.3 47.6 59.5 45.1 37.0 38.3 48.3
Quarter high 107.3 107.6 91.0 53.5 61.4 57.0 49.6 40.2 51.2
Quarter low 99.4 91.2 53.3 43.5 49.1 38.1 34.7 26.2 35.7
Source: Bloomberg

China’s crude oil output declined 7%yr in Q2 to 50 Mt as China continued its shift towards consumer-led growth, and key producers shut unprofitable fields due to persistent low prices.
• China’s imports of crude oil increased 15%yr in Q2 to 95 Mt, partly because of declining domestic output.
• China’s crude oil imports from Australia increased 65%yr in Q2 to 0.9 Mt. The value of China’s imports from Australia increased 21%yr to US$326 million.
Figures 59–63
Please refer to page 24 of The Westpac-DIIS China Resources Quarterly PDF version.
9. GasChina’s LNG import and gas pipeline unit values decreased in Q2 by 10%qtr and 11%qtr, respectively.
• China’s natural gas production increased 8%yr in Q2. China is aiming to increase natural gas output by 13% in 2016, according to National Energy Administration guidelines released in April. China National Petroleum Corporation (CNPC), the country’s largest oil and gas producer, announced it plans to sell over 750 billion cubic meters of gas over the next five years, a 40% increase on the past five years.
• In April, CNPC and BP agreed to jointly develop the Neijiang-Dazu shale-gas block in the Sichuan Basin. The development of shale-gas reserves in China remains in the relatively early stages.
Figures 64–68
Please refer to page 26 of The Westpac-DIIS China Resources Quarterly PDF version.
•In Q2, the Yamal LNG project in Russia, which is scheduled to commence operations in 2017, secured more than $12 billion in loans from Chinese state-run banks. China is expected to be a major recipient of gas from the project.
• China’s LNG imports increased 26%yr in Q2 to 5.5 Mt. China imported around 0.6 Mt from both Qatar and Malaysia, a decline of 16%yr and 45%yr respectively, while imports from Indonesia remained stable at 0.7 Mt.
• China sourced 51% of its total LNG imports from Australia in Q2. Imports from Australia increased 119%yr in Q2 to 2.8 Mt. The value of these imports rose 98%yr to US$859 million..
Figures 69–73

Please refer to page 27 of The Westpac-DIIS China Resources Quarterly PDF version.
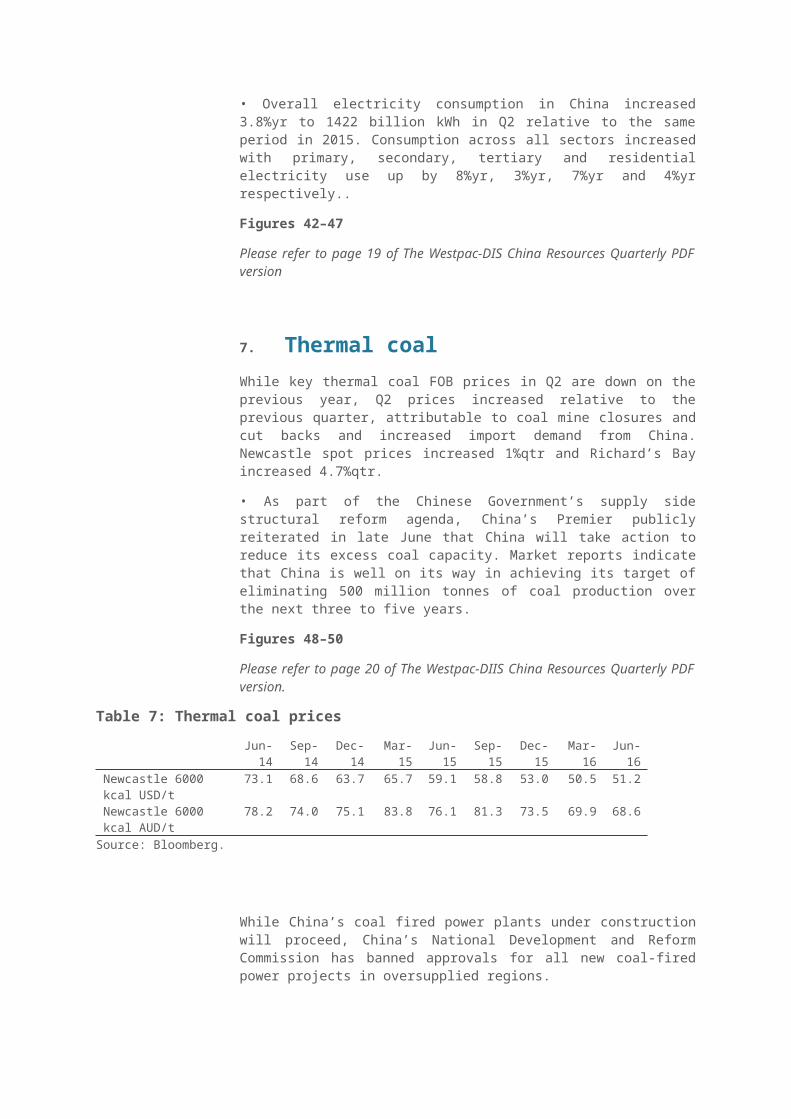
Table 10: Oil and gas summary data
Oil Mar-14 Jun-14 Sep-14 Dec-14 Mar-15 Jun-15 Sep-15 Dec-15 Mar-16 Jun-16
China imports Mt 74.7 77.2 76.5 79.9 80.3 83.0 85.3 86.9 91.1 95.4
Saudi Arabia Mt
12.7 11.5 12.4 13.1 12.8 13.6 12.1 12.1 13.7 12.8
Angola Mt 10.7 10.2 9.5 10.4 9.9 9.2 10.2 9.5 11.4 10.8
Russian Federation Mt
7.5 7.8 8.0 9.8 8.6 10.9 10.9 12.1 12.1 14.2
Iran Mt 6.9 8.7 5.8 6.1 6.7 7.9 6.3 5.7 6.4 8.6
Oman Mt 6.0 8.5 7.6 7.7 7.8 6.5 9.2 8.6 8.1 8.9
other Mt 31.0 30.5 33.3 32.9 34.6 35.0 36.6 38.9 39.3 40.2
China production
Crude Mt 51.3 52.2 52.0 53.9 52.2 53.8 54.0 53.9 51.2 50.0
Gasoline Mt 26.6 26.9 26.8 28.7 28.7 30.6 30.9 31.0 30.7 32.5
Diesel Mt 42.3 42.9 43.5 46.0 43.8 45.6 44.8 45.4 42.9 43.7
Chinese imports from Australia kt 730.9 711.9 744.2 540.3 600.4 557.2 541.2 689.7 708.7 916.6
value USDmn 599.8 567.1 594.8 342.1 247.3 269.1 251.8 246.0 216.8 326.5
Gas
China pipeline imports Mt 4.9 5.9 6.0 6.2 6.7 5.7 5.8 6.5 8.4 6.9
China LNG imports kt 5629 4297 4811 5155 5127 4392 4627.3 5522.1 6010.0 5530.0
Qatar kt 2570.0 1380.5 1328.7 1458.3 1322.7 711.3 1152.7 1627.6 1890.7 599.1
Australia kt 842.5 904.6 1162.2 902.1 1093.8 1286.3 1671.8 1500.2 2023.8 2810.9
Indonesia kt 617.4 608.3 676.3 652.9 672.4 745.3 817.3 630.8 465.7 742.9
Malaysia kt 842.9 698.1 622.6 829.4 820.0 1128.4 473.9 829.7 642.6 623.0
other kt 756.2 705.2 1021.0 1311.7 1218.4 521.1 511.7 933.8 987.3 754.1
China production Bcm 32.3 29.0 29.2 33.5 33.6 29.2 30.1 34.0 12.3 31.6
Chinese imports from Australia kt
842.5 904.6 1162.2 902.1 1093.8 1286.3 1671.8 1500.2 2023.8 2810.9

value USDmn 146.4 159.7 239.1 173.1 270.9 433.3 485.4 444.3 600.4 858.8
Source: CEIC.

10. UraniumFigures 74–77
Please refer to page 28 of The Westpac-DIIS China Resources Quarterly PDF version.
Table 11: Uranium summary data.
Jun-
14Sep-
14Dec-
14Mar-
15Jun-
15Sep-
15Dec-
15Mar-
16Jun-
16
Uranium spot priceUS$/lb U3O8 29 32 37 38 36 36 35 32 27
China nuclear power generation
billion kWh 28 38 37 35 42 50 45 na na
Investment in nuclearRMB billion 13 14 19 10 11 13 23 9 13
China uranium imports t 6801 4985 9281 2041 5659 7505 7439 na 6533
alue USDmn 675 482 810 210 587 721 691 na 640
Source: CEIC, Cameco, UxC Consulting
The average spot price for uranium fell by 16%qtr and 25%yr in Q2 to US$27/lb, as a result of high world inventories and abundant supply.
• China’s investment in new nuclear capacity rose by 18%yr to RMB 12.8 billion in Q2.
• Currently just above 3 percent of electricity in China comes from nuclear generation. At the end of Q2 one-third of all reactors under construction were located in China. China’s 13th Five Year Plan includes a target of 6–8 new reactor approvals each year.
• China has just completed construction of another reactor, bringing the total number of operational reactors to 33, with a further 21 under construction and 42 in the planning stage.
Figures 78–82
Please refer to page 29 of The Westpac-DIS China Resources Quarterly PDF version.
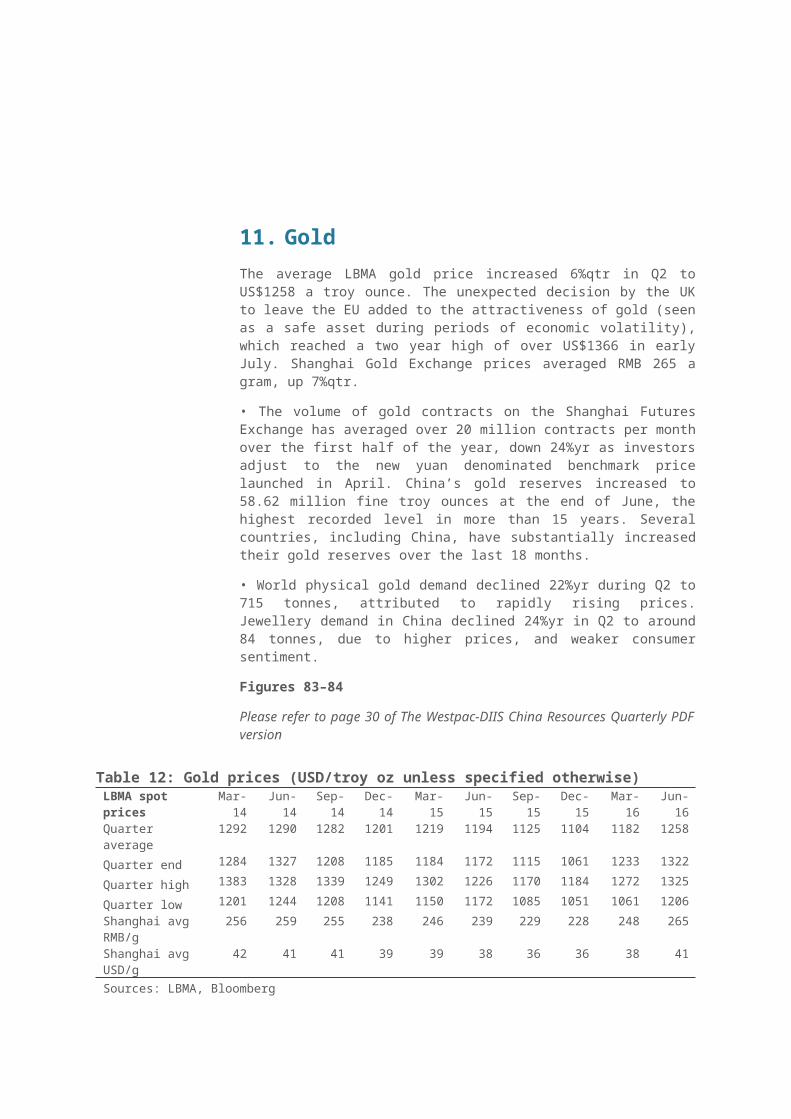
11. GoldThe average LBMA gold price increased 6%qtr in Q2 to US$1258 a troy ounce. The unexpected decision by the UK to leave the EU added to the attractiveness of gold (seen as a safe asset during periods of economic volatility), which reached a two year high of over US$1366 in early July. Shanghai Gold Exchange prices averaged RMB 265 a gram, up 7%qtr.
• The volume of gold contracts on the Shanghai Futures Exchange has averaged over 20 million contracts per month over the first half of the year, down 24%yr as investors adjust to the new yuan denominated benchmark price launched in April. China’s gold reserves increased to 58.62 million fine troy ounces at the end of June, the highest recorded level in more than 15 years. Several countries, including China, have substantially increased their gold reserves over the last 18 months.
• World physical gold demand declined 22%yr during Q2 to 715 tonnes, attributed to rapidly rising prices. Jewellery demand in China declined 24%yr in Q2 to around 84 tonnes, due to higher prices, and weaker consumer sentiment.
Figures 83–84
Please refer to page 30 of The Westpac-DIIS China Resources Quarterly PDF version
Table 12: Gold prices (USD/troy oz unless specified otherwise)
LBMA spot pricesMar-14 Jun-14 Sep-
14Dec-14 Mar-15 Jun-15 Sep-
15Dec-15 Mar-16 Jun-16
Quarter average 1292 1290 1282 1201 1219 1194 1125 1104 1182 1258
Quarter end 1284 1327 1208 1185 1184 1172 1115 1061 1233 1322
Quarter high 1383 1328 1339 1249 1302 1226 1170 1184 1272 1325
Quarter low 1201 1244 1208 1141 1150 1172 1085 1051 1061 1206
Shanghai avg RMB/g
256 259 255 238 246 239 229 228 248 265
Shanghai avg USD/g
42 41 41 39 39 38 36 36 38 41
Sources: LBMA, Bloomberg
Production in China—the world’s largest producer—fell 1.8%yr in the first five months of the year. The lower production is due to closures or curtailed production at numerous small mines over the last 12 months.
• China’s gold imports via Hong Kong were 365 tonnes in the first five months of 2016, up 1.4%yr.
• Australia exported 32 tonnes of gold to China in Q2 2016, down 13%qtr and down 19%yr. The value of gold exports was A$1.8 billion, down 9%qtr as higher prices offset some of the decline in volume.
Figures 85–89

Please refer to page 31 of The Westpac-DIIS China Resources Quarterly PDF version.
Table 13: Gold and silver summary data
Jun-14
Sep-14
Dec-14
Mar-15
Jun-15
Sep-15
Dec-15
Mar-16
Jun-16
GoldChina imports (via Hong Kong) t
204.1
168.8
389.1
229.0 178.8
241.9
343.1
168.8 na
Domestic production t114.6
140.7
100.1
110.7 118.0
110.7
110.7
111.6 na
Australian exports to China t
40.1 29.7 42.5 39.4 40.1 56.4 52.4 37.2 32.3
ueAUDmn
1773.9
1317.8
1899.0
1951.9
1974.6
2800.7
2559.7
1943.5
1763.7
Silver
China imports t90.5 83.7 76.3 117.7 217.
0331.9
230.2
219.5 97.0
Domestic production t 918 918 918 918 918 918 918 892 na
Sources: ABS, CEIC, WMS
12. SilverFigures 90–93
Please refer to page 33 of The Westpac-DIIS China Resources Quarterly PDF version.
Table 14: Silver prices (USD/oz unless specified otherwise)LBMA spot prices Mar-14 Jun-14 Sep-14 Dec-14 Mar-15 Jun-15 Sep-15 Dec-15 Mar-
16Jun-16
Quarter average 20.5 19.7 19.7 16.5 16.7 16.5 14.9 14.8 14.9 16.8
Quarter end 19.8 21.0 17.0 15.7 16.7 15.7 14.5 13.9 15.4 18.7
Quarter high 22.0 21.1 21.4 17.5 18.3 17.7 15.2 16.1 15.9 18.7
Quarter low 19.2 18.8 17.0 15.3 15.5 15.7 14.4 13.7 13.8 14.9
Shanghai avg RMB/g
4.15 4.15 4.22 3.60 3.58 3.54 3.31 3.28 3.32 3.62
Shanghai avg USD/g
0.68 0.67 0.68 0.58 0.57 0.57 0.53 0.51 0.51 0.55
Sources: LBMA, Bloomberg
13. CopperThe average LME copper price increased by 1.2%qtr in Q2 to be US$4729 a tonne— continuing to rise after declining to a six year low in Q1. The SHFE copper price increased by 0.4%qtr to RMB 36,311 a tonne.
• World copper stocks were down 8%yr in May. SHFE stocks hit a nine month low of 162kt at the end of June as higher consumption materialised in Q2.

• China’s refined copper consumption was 4.8 Mt in the first five months of 2016, up 10%yr, supported by China’s growing construction sector.
• China’s refined copper production was just over 2 Mt in Q2, up 6%yr. Despite lower prices production has increased in line with higher.
Figures 94–96
Please refer to page 34 of The Westpac-DIIS China Resources Quarterly PDF version.
Table 15: Copper prices (USD/t unless specified otherwise)LME spot prices Mar-14 Jun-14 Sep-14 Dec-14 Mar-15 Jun-15 Sep-15 Dec-15 Mar-16 Jun-16
Quarter average 7041 6787 6994 6624 5818 6043 5259 4892 4672 4729
Quarter end 6636 6955 6736 6359 6051 5721 5093 4702 4856 4827
Quarter high 7440 7035 7184 6860 6309 6448 5762 5344 5103 5045
Quarter low 6435 6600 6736 6306 5391 5646 4888 4516 4311 4504
3 Month forward
7008 6757 6976 6568 5790 6046 5261 4885 4665 4722
Shanghai avg RMB/t
49403 49328 50273 47525 42391 44074 39913 36954 36165 36311
Shanghai avg USD/t
8097 7915 8156 7729 6799 7104 6335 5779 5532 5557
Sources: LME, Bloomberg
China’s total copper imports increased 24%yr in Q2. Australia was the third largest source of China’s imports with a 5% market share. Chile accounted for 34% of China’s imports and Peru accounted for 16%. Peru has substantially increased its copper exports to China, increasing 91%yr for the first six months of 2016 as new and expanded mines ramp up production.
• Australia’s copper export volumes (metal content) to China increased 14%qtr to 125 kt in Q2 2016. While export earnings increased 14%qtr to A$813 million in Q2, they declined 12%yr.
Figures 97–101
Please refer to page 35 of The Westpac-DIIS China Resources Quarterly PDF version.

Table 16: Copper summary data Mar-14 Jun-14 Sep-14 Dec-14 Mar-15 Jun-15 Sep-15 Dec-15 Mar-16 Jun-16
China
total imports kt 1836 1699 1725 1935 1729 1774 1886 2324 2320 2192
Australia kt
165 144 140 152 116 142 123 174 134 105
Chile kt 542 538 438 629 569 558 580 717 702 736
Peru kt 182 182 196 205 172 192 267 300 346 349
other 946 834 950 949 872 883 916 1133 1138 1002
refined production kt 1651 1823 2027 2321 1834 1951 2009 2205 1987 2060
total world stocks kt 909 694 700 769 1037 934 963 911 1027 na
stocks - weeks weeks 2.2 1.5 1.6 1.7 2.5 2.1 2.3 2.0 2.4 na
Australian exports to China kt 121 128 126 138 109 122 139 158 110 125
value AUDmn 961 881 902 1045 778 921 1002 1064 711 813
Sources: Bloomberg, World Metal Statistics, ABS
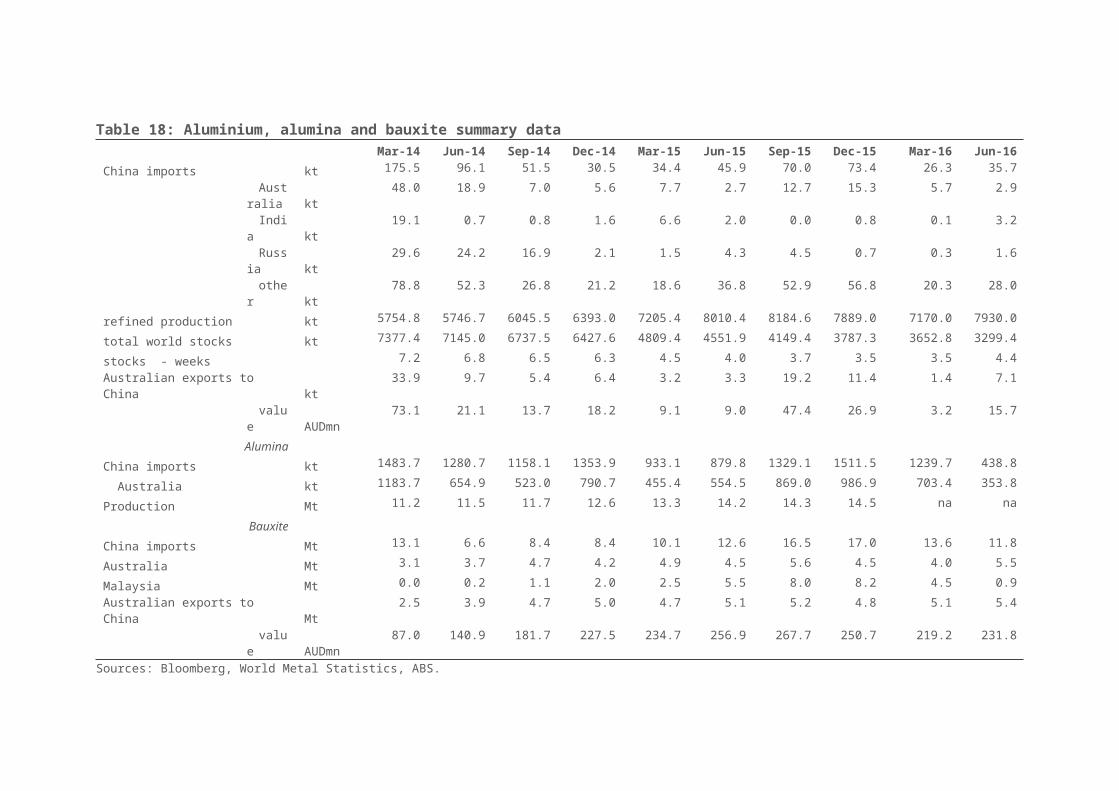
14. Aluminium In Q2, SHFE and LME aluminium spot prices averaged RMB 12,332 and US$1572 a tonne, up 12%qtr and 3.7%qtr respectively, because of production cuts in China and other large producing countries. Cuts to global production since late 2015 contributed to a 15%qtr reduction in LME stocks in Q2, reaching a multi-year low of 2370 kt at the end of June 2016.
China’s aluminium production was 7.9 Mt in Q2, up 11%qtr and down 1%yr, as Chinese smelters restarted idled capacity and lifted output in response to the recovery of aluminium prices in H1 2016.
China’s exports of unwrought aluminium and aluminium products were 1200 kt in Q2, up 11%qtr and down 7%yr as the Chinese Government aimed to turn its aluminium industry to an export powerhouse by providing subsidies on power and logistics to China’s aluminium exporters.
Despite increased domestic supply, China’s aluminium imports increased 36%qtr to 35.7 kt in Q2. Imports from Australia decreased 49%qtr, however increased 7%yr. Australia’s share of China’s total imports decreased from 22% in Q1 to 8% in Q2.
Australia’s aluminium exports to China increased 115%yr, to over 7 kt in Q2 and export earnings increased 74%yr to just over $A15 million.
Figures 102–104
Please refer to page 37 of The Westpac-DIIS China Resources Quarterly PDF version.
Table 17: Aluminium and Alumina prices (USD/t unless specified otherwise)
LME spot prices Mar-14 Jun-14 Sep-14 Dec-14 Mar-15Jun-
15 Sep-15 Dec-15 Mar-16 Jun-16
Quarter average 1708 1798 1987 1966 1800 1765 1591 1495 1516 1572
Quarter end 1731 1851 1935 1832 1789 1647 1562 1508 1492 1635
Quarter high 1768 1871 2114 2099 1872 1919 1693 1608 1622 1673
Quarter low 1642 1715 1838 1828 1742 1642 1486 1424 1453 1481
3 Month forward 1752 1836 2008 1974 1813 1787 1621 1509 1516 1582
Shanghai avg RMB/t 13168 13133 14069 13507 12849 12964 12000 10500 11024 12332
Shanghai avg USD/t 2158 2107 2282 2197 2060 2090 1904 1642 1686 1887
Aus FOB alumina 328 318 323 355 342 337 292 233 221 253
China Alumina RMB/t
2438 2353 2435 2737 2630 2442 2272 1853 1721 1923
Sources: LME, Bloomberg.
Figures 105–109
Please refer to page 38 of The Westpac-DIIS China Resources Quarterly PDF version.
15. AluminaAlumina prices averaged US$253 a tonne in Q2, up 15%qtr and down 25%yr, due to reduced supply availability in China, following the introduction of ‘supply side reform’ policies.
China’s refiners were required to curtail production under this policy, leading to a reduction in alumina production of nearly 6% in the first four months of 2016, to nearly 18 Mt. China, imported 439 kt of alumina in Q2, down 65%qtr and 50%yr, due to increased alumina prices.
Alumina imports from Australia decreased 50%qtr and 36%yr to 354 kt in Q2. Australia remained the principal source of China’s alumina imports with a market share of 81%.
Figures 110–114
Please refer to page 39 of The Westpac-DIIS China Resources Quarterly PDF version.
16. BauxiteChina, the world’s second largest bauxite producer, produced 27 Mt in the first five months of 2016.
China imported 11.8 Mt of bauxite in Q2, down 13%qtr and 6%yr. Despite this fall in imports, Australia’s share of China’s total imports increased from 29% in Q1 to 47% in Q2, at 5.5 Mt.
Malaysia’s market share of China’s bauxite imports decreased 25%qtr to 8% in Q2 as Malaysia’s Government limited supply growth to address socio-environmental concerns. The Government announced the ban on bauxite mining in Pahang, the largest producing state, is to be extended until September 2016.
Guinea’s bauxite exports to China increased 70%qtr in Q2 to 2.9 Mt. The country overtook Malaysia as the second largest bauxite exporter to China in Q2.
Indonesia’s ban on unprocessed mineral exports remains in place, despite the announcement in May 2016 by the Asahan Authority that it would take ‘a more realistic approach’ to exports of bauxite and other minerals. Should the ban be lifted, it will put further pressure on Australia’s bauxite exporters.
Australia is the principal source of China’s bauxite imports with a market share of 47%. In Q2, bauxite exports from Australia were 5.4 Mt, up 6%qtr and 6%yr. Earnings from bauxite exports decreased 10%yr to $A232 million.
Figures 115–118
Please refer to page 40 of The Westpac-DIIS China Resources Quarterly PDF version.

Table 18: Aluminium, alumina and bauxite summary data Mar-14 Jun-14 Sep-14 Dec-14 Mar-15 Jun-15 Sep-15 Dec-15 Mar-16 Jun-16
China imports kt 175.5 96.1 51.5 30.5 34.4 45.9 70.0 73.4 26.3 35.7
Australia kt
48.0 18.9 7.0 5.6 7.7 2.7 12.7 15.3 5.7 2.9
India kt 19.1 0.7 0.8 1.6 6.6 2.0 0.0 0.8 0.1 3.2
Russia kt 29.6 24.2 16.9 2.1 1.5 4.3 4.5 0.7 0.3 1.6
other kt 78.8 52.3 26.8 21.2 18.6 36.8 52.9 56.8 20.3 28.0
refined production kt 5754.8 5746.7 6045.5 6393.0 7205.4 8010.4 8184.6 7889.0 7170.0 7930.0
total world stocks kt 7377.4 7145.0 6737.5 6427.6 4809.4 4551.9 4149.4 3787.3 3652.8 3299.4
stocks - weeks 7.2 6.8 6.5 6.3 4.5 4.0 3.7 3.5 3.5 4.4
Australian exports to China kt 33.9 9.7 5.4 6.4 3.2 3.3 19.2 11.4 1.4 7.1
value AUDmn 73.1 21.1 13.7 18.2 9.1 9.0 47.4 26.9 3.2 15.7
Alumina
China imports kt 1483.7 1280.7 1158.1 1353.9 933.1 879.8 1329.1 1511.5 1239.7 438.8
Australia kt 1183.7 654.9 523.0 790.7 455.4 554.5 869.0 986.9 703.4 353.8
Production Mt 11.2 11.5 11.7 12.6 13.3 14.2 14.3 14.5 na na
Bauxite
China imports Mt 13.1 6.6 8.4 8.4 10.1 12.6 16.5 17.0 13.6 11.8
Australia Mt 3.1 3.7 4.7 4.2 4.9 4.5 5.6 4.5 4.0 5.5
Malaysia Mt 0.0 0.2 1.1 2.0 2.5 5.5 8.0 8.2 4.5 0.9
Australian exports to China Mt 2.5 3.9 4.7 5.0 4.7 5.1 5.2 4.8 5.1 5.4
value AUDmn 87.0 140.9 181.7 227.5 234.7 256.9 267.7 250.7 219.2 231.8
Sources: Bloomberg, World Metal Statistics, ABS.
17. NickelThe LME nickel price averaged US$8823 a tonne in Q2, down 32%yr but up 3.8%qtr. The price rapidly increased at the end of Q2 and start of Q3, reaching US$10,665 a tonne on 21 July, the highest it has been since mid-October 2015.
Prices have been supported by stronger demand in China as a result of government stimulus boosting the transport and infrastructure sectors, in combination with concerns about potential supply shortages.
LME stocks declined by 12%qtr and 17%yr to 379 kt in Q2, while SHFE stocks increased 35%qtr to 99 kt.
China’s port stocks of nickel ore are estimated to have increased by 6%yr to 13.8 Mt at the end of Q2.
China’s nickel production decreased by 32%yr in Q2 to 63kt.
The value of China’s nickel imports decreased by 23%yr in Q2 to US$1.5 billion. China’s nickel imports from Russia increased by 17%yr to US$766 million in Q2.
Australia’s nickel exports declined 24%yr to 55kt, while the value of Australia’s nickel exports to China fell 45%yr to $A64 million.
Figures 119–121
Please refer to page 42 of The Westpac-DIIS China Resources Quarterly PDF version.
Table 19: Nickel prices (USD/t unless specified otherwise)
LME spot pricesMar-
14 Jun-14 Sep-14 Dec-14Mar-
15 Jun-15Sep-
15Dec-
15Mar-
16 Jun-16
Quarter average 14643 18465 18576 15799 14338 13008 10561 9437 8499 8823
Quarter end 15735 18715 16505 14935 12460 11680 10070 8665 8280 9415
Quarter high 16225 21200 19795 16825 15455 14415 12060 10710 9375 9555
Quarter low 13365 15780 16505 14650 12460 11680 9305 8160 7710 8275
3 Month forward 14693 18512 18669 15877 14400 13055 10611 9481 8542 8867
Shanghai avg RMB/t
96380 128595
128862
109421
106548
98129 80765 72228 67885 69123
Shanghai avg USD/t
15786 20634 20905 17793 17089 15817 12826 11296 10383 10577
Sources: Bloomberg, World Metal Statistics, International Nickel Study Group, CEIC.
Figures 122–126
Please refer to page 43 of The Westpac-DIIS China Resources Quarterly PDF version.

Table 20: Nickel summary data Mar-14 Jun-14 Sep-14 Dec-14 Mar-15 Jun-15 Sep-15 Dec-15 Mar-16 Jun-16
China imports USDmn 1585 1625 2314 1251 904 1918 1951 1510 1201 1471
Australia USDmn 67 112 99 71 81 87 97 48 71 60
Canada USDmn 96 85 102 57 72 107 98 87 86 93
Russia USDmn 326 402 396 146 193 655 784 644 654 766
Indonesia USDmn 712 28 8 1 0 0 1 0 0 0
Philippines USDmn 171 720 1375 694 294 562 612 313 101 244
other USDmn 212 276 334 282 265 507 359 418 287 309
Refined production kt 75 90 99 102 82 93 91 77 22 63
LME stocks kt 285 305 356 413 434 456 452 441 432 379
stocks - weeks weeks 8.4 9.5 10.2 13.9 14.7 11.5 11.2 11.3 13.0 14.6
Australian ores and conc. exports kt 71 78 103 85 67 72 81 83 80 55
value AUDmn 131 162 219 182 132 117 149 137 104 64
Source: Bloomberg, World Metal Statistics, International Nickel Study Group, CEIC, ABS.

18. ZincThe LME zinc spot price averaged US$1918 a tonne in Q2, an increase of 14%qtr but a decline of 12%yr. Zinc prices increased faster than anticipated because of a rapid tightening of supply. Production cuts and mine closures contributed to a 5% decrease in LME stockpiles since the end of 2015, reaching a multi-year low of 380kt in mid-June 2016. The market tightening was also evident in the large decline in SHFE stocks in Q2, down 24%qtr to just over 206kt.
China’s refined zinc production decreased 1%yr to total 2.48 Mt in the first five months of 2016 as Chinese smelters, which account for more than 43% of global refined zinc production, were forced to cut production due to reduced availability of zinc ore and concentrates.
In the first five months of 2016, China’s total zinc imports (refined and ore) decreased 7%yr to 632 kt due to increased zinc prices. Imports from Peru and Kazakhstan fell 38% and 28%yr to 110 and 59 kt respectively. Despite these falls in imports, imports from Australia in this period increased 27%yr to 243 kt.
Australia’s zinc exports (by metal content) to China decreased 51%yr to 95 kt, with export earnings falling by 36%yr to A$200 million in Q2.
Figures 127–129
Please refer to page 45 of The Westpac-DIIS China Resources Quarterly PDF version.
Table 21: Zinc prices (USD/t unless specified otherwise)
LME spot prices Mar-14 Jun-14 Sep-14 Dec-14 Mar-15 Jun-15Sep-
15 Dec-15 Mar-16 Jun-16
Quarter average 2029 2073 2311 2235 2080 2190 1847 1613 1679 1918
Quarter end 1981 2205 2290 2167 2076 1994 1657 1600 1785 2103
Quarter high 2156 2205 2420 2335 2184 2405 2096 1835 1860 2103
Quarter low 1942 1962 2194 2114 1985 1994 1587 1462 1454 1743
3 Month forward
2027 2079 2314 2241 2092 2192 1855 1634 1683 1925
Shanghai avg RMB/t
14953 15155 16542 16655 16127 16399 14840 13347 13560 15052
Shanghai avg USD/t
2450 2432 2683 2709 2586 2643 2356 2087 2074 2303
Sources: LME, Bloomberg
Figures 130–134
Please refer to page 46 of The Westpac-DIIS China Resources Quarterly PDF version.

Table 22: Zinc summary data Mar-14 Jun-14 Sep-14 Dec-14 Mar-15 Jun-15 Sep-15 Dec-15 Mar-16 Jun-16
China imports kt 431 347 353 370 391 410 506 608 449 na
Australia kt
139 120 111 125 112 132 148 279 184 na
Kazakhstan kt
50 34 53 41 36 52 41 33 36 na
Peru kt
58 65 66 99 106 100 101 122 90 na
Turkey kt
6 5 6 3 0 4 1 5 2 na
other kt
180 123 118 103 137 123 216 170 136 na
refined production kt 1259 1406 1508 1607 1458 1613 1574 1551 na na
total world stocks kt 1511 1283 1330 1192 1108 1111 1215 1112 1144 na
stocks - weeks weeks 6.2 4.9 4.9 4.5 4.5 4.0 4.5 4.1 4.6 na
Australian exports to China kt 143 106 111 205 115 192 228 305 193 95
value AUDmn
239 178 183 352 201 312 379 524 360 200
Source: Bloomberg, World Metal Statistics, International Lead and Zinc Study Group, ABS.

19. LeadFigures 135–138
Please refer to page 48 of The Westpac-DIIS China Resources Quarterly PDF version.
Table 23: Lead prices (USD/t unless specified otherwise)
LME spot prices Mar-14 Jun-14 Sep-14 Dec-14 Mar-15 Jun-15Sep-
15 Dec-15 Mar-16 Jun-16
Quarter average 2106 2096 2181 2000 1806 1942 1714 1613 1744 1719
Quarter end 2041 2129 2083 1853 1808 1754 1656 1600 1705 1780
Quarter high 2212 2160 2269 2095 1882 2140 1857 1835 1897 1796
Quarter low 2008 2016 2051 1814 1696 1742 1625 1462 1597 1646
3 Month forward
2127 2120 2194 2009 1817 1952 1725 1634 1745 1724
Shanghai avg RMB/t
13928 13922 14208 13452 12494 13494 13336 13207 13593 13032
Shanghai avg USD/t
2282 2234 2305 2184 2004 2175 2116 2065 2079 1994
Sources: LME, Bloomberg
Table 24: Lead summary data
Mar-
14Jun-
14Sep-
14Dec-
14Mar-
15Jun-
15Sep-
15Dec-
15Mar-
16Jun-
16
China imports kt 224.0 213.8 284.8 273.0 220.4 197.0 238.3 349.5 288.6 na
kt 49.6 28.8 47.8 52.0 39.1 31.6 28.9 45.8 17.1 na
kt 17.6 2.6 18.3 26.1 18.4 27.2 30.1 39.7 42.7 na
kt 23.1 25.9 14.8 34.2 23.6 19.9 21.8 38.2 49.2 na
kt 6.1 26.6 66.9 67.8 25.5 23.5 62.2 85.0 28.6 na
kt 6.8 13.6 8.9 17.3 13.5 6.1 13.1 16.1 9.2 na
kt 120.8 116.3 128.1 75.6 100.3 88.7 94.4 124.7 141.8 na
refined production kt
1055.7
1105.2
1050.5
1064.7
995.2 1062.3
898.1 954.2 636.9 na
total world stocks kt
562 542 577.3 560.1 546.4 467.6 448.9 473.0 436.1 na
stocks - weeks weeks 2.8 2.6 3.0 2.8 2.9 2.4 2.4 2.5 2.2 na
Australian exports to China kt
45.7 63.7 54.5 59.4 34.5 33.3 33.8 48.3 5.6 0
AUDmn 86 105 97 123 72 75 77 114 3 0
Source: Bloomberg, World Metal Statistics, International Lead and Zinc Study Group, ABS.
20. TinFigures 139–144
Please refer to page 50 of The Westpac-DIIS China Resources Quarterly PDF version.

21. MolybdenumFigures 145–150
Please refer to page 51 of The Westpac-DIIS China Resources Quarterly PDF version.
22. TungstenFigures 151–156
Please refer to page 52 of The Westpac-DIIS China Resources Quarterly PDF version.
23. CobaltFigures 157–162
Please refer to page 53 of The Westpac-DIIS China Resources Quarterly PDF version.
24. AntimonyFigures 163–168
Please refer to page 54 of The Westpac-DIIS China Resources Quarterly PDF version.
25. Platinum & PalladiumFigures 169–174
Please refer to page 55 of The Westpac-DIIS China Resources Quarterly PDF version.
26. Mineral SandsFigures 175–180
Please refer to page 56 of The Westpac-DIIS China Resources Quarterly PDF version
.
27. China’s exports of rare earth oxidesFigures 181–186
Please refer to page 57 of The Westpac-DIIS China Resources Quarterly PDF version.

28. Magnesium & CadmiumFigures 187–192
Please refer to page 58 of The Westpac-DIIS China Resources Quarterly PDF version.
29. Diamonds and MagnesiumFigures 193–198
Please refer to page 59 of The Westpac-DIIS China Resources Quarterly PDF version.

Table 25: China mineral and energy import summaryChina's imports unit Sep-14 Dec-14 Mar-15 Jun-15 Sep-15 Dec-15 Mar-16 Jun-16
Iron ore Mt 242.1 233.6 227.1 226.0 246.3 253.9 241.6 252.3
Australia Mt 149.4 142.7 144.4 146.8 158.5 157.9 150.1 157.4
share % 61.7 61.1 63.6 65.0 64.4 62.2 62.2 62.4
Thermal coal Mt 49.7 50.4 38.1 40.1 41.7 36.2 37.0 43.9
Australia Mt na na na na na na na na
share % na na na na na na na naMetallurgical coal Mt 13.4 18.0 10.9 10.7 14.8 11.6 11.4 15.6
Australia Mt na na na na na na na na
share % na na na na na na na na
Aluminium kt 51.5 30.5 34.4 45.9 70.0 73.4 26.3 35.7
Australia kt 7.0 5.6 7.7 2.7 12.7 15.3 5.7 2.9
share % 14 18 22 6 18 21 22 8
Alumina kt 1158 1354 933 880 1329 1512 1240 439
Australia kt 523 791 455 555 869 987 703 354
share % 45 58 49 63 65 65 57 81
Bauxite Mt 8.4 8.4 10.1 12.6 16.5 17.0 13.6 11.8
Australia Mt 4.7 4.2 4.9 4.5 5.6 4.5 4.0 5.5
Share % 55 50 49 36 34 26 29 47
Copper kt 1725 1935 1729 1774 1886 2324 2320 2192
Australia kt 140 152 116 142 123 174 134 105
share % 8 8 7 8 7 7 6 5
Oil Mt 76.5 79.9 80.3 83.0 85.3 86.9 91.1 95.4
Australia Mt 0.7 0.5 0.6 0.6 0.5 0.7 0.7 0.9
share % 1.0 0.7 0.7 0.7 0.6 0.8 0.8 1.0
Gas (LNG) kt 4811 5155 5127 4392 4627 5522 6010 5530
Australia kt 1162 902 1094 1286 1672 1500 2024 2811
share % 24 18 21 29 36 27 34 51
Zinc kt 353.0 370.3 391.0 410.3 506.1 607.9 448.9 na
Australia kt 111.4 125.1 112.1 131.7 147.5 278.7 184.1 na
share % 32 34 29 32 29 46 41 na
NickelUS$mn 2314 1251 904 1918 1951 1510 1201 1471
AustraliaUS$mn 99 71 81 87 97 48 71 60
share % 4 6 9 5 5 3 6 4
Lead kt 284.8 273.0 220.4 197.0 238.3 349.5 288.6 na
Australia kt 47.8 52.0 39.1 31.6 28.9 45.8 17.1 na
share % 17 19 18 16 12 13 6 na
Tin kt 24.5 27.4 17.1 31.2 32.4 31.9 26.2 19.9
Australia kt 0.0 0.0 0.0 0.0 0.0 0.0 0.0 0.0
share % 0 0 0 0 0 0 0 0
Uranium t 4985 9281 2041 5659 7505 7439 na 6533Sources: CEIC, Bloomberg.

30. China maps(Figures 199–210)
Please refer to pages 62–67 of The Westpac-DIIS China Resources Quarterly PDF version.
© Copyright 2016 Westpac Bank Corporation
31. Terms and conditions.1. WIBIQ is a service provided by Westpac Institutional Bank (Westpac Banking Corporation ABN 33 007 457 141 AFSL and ACL 233714) here referred to as “Westpac”. 2. Your access to this service is subject to these terms and conditions, the Westpac Privacy Statement, notices, disclaimers and any other statements contained on this website. 3. You agree that any view or opinions expressed in the articles or podcasts contained in WIB IQ are the author’s own and may not necessarily reflect the view or opinions of Westpac. 4. You agree that any commentary contained in WIBIQ is not intended as personal advice and should not be relied upon as such by you. 5. WIB IQ may contain information in relation to certain financial products. Westpac makes no recommendation to buy, hold or sell these financial products, nor does it make any representations or warranties regarding the financial products. You should make your own decision in relation to the financial products based on your own enquiries, the information contained in the relevant disclosure documents, and the suitability of the relevant financial products to your own investment objectives, financial situation and particular needs.
Westpac disclaimerThings you should know: Each time someone visits our site, data is captured so that we can accurately evaluate the quality of our content and make improvements for you. We may at times use technology to capture data about you to help us to better understand you and your needs, including potentially for the purposes of assessing your individual reading habits and interests to allow us to provide suggestions regarding other reading material which may be suitable for you.
If you are located in Australia, this material and access to this website is provided to you solely for your own as a client of Westpac Institutional Bank being a division of Westpac Banking Corporation ABN 33 007 457 141 AFSL 233714 (‘Westpac’). If you are located outside of Australia, this material and access to this website is provided to you as outlined below.
This material and this website contain general commentary only and does not constitute personal advice. Certain types oftransactions, including those involving futures, options and high yield securities give rise to substantial risk and are not suitable for all investors. We recommend that you seek your own independent legal or financial advice before proceeding with any investment decision. This information has been prepared without taking account of your objectives, financial situation or needs. This material and this website may contain material provided by third parties. While such material is published with the necessary permission none of Westpac or its related entities accepts any responsibility for the accuracy or completeness of any such material. Although we have made every effort to ensure the information is free from error, none of Westpac or its related entities warrants the accuracy, adequacy or completeness of the information, or otherwise endorses it in any way. Except where contrary to law, Westpac and its related entities intend by this notice to exclude liability for the information. The information is subject to change without notice and none of Westpac or its related entities is under any obligation to update the information or correct any inaccuracy which may become apparent at a later date. The information contained in this material and this website does not constitute an offer, a solicitation of an offer, or an inducement to subscribe for, purchase or sell any financial instrument or to enter a legally binding contract. Past performance is not a reliable indicator of future performance. The forecasts given in this material and this website are predictive in character. Whilst every effort has been taken to ensure that the assumptions on which the forecasts are based are reasonable, the forecasts may be affected by incorrect
assumptions or by known or unknown risks and uncertainties. The ultimate outcomes may differ substantially from these forecasts.
Additional information if you are located outside of AustraliaNew Zealand: The current disclosure statement for the New Zealand division of Westpac Banking Corporation ABN 33 007 457 141 or Westpac New Zealand Limited can be obtained at the internet address www.westpac.co.nz. Westpac Institutional Bank products and services are provided by either Westpac Banking Corporation ABN 33 007 457 141 incorporated in Australia (New Zealand division) or Westpac New Zealand Limited. For further information please refer to the Product Disclosure Statement (available from your Relationship Manager) for any product for which a Product Disclosure Statement is required, or applicable customer agreement. Download the Westpac NZ QFE Group Financial Advisers Act 2008 Disclosure Statement at www.westpac.co.nz.
China, Hong Kong, Singapore and India: This material has been prepared and issued for distribution in Singapore toinstitutional investors, accredited investors and expert investors (as defined in the applicable Singapore laws and regulations) only. Recipients in Singapore of this material should contact Westpac Singapore Branch in respect of any matters arising from, or in connection with, this material. Westpac Singapore Branch holds a wholesale banking licence and is subject to supervision by the Monetary Authority of Singapore. Westpac Hong Kong Branch holds a banking license and is subject to supervision by the Hong Kong Monetary Authority. Westpac Hong Kong branch also holds a license issued by the Hong Kong Securities and Futures Commission (SFC) for Type 1 and Type 4 regulated activities. This material is intended only to “professional investors” as defined in the Securities and Futures Ordinance and any rules made under that Ordinance. Westpac Shanghai and Beijing Branches hold banking licenses and are subject to supervision by the China Banking Regulatory Commission (CBRC). Westpac Mumbai Branch holds a banking license from Reserve Bank of India (RBI) and subject to regulation and supervision by the RBI.
UK: The contents of this communication, which have been prepared by and are the sole responsibility of Westpac bankingCorporation London (“WBC”) and Westpac Europe Limited. WBC (a) has its principal place of business in the United Kingdom atCamomile Court, 23 Camomile Street, London EC3A 7LL, and is registered at Cardiff in the UK (as Branch No. BR00106), and (b) authorised and regulated by the Australian Prudential Regulation Authority in Australia. WBC is authorised in the United Kingdom by the Prudential Regulation Authority. WBC is subject to regulation by the Financial Conduct Authority and limited regulation by the Prudential Regulation Authority. Details about the extent of our regulation by the Prudential Regulation Authority are available from us on request. Westpac Europe Limited is a company registered in England (number 05660023) and is authorised by the Prudential Regulation Authority and regulated by the Financial Conduct Authority and the Prudential Regulation Authority.
This communication is being made only to and is directed at (a) persons who have professional experience in matters relatingto investments who fall within Article 19(5) of the Financial Services and Markets Act 2000 (Financial Promotion) Order 2005 (the “Order”) or (b) high net worth entities, and other persons to whom it may otherwise lawfully be communicated, falling within Article 49(2)(a) to (d) of the Order (all such persons together being referred to as “relevant persons”). Any person who is not a relevant person should not act or rely on this communication or any of its contents. The investments to which this communication relates are only available to and any invitation, offer or agreement to subscribe, purchase or otherwise acquire such investments will be engaged in only with, relevant persons. Any person who is not a relevant person should not act or rely upon this communication or any of its contents. In the same way, the information contained in this communication is intended for “eligible counterparties” and “professional clients” as defined by the rules of the Financial Conduct Authority and is not intended for “retail clients”. With this in mind, Westpac expressly prohibits you from passing on the information in this communication to any third party. In particular this communication and, in each case, any copies thereof may not be taken, transmitted or distributed, directly or indirectly into any restricted jurisdiction.

U.S.: Westpac operates in the United States of America as a federally licensed branch, regulated by the Office of the Comptroller of the Currency. Westpac is also registered with the US Commodity Futures Trading Commission (“CFTC”) as a Swap Dealer, but is neither registered as, or affiliated with, a Futures Commission Merchant registered with the US CFTC. Westpac Capital Markets, LLC (‘WCM’), a wholly–owned subsidiary of Westpac, is a broker–dealer registered under the U.S. Securities Exchange Act of 1934 (‘the Exchange Act’) and member of the Financial Industry Regulatory Authority (‘FINRA’). This communication is provided for distribution to U.S. institutional investors in reliance on the exemption from registration provided by Rule 15a–6 under the Exchange Act and is not subject to all of the independence and disclosure standards applicable to debt research reports prepared for retail investors in the United States. WCM is the U.S. distributor of this communication and accepts responsibility for the contents of this communication. All disclaimers set out with respect to Westpac apply equally to WCM. If you would like to speak to someone regarding any security mentioned herein, please contact WCM on +1 212 389 1269. All disclaimers set out with respect to Westpac apply equally to WCM.
Investing in any non–U.S. securities or related financial instruments mentioned in this communication may present certain risks.The securities of non–U.S. issuers may not be registered with, or be subject to the regulations of, the SEC in the United States.Information on such non–U.S. securities or related financial instruments may be limited. Non–U.S. companies may not subject to audit and reporting standards and regulatory requirements comparable to those in effect in the United States. The value of any investment or income from any securities or related derivative instruments denominated in a currency other than U.S. dollars is subject to exchange rate fluctuations that may have a positive or adverse effect on the value of or income from such securities or related derivative instruments.
The author of this communication is employed by Westpac and is not registered or qualified as a research analyst, representative, or associated person under the rules of FINRA, any other U.S. self–regulatory organisation, or the laws, rules or regulations of any State. Unless otherwise specifically stated, the views expressed herein are solely those of the author and may differ from the information, views or analysis expressed by Westpac and/or its affiliates.
For the purposes of Regulation AC only: Each analyst whose name appears in this report certifies that (1) the views expressed in this report accurately reflect the personal views of the analyst about any and all of the subject companies and their securities and (2) no part of the compensation of the analyst was, is, or will be, directly or indirectly related to the specific views or recommendations in this report.
For XYLO Foreign Exchange clients: This information is provided to you solely for your own use and is not to be distributedto any third parties. XYLO Foreign Exchange is a division of Westpac Banking Corporation ABN 33 007 457 141 and ACL 233714. Information is current as at date shown on the publication. This information has been prepared without taking account of yourobjectives, financial situation or needs. Because of this you should, before acting on this information, consider its appropriateness, having regard to your objectives, financial situation or needs. XYLO Foreign Exchange’s combined Financial Services Guide and Product Disclosure Statement can be obtained by calling XYLO Foreign Exchange on 1300 995 639, or by emailing [email protected].
The information may contain material provided directly by third parties, and while such material is published with permission,Westpac accepts no responsibility for the accuracy or completeness of any such material. Except where contrary to law, Westpac intends by this notice to exclude liability for the information. The information is subject to change without notice and Westpac is under no obligation to update the information or correct any inaccuracy which may become apparent at a later date. Past performance is not a reliable indicator of future performance. The forecasts given in this document are predictive in character. Whilst every effort has been taken to ensure that the assumptions on which the forecasts are based are reasonable, the forecasts may be affected by incorrect assumptions or by known or unknown risks and uncertainties. The ultimate outcomes may differ substantially from these forecasts.