Embed Size (px)
Citation preview

RESULTS – alumni survey 2002.doc – Office of Institutional Research and Assessment – 06/25/03 1
THE EVERGREEN STATE COLLEGE 2002 ALUMNI SURVEY OF THE CLASS OF 2000-01
A. Sample and Response Rates
Total Undergraduate Degree Recipients AY 2000-01 1016 Number with no known address and/or e-mail (Note: 49 alumni had no known contact information at the time the sample was selected. Survey contact was attempted with the other 34 alumni in this category, but all mail and e-mail contacts were returned undeliverable, and we were unable to locate more recent contact information.)
83
Deceased 1 Final Sample Size 932 Refusal 1 No Response 638 Paper Survey Respondents 277 E-mail Survey Respondents 16
Total Respondents 293 31.4% response rate
B. Methodology The graduating class of 2000-01 (degree awarded between Fall 2000 and Summer 2001) was surveyed one-year after receiving baccalaureate degree, during Summer 2002. In July 2002, surveys were mailed to all members of the graduating class who had address information. When surveys were returned as undeliverable, the Evergreen student database and internet resources were explored for new or secondary addresses to which surveys were redelivered. In late August 2002, an e-mail version of the survey was developed and sent to all alumni who had e-mail addresses available in Banner (and had not yet returned a paper survey). Completed surveys were accepted between July 2002 and January 2003. A “Greener Grad” bumper sticker was offered as a small incentive for survey completion. The stickers were mailed with a thank you note as completed surveys were received. C. Respondent Demographics Location Primarily Attended During Evergreen Studies (as identified by survey respondents) Olympia (N=272) 92.8% Tacoma Program (N=17) 5.8% Grays Harbor (N=2) 0.7% Reservation-based Program (N=2) 0.7%

RESULTS – alumni survey 2002.doc – Office of Institutional Research and Assessment – 06/25/03 2
Type of Degree Type of Degree Earned
(N=293)
Bachelor of Arts (BA)
82%
Dual Degree (BAS)
3%Bachelor of
Science (BS)15%
Ethnic Background Students were asked to check as many categories as they felt applied. Those who selected more than one category are represented in the applicable multiple race categories in the following table.
White/Caucasian (N=225) 76.8% African American (N=8) 2.7% Asian American or Pacific Islander (N=8) 2.7% Hispanic/Latino/Latina American (N=7) 2.4% Native American (N=7) 2.4% Native American or Alaskan Native and White (N=3) 1.0% Asian or Japanese (N=3) 1.0% Asian or Korean and Caucasian (N=2) 0.7% Hispanic or Latina and Caucasian (N=2) 0.7% Jewish and White (N=2) 0.7% Asian and Hispanic (N=1) 0.3% Jewish (N=1) 0.3% Native American and mixed race (N=1) 0.3% African (N=1) 0.3% Prefer not to respond (N=22) 7.5%
Age and Gender
Alumni respondents ranged in age from 21 to 63. Their average age was 31, and median age was 26.
Gender of Survey Respondents(N=293)
Female 63%
Male37%
Male alumni were slightly underrepresented in the respondent group (37%) compared to their proportion within the entire graduating class (43%). This difference was tested using a chi-square, and it was not significant at p….05.
The proportion of different degree types among survey respondents was nearly identical to the distribution of various degrees in the whole graduating class. In the entire class of 2000-01, 83% earned BA, 15% earned BS, and 2% completed the BAS dual degree. Based on this comparison, it appears that the survey results shouldbe representative of the graduating class with regards to degree type.
RESULTS – alumni survey 2002.doc – Office of Institutional Research and Assessment – 06/25/03 3
Alumni identified the one area that best described their primary area of study (concentration) at Evergreen; the distribution of their responses is presented in the next table.
Social Sciences (N=95) 32.4% Humanities, Language Arts (Culture, Text & Language) (N=54) 18.4% Environmental Studies (N=38) 13.0% Media, Visual Arts, Drama (Expressive Arts) (N=36) 12.3% Science, Math, Computers (Scientific Inquiry) (N=36) 12.3% Liberal Arts/Interdisciplinary Study (this category includes alumni who chose more than one primary area of study, or wrote in “Liberal Arts”)
(N=22) 7.5%
Native American Studies (N=7) 2.4% Other field: Education (N=4) 1.4% Other field: Midwifery (N=1) 0.3%
Primary Enrollment Status as a Student at Evergreen
Full-Time (N=271) 92.5% Part-Time (N=22) 7.5%
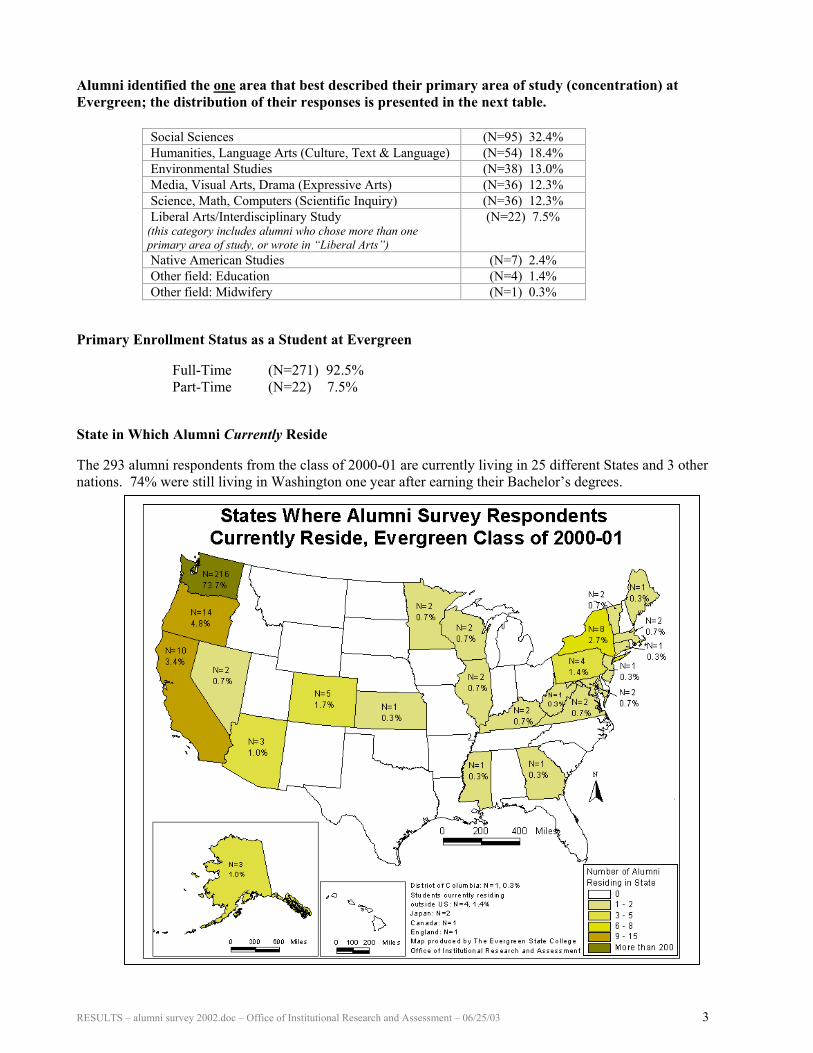
State in Which Alumni Currently Reside The 293 alumni respondents from the class of 2000-01 are currently living in 25 different States and 3 other nations. 74% were still living in Washington one year after earning their Bachelor’s degrees.

RESULTS – alumni survey 2002.doc – Office of Institutional Research and Assessment – 06/25/03 4
Class Standing at Enrollment
Class Standing at Time of Evergreen Enrollment
Senior(135 or more
transfer credits)
8%
Junior(90-134 transfer
credits)20%
Sophomore(45-89 transfer
credits)44%
Freshman(0-44 transfer
credits)28%
When you applied for admission, what choice of college was Evergreen?
4th choice1%3rd choice
3%2nd choice
10%
1st choice86%
D. Alumni Satisfaction with Experience Alumni indicated their level of agreement or disagreement for each of the next two statements on a four-point scale (1=strongly disagree, 2=somewhat disagree, 3=somewhat agree, 4=strongly agree). The average ratings for both questions fell firmly on the “agree” side of the scale.
4.1% 6.2%
27.1%
62.7%
0%
10%
20%
30%
40%
50%
60%
70%
% o
f res
pons
es
Stronglydisagree
Somewhatdisagree
Somewhatagree
Stronglyagree
If I could start college over, I would choose to attend Evergreen
Mean=3.48Note: N=292 for this question, since 1 alumnus did not respond.
If they could start college over, 90% of the alumni would choose to attend Evergreen.
Choice of College When they applied for admission, Evergreen was the first choice of college for 86% of the alumni respondents.
Alumni respondents identified their class standing at the time they first enrolled at Evergreen. The largest proportion of this group (44%) transferred into Evergreen with sophomore standing.

RESULTS – alumni survey 2002.doc – Office of Institutional Research and Assessment – 06/25/03 5
3.4%10.3%
28.6%
57.6%
0%
10%
20%
30%
40%
50%
60%
70%
% o
f res
pons
es
Stronglydisagree
Somewhatdisagree
Somewhatagree
Stronglyagree
If I could start college over, I would choose the same field(s) of study
Mean=3.40Note: N=290 for this question, since 3 alumni did not respond.
Evergreen’s Contribution to Academic and Personal Growth Alumni were asked to rate their satisfaction with Evergreen's contribution to their academic and personal growth in each of the following academic areas on a five-point scale from 1=not at all satisfied to 5=very satisfied. Overall, the alumni were satisfied with their growth in all areas. The average ratings for each academic area fell above the somewhat satisfied point on the scale. In 11 of the 14 areas, over half of the alumni reported being mostly or very satisfied with Evergreen’s contribution (which were the top two ratings on the scale). The 3 areas that received the highest percentage of mostly or very satisfied ratings were “learning independently” (91%), “working cooperatively in a group” (86%), and “critically analyzing written information” (84%). The 3 areas that received the lowest percentage of mostly or very satisfied ratings were “understanding and applying quantitative principles and methods” (45%), “understanding and applying scientific principles and methods” (48%), and “readiness for a career” (49%). Academic Areas 1
Not at all satisfied
2 Little
satisfaction
3 Somewhat satisfied
4 Mostly
satisfied
5 Very
satisfied Writing effectively (N=291) 1.0% 5.5% 16.8% 44.0% 32.6% Speaking effectively (N=291) 0.7% 4.1% 20.6% 40.9% 33.7% Critically analyzing written information (N=289) 0.3% 3.8% 12.1% 34.6% 49.1% Learning independently (N=290) 0.3% 0.7% 7.6% 24.8% 66.6% Understanding and appreciating the arts (N=287) 3.8% 4.5% 22.3% 33.4% 35.9% Understanding and applying scientific principles and methods (N=273) 7.0% 17.2% 27.5% 26.0% 22.3%
Understanding and applying quantitative principles and methods (N=276) 8.0% 17.0% 30.4% 25.4% 19.2%
Defining and solving problems (N=291) 0.7% 4.1% 18.9% 39.2% 37.1% Working cooperatively in a group (N=290) 1.0% 2.4% 10.3% 28.6% 57.6% Readiness for a career (N=288) 6.3% 15.6% 28.8% 26.7% 22.6% Readiness for advanced education (N=287) 2.4% 8.7% 23.3% 28.2% 37.3% Understanding different philosophies and cultures (N=289) 1.0% 3.1% 12.5% 32.9% 50.5% Understanding the interaction of society and the environment (N=289) 0.3% 4.2% 13.5% 35.3% 46.7%
Recognizing your rights, responsibilities and privileges as a citizen (N=290) 1.4% 7.2% 19.0% 31.0% 41.4%
Note: the number of respondents varies for each academic area, since some alumni skipped questions or felt an area was not applicable to their experience.
86% of the alumni would choose the same field(s) of study.
“I feel that I have the ability to teach myself almost anything that I want to know. I don’t
rely on others to provide new information.” – alum,
class of 00-01

RESULTS – alumni survey 2002.doc – Office of Institutional Research and Assessment – 06/25/03 6
The average satisfaction rating for each academic area was calculated and the results are presented in the next chart.
Satisfaction with Evergreen's Contribution to Growth
3.313.403.44
3.893.934.024.034.044.084.244.284.294.394.57
1
2
3
4
5
Learn
inde
pend
ently
Work
coop
erativ
ely in
a gro
up
Unders
tand d
iff ph
iloso
phies
& cu
ltures
Critica
lly an
alyze
writt
en in
formati
on
Unders
tand i
nterac
tion o
f soc
iety &
envir
onmt
Define
& so
lve pr
oblem
s
Recog
nize r
epon
sibilit
ies as
citiz
enSpe
ak ef
fectiv
elyW
rite ef
fectiv
ely
Unders
tand/a
pprec
iate t
he ar
ts
Readin
ess f
or ad
vanc
ed ed
ucati
onRea
dines
s for
caree
r
Unders
tand/a
pply
scien
tific p
rincip
les
Unders
tand/a
pply
quan
titativ
e prin
ciples
Ave
rage
Sat
isfa
ctio
n
Note: Satisfaction was rated on a five-point scale where 1=not at all satisfied, 2=little satisfaction, 3= somewhat satisfied, 4=mostly satisfied, and 5=very satisfied. Work-related skills and abilities Alumni rated their skill levels in a series of work-related activities. Then the alumni who rated their skill levels also rated how well the education they received at Evergreen prepared them in each area. The following table provides the frequencies of the alumni responses about their work-related skills. The most common rating category for each work-related skill is presented in bold print for emphasis.

RESULTS – alumni survey 2002.doc – Office of Institutional Research and Assessment – 06/25/03 7
Your level of skill Preparation from your Evergreen education
Work-Related Skills 1= Poor
2= Fair
3= Good
4= Excellent N/A Not at
all
To some extent
A great deal
Ability to organize and tackle work efficiently (N=287) 0.3% 3.5% 30.7% 65.5% 0% 7.1% 68.1% 24.8%
Ability to work in a culturally diverse environment (N=288) 0% 1.7% 25.0% 71.9% 1.4% 13.6% 43.9% 42.5%
Computer literacy: ability to use software for a range of different tasks (N=288) 3.8% 17.4% 43.8% 34.4% 0.7% 23.8% 52.8% 23.4%
Creative thinking skills: ability to generate new ideas; to be original and inventive (N=287)
0.3% 4.9% 39.4% 55.4% 0% 3.9% 43.5% 52.7%
Decision-making ability: ability to determine options and choose the best alternative (N=287)
0% 5.9% 44.6% 49.5% 0% 7.8% 64.3% 27.9%
Independence and initiative: ability to take charge of projects and work without supervision (N=287)
0% 3.1% 22.6% 74.2% 0% 6.0% 43.8% 50.2%
Leadership: ability to lead and provide direction (N=288) 1.7% 10.8% 39.6% 47.2% 0.7% 14.9% 55.9% 29.2%
Math skills/numeracy: ability to use numbers, data and graphs with accuracy (N=288)
8.7% 24.3% 40.6% 21.9% 4.5% 47.1% 39.7% 13.2%
Negotiating skills: ability to discuss a difficult issue with others and reach a mutual agreement (N=287)
0.7% 8.4% 48.1% 42.9% 0% 5.7% 55.1% 39.2%
Research skills: ability to conduct research carefully to obtain information (N=288)
0.7% 9.7% 41.3% 47.6% 0.7% 8.9% 41.8% 49.3%
Willingness and aptitude to learn new skills (N=288) 0% 1.4% 22.6% 76.0% 0% 4.6% 44.7% 50.7%
Give presentations in the work environment (N=288) 3.5% 18.4% 37.5% 35.4% 5.2% 7.5% 47.4% 45.1%
Written communication in the work environment (N=288) 0.7% 8.0% 43.1% 44.8% 3.5% 9.9% 50.7% 39.4%
Critically analyze information (N=288) 0.3% 5.6% 40.6% 52.8% 0.7% 3.9% 43.3% 52.8%
Work cooperatively in team efforts (N=288) 0% 4.2% 29.9% 65.3% 0.7% 2.5% 33.9% 63.6%
Note: The number provided by each item reflects the number of alumni who rated their initial skill level; the number varies for each skill area, since some alumni skipped questions. Average skill level ratings were calculated for each work-related area (excluding alumni who reported that an area was not applicable). Based on average ratings, the alumni felt their strongest three skill areas were
• willingness and aptitude to learn new skills • independence and initiative • and ability to work in a culturally diverse environment.

RESULTS – alumni survey 2002.doc – Office of Institutional Research and Assessment – 06/25/03 8
Average Level of Skill in Work-related Areas
2.793.093.11
3.333.333.373.373.443.473.503.613.623.713.75 3.71
1
2
3
4
Lear
n ne
w sk
ills
Inde
pend
ence
& in
itiat
ive
Wor
k in
div
erse
env
ironm
t.W
ork
coop
erat
ivel
y
Orga
nize
wor
k ef
ficie
ntly
Crea
tive
thin
king
ski
llsCr
itica
lly a
naly
ze in
foDe
cisi
on-m
akin
gRe
sear
ch s
kills
Writ
ten
com
mun
icat
ion
Lead
ersh
ipNe
gotia
ting
skill
sGi
ve p
rese
ntat
ions
Com
pute
r lite
racy
Mat
h sk
ills/
num
erac
y
Mea
n Sk
ill L
evel
Note: Each ability was rated on a four-point scale in which 1=poor, 2=fair, 3=good, and 4=excellent.
Although they felt their overall abilities were highest in learning new skills, independence and initiative, and working in diverse environments, they rated three different areas as the highest in regards to preparedness from their Evergreen education. Alumni reported that Evergreen provided the greatest preparation in the following areas:
• working cooperatively in team efforts • creative thinking skills • and critically analyzing information.
Average Rating of Preparation from Evergreen Education for Work-related Skills
1.66
2.002.142.182.202.292.302.342.382.402.442.462.492.49
2.61
1
2
3
Wor
k co
oper
ativ
ely
Crea
tive
thin
king
ski
llsCr
itica
lly a
naly
ze in
fo
Lear
n ne
w s
kills
Inde
pend
ence
& in
itiat
ive
Rese
arch
ski
lls
Giv
e pr
esen
tatio
ns
Nego
tiatin
g sk
ills
Writ
ten
com
mun
icat
ion
Wor
k in
div
erse
env
ironm
t.
Deci
sion
-mak
ing
Org
aniz
e w
ork
effic
ient
ly
Lead
ersh
ip
Com
pute
r lite
racy
Mat
h sk
ills/
num
erac
y
Mea
n Pr
epar
edne
ss R
atin
g
Note: Level of preparedness was rated on a three-point scale where 1=not at all, 2=to some extent, and 3=a great deal.
Alumni reported that “math skills” and “computer literacy” were the lowest areas in terms of current ability and preparedness from their Evergreen education.
[At Evergreen, I developed]“the ability and willingness
to work with all types of people and professional
styles in a “team” oriented environment.” – alum, class
of 00-01

RESULTS – alumni survey 2002.doc – Office of Institutional Research and Assessment – 06/25/03 9
Satisfaction with Evergreen Experiences Alumni rated their level of satisfaction with a series of Evergreen educational experiences. They rated their satisfaction on a four-point scale from 1=very dissatisfied to 4=very satisfied. They also had the option of indicating that they did not participate in a particular experience. Nearly all of the alumni (>98%) indicated that they had participated in interdisciplinary study, narrative evaluations, instruction and academic advice from faculty, exposure to different viewpoints, and intellectual discussions with other students. However, six experiences in the list were revealed to be less universal to the alumni.
• 80% participated in contracts and other individual work with faculty • 62% participated in opportunities for advanced work at Evergreen • 57% participated in community service or volunteer work • 54% participated in a culminating senior experience • 48% participated in internships • 22% participated in study abroad The following table shows the distribution of the alumni satisfaction responses; the table is sorted in order of the experiences that were most commonly experienced by the alumni to those that were less commonly experienced. For alumni who had participated in an experience, very satisfied was the most common response category for all experiences in the list.
Educational Experiences as a Student at Evergreen
1= Very
Dissatisfied
2= Somewhatdissatisfied
3= Somewhat satisfied
4= Very
satisfied
Did Not Participate
aEvergreen’s interdisciplinary approach to education(N=290) 0.7% 3.1% 16.2% 80.0% 0%
bNarrative evaluations written by faculty (N=290) 1.0% 4.1% 24.5% 70.3% 0% cThe quality of instruction (N=290) 1.7% 4.5% 29.0% 64.8% 0% dQuality of intellectual discussions with other students, for example, in seminars (N=292) 3.8% 13.4% 39.0% 43.5% 0.3%
eThe education you were able to construct as an Evergreen student (N=291) 1.0% 5.8% 27.8% 64.9% 0.3%
fTolerance and respect shown for different or opposing viewpoints (N=292) 3.4% 11.3% 31.8% 52.7% 0.7%
gAcademic advice from faculty (N=289) 3.1% 11.8% 36.0% 47.4% 1.7% hSelf-evaluation process (N=292) 1.4% 7.9% 37.7% 51.4% 1.7% iContracts and other individual work with faculty (N=292) 1.4% 3.8% 19.2% 55.8% 19.9%
jOpportunities for advanced work at Evergreen (N=288) 3.8% 12.8% 20.8% 24.3% 38.2%
kCommunity service or volunteer work (N=292) 3.1% 5.1% 19.2% 29.8% 42.8% lCulminating senior experience (capstone, thesis, or senior summative self-evaluation) (N=290) 3.8% 6.6% 19.0% 24.5% 46.2%
mInternships (N=290) 0.7% 2.4% 10.3% 34.8% 51.7% nStudy abroad (N=292) 1.7% 2.7% 3.1% 14.7% 77.7% Note: The number provided next to each item in the list reflects the number of alumni who rated their satisfaction; the number varies since some alumni skipped questions.
“Before entering to Evergreen, faculty was somebody just to give speeches and lectures. However faculty at Evergreen were people
who study together with students (of course they taught me.) Also, they taught me how fun it is to study and share opinions.” – alum, class of 00-01

RESULTS – alumni survey 2002.doc – Office of Institutional Research and Assessment – 06/25/03 10
Average ratings of satisfaction were calculated for each experience, excluding the alumni who indicated that they had not participated. The average ratings for all items fell on the satisfied region of the rating scale (mean score above 3.0). Evergreen’s “interdisciplinary approach to education” was the most satisfying to the alumni respondents. “Opportunities for advanced work at Evergreen” had the lowest satisfaction of the experiences in this series, however, even this item’s average rating was in the “satisfactory” range on the rating scale. The means for the experiences are presented in the next chart.
Mean Ratings of Satisfaction with Evergreen Experiences(alumni who "did not participate" are excluded from mean calculations)
3.41 3.38 3.35 3.32 3.30 3.23 3.19 3.06
3.573.573.623.643.643.76
1
2
3
4
Inte
rdisc
iplina
ry a
ppro
ach
Narra
tive
evalu
ation
s by f
acult
y
Inte
rnsh
ips
Cont
racts
& in
dividu
al wo
rk w
/facu
ltyQu
ality
of in
struc
tion
Educ
ation
you
were
able
to co
nstru
ctSe
lf-ev
aluat
ion p
roce
ss
Stud
y abr
oad
Toler
ance
/resp
ect f
or d
iff. vi
ewpo
ints
Com
mun
ity se
rvice
or v
olunt
eer w
ork
Acad
emic
advic
e fro
m fa
culty
Inte
llectu
al dis
cuss
ions w
/stud
ents
Culm
inatin
g se
nior e
xper
ience
Oppo
rtunit
ies fo
r adv
ance
d wo
rk
Ave
rage
leve
l of s
atis
fact
ion
Note: Satisfaction was rated on a four-point scale where 1=very dissatisfied, 2=somewhat dissatisfied, 3=somewhat satisfied, and 4=very satisfied.
E. Satisfaction with Campus Resources Alumni respondents also rated their level of satisfaction with nine campus support resources. They used a four-point scale to rate their level of satisfaction, (1=very dissatisfied to 4=very satisfied); or they could check a box indicating that they did not use a particular service. The distribution of their responses is provided in the next table; the table is sorted in order of the most frequently used services to the least frequently used.
Campus Resources at Evergreen 1=
Very Dissatisfied
2= Somewhat Dissatisfied
3= Somewhat satisfied
4= Very
satisfied
Did Not Use
The Evergreen Library (N=291) 3.1% 7.9% 40.9% 45.0% 3.1% The Computer Center (N=292) 2.1% 10.3% 38.7% 45.2% 3.8% The Academic Advising Office (N=292) 8.9% 11.3% 35.3% 30.1% 14.4% The Financial Aid Office (N=291) 5.2% 10.3% 25.1% 26.8% 32.6% The Health Services Office (N=292) 1.4% 4.5% 18.5% 29.1% 46.6% The Career Development Office (N=290) 7.6% 10.7% 18.6% 16.2% 46.9% The Counseling Center (N=292) 3.1% 5.5% 12.3% 13.0% 66.1% The Writing Center (N=292) 1.7% 3.8% 11.0% 14.7% 68.8% The Quantitative Reasoning (Math Tutoring) Center (N=292) 2.1% 1.7% 5.5% 5.5% 85.3% Note: The number provided next to each item in the list reflects the number of alumni who rated their satisfaction; the number varies since some alumni skipped questions.
“The interdisciplinary nature of Evergreen
emphasized the interconnectedness of our society and world.” – alum,
class of 00-01.

RESULTS – alumni survey 2002.doc – Office of Institutional Research and Assessment – 06/25/03 11
The Evergreen Library and the Evergreen Computer Center were the most commonly used resources by this group of alumni. • Evergreen Library: 97% used this resource, and of those who used it 89% were satisfied. • Computer Center: 96% used this resource, and of those who used it 87% were satisfied.
Average satisfaction ratings were computed for each campus resource, excluding the alumni who indicated that they had not used a specific service. Of the alumni who had used a service while they were Evergreen students, the Health Center received the highest average rating of satisfaction. The Career Development Office and the Quantitative Reasoning Center were the only resources whose average ratings fell slightly below the satisfactory level on the rating scale. The mean scores are presented in the following chart.
Mean Ratings of Satisfaction with Campus Resources(Alumni who did not use the resource are excluded from mean calculations)
3.41 3.32 3.32 3.24 3.09 3.04 3.01 2.98 2.82
1
2
3
4
Hea
lthSe
rvic
es
Libr
ary
Com
pute
rC
ente
r
Writ
ing
Cen
ter
Fina
ncia
l Aid
Cou
nsel
ing
Cen
ter
Aca
dem
icA
dvis
ing
Qua
ntita
tive
Rea
soni
ngC
tr
Car
eer
Dev
elop
men
tAve
rage
ratin
g of
sat
isfa
ctio
n
Note: Satisfaction was rated on a four-point scale where 1=very dissatisfied, 2=somewhat dissatisfied,3=somewhat satisfied, and 4=very satisfied.
Career Development Office
How helpful was the Career Development Office in your job search?(N=84 alumni who replied that they had contacted the Office for job search assistance)
very helpful19%
somewhat helpful29%
not helpful52%
Alumni who had attended or been accepted to graduate school since graduation from Evergreen were asked if they had contacted the Career Development Office for help in learning about and/or applying for graduate or professional school. Of the 50 alumni who had already pursued graduate studies, 30% had sought the help of the Career Development Center. Two-thirds (67%) of the alumni who sought graduate school assistance found the Career Development Office to be helpful in their pursuits.
29% of the alumni had contacted the Career Development Office for help in finding a job after graduation. 48% of those who contacted Career Development for such assistance found the service useful in their job searches.
“Wendy Freeman, the director of the Career Resource Center, provided amazing support to me throughout my Evergreen years. She really changed the way I think about work and I am indebted to her for it.” –
alum, class of 00-01
“The Career Development Center helped tremendously with evaluations, tests, and by providing choices for after graduation.” – alum, class of 00-01

RESULTS – alumni survey 2002.doc – Office of Institutional Research and Assessment – 06/25/03 12
Unfortunately, survey design limited the potential respondents to this question, and it would have been preferable to know from all alumni whether they had sought this sort of advice from Career Development, whether or not they had attended graduate school since Evergreen. This survey question will be placed differently in future administrations. F. Alumni Employment Data
Current Employment(N=291)
No13%
Yes87%
Employed in Area of Primary Studies at Evergreen(N=246)
Not at all26%
Somewhat40%
Yes34%
The alumni responses to the question of employment in their primary area of study was further explored in comparison to the area they had identified as their primary area of study while at Evergreen.
Percentage of Alumni Employed in Area of Primary Area of Study at Evergreen
83%
79%
71%
68%
67%
61%
60%
100%
0% 20% 40% 60% 80% 100%
1
prim
ary
area
of s
tudy
at E
verg
reen
% "yes" or "somewhat" employed in primary area of study
Liberal Arts/Interdisciplinary (N=20)
Expressive Arts (N=33)
Native American Studies (N=3)
Culture, Text, and Language (N=44)
Environmental Studies (N=35)
Scientific Inquiry (N=29)
Social Sciences (N=77)
Education (N=4)
87% of the alumni reported that they were currently employed one year after graduation from Evergreen.
Of those who were employed, 74% were employed in an area that was least somewhat related to their area of primary study at Evergreen.

RESULTS – alumni survey 2002.doc – Office of Institutional Research and Assessment – 06/25/03 13
Employed alumni were asked to indicate which of the following characteristics described their employment and other life activities. The table provides the percentage of alumni respondents who indicated that each characteristic applied to their current circumstances.
Employed full-time: 76% Seeking employment: 18%
Employed part-time: 17% Enrolled in job skills training program: 1%
Employed on a temporary basis: 18% Caring for home or family members: 5%
Self-employed/own business: 12% Other: 1% • also volunteering regularly • developing photography portfolio • traveling, continuing studies
Employed alumni selected one category from the list below that they felt best described the type of work they were doing one year after graduation.
Social services/political or community organizing 16.1% Teaching/education 12.6% Business support (office manager, financial, clerical, etc.) 12.2% Sales/service/restaurant work 10.2% Business administration (management, marketing, public relations, etc.) 8.3% Expressive arts/media 7.9% Natural sciences (biology, physics, chemistry, math, etc.) 6.7% Medicine/medical technology/health services 5.9% Skilled trades (building construction, plumbing, carpentry, electrical, etc.) 4.3% Computer programming/data processing 3.9% Agriculture/horticulture/landscaping 3.5% Environmental work 3.5% Other (written in)… • Law enforcement • Legal clerk/civil rights • Military • News editor/journalism
1.6%
Type of employment not indicated 3.1%
How well did Evergreen prepare you for your current job?(N=241)
Adequately53%
Very well27%
Not at all10%
Not very well10%
80% of the alumni felt that their Evergreen experiences prepared them adequately or very well for their current employment.

RESULTS – alumni survey 2002.doc – Office of Institutional Research and Assessment – 06/25/03 14
G. Graduate or Professional School
Have you attended or been accepted to graduate or professional school since graduation?
(N=291)
No83%
Yes17%
Of the alumni who indicated that they had not yet attended graduate school at the time of the survey (N=241), 80% reported their intention to apply to graduate or professional school in the future. The alumni who were attending graduate school selected one area that best described their field of study. The next table shows the percentage of graduate students in each area.
Education 18% Public Administration 16% Environmental Studies/Environmental Science 10% Social Science (Psychology, Anthropology, etc.) 10% Counseling/Social Work 8% Humanities (Literature, History, Philosophy) 8% Law/Justice 8% Medicine/other Health-related field 6% Business 4% Expressive Arts (Fine Arts, Performance, Visual Arts, Media) 4% Library and Information Science 4% Natural Science (Biology, Physics, Chemistry, Math) 2% Other Field: Architecture 2%
Of those attending graduate school, 81% were working toward various master’s degrees (such as MPA, MBA, MEd, MFA, MSW, etc.), and 19% were working toward doctoral level degrees (such as PhD, JD, MD, etc.).
How well did Evergreen prepare you for your graduate or professional program?
(N=50)
Not at all2%
Adequately46% Very well
52%
62% were completing their advanced studies in Washington State, and the other 38% were distributed across 12 other States and 2 foreign countries. The Evergreen State College, Antioch University, University of Washington, and Western Washington University were the most common graduate school choices for this group of alumni.
17% of the alumni have attended (or been accepted to) graduate or professional school within one year of graduating from Evergreen.
98% felt that Evergreen had prepared them adequately or very well for their advanced programs.

RESULTS – alumni survey 2002.doc – Office of Institutional Research and Assessment – 06/25/03 15
H. Special Strengths Developed at Evergreen Alumni were asked an open-ended narrative question in which they described special strengths or skills they developed at Evergreen that were especially useful in their current endeavors. Their comments were reviewed and categorized in order to present them in summary form. Evergreen alumni revealed that their ability to be self-directed, independent learners was the most useful strength in their lives one-year after graduation. About one-third of the surveys included a strength that fell into this category.
This group of alumni also frequently mentioned critical and analytical thinking ability and diversity awareness as Evergreen-developed strengths that were serving them well in their lives. Skills related to working with groups of people were the fourth most commonly mentioned strength.
What special strengths or skills did you develop at Evergreen that are especially useful in your current endeavors?
Frequency of response
(N=256 with at least one narrative strength
indicated) Self-directed/ Independent Learning (also includes ability to pursue information, self-motivation, initiative, intellectual curiosity, personal responsibility for work) 86 33.6%
Thinking Critically/ Analytically (also incl. complex problem-solving, integration/ synthesis of knowledge; contextual thinking) 75 29.3%
Diversity Awareness (also includes respect for differences, openness to other ideas and alternative perspectives, relating to different kinds of people) 64 25.0%
Group Work/Working Cooperatively 62 24.2% Public Speaking/Oral Communication 59 23.0% Personal Growth (also includes self-confidence; self-awareness; self-assessment; acceptance of critique; development of personal convictions, values, direction, or sense of duty) 56 21.9%
Writing 49 19.1% Communication Skills (general) 27 10.5% Research Skills (also includes. library and internet research) 27 10.5% Interpersonal Skills (also includes networking, conflict resolution, advocacy) 22 8.6% Creativity (also includes innovation, resourcefulness, imagination) 21 8.2% “Real-world” Applications (also includes internship experiences, hands-on training) 20 7.8% Leadership/ Facilitation 19 7.4% Computer/Web/Digital Media Skills 17 6.6% Natural Science/Math/Environmental Studies Skills 16 6.3% Interdisciplinary Thinking 15 5.9% Art Skills (also includes music, drama, TV production, photography, art portfolio) 12 4.7% Organizational Skills (also incl. time management) 11 4.3% Listening Skills 10 3.9% Teaching Skills 10 3.9% Note: Other strengths mentioned by less than ten alumni included patience (N=6), foreign language skills (N=5), flexibility (N=3), and how to survive an earthquake (N=1).
“The most important skill I learned was independence. This includes the ability to
work independently, without a rigorous schedule, to be able to work and get
things done without supervision. It also means to think independently, to form my own ideas and views.” – alum, class of 00-01
“…the ability to work in a diverse environment
and be an integral part of that environment;
contributing as well as learning.” – alum, class of
00-01
“…to look at the big picture of anything and
try to relate it to information I’m
familiar with to make the best decision.” –
alum, class of 00-01

RESULTS – alumni survey 2002.doc – Office of Institutional Research and Assessment – 06/25/03 16
I. Recognition of Special Individuals In an open-ended narrative response question, alumni were asked if there were particular individuals that made a special contribution or genuine difference to their educational or personal growth at Evergreen. 259 of the alumni respondents (88%) wrote in a response to this question, and they identified 227 different individual faculty and staff members that had made special contributions to their growth. The list included many full-time, part-time, adjunct, visiting, and post-retirement faculty. Staff members from Academic Advising, Career Development, KEY services, the Health/Counseling Center, the Library, Media Services, Registration and Records, Student Activities, Police Services, Facilities, Lab Stores, Admissions, Food Services, Writing Center, Academic Budget Office, and Parking Office were also named.
The complete list of individuals was presented as a poster during an employee recognition ceremony in May 2003. Once the comments are reviewed to remove content that could identify the alumni respondent, they will be forwarded to the staff and faculty who were mentioned, so they can be aware of the impact they are credited with in the lives of Evergreen alumni. The five people mentioned by the highest number of alumni respondents were Craig Carlson (faculty in Culture, Text, and Language, 1973-2001), Mark Hurst (adjunct faculty in Psychology, 1997-current), Tom Rainey (faculty in Culture, Text, and Language, 1972-current), Rob Cole (faculty in Environmental Studies, 1981-current), and Russ Fox (faculty in Environmental Studies, 1972-current).
J. Alumni Recommendations 84% of the alumni respondents (N=246) suggested things they would change about Evergreen or their experiences at Evergreen. The next table summarizes their recommendations in common categories based on review and analysis of their written comments. If you could change anything about Evergreen from your perspective as a recent graduate, what one or two aspects would you change?
Frequency of response (N=246 with at least one change)
Academic Content 64 26.0% Curricular Structure 40 16.3% Advising and Guidance Issues 40 16.3% Career/Graduate School Preparation Issues 34 13.8% Faculty Issues 32 13.0% Campus Community/Diversity Issues 27 11.0% Personal Changes 23 9.3% New Graduate Degree Offerings 20 8.1% Administration Issues 18 7.3% Evaluation Issues 18 7.3% Student Accountability 18 7.3% Community Perception of Evergreen 17 6.9% Enrollment Services Issues (Financial Aid, Admissions, Registration) 16 6.5% Library/Media Services Issues 15 6.1% Seminar Issues 14 5.7% Accessibility of Services 11 4.5% Facilities/Equipment Issues 10 4.1% Note: Other categories of changes that were recommended by fewer than ten alumni included issues with computing resources (N=7), extracurricular activities (N=6), and campus police (N=2).
“Faculty and staff as a whole were awesome. I was
inspired and intrigued by the staff and the faculties' drive to continue their education.
Allotting time for sabbatical, weekend seminars, intensive programs, research, and other various means of gobbling up
information.” – alum, class of 00-01
“All the faculty members I have had in programs have gone out of their way to be open and
encouraging. One of the best aspects of Evergreen
is how accessible the professors are, and how closely you work with
them.” – alum, class of 00-01

RESULTS – alumni survey 2002.doc – Office of Institutional Research and Assessment – 06/25/03 17
Recommendations regarding the content of academic offerings were the most common category of suggestions. Some wanted more specific topical study and others suggested more integrated studies; some alumni felt more introductory courses were needed, and others sought more opportunities for advanced work. The majority of this group of alumni suggested more specific introductory offerings that would help them achieve a basic conceptual understanding of their interest area in order to prepare for advanced work or meet graduate school admissions requirements. Expanded introductory offerings in art, mathematics/statistics, science, psychology/social service, and business were most commonly suggested. Content suggestions from alumni who wished there were more upper-division opportunities most often named the health sciences as an area for growth; others wished for more advanced offerings in business/economics, psychology, writing, foreign language, mathematics, computer science, and deaf education. The last general trend in this category included alumni who wanted more integration of interdisciplinary areas in academic programs. The most common request was for increased integration of the arts and sciences. Other alumni felt that economics, writing, and mathematics/statistics ought to have a stronger presence across interdivisional programs. Greater varieties of offerings at Evergreen’s Tacoma and Grays Harbor locations were encouraged. In regards to alumni recommendations for changes to curricular structures at Evergreen, most suggested additional access to offerings through which to explore new areas of interest or build specific skills. Alumni often made these comments in tandem with a description of the difficulty of exploring secondary interests such as art or foreign language study in addition to the workload of a full-time program. A few alumni wished for the ability to declare a major or specific degree. Several alumni named requirements that they would establish for Evergreen students which included mandatory internships, community service, senior theses, study abroad, required areas of study, and portfolio development. Others raised issues of better coordination of contracts and internships, improved information sharing between part-time and full-time curriculum, more consistency of offerings to help students plan academic pathways, enforcement of pre-requisites, and standards for determining the workload of part-time offerings. Alumni made a number of suggestions about the need for more advising and guidance at various points of academic and post-graduation planning. Students wished they had more support in understanding their curricular options and creating a plan to move them toward longer-term education and career goals. In fact, at least ten alumni would require students to meet with academic and/or career development counselors. Some encouraged additional training for advising staff regarding career options, current graduate school entrance requirements, and available Evergreen curricular options, especially in the Sciences. Some wished that advisors had nudged them to pursue specific academic territory while at Evergreen, and others wanted more support when they first transitioned to Evergreen’s learning environment. Beyond the three main topical areas listed previously, alumni also offered a variety of suggestions regarding what they would have done differently to prepare themselves for future careers and graduate school endeavors. Comments about specific faculty members, specific teaching approaches, and seminar dynamics were also fairly common. A lack of respect for different perspectives (especially more traditional or conservative viewpoints) was addressed by quite a few students. When these sentiments were combined with a few more specific requests to diversify the student body itself in terms of cultural and ethnic backgrounds, the “campus community/diversity” category represented about 11% of the alumni comments. A wide variety of ideas for new graduate-level programs at Evergreen were named. Issues with narrative evaluations were noted, (and a few alumni desired to have a corresponding grade-point average awarded). Some alumni suggested that students should be held to a higher standard of academic performance and that faculty should hold students accountable for their work. Others felt more should be done to improve community and employer perceptions of Evergreen and its graduates. The remaining comments were primarily suggestions for specific campus offices, upgrades to physical classroom spaces and equipment, and requests for expanded hours for various services. Alumni feedback will be forwarded to the various campus offices and decision-makers that were specifically mentioned for purposes of consideration in future planning.

RESULTS – alumni survey 2002.doc – Office of Institutional Research and Assessment – 06/25/03 18
K. Statewide Transfer Study Questions Evergreen’s Alumni Survey 2002 included an additional series of questions related to transfer student experiences. The questions were collaboratively developed by an inter-institutional team headed by the Washington State Board for Community and Technical Colleges, including participants from the state’s four-year public colleges, community colleges, Council of Presidents’ Office, and the Higher Education Coordinating Board. The survey data will eventually be analyzed as part of a larger inter-institutional project studying student pathways to a Bachelor’s degree in Washington State. Following are the results of the statewide transfer study questions for Evergreen alumni survey participants. Participation in this section of the survey waned in comparison to earlier questions; the number of alumni who responded to each question is noted with the results. Has anyone else in your immediate family earned a Bachelor's degree? Of 260 alumni who responded to this question, 31.5% revealed that they were the first person in their immediate family to earn a Bachelor’s degree.
Degree Status in Immediate Family Frequency of response
(N=260 alumni who answered this question)
I am first in immediate family to earn Bachelor’s degree 31.5% (N=82) Mother earned Bachelor’s degree 39.2% (N=102) Father earned Bachelor’s degree 46.2% (N=120) One or more siblings earned Bachelor’s degree 39.2% (N=102) Another member of my family earn Bachelor’s degree 21.2% (N=55)
Family History of Earning Bachelor's Degree
(N=260)
Only mother earned degree
7.7%
Only father earned degree
14.6%
First-generation
degree completer
46.2%
Both parents earned degree
31.5%
What was the highest level of education you planned to attain when you first started college work?
2% 3%8%
50%
37%
0%
10%
20%
30%
40%
50%
60%
% o
f res
pond
ents
No degree Certification(2yrs or less)
Associate'sdegree
Bachelor'sdegree
Graduate orprofessional
degree
Highest Level of Education Planned to Attain When First Started College Work (N=257)
Further exploration of the responses to this question revealed that 46.2% of these alumni were first-generation Bachelor’s degree completers, (i.e. neither of their parents had earned a Bachelor’s degree).
50% of the alumni reported they planned to attain a Bachelor’s degree when they began their college studies.

RESULTS – alumni survey 2002.doc – Office of Institutional Research and Assessment – 06/25/03 19
College Credits Earned Prior to High School Graduation Alumni were asked to report whether they had entered college with credits that they earned prior to high school graduation. They were asked to identify the number of Advanced Placement, International Baccalaureate, Running Start, or College in the High School courses that they had completed.
Earned College Credit Prior to High School Graduation (N=239)
(includes Running Start, College in the High School, International Baccaulaureate, or Advanced Placement Programs)
no59%
yes41%
Type and Number of Courses Taken by Alumni Who Had Earned Pre-College College Credits (N=98)
55
22
12
9
5
6
61
5
5
20
10
20
30
40
50
60
70
80
AdvancedPlacement
College in the HighSchool
Running Start InternationalBaccalaureate
Num
ber o
f alu
mni
in e
ach
cate
gory
10+ courses4-9 courses1-3 courses
Type of College First Attended
Type of College First Attended(N=244)
Evergreen20%Washington
CTC31%
Out-of-state CTC19%
WA Private4-yr2%
WA Public4-year
7%
Out-of-state4-year21%
41% of the respondents had completed at least one college course prior to completing high school. (Note: 18% of the surveyed alumni did not respond to this question.)
For the 98 alumni who had participated in high school opportunities to earn college credit, Advanced Placement courses were the most popular type. A few alumni completed courses through more than one pre-college program.
Only 20% of this group of Evergreen alumni indicated that Evergreen was the institution at which they began their college studies. 31% first attended a Washington State community or technical college. 40% began their college work outside of Washington State.

RESULTS – alumni survey 2002.doc – Office of Institutional Research and Assessment – 06/25/03 20
Type of School from Which Student Transferred to Evergreen
Type of School from Which Student Transferred to
Evergreen (N=191)
Washington CTC45% WA Private
4-yr1%
WA Public4-year
9%
Out-of-state4-year28%
Out-of-state CTC17%
Did Alum Have Any Transfer Credits When Entered Evergreen?
(N=263)
no15%
(N=40)yes85%
(N=223)
Number of Institution Categories* at Which Alumni Completed Courses
(N=256)
0.4%1.6%
19.9%15.6%
62.5%
0%
10%
20%
30%
40%
50%
60%
70%
1 type 2 types 3 types 4 types 5 types
% o
f res
pond
ents
Institution Categories were WA CTC, WA Public 4-yr, WA Private 4-yr, Out-of-state CTC, and Out-of-state 4-yr.
Transfer Student Experiences The 223 alumni who reported having transfer credits when they entered Evergreen were asked a final series of questions about their transfer experience. 54% of the alumni with transfer credits at entrance to Evergreen had earned some or all of their transfer credits at a Washington State community or technical college. 38% had received an Associates degree before entering Evergreen.
Alumni who transferred into Evergreen identified the type of school from which they transferred. 45% of the transfer students came to Evergreen from Washington State community or technical colleges. Some alumni skipped this question, despite the fact that they indicated bringing transfer credits with them to Evergreen. A few of these alumni explained that they brought advanced standing transfer credits with them, but they had not actually transferred from one college to another. 85% of the respondents said they had transfer credits when they entered Evergreen. Another complexity of the transfer issue is that some alumni identified an institution from which they transferred to Evergreen, but then indicated that they did not have any transfer credits when they entered Evergreen. This situation can occur when the student failed to earn transferable credits at the previous institution to due the grade they earned or the type of course (e.g. developmental-level or vocational courses).
A variable was calculated to identify the number of institution categories at which each alum had completed courses. The results indicate that 84.4% of the alumni had completed college work at more than one type of institution. Among the 40 students (15.6%) who had completed coursework at only 1 type of institution, 9 had attended another Washington State public 4-year college in addition to Evergreen.

RESULTS – alumni survey 2002.doc – Office of Institutional Research and Assessment – 06/25/03 21
At the time they enrolled in their first institution, 17% of the transfer students were already planning to attend the specific college to which they ultimately transferred. Likewise 17% selected courses at their first school to specifically meet the transfer requirements of a particular school.
Did Alumni Take Courses They Thought Would Transfer That Did Not Transfer to the Subsequent Institution?
(N=220)
No76.8%
Yes14.5%
Don't know8.6%
Six alumni could not remember specifically which courses would not transfer. One other alum reported that some coursework “did not transfer only due to the age of the coursework.” The following specific types of courses were identified: • physical education (N=5) • math (N=4) • computer technology (N=2) • music (N=2) • nutrition (N=1) • psychology (N=1) • technical writing (N=1) • special education teaching (N=1) • counseling certificate (N=1) A complex series of questions asked alumni who had transferred to Evergreen to indicate which transfer-related resources they were aware of, had used, and found helpful at the institution from which they transferred. Alumni seemed to struggle a bit with the presentation of this series of items; of 223 alumni who had transfer credits when they entered Evergreen, only 199 attempted to respond to this series of questions.
Awareness and Use of Transfer Resources at Institution from Which Student Transferred
38%
19%
48%
33%
39%
49%
56%57%
9%10%
20%
6%6%
37%38%
31%
51%53%
0%
10%
20%
30%
40%
50%
60%
Printed info ontransferability ofcredits/degree
(N=192)
Info aboutprerequisites forcourses plannedto take (N=181)
Advisorknowledgeableabout transfer
process (N=199)
Other students(N=183)
Electronic infoavailable on the
web (N=194)
Transfer info aboutpublic/private 4-yr
schools in WA(N=193)
% o
f res
pond
ents
% Used
% Aware, butNot Used
% Not Aware
14.5% of the transfer students (N=32) took coursework that they expected would transfer, but later found out would not transfer.

RESULTS – alumni survey 2002.doc – Office of Institutional Research and Assessment – 06/25/03 22
Per alumni responses, transfer students were most likely to use printed information of the transferability of their credits and information about prerequisites for courses that they planned to take at a subsequent institution. They most often were aware of, but opted not to use an advisor knowledgeable about transfer processes and transfer information about public and private four-year schools in Washington. Transfer alumni were least aware of web-based transfer information and using other students as transfer resources.
Percentage of Students Who Reported That a Transfer Resource They Used Was Helpful
88%
81%
90%92%92%88%
50%
60%
70%
80%
90%
100%
Printed info ontransferability ofcredits/degree
(N=109)
Info aboutprerequisites forcourses plannedto take (N=101)
Advisorknowledgeableabout transferprocess (N=97)
Other students(N=71)
Electronic infoavailable on the
web (N=73)
Transfer infoabout
public/private 4-yrschools in WA
(N=63)
% o
f res
pond
ents
Transfer alumni wrote in the following suggestions about information that was lacking, but would have been helpful to them in their transfer process:
• transferability of credits, degree, or professional license (N=11) • academic planning / development of long-term goals (N=7) • financial aid / scholarships (N=4) • more information or any information (general) (N=4) • advisor support (N=3) • curricular offerings and options (N=3) • knowledge of local community (off campus housing, community resources, proximity to large city) (N=3) • admissions requirements (N=2) • awareness of campus resources (N=2) • campus visit / tour (N=2) • curricular policies (maximum credits per quarter, ability to enroll in classes before fully admitted) (N=2) • graduate school information (N=2) • explanation of why some credits did not transfer (N=1) • helpful staff (N=1) • math tutor (N=1) • Washington residency requirements (N=1) Transfer alumni reported greater satisfaction with the transfer assistance they received from Evergreen than from the institution from which they transferred. 80% of the alumni were moderately to very satisfied with Evergreen’s transfer assistance; 55% of them were moderately to very satisfied with the help they received from their prior institution. On a five-point rating scale, average satisfaction with Evergreen transfer resources was 4.23; average satisfaction with the prior institution’s transfer assistance was 3.46. Overall, how satisfied were you with the transfer assistance you received from…
1= Not at All
2= A little
3= Somewhat
4= Moderately
5= Very
the institution from which you transferred? (N=193) 17.1% 9.3% 18.7% 20.2% 34.7%
Evergreen? (N=193) 4.1% 5.2% 10.9% 23.3% 56.5%
Those who used transfer resources felt that knowledgeable advisors, information about prerequisites, and other students were the most helpful in their transfer process.