Embed Size (px)
Citation preview

“Studies on Radial Tipped Centrifugal Fan” 232
CHAPTER – 6
RESULTS AND DISCUSSION
6.1 Introduction
Extensive experimental investigations are made to get optimum design
methodology for radial tipped centrifugal fan. The experiments are made in five
phases as explained in chapter 5. Performance of each phase is critically evaluated.
Salient features of results obtained during this course of work are discussed herein.
6.2 Phase-I: Experimental Optimization of Finite Number of Blades under Varying Speed Conditions
The stage 1 of phase 1 is designed to study the influence of suction pressure
on performance of centrifugal fan. The design point parameters were 1150 Pa static
stage pressure rise at 0.417 m3/s volume flow rate and speed of impeller 2800 rpm
[30]. The number of blades is varied in four steps of 8, 12, 16 and 24. The suction
pressure is varied with the help of orifice plates of different diameter. Suction
pressure variation is carried out by using six orifice plates of diameter 80, 90, 110,
120, 130,150 mm and full closing of suction duct to get no flow conditions. Figure
5.14 of Chapter 5 shows experimental setup developed for phase 1 experiments and
measurements.
Here, suction pressure variation lies in the range of 167 N/m2 to 1364 N/m2.
Observation Tables are given in Annexure C for this phase of experiments. Figure 6.1
to Figure 6.4 shows graphical presentation of the distinctive results obtained under
first stage of experiments for 8, 12, 16 24 numbers of blades, respectively.

Chapter – 6: Results and Discussion
“Studies on Radial Tipped Centrifugal Fan” 233
(a) Suction Pressure Vs. Discharge (b) Static Stage Pressure Rise Vs.
Discharge
(c) Shaft Power Vs. Discharge (d) Efficiencies Vs. Discharge
Figure 6.1 Phase I, Stage 1 Performance Curves for 8 Number of Blades
0
200
400
600
800
1000
1200
1400
0.000 0.200 0.400
Suction Pressure, N/m
2
Discharge, m3/s
0
200
400
600
800
1000
1200
1400
0.000 0.200 0.400Stage Pressure Rise, N/m
2
Discharge, m3/s
0
100
200
300
400
500
600
700
0.000 0.200 0.400
Shaft P
ower, W
Discharge, m3/s
0
10
20
30
40
50
60
70
80
0.000 0.200 0.400
Efficiency,
%
Discharge, m3/s
Static
Stagnation

Chapter – 6: Results and Discussion
“Studies on Radial Tipped Centrifugal Fan” 234
(a) Suction Pressure Vs. Discharge (b) Static Stage Pressure Rise Vs.
Discharge
(c) Shaft Power Vs. Discharge (d) Efficiencies Vs. Discharge
Figure 6.2 Phase I, Stage 1 Performance Curves for 12 Number of Blades
0
200
400
600
800
1000
1200
1400
0.000 0.200 0.400
Suction Pressure, N/m
2
Discharge, m3/s
0
200
400
600
800
1000
1200
1400
0.000 0.200 0.400Stage Pressure Rise, N/m
2
Discharge, m3/s
0
100
200
300
400
500
600
0.000 0.200 0.400
Shaft P
ower, W
Discharge, m3/s
0102030405060708090
0.000 0.100 0.200 0.300 0.400
Efficiency, %
Discharge, m3/s
Static
Stagnation

Chapter – 6: Results and Discussion
“Studies on Radial Tipped Centrifugal Fan” 235
(a) Suction Pressure Vs. Discharge (b) Static Stage Pressure Rise Vs.
Discharge
(c) Shaft Power Vs. Discharge (d) Efficiencies Vs. Discharge
Figure 6.3 Phase I, Stage 1 Performance Curves for 16 Number of Blades
0
200
400
600
800
1000
1200
1400
1600
0.000 0.200 0.400
Suction Pressure, N/m
2
Discharge, m3/s
0
200
400
600
800
1000
1200
1400
0.000 0.200 0.400Stage Pressure Rise, N/m
2
Discharge, m3/s
0
100
200
300
400
500
600
700
0.000 0.200 0.400
Shaft P
ower, W
Discharge, m3/s
0102030405060708090
100
0.000 0.100 0.200 0.300 0.400
Efficiency, %
Discharge, m3/s
Static
Stagnation
Chapter – 6: Results and Discussion
“Studies on Radial Tipped Centrifugal Fan” 236
(a) Suction Pressure Vs. Discharge (b) Static Stage Pressure Rise Vs.
Discharge
(c) Shaft Power Vs. Discharge (d) Efficiencies Vs. Discharge
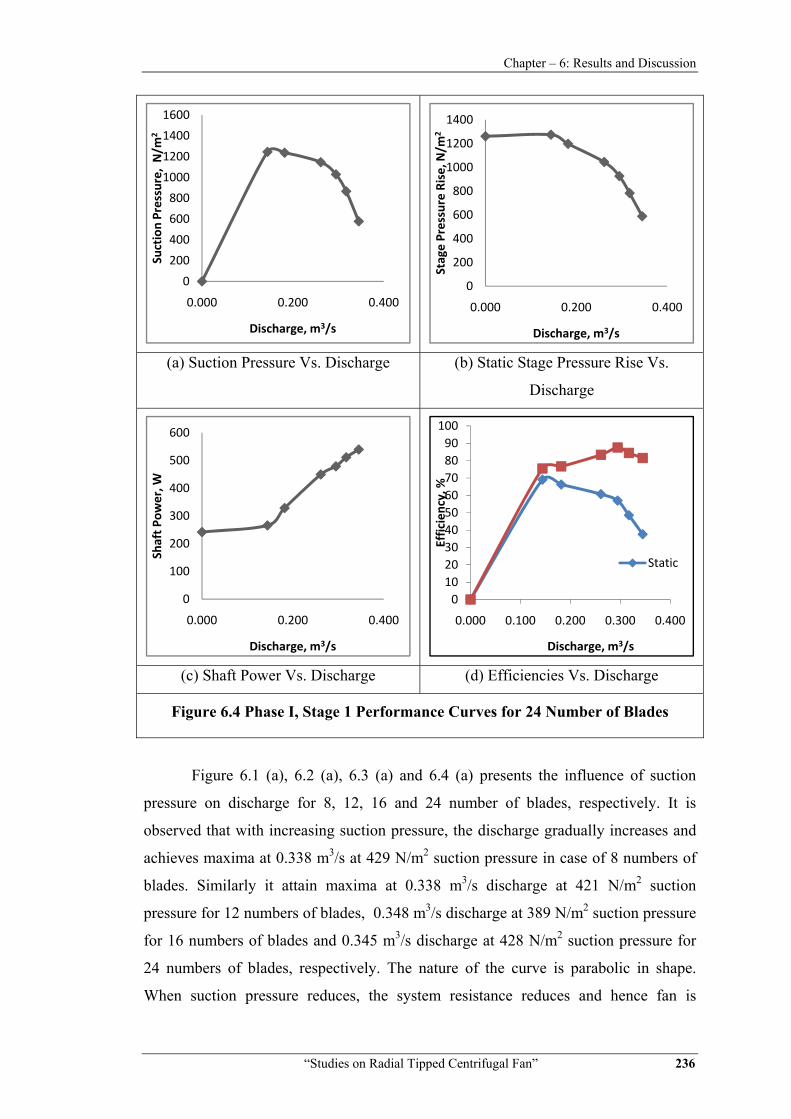
Figure 6.4 Phase I, Stage 1 Performance Curves for 24 Number of Blades
Figure 6.1 (a), 6.2 (a), 6.3 (a) and 6.4 (a) presents the influence of suction
pressure on discharge for 8, 12, 16 and 24 number of blades, respectively. It is
observed that with increasing suction pressure, the discharge gradually increases and
achieves maxima at 0.338 m3/s at 429 N/m2 suction pressure in case of 8 numbers of
blades. Similarly it attain maxima at 0.338 m3/s discharge at 421 N/m2 suction
pressure for 12 numbers of blades, 0.348 m3/s discharge at 389 N/m2 suction pressure
for 16 numbers of blades and 0.345 m3/s discharge at 428 N/m2 suction pressure for
24 numbers of blades, respectively. The nature of the curve is parabolic in shape.
When suction pressure reduces, the system resistance reduces and hence fan is
0
200
400
600
800
1000
1200
1400
1600
0.000 0.200 0.400
Suction Pressure, N/m
2
Discharge, m3/s
0
200
400
600
800
1000
1200
1400
0.000 0.200 0.400
Stage Pressure Rise, N/m
2
Discharge, m3/s
0
100
200
300
400
500
600
0.000 0.200 0.400
Shaft P
ower, W
Discharge, m3/s
0102030405060708090
100
0.000 0.100 0.200 0.300 0.400
Efficiency, %
Discharge, m3/s
Static

Chapter – 6: Results and Discussion
“Studies on Radial Tipped Centrifugal Fan” 237
capable to handle higher discharges. When suction resistance increases, the losses
increases and the discharge begin to drop with further increase in suction pressure.
The nature of the graph follows the well established performance characteristics of
centrifugal fan [9, 26 and 28].
Figure 6.1 (b), 6.2 (b), 6.3 (b) and 6.4 (b) represents the stage static pressure
rise as a function of discharge for 8, 12, 16 and 24 number of blades, respectively. It
seems to be stabilized at 1289 N/m2, in the discharge range of 0.179 to 0.255 m3/s for
8 numbers of blades, 1280 N/m2 at 0.142 m3/s discharge for 12 numbers of blades,
1313 N/m2 at 0.145 m3/s discharge for 16 numbers of blades and 1274 N/m2 at 0.144
m3/s discharge for 24 numbers of blades, respectively. Further increase in discharge
leads to decrease in static fan pressure rise.
Figure 6.1 (c) shows the performance of the fan in terms of shaft power
consumed with respect to change in discharge for 8 numbers of blades. Initially flat
curve is observed for shaft power up to discharge level of 0.255 m3/s. There after
shaft power increases proportionate to increase in discharge. While Figure 6.2 (c) for
12 numbers of blades shows that initially there is no discharge but 429 watts shaft
power is consumed due to system resistance. Thereafter shaft power reduces even
though with rise in discharge. This happens due to dynamic action of rotor. Impeller
disc friction losses and frictional resistance of shaft bearing may collectively be
responsible for such behaviour. There after shaft power rises with respect to increase
in discharge. In case of Figure 6.3 (c) for 16 numbers of blades, it is observed that
initially shaft power is nearly constant up to discharge level of 0.145 m3/s. Initial drop
in shaft power is not observed for 16 numbers of blades as seen in the case of 8 and
12 number of blades. While Figure 6.4 (c) for 24 numbers of blades shows that
initially flat curve is observed for shaft power up to discharge level of 0.144 m3/s.
Here also initial drop in shaft power is not observed for 24 numbers similar to 16
numbers of blades. This behaviour attributes that as number of blades increases,
impeller becomes bulky and higher torque is required to get momentum. Hence
reduction of disc friction loss will not contribute much to get shaft power reduction,
as seen in earlier cases.
Figure 6.1 (d), 6.2 (d), 6.3 (d) and 6.4 (d) depicts the variation of static and
stagnation stage efficiencies with respect to discharge for 8, 12, 16 and 24 numbers of
blades, respectively.

Chapter – 6: Results and Discussion
“Studies on Radial Tipped Centrifugal Fan” 238
For 8 blades, the static and stagnation stage efficiencies evidently increases
quite sharply with increase in discharge up to 0.255 m3/s, and there after the static and
stagnation stage efficiency improves gradually to attain maxima of 55% and 76% at
0.255 m3/s and 0.315 m3/s discharge, respectively.
While for 12 numbers of blades, the static and stagnation stage efficiencies
increases with increase in discharge up to 0.180 m3/s, and there after the stagnation
stage efficiency improves gradually up to 80% at 0.289 m3/s discharge. While static
efficiency attains maxima of 56% at 0.180 m3/s discharge.
In case of 16 numbers of blades, static and stagnation stage efficiency
improves gradually to attain maxima of 61% and 82% at 0.257 m3/s and 0.306 m3/s
discharge, respectively.
Similarly, for 24 numbers of blades, the static and stagnation stage efficiencies
increase with increase in discharge up to 0.144 m3/s. They attain maxima of 69% and
88% at 0.144 and 0.295 m3/s discharge, respectively.
The static and stagnation stage efficiency behaviour slightly differs due to
differences in velocity head at different centrifugal fan flow sections. These results
are also quite in tune with published performance curves of centrifugal fan [6, 13, 28]
It is worth noting that the optimum performance of the fan is achieved at a
static pressure rise of 1060 N/m2 at discharge of 0.301 m3/s with 88% stagnation
efficiency. This means that this performance is quite away from the design point
performance which was targeted to be 0.417 m3/s discharge at 1150 N/m2 static stage
pressure rise. This underlines the need for critically evaluating the design guidelines
for suction sides.
Table 6.1 summarizes the optimum performance parameters obtained during
phase 1 under constant speed of rotation as 2800 rpm.
Table 6.1 Optimum performance parameters as a Function of Number of Blades
No. of Blades
Pressure Developed
Pressure Developed ηStatic ηStagnation Max.
Discharge
Δp Static N/m2
Δ p Stagnation N/m2 Max. Max. m3/s
8 1290 1473 55.1 75.7 0.338 12 1280 1408 55.7 79.8 0.335 16 1313 1594 60.5 88.2 0.347 24 1274 1424 69.1 87.6 0.345

Chapter – 6: Results and Discussion
“Studies on Radial Tipped Centrifugal Fan” 239
The optimum number of blades of a radial impeller can only be truly
ascertained by experiments [9, 14, 20]. Study of these tabulated results clearly
indicates that the best performance is achieved with 16 numbers of blades. This may
be attributed to the fact that with 16 numbers of blades, the flow is probably guided
without separation and at lower frictional losses with proper incidence at impeller
inlet. Separation losses remain minima due to optimum blade guidance and least
deviation in direction and magnitude of the flow velocity [20, 112].
Experimental results of stage 1 have also revealed that design point stage
pressure rise of the order of 1150 N/m2 is obtained by 110 mm diameter orifice plate
suction resistance. To ascertain the optimisation process, the fan performance have
been evaluated under off design conditions by keeping the orifice diameter constant at
110 mm and varying the speed of fan through variac, in second stage of experiments.
S. Sundaram [44] observed that the optimization of number of blades of centrifugal
fan impeller involves a maximization problem of multivariable function with fluid
dynamic constraints. Experimental data based on a simple variation in blade number
alone, keeping other parameters constant, will not yield optimum blade numbers for a
global maximum hydraulic efficiency. Hence, this stage of experiments were specially
planned to optimize finite number of blades under varying speed conditions with the
number of blades varying in 4 steps as 8, 12, 16 and 24.
Figure 6.5 to Figure 6.8 shows graphical presentation of the distinctive results
obtained under second stage of experiments for 8, 12, 16 24 numbers of blades,
respectively.

Chapter – 6: Results and Discussion
“Studies on Radial Tipped Centrifugal Fan” 240
(a) Suction Pressure Vs. Speed (b) Static Stage Pressure Rise Vs. Speed
(c) Shaft Power Vs. Speed (d) Efficiencies Vs. Speed
(e) Discharge Vs. Speed
Figure 6.5 Phase I, Stage 2 Performance Curves for 8 Number of Blades
0
200
400
600
800
1000
1200
0 1000 2000 3000
Suction Pressure, N/m
2
Speed, rpm
0
200
400
600
800
1000
1200
0 1000 2000 3000
Stage Pressure Rise, N/m
2
Speed, rpm
0
100
200
300
400
500
600
0 1000 2000 3000
Shaft P
ower, W
Speed, rpm
0
10
20
30
40
50
60
70
80
0 1000 2000 3000
Efficiency, %
Speed, rpm
static
Stagnation
0.000
0.050
0.100
0.150
0.200
0.250
0.300
0 1000 2000 3000
Discharge, m
3 /s
Speed, rpm

Chapter – 6: Results and Discussion
“Studies on Radial Tipped Centrifugal Fan” 241
(a) Suction Pressure Vs. Speed (b) Static Stage Pressure Rise Vs. Speed
(c) Shaft Power Vs. Speed (d) Efficiencies Vs. Speed
(e) Discharge Vs. Speed
Figure 6.6 Phase I, Stage 2 Performance Curves for 12 Number of Blades
0
200
400
600
800
1000
1200
0 1000 2000 3000
Suction Pressure, N/m
2
Speed, rpm
0
200
400
600
800
1000
1200
0 1000 2000 3000
Stage Pressure Rise, N/m
2
Speed, rpm
050
100150200250300350400450500
0 1000 2000 3000
Shaft P
ower, W
Speed, rpm
0
10
20
30
40
50
60
70
80
0 1000 2000 3000
Efficiency, %
Speed, rpm
static
stagnation
0.000
0.050
0.100
0.150
0.200
0.250
0.300
0 1000 2000 3000
Discharge, m
3 /s
Speed, rpm
Chapter – 6: Results and Discussion
“Studies on Radial Tipped Centrifugal Fan” 242
(a) Suction Pressure Vs. Speed (b) Static Stage Pressure Rise Vs. Speed
(c) Shaft Power Vs. Speed (d) Efficiencies Vs. Speed
(e) Discharge Vs. Speed
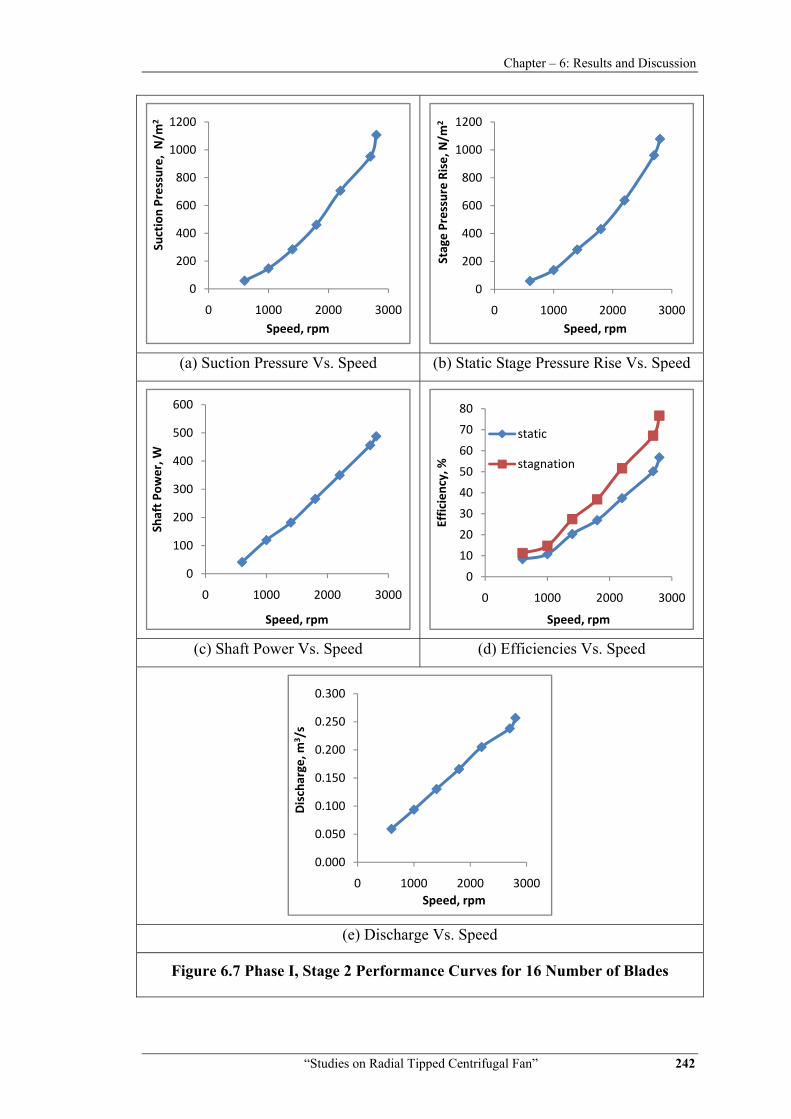
Figure 6.7 Phase I, Stage 2 Performance Curves for 16 Number of Blades
0
200
400
600
800
1000
1200
0 1000 2000 3000
Suction Pressure, N/m
2
Speed, rpm
0
200
400
600
800
1000
1200
0 1000 2000 3000
Stage Pressure Rise, N/m
2
Speed, rpm
0
100
200
300
400
500
600
0 1000 2000 3000
Shaft P
ower, W
Speed, rpm
0
10
20
30
40
50
60
70
80
0 1000 2000 3000
Efficiency, %
Speed, rpm
static
stagnation
0.000
0.050
0.100
0.150
0.200
0.250
0.300
0 1000 2000 3000
Discharge, m
3 /s
Speed, rpm

Chapter – 6: Results and Discussion
“Studies on Radial Tipped Centrifugal Fan” 243
(a) Suction Pressure Vs. Speed (b) Static Stage Pressure Rise Vs. Speed
(c) Shaft Power Vs. Speed (d) Efficiencies Vs. Speed
(e) Discharge Vs. Speed
Figure 6.8 Phase I, Stage 2 Performance Curves for 24 Number of Blades
0
200
400
600
800
1000
1200
1400
0 1000 2000 3000
Suction Pressure, N/m
2
Speed, rpm
0
200
400
600
800
1000
1200
0 1000 2000 3000
Stage Pressure Rise, N/m
2
Speed, rpm
050
100150200250300350400450500
0 1000 2000 3000
Shaft p
ower, W
Speed, rpm
0
10
20
30
40
50
60
70
80
0 1000 2000 3000
Efficiency, %
Speed, rpm
static
stagnation
0.000
0.050
0.100
0.150
0.200
0.250
0.300
0 1000 2000 3000
Discharge, m
3 /s
Speed, rpm

Chapter – 6: Results and Discussion
“Studies on Radial Tipped Centrifugal Fan” 244
The study of these results clearly indicates an increase in all the performance
parameters with respect to speed which is basically attributed to better whirling effect
available with increase in speed [13, 26].
The optimum values of the performance parameters of Phase I stage 2
experiments under varying speed conditions for each case of number of blades are
summarized in Table 6.2.
Table 6.2 Optimum Values of Performance Parameters at Varying Speed
Conditions
Number of
Blades Speed
Pressure Developed
Pressure Developed ηStatic ηStagnation
Max. Discharge
rpm Δ p static
N/m2 Δ p stagnation
N/m2 Max. Max. m3/s
8 2800 1047 1420 55.1 74.8 0.255 12 2800 986 1367 53.8 74.6 0.258 16 2800 1079 1456 56.8 76.7 0.257 24 2800 1044 1435 60.7 83.4 0.261
It is observed that the best performance in terms of static and stagnation stage
pressure developed is achieved with 16 numbers of blades, though the better
efficiency is achieved for 24 numbers of blades.
The results of both the stages of the phase I experiments, thus confirms that
the best performance is achieved with 16 number of blades. However it is worth
mentioning that these values are obtained at restricted orifice size of 110 mm and
design point performance as static pressure rise of 1150 N/m2, and Discharge as 0.417
m3/s, is not achieved in any stage even with this optimum number of blades as 16.
Dimensionless coefficients are used for design, comparison, and critical
assessment of all geometrically similar fans. Pressure coefficient, volume coefficient,
power coefficient and efficiency are important dimensionless coefficients.
Figure 6.9 to 6.12 presents the non-dimensional performance characteristics of
fan for 8, 12, 16 and 24 numbers of blades at all variable speeds. These Figures
represent the variation of stage efficiency, head coefficient and power coefficient as a
function of discharge coefficient.

Chapter – 6: Results and Discussion
“Studies on Radial Tipped Centrifugal Fan” 245
(a) Head Coefficient Vs. Discharge Coefficient
(b) Power Coefficient Vs. Discharge Coefficient
(c) Efficiency Vs. Discharge Coefficient
Figure 6.9 Phase I, Dimensionless Performance Curves for 8 Number of Blades
00.0010.0020.0030.0040.0050.0060.0070.0080.009
0.000 0.100 0.200 0.300
Head Co
efficient, gh/N2 D
2
Discharge Coefficient, Q/ND3
0
0.5
1
1.5
2
2.5
0.000 0.050 0.100 0.150 0.200 0.250 0.300
Power Coe
fficient, P/ρ
N3 D
5
Discharge Coefficient, Q/ND3
0
10
20
30
40
50
60
70
80
0.000 0.050 0.100 0.150 0.200 0.250 0.300
Efficiency, %
Discharge Coefficient, Q/ND3
static
stagnation

Chapter – 6: Results and Discussion
“Studies on Radial Tipped Centrifugal Fan” 246
(a) Head Coefficient Vs. Discharge Coefficient
(b) Power Coefficient Vs. Discharge Coefficient
(c) Efficiency Vs. Discharge Coefficient
Figure 6.10 Phase I, Dimensionless Performance Curves for 12 Number of
Blades
0.0062
0.0064
0.0066
0.0068
0.007
0.0072
0.0074
0.0076
0.000 0.050 0.100 0.150 0.200 0.250 0.300
Head Co
efficient, gh/N2 D
2
Discharge Coefficient, Q/ND3
0
0.5
1
1.5
2
2.5
0.000 0.100 0.200 0.300
Power Coe
fficient, P/ρ
N3 D
5
Discharge Coefficient, Q/ND3
0102030405060708090
0.000 0.050 0.100 0.150 0.200 0.250 0.300
Efficiency, %
Discharge Coefficient, Q/ND3
static
stagnation

Chapter – 6: Results and Discussion
“Studies on Radial Tipped Centrifugal Fan” 247
(a) Head Coefficient Vs. Discharge Coefficient
(b) Power Coefficient Vs. Discharge Coefficient
(c) Efficiency Vs. Discharge Coefficient
Figure 6.11 Phase I, Dimensionless Performance Curves for 16 Number of
Blades
00.0010.0020.0030.0040.0050.0060.0070.0080.009
0.000 0.100 0.200 0.300 0.400
Head Co
efficient, gh/N2 D
2
Discharge Coefficient, Q/ND3
0
0.5
1
1.5
2
2.5
0.000 0.100 0.200 0.300 0.400
Power Coe
fficient, P/ρ
N3 D
5
Discharge Coefficient, Q/ND3
0
20
40
60
80
100
0.000 0.050 0.100 0.150 0.200 0.250 0.300 0.350
Efficiency, %
Discharge Coefficient, Q/ND3
static
stagnation

Chapter – 6: Results and Discussion
“Studies on Radial Tipped Centrifugal Fan” 248
(a) Head Coefficient Vs. Discharge Coefficient
(b) Power Coefficient Vs. Discharge Coefficient
(c) Efficiency Vs. Discharge Coefficient
Figure 6.12 Phase I, Dimensionless Performance Curves for 24 Number of Blades
0.0066
0.0068
0.007
0.0072
0.0074
0.0076
0.0078
0.000 0.100 0.200 0.300 0.400
Head Co
efficient, gh/N2 D
2
Discharge Coefficient, Q/ND3
0
0.5
1
1.5
2
2.5
0.000 0.100 0.200 0.300 0.400
Power Coe
fficient, P/ρ
N3 D
5
Discharge Coefficient, Q/ND3
0.010.020.030.040.050.060.070.080.090.0100.0
0.000 0.100 0.200 0.300 0.400
Efficiency, %
Discharge Coefficient, Q/ND3
static
stagnation
Chapter – 6: Results and Discussion
“Studies on Radial Tipped Centrifugal Fan” 249
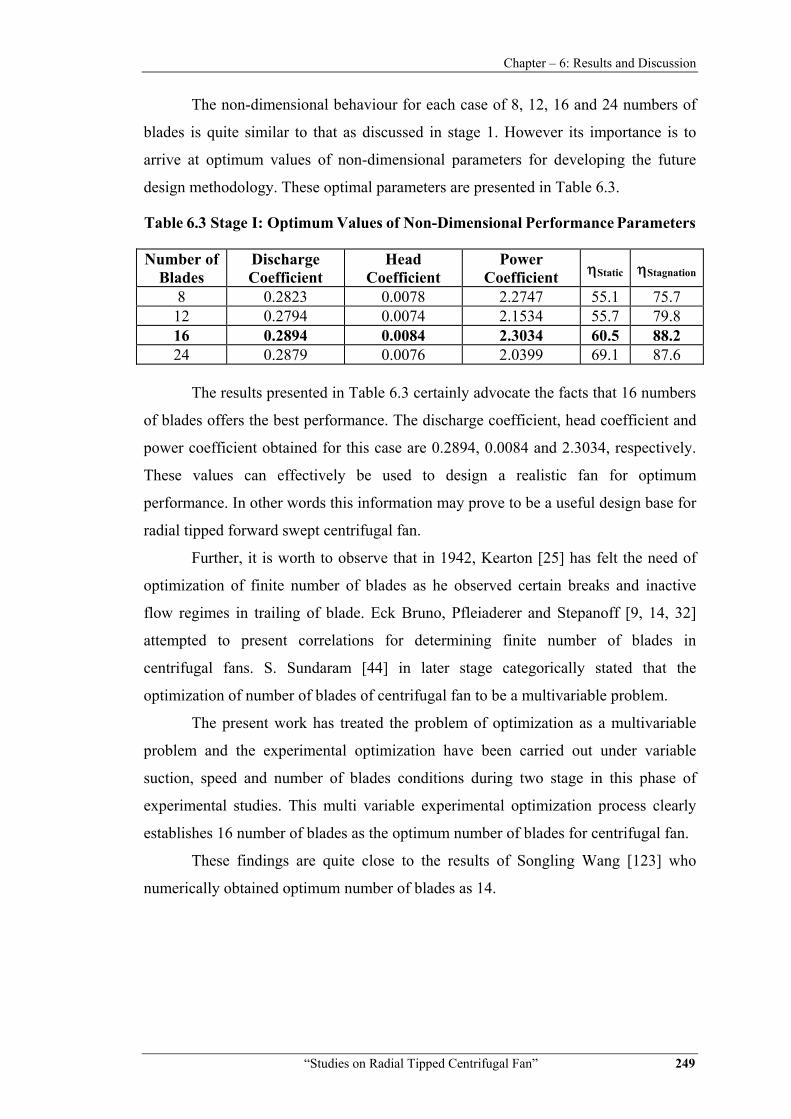
The non-dimensional behaviour for each case of 8, 12, 16 and 24 numbers of
blades is quite similar to that as discussed in stage 1. However its importance is to
arrive at optimum values of non-dimensional parameters for developing the future
design methodology. These optimal parameters are presented in Table 6.3.
Table 6.3 Stage I: Optimum Values of Non-Dimensional Performance Parameters
Number of Blades
Discharge Coefficient
Head Coefficient
Power Coefficient ηStatic ηStagnation
8 0.2823 0.0078 2.2747 55.1 75.7 12 0.2794 0.0074 2.1534 55.7 79.8 16 0.2894 0.0084 2.3034 60.5 88.2 24 0.2879 0.0076 2.0399 69.1 87.6
The results presented in Table 6.3 certainly advocate the facts that 16 numbers
of blades offers the best performance. The discharge coefficient, head coefficient and
power coefficient obtained for this case are 0.2894, 0.0084 and 2.3034, respectively.
These values can effectively be used to design a realistic fan for optimum
performance. In other words this information may prove to be a useful design base for
radial tipped forward swept centrifugal fan.
Further, it is worth to observe that in 1942, Kearton [25] has felt the need of
optimization of finite number of blades as he observed certain breaks and inactive
flow regimes in trailing of blade. Eck Bruno, Pfleiaderer and Stepanoff [9, 14, 32]
attempted to present correlations for determining finite number of blades in
centrifugal fans. S. Sundaram [44] in later stage categorically stated that the
optimization of number of blades of centrifugal fan to be a multivariable problem.
The present work has treated the problem of optimization as a multivariable
problem and the experimental optimization have been carried out under variable
suction, speed and number of blades conditions during two stage in this phase of
experimental studies. This multi variable experimental optimization process clearly
establishes 16 number of blades as the optimum number of blades for centrifugal fan.
These findings are quite close to the results of Songling Wang [123] who
numerically obtained optimum number of blades as 14.

Chapter – 6: Results and Discussion
“Studies on Radial Tipped Centrifugal Fan” 250
6.3 Phase-II: Experimental Investigations on Slip Factor at Varying Number of Blades and Speed Conditions
Slip loss is defined as the ratio of actual and ideal values of the whirl
components at exit of impeller. It has significant effect on fan performance. It is
essential to estimate the slip factor correctly for proper design of centrifugal fans.
Stodola [31] had developed first useful method for slip factor approximation.
He correlated slip factor and finite number of blades. Stodola claimed that average
direction of discharge varies from the blade angle β2 due to number of blades and
relative circulation in vane to vane plane. Several correlations thereafter have been
proposed to estimate slip factor [9, 14, 75, 76, 78, 79, 83, 87]. The objective of
present study is to make comparative assessment of theoretically correlated and
experimentally evaluated slip factor at varied number of blades.
Theoretical velocity diagram for radial tipped blade exit is prepared with the
help of theoretical values of tangential velocity component U2, radial velocity
component Vr2 and flow angle θ2. Actual velocity diagram is prepared with the help of
measured components of absolute velocity V2’ at measured flow angle θ2
’ at impeller
exit. Theoretical component of tangential velocity U2 is also used to construct actual
velocity diagram. Actual component of radial velocity Vr2’ and actual blade angle β2
’
are received from actual velocity diagram. Construction of actual velocity diagram at
all test locations A to H for 16 numbers of blades is shown in Figure 6.13.
Figure 6.13 Theoretical and Actual Velocity Triangles at all Test Locations

Chapter – 6: Results and Discussion
“Studies on Radial Tipped Centrifugal Fan” 251
Here the experimental value of the slip factor for a radial tipped centrifugal
fan is determined at various selected test locations around the circumference of the
impeller covering the entire width of impeller at varying number of blades.
Observation Tables for phase II experiments, showing measurements of slip
factors at various volute locations for 8, 12. 16 and 24 numbers of blades are given in
Annexure C.
The sub test locations slip factor values are averaged to get respective test
location slip factor value. Test location plan is given in Table 5.2 of chapter 5. These
slip factors are calculated for 8, 12, 16 and 24 numbers of blades.
Table 6.4 shows a typical variation of slip factor across the blade width at sub
location D for 16 numbers of blades along the blade width. The angle for actual
absolute velocity [V2'] with respect to the tangential velocity [U2] is θ2'= 370.
Table 6.4 Probe Readings at Location D for 16 Numbers of Blades
Location Hstag Hstat. Hdynamic Pd V2' Slip factor
mm of water N/m2 m/sec μ D1 20.45 1.81 18.64 182.65 16.47 0.693 D2 23.29 1.81 21.48 210.47 17.68 0.744 D3 24.85 1.55 23.3 228.31 18.41 0.775 D4 25.62 1.55 24.07 235.85 18.71 0.788 D5 24.59 1.55 23.04 225.76 18.31 0.771 D6 22.26 1.55 20.71 202.93 17.36 0.731 D7 17.6 2.07 15.53 152.17 15.03 0.633
Average 0.734
Study of Table 6.4 reveals that slip factor is not constant across the blade
width. Its variations are parabolic in nature. The boundary layer effect near shroud is
observed to be responsible for such behavior [50, 66].
It is also seen from experimental results that slip factor profile over blade
width at impeller exit shows negative parabolic profile. Hence design of exit blade
section must be parabolic to improve blade tip slip factor.
The average Experimental slip factor is 0.734 at location D for entire blade
width. Similarly, slip factor is measured at all volute sub locations for 8, 12, 16 and 24
number of blades.
Figure 6.14 to 6.17 graphically represents comparative study of experimental
and empirical slip factor values for each case of number of blades. Figure 6.18 shows

Chapter – 6: Results and Discussion
“Studies on Radial Tipped Centrifugal Fan” 252
comparative analysis of empirical and experimental slip factors with respect to
number of blades.
Figure 6.14 Empirical and Experimental Slip Factors for 8 Blades
Figure 6.15 Empirical and Experimental Slip Factors for 12 Blades
0.500
0.550
0.600
0.650
0.700
0.750
0.800
0.850
0.900
0.950
0 2 4 6 8 10
Slip Factor
Test Locations
Stanitz Balje Stodola Avg. Experimental
0.550
0.600
0.650
0.700
0.750
0.800
0.850
0.900
0 2 4 6 8 10
Slip Factor
Test Locations
Stanitz Balje Stodola Avg. Experimental

Chapter – 6: Results and Discussion
“Studies on Radial Tipped Centrifugal Fan” 253
Figure 6.16 Empirical and Experimental Slip Factors for 16 Blades
Figure 6.17 Empirical and Experimental Slip Factors for 24 Blades
0.550
0.600
0.650
0.700
0.750
0.800
0.850
0.900
0 2 4 6 8 10
Slip Factor
Test Locations
Stanitz Balje Stodola Avg. Experimental
0.550
0.600
0.650
0.700
0.750
0.800
0.850
0.900
0.950
0 2 4 6 8 10
Slip Factor
Test Locations
Stanitz Balje Stodola Avg. Experimental

Chapter – 6: Results and Discussion
“Studies on Radial Tipped Centrifugal Fan” 254
Figure 6.18 Empirical and Experimental Slip Factors Vs Number of Blades
Further, results obtained under phase II experiments as depicted in Figure 6.14
to 6.18 have revealed that as the number of blade increases, the slip factor increases.
At less number of blades, the turbulence within blade passage increases due to lack of
flow guidance. When number of blades increases, the deviation of the exit absolute
velocity vector is minimized and hence it can be efficiently sensed by the designed
probe.
It is observed that experimental value of slip factor is found to be 3 to 12%
less with respect to various empirical co-relations. This difference is maintained for
almost all set of number of blades. Exceptions are seen at very low number of blades
due to sudden increase of turbulence between two blades. This behavior leads to
conclude that impeller designed for a large specific speed has a large inlet to exit
radius ratio and the curvature of the shroud is large to turn the flow from axial to
radial. Therefore unless the impeller is carefully designed, the flow in meridional
plane separates from the shroud. This supports work of Yedidiah Sh. [75] of
presenting a new model of slip factor that resolves basic discrepancies observed
between old theories.
It is also observed that slip factor is varying with number of blades. Hence it
can be said that slip factor is not only dependent of flow. Similar is supported by
0.550
0.600
0.650
0.700
0.750
0.800
0.850
0.900
0.950
0 5 10 15 20 25 30
Slip Factor
No. of Blades
Stanitz Balje Stodola Experimental

Chapter – 6: Results and Discussion
“Studies on Radial Tipped Centrifugal Fan” 255
research work of R. Ajithkumar [22] who has concluded that slip factor is a function
of number of vanes, diameter ratio, and outlet blade angle and flow conditions after
impeller.
Lal and Vasandani [78] has studied slip factor effect on designing of impeller.
They concluded that slip factor reduces due to non-uniform velocity distribution at
impeller exit. This is also confirmed from Table 6.5 and Figure 6.13.
Table 6.5 Comparison of Experimental and Empirical Value of Slip Factors
Number of Blades
Experimental Slip Factor
Empirical Slip Factor by
Balje
Empirical Slip Factor by Stodola
Empirical Slip Factor by
Stanitz
8 0.773 0.639 0.608 0.753 12 0.731 0.726 0.738 0.835 16 0.771 0.78 0.804 0.876 24 0.785 0.841 0.869 0.918
Thus the present work has clearly highlighted the variation of slip factor
across the blade width as well as along the flow path of volute and the lacuna of
existing slip factor correlation to correctly predict the slip factor.
6.4 Phase-III: Assessment of Explicit Design Methodologies
This phase of experimental work is planned for experimental assessment of
fan performance which are designed and fabricated as per explicit design
methodologies. Forward curved radial tipped impeller centrifugal fans are fabricated
as per design methodology traced out by using fundamental principles of fluid flow
and other design methodologies suggested by Church A. H. and Osborne W. C.
The observation Tables which include fan inlet and outlet pressure, volute
casing pressure distribution at 90˚, 120˚, 180˚, 240˚ and 300˚, input power and average
air velocity, at different speed and damping conditions are recorded and are available
in Annexure C. Actual stage pressure head developed across the fan, average air
discharge, shaft power, static airpower developed, static and stagnation efficiencies
are calculated for each set of observation. Design point is also highlighted in
observation Tables.
The speed of impeller rotation was varied and kept constant at 500, 1000,
1500, 2000, 2500 and 2800 rpm as maximum as well as design speed of rotation. Inlet
volume flow is varied by damping discharge duct in terms of reduction of volute

Chapter – 6: Results and Discussion
“Studies on Radial Tipped Centrifugal Fan” 256
discharge cross-section area. This damping is designated as 0% (means full opening
of discharge duct), 25%, 50%, 75% and complete blockage, i.e. 100% damping.
Performance of each design methodology is critically evaluated and discussed
in subsequent sections.
6.4.1 Fundamental design
Figure 6.19 to 6.23 shows the fundamental design performance obtained in
terms of discharge v/s stage pressure rise, air power, shaft power and static efficiency
and volute casing pressure distribution.
Figure 6.19 Static Stage Pressure Rise Vs Discharge (Fundamental Design)
0
200
400
600
800
1000
1200
0.000 0.100 0.200 0.300 0.400 0.500 0.600
Stag
e Pr
essu
re R
ise,
Pa
Discharge, m3/s
500 rpm1000 rpm1500 rpm2000 rpm2500 rpm2800 rpmDesign PointLinear (Design Point)

Chapter – 6: Results and Discussion
“Studies on Radial Tipped Centrifugal Fan” 257
Figure 6.20 Air Power Vs Discharge (Fundamental Design)
Figure 6.21 Shaft Power Vs Discharge (Fundamental Design)
0
100
200
300
400
500
600
0.000 0.100 0.200 0.300 0.400 0.500 0.600
Air
Pow
er, W
Discharge, m3/s
500 rpm1000 rpm1500 rpm2000 rpm2500 rpm2800 rpmDesign Point
0
100
200
300
400
500
600
0.000 0.100 0.200 0.300 0.400 0.500 0.600
Shaf
t Po
wer
, w
Discharge, m3/s
500 rpm1000 rpm1500 rpm2000 rpm2500 rpm2800 rpm
Chapter – 6: Results and Discussion
“Studies on Radial Tipped Centrifugal Fan” 258
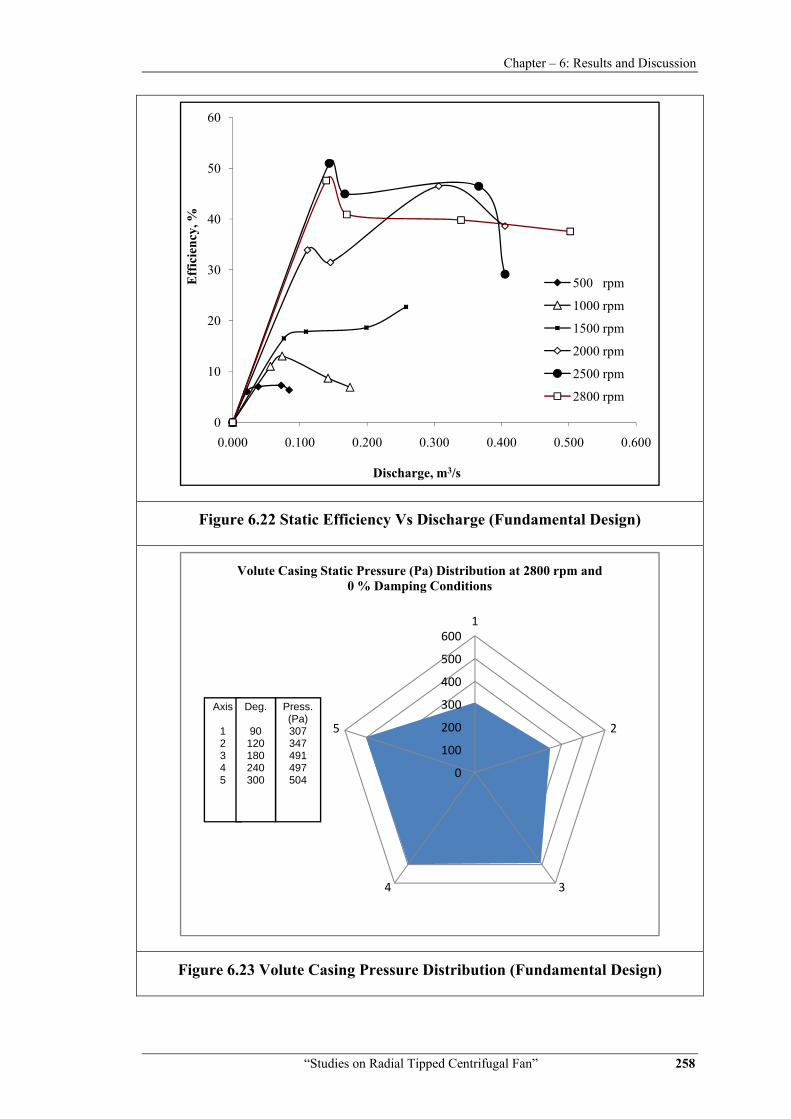
Figure 6.22 Static Efficiency Vs Discharge (Fundamental Design)
Figure 6.23 Volute Casing Pressure Distribution (Fundamental Design)
0
10
20
30
40
50
60
0.000 0.100 0.200 0.300 0.400 0.500 0.600
Eff
icie
ncy,
%
Discharge, m3/s
500 rpm
1000 rpm
1500 rpm
2000 rpm
2500 rpm
2800 rpm
0
100
200
300
400
500
6001
2
34
5
Volute Casing Static Pressure (Pa) Distribution at 2800 rpm and 0 % Damping Conditions
Axis
12345
Press.(Pa)307347491497504
Deg.
90120180240300

Chapter – 6: Results and Discussion
“Studies on Radial Tipped Centrifugal Fan” 259
Figure 6.19 shows the variation of stage pressure as a function of discharge
under different speed conditions. It is observed that at 25% damping, there is major
gain in stage pressure rise with slight reduction in discharge. Thereafter at further
increase in damping, there is reduction in flow rate without much affecting stage
pressure head.
Figure 6.20 shows variation of air power in watts against discharge at different
speed. The maximum airpower achieved is 255 W at 0.502 m3/s discharges. This also
indicates towards non-achievement of design point performance.
Figure 6.21 is presentation for variation of shaft power in watts with respect to
discharge, having speed as parameter. This is a basic performance curve to find
optimum range of operation for any identical fan. Here maximum shaft power is 544
W at 0.502 m3/s discharge. Maximum achieved discharge is little higher than design
point discharge 0.5 m3/s.
Figure 6.22 is another basic performance curve and it is to be evaluated along
with Figure 6.19 and Figure 6.21. This Figure is representing efficiency (at static
pressure based) as a function of discharge under different speeds. It is interesting to
note that maximum efficiency of 51% at 75% damping condition is achieved at 2500
rpm instead of design point 2800 rpm. This may be due to rise in hydraulic losses at
higher speed. Further it is seen that the maximum efficiency point in almost all cases
is achieved at 75% damping under all speeds. All observations are lying below design
point stage pressure rise hence it is not possible to mark best efficiency operating
range for present fan.
Figure 6.23 is graphical presentation of volute pressure distribution at 2800
rpm for 0% damping. At 0% damping it can be seen that velocity head is being
converted in pressure head uniformly during volute passage. This shows efficient
diffusion process of volute casing. It can also be seen that between 120˚ and 180˚,
diffusion rate is higher compared to other places.
It is concluded from above Figures, that fan inlet pressure measured very near
to impeller inlet is – 488 Pa while fan outlet pressure is only 20.6 Pa. Thus, total static
pressure rise of 509 Pa is achieved at 2800 rpm and 0% damping. The discharge
obtained is 0.502 m3/s and the efficiency at this point is only 38%. It is interesting to
note that only discharge is achieved as per design point.
It can be said for fundamental design that, it is better for suction pressure
development but very much lacking in generating outlet pressure. This design can

Chapter – 6: Results and Discussion
“Studies on Radial Tipped Centrifugal Fan” 260
achieve only design flow rate at maximum speed and 0% damping. Best operating
range is not possible to trace. Present efficient operating range for this fan is at 75%
damping position for all speed conditions. At off-design operating points, discharge
gets very much reduced. It is suggested that proper loss estimation and redesigning for
impeller outlet diameter can help to achieve design point performance. Positive
outcome of this design is that suction pressure at fan inlet is generated more than
twice to design point requirement.
6.4.2 Church design
Figure 6.24 to 6.28 shows the Church design performance obtained in terms of
discharge v/s stage pressure rise, air power, shaft power, efficiency on static pressure
and volute casing pressure distribution.
Figure 6.24 Static Stage Pressure Rise Vs Discharge (Church Design)
0
200
400
600
800
1000
1200
1400
1600
0.000 0.100 0.200 0.300 0.400 0.500 0.600
Stag
e Pr
essu
re R
ise,
Pa
Discharge, m3/s
500 rpm1000 rpm1500 rpm2000 rpm2500 rpm2800 rpmDesign PointLinear (Design Point)

Chapter – 6: Results and Discussion
“Studies on Radial Tipped Centrifugal Fan” 261
Figure 6.25 Air Power on Static Pressure Vs Discharge (Church Design)
Figure 6.26 Shaft Power Vs Discharge (Church Design)
0
100
200
300
400
500
600
0.000 0.100 0.200 0.300 0.400 0.500 0.600
Air
Pow
er, W
Discharge, m3/s
500 rpm1000 rpm1500 rpm2000 rpm2500 rpm2800 rpmDesign Point
0
100
200
300
400
500
600
700
800
0.000 0.100 0.200 0.300 0.400
Shaf
t Po
wer
, w
Discharge, m3/s
500 rpm1000 rpm1500 rpm2000 rpm2500 rpm2800 rpm

Chapter – 6: Results and Discussion
“Studies on Radial Tipped Centrifugal Fan” 262
Figure 6.27 Static Efficiency Vs Discharge (Church Design)
Figure 6.28 Volute Casing Pressure Distribution (Church Design)
0
10
20
30
40
50
60
0.000 0.050 0.100 0.150 0.200 0.250 0.300 0.350 0.400
Eff
icie
ncy,
%
Discharge, m3/s
500 rpm
1000 rpm
1500 rpm
2000 rpm
2500 rpm
2800 rpm
0200400600800
10001200
1
2
34
5
Volute Pressure Distribution ( Pa) at 2800 rpm and 0 % Damping Conditions
Axis
12345
Press.(Pa)752765903883
1014
Deg.
90120180240300

Chapter – 6: Results and Discussion
“Studies on Radial Tipped Centrifugal Fan” 263
Figure 6.24 presents features of stage pressure rise with discharge on abscissa,
at different speed conditions. Here design point stage pressure rise is achieved but
actual flow rate remains far away from designed. It is surprising to observe a big jump
in stage pressure rise between, 25 to 50% damping conditions.
Figure 6.25 is representing airpower generated against discharge of flow
received. This shows similar picture of non-achievement of design point performance
at any damping position. The maximum airpower achieved is 221 W at 25% damping
at 2800 rpm and 0.236 m3/s discharge.
Figure 6.26 presents expenditure of shaft power for amount of discharge
achieved at various speeds and damping conditions. Here 706 W shaft power is
consumed but it is contributing only 0.370 m3/s flow rate. Once again it is not
possible to establish efficient operating range for this fan.
Figure 6.27 is showing efficiency based on static pressure rise achieved during
this course of work against discharge obtained. Efficiency is increasing between, 50%
to 75% damping conditions for all impeller speeds. This design attains maximum 56%
efficiency at 75% damping and 2800 rpm by offering only 0.135 m3/s discharge. At
this point of operation, stage pressure rise is seen 1404 Pa. This is beyond design
point requirement.
Figure 6.28 shows volute casing pressure distribution at various angular
positions having 0% damping at 2800 rpm. It is observed that static pressure of
flowing fluid increases when it is marching towards volute exit. Between zero to 300
degree volute positions, static pressure rises from 752 Pa to 1014 Pa. This shows
efficient diffusion of fluid velocity and hence static pressure gets increased.
As per this design methodology, the experimental results are quite passive at
0% damping and design speed. The performance of this centrifugal fan at its best
efficiency point offers 1404 Pa static stage pressure rise, development of 189 W
airpower at 0.135 m3/s air discharge and consuming 270 W shaft power at 56% static
efficiency and 57% stagnation efficiency.
Performance has shown a need for redesigning of suction dimensions.
Impeller inlet dimensions along with blade width should increase so that higher flow
rate can be achieved. Increase in nose radius will help to reduce re-circulation of flow
and that way reduction in leakage losses. Church has used pressure coefficient K’. Its
value lies empirically between 0.5-0.65. This is used to calculate impeller outlet
diameter. This empirical concept requires reconsideration. However if design point

Chapter – 6: Results and Discussion
“Studies on Radial Tipped Centrifugal Fan” 264
performance is neglected, the best operating region for this design lies between 50 to
75% damping conditions.
6.4.3 Osborne design
Figure 6.29 to 6.33 shows the Osborne design performance obtained in terms
of discharge v/s stage pressure rise, air power, shaft power, efficiency on static
pressure and volute casing pressure distribution.
Figure 6.29 Static Stage Pressure Rise Vs Discharge (Osborne Design)
0
200
400
600
800
1000
1200
1400
1600
1800
2000
0.000 0.200 0.400 0.600 0.800 1.000
Stag
e Pr
essu
re R
ise,
Pa
Discharge, m3/s
500 rpm1000 rpm1500 rpm2000 rpm2500 rpmDesign Point2800 rpmLinear (Design Point)
Chapter – 6: Results and Discussion
“Studies on Radial Tipped Centrifugal Fan” 265
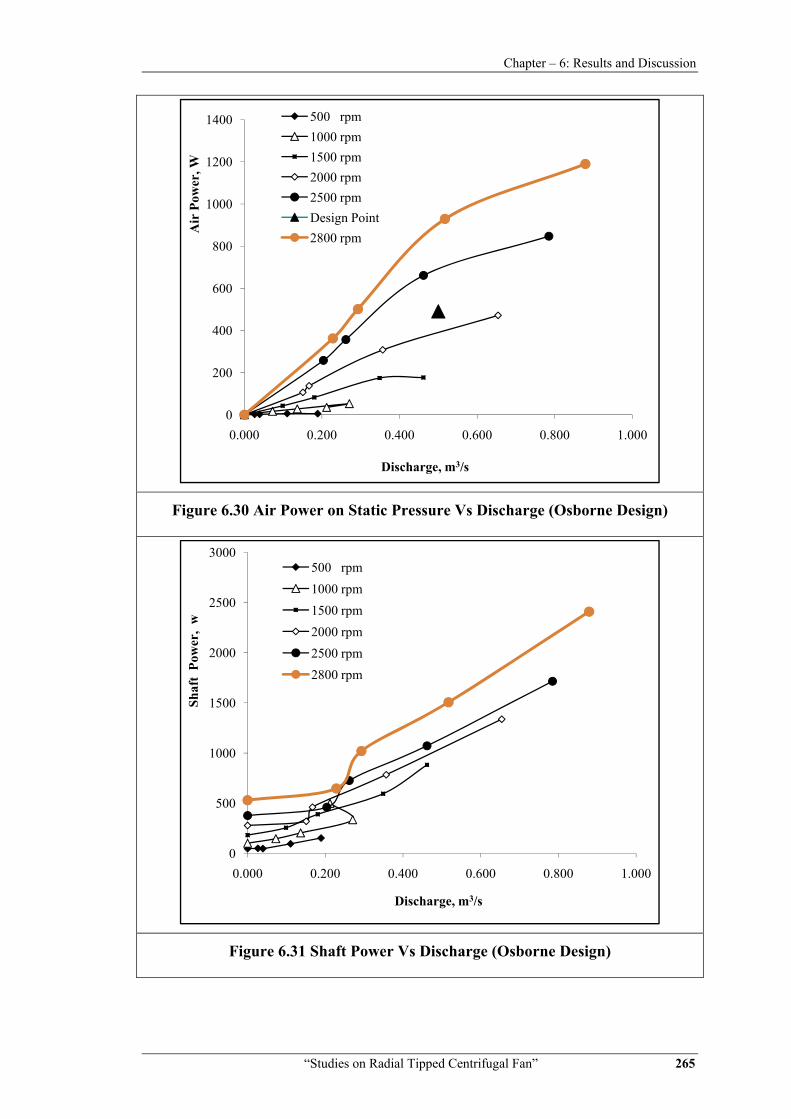
Figure 6.30 Air Power on Static Pressure Vs Discharge (Osborne Design)
Figure 6.31 Shaft Power Vs Discharge (Osborne Design)
0
200
400
600
800
1000
1200
1400
0.000 0.200 0.400 0.600 0.800 1.000
Air
Pow
er, W
Discharge, m3/s
500 rpm1000 rpm1500 rpm2000 rpm2500 rpmDesign Point2800 rpm
0
500
1000
1500
2000
2500
3000
0.000 0.200 0.400 0.600 0.800 1.000
Shaf
t Po
wer
, w
Discharge, m3/s
500 rpm1000 rpm1500 rpm2000 rpm2500 rpm2800 rpm

Chapter – 6: Results and Discussion
“Studies on Radial Tipped Centrifugal Fan” 266
Figure 6.32 Static Efficiency Vs Discharge (Osborne Design)
Figure 6.33 Volute Casing Pressure Distribution (Osborne Design)
0
10
20
30
40
50
60
0.000 0.200 0.400 0.600 0.800 1.000
Stat
ic E
ffic
ienc
y, %
Discharge, m3/s
500 rpm1000 rpm1500 rpm2000 rpm2500 rpm2800 rpm
0
500
1000
15001
2
34
5
Volute Casing Pressure (Pa) Distribution at 2800 rpm and 0 % Damping Conditions
Axis
12345
Press.(Pa)728
1036949
10921028
Deg.
90120180240300
Chapter – 6: Results and Discussion
“Studies on Radial Tipped Centrifugal Fan” 267
Figure 6.29 presents stage pressure rise against discharge at different design
and off design speed conditions. At 2800 rpm and 0% and 25% damping conditions,
fan differential pressure head generated is 1353 and 1796 Pa at 0.879 m3/s and 0.517
m3/s discharge, respectively. These are well above the design point requisition. It can
also be seen that 0-25% damping conditions offers efficient operating range.
Figure 6.30 presents airpower developed against discharge achieved at
different speed and damping conditions. 1190 W maximum airpower is received at
2800 rpm and 0% damping at 39% efficiency.
Figure 6.31 shows distinctive features of shaft power against discharge
achieved. It reveals that shaft power consumption is very much higher. It consumes
2410 W at 0% damping and 2800 rpm. But at 25% damping, shaft power is reduced to
1506 W to generate 0.517 m3/s discharge at 49% efficiency.
Figure 6.32 represent static efficiency achieved during this course of work
against discharge. This basic performance curve highlights that at 0% and 25%
damping, the static efficiencies achieved are 39% and 49%, respectively. This result
also supports that 0-25% damping conditions gives better efficiency region.
Figure 6.33 shows identical volute pressure distribution at 0% damping and
2800 rpm conditions. This seems to be uniform along the volute passage and
presenting proper diffusion of velocity.
The results obtained under this design are very much encouraging. Major
performance parameters like inlet pressure, outlet pressure, volume flow rate, stage
pressure rise are achieved on higher side of design point. This design is more suitable
where higher suction head is required. Here it can be summarized that fan designed as
per Osborne design method is good enough to meet design point performance. With
this design, flow regulation is also possible which can provide flexibility to run fan at
off design conditions, too. This is useful and essential in establishing best operating
range. Major limitation of this fan is geometrically bigger size compared to
fundamental and Church design. It is also consuming very high shaft power compared
to others two. To overcome these limitations, conservative loss estimation should be
made while redesigning the fan. Impeller size can be reduced by applying fan laws for
geometrically similar fans for required design point performance. The best operating
range for this fan is at 25% damping and 2800 rpm.
Chapter – 6: Results and Discussion
“Studies on Radial Tipped Centrifugal Fan” 268
6.4.4 Comparative performance assessment of explicit design methodologies
Table 6.6 shows comparative performance assessment of fans running at
design speed of 2800 rpm and 0% damping conditions. Design point requirements and
operating points obtained under fundamental, Church and Osborne design
methodologies are also tabulated.
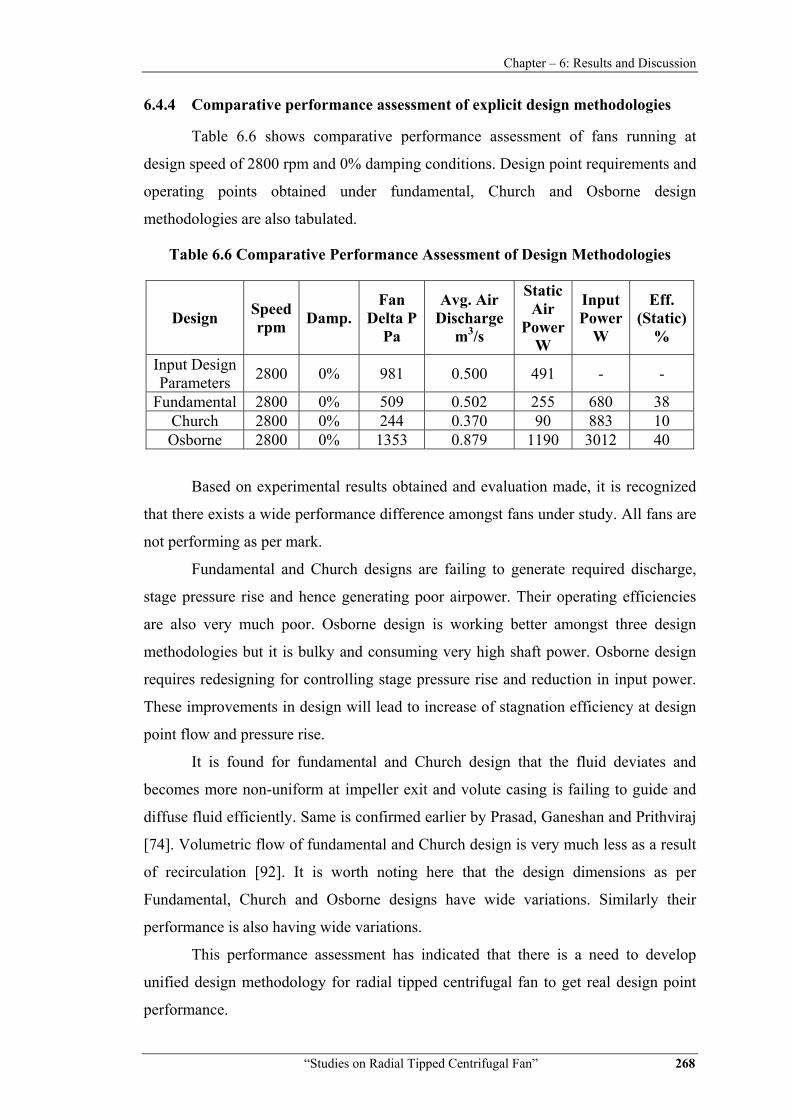
Table 6.6 Comparative Performance Assessment of Design Methodologies
Design Speed rpm Damp.
Fan Delta P
Pa
Avg. Air Discharge
m3/s
Static Air
Power W
Input Power
W
Eff. (Static)
%
Input Design Parameters 2800 0% 981 0.500 491 - -
Fundamental 2800 0% 509 0.502 255 680 38 Church 2800 0% 244 0.370 90 883 10 Osborne 2800 0% 1353 0.879 1190 3012 40
Based on experimental results obtained and evaluation made, it is recognized
that there exists a wide performance difference amongst fans under study. All fans are
not performing as per mark.
Fundamental and Church designs are failing to generate required discharge,
stage pressure rise and hence generating poor airpower. Their operating efficiencies
are also very much poor. Osborne design is working better amongst three design
methodologies but it is bulky and consuming very high shaft power. Osborne design
requires redesigning for controlling stage pressure rise and reduction in input power.
These improvements in design will lead to increase of stagnation efficiency at design
point flow and pressure rise.
It is found for fundamental and Church design that the fluid deviates and
becomes more non-uniform at impeller exit and volute casing is failing to guide and
diffuse fluid efficiently. Same is confirmed earlier by Prasad, Ganeshan and Prithviraj
[74]. Volumetric flow of fundamental and Church design is very much less as a result
of recirculation [92]. It is worth noting here that the design dimensions as per
Fundamental, Church and Osborne designs have wide variations. Similarly their
performance is also having wide variations.
This performance assessment has indicated that there is a need to develop
unified design methodology for radial tipped centrifugal fan to get real design point
performance.

Chapter – 6: Results and Discussion
“Studies on Radial Tipped Centrifugal Fan” 269
6.5 Phase-IV: Unified Design Methodology and Comparative Performance Evaluation of Forward and Backward Curved Radial Tipped Centrifugal Fan
Experimental evaluation of fans stated in phase III has revealed that there
exists a wide performance variation. Hence successful outcomes of fundamental,
Church and Osborne designs are incorporated and unified design methodology for
radial tipped centrifugal fan is developed. Unified design procedure is developed from
fundamental concepts and involving minimum assumptions. Forward and backward
curved radial tipped impeller fans are fabricated as per this unified design
methodology. Their performance is measured as per standard test procedure IS: 4894-
1987, Indian Standard Specification for Centrifugal Fans. Experimental test
observation Tables for forward curved and backward curved radial tipped fans
fabricated as per unified design methodology are given in Annexure C. Result
analysis of the performance of forward and backward curved centrifugal fans are
discussed below.
6.5.1 Forward curved radial tipped (FCRT) centrifugal fan
Figure 6.34 to 6.38 shows the unified design forward curved radial tipped
(FCRT) centrifugal fan performance obtained in terms of discharge v/s stage pressure
rise, air power, input power, efficiency on static pressure and volute casing pressure
distribution.
Figure 6.34 Static Stage Pressure Rise Vs Discharge (Unified Design, FCRT Fan)
0200400600800
10001200140016001800
0.000 0.200 0.400 0.600 0.800 1.000
Stag
e D
elta
P,
Pa
Discharge, m3/s
500 rpm1000 rpm1500 rpm2000 rpm2500 rpm2800 rpmDesign Point

Chapter – 6: Results and Discussion
“Studies on Radial Tipped Centrifugal Fan” 270
Figure 6.35 Air Power on Static Pressure Vs Discharge (Unified Design, FCRT Fan)
Figure 6.36 Input Power Vs Discharge (Unified Design, FCRT Fan)
0
200
400
600
800
1000
1200
1400
0.000 0.200 0.400 0.600 0.800 1.000
Air
Pow
er, W
Discharge, m3/s
500 rpm
1000 rpm
1500 rpm
2000 rpm
2500 rpm
2800 rpm
Design Point
0
200
400
600
800
1000
1200
1400
1600
1800
2000
0.000 0.200 0.400 0.600 0.800 1.000
Inpu
t Pow
er, W
Discharge, m3/s
500 rpm1000 rpm1500 rpm2000 rpm2500 rpm2800 rpmDesign Point

Chapter – 6: Results and Discussion
“Studies on Radial Tipped Centrifugal Fan” 271
Figure 6.37 Efficiency (Static Pressure Based) Vs Discharge (Unified Design,
FCRT Fan)
Figure 6.38 Volute Casing Pressure Distribution (Unified Design, FCRT Fan)
0
10
20
30
40
50
60
70
80
0.000 0.200 0.400 0.600 0.800 1.000
Tot
al E
ffic
ienc
y ( S
tatic
), %
Discharge, m3/s
500 rpm1000 rpm1500 rpm2000 rpm2500 rpm2800 rpmDesign Point
0
50
100
150
200
250
3001
2
34
5
Axis
12345
Press.(Pa)
268.4241.6161.1201.3201.3
Deg.
90120180240300
Unified Design - Forward Curved Radial TippedVolute Pressure Distribution ( Pa) at 2800 rpm and 0 % damping

Chapter – 6: Results and Discussion
“Studies on Radial Tipped Centrifugal Fan” 272
Figure 6.34 represents stage pressure rise against discharge at different speed
conditions. It is very important to observe that it reflects true radial tipped blade
characteristics. Stage pressure rise remains nearly constant at all values of discharge
at different speeds. At 2800 rpm, fan differential pressure head generated is 1522 Pa
and discharge 0.865 m3/s. These values are well above the design point requisition. It
can also be seen that 0-50% damping positions is best operating range.
Figures 6.35 and 6.36 shows the variation of air power and input power as a
function of discharge, respectively. The input and air power increases with discharge.
This is well established characteristic of centrifugal fan [26, 28]. Design point lies
centrally in these performance graphs to offer design and off design operating range.
At 2800 rpm, 1316 W airpower is generated at the cost of 1888 watts input power
offering 70% efficiency.
Figure 6.37 shows the variation of static pressure based efficiency with respect
to discharge. This is basic performance characteristic curve, which highlights that at
0% to 50% damping, the best efficiency obtained are 70% at 2800 rpm. This result
also signifies that 0 to 50% damping position gives best efficiency region. It is
interesting to note that the present design offers design point performance in the terms
of efficiency and discharge.
Figure 6.38 shows identical volute pressure distribution at 0% damping and
2800 rpm conditions. This seems to be uniform along the volute passage and
presenting proper diffusion of velocity except 180 degree volute casing position due
to possible sudden increase in local velocities.
Here it can be summarized that designed fan based on unified design is good
enough to achieve desired performance. With this design, flow regulation is also
possible which can provide flexibility to run fan at off design conditions, too. The best
operating range for this fan is at 0-50% damping at 2800 rpm as shown in Table 6.7.
Table 6.7 Optimum Operating Range of Forward Curved Radial Tipped
Centrifugal Fan
Speed rpm Damp.
Fan Stage Pressure
Rise Pa
Avg. Air Discharge
m3/s
Static Air Power
W
Input Power
W
Static Eff. %
2800 0% 1522 0.865 1316 1888 69.7 2800 50% 1544 0.788 1216 1746 69.6

Chapter – 6: Results and Discussion
“Studies on Radial Tipped Centrifugal Fan” 273
The results obtained under unified design are very much encouraging. Major
performance parameters achieved are on higher side of design point. This is useful in
establishing best operating range, which is essential for any turbo machine, especially
fan.
6.5.2 Backward curved radial tipped (BCRT) centrifugal fan
Figure 6.39 to 6.43 shows the unified design backward curved radial tipped
(BCRT) centrifugal fan performance obtained in terms of discharge v/s stage pressure
rise, air power, input power, efficiency on static pressure and volute casing pressure
distribution.
Figure 6.39 Static Stage Pressure Rise Vs Discharge (Unified Design, BCRT Fan)
0
200
400
600
800
1000
1200
1400
1600
0.000 0.200 0.400 0.600 0.800 1.000
Stag
e Pr
essu
re R
ise,
Pa
Discharge, m3/s
500 rpm1000 rpm1500 rpm2000 rpm2500 rpm2800 rpmDesign Point

Chapter – 6: Results and Discussion
“Studies on Radial Tipped Centrifugal Fan” 274
Figure 6.40 Air Power on Static Pressure Vs Discharge (Unified Design, BCRT
Fan)
Figure 6.41 Input Power Vs Discharge (Unified Design, BCRT Fan)
0
200
400
600
800
1000
1200
0.000 0.200 0.400 0.600 0.800 1.000
Air
Pow
er, W
Discharge, m3/s
500 rpm
1000 rpm
1500 rpm
2000 rpm
2500 rpm
2800 rpm
Design Point
0
200
400
600
800
1000
1200
1400
1600
0.000 0.200 0.400 0.600 0.800 1.000
Inpu
t Pow
er, W
Discharge, m3/s
500 rpm
1000 rpm
1500 rpm
2000 rpm
2500 rpm
2800 rpm
Design Point

Chapter – 6: Results and Discussion
“Studies on Radial Tipped Centrifugal Fan” 275
Figure 6.42 Static Efficiency Vs Discharge (Unified Design, BCRT Fan)
Figure 6.43 Volute Casing Pressure Distribution (Unified Design, BCRT Fan)
0
10
20
30
40
50
60
70
80
90
0.000 0.200 0.400 0.600 0.800 1.000
Tot
al E
ffic
ienc
y ( S
tatic
), %
Discharge, m3/s
500 rpm1000 rpm1500 rpm2000 rpm2500 rpm2800 rpmDesign Point
0
50
100
150
2001
2
34
5
Unified Design - Backward Curved Radial TippedVolute Pressure Distribution ( Pa) at 2800 rpm and 0 %
damping
Axis
12345
Press.(Pa)1141541618160
Deg.
90120180240300
Chapter – 6: Results and Discussion
“Studies on Radial Tipped Centrifugal Fan” 276
The results obtained with unified design for backward curved radial tipped fan
are very much encouraging similar to forward curved radial tipped centrifugal fan.
Major performance parameters achieved are on higher side of design point. This is
useful in establishing best operating range of a centrifugal fan.
Figure 6.39 represents stage pressure rise against discharge at different speed
conditions. It is very important to observe that it reflects true radial tipped blade
characteristics. Stage pressure rise remains nearly constant at all values of discharge
at different speeds. At 2800 rpm, fan differential pressure head generated is 1314 Pa
and discharge 0.777 m3/s. These values are well above the design point requisition. A
wide range is available for flow regulations.
Figures 6.40 and 6.41, shows the variation of air power and input power as a
function of discharge. The input and air power increases with discharge. Design point
lies centrally in these performance graphs to offer design and off design operating
range. At 2800 rpm, 1021 W airpower is generated at the cost of 1392 W input power
offering 73% efficiency.
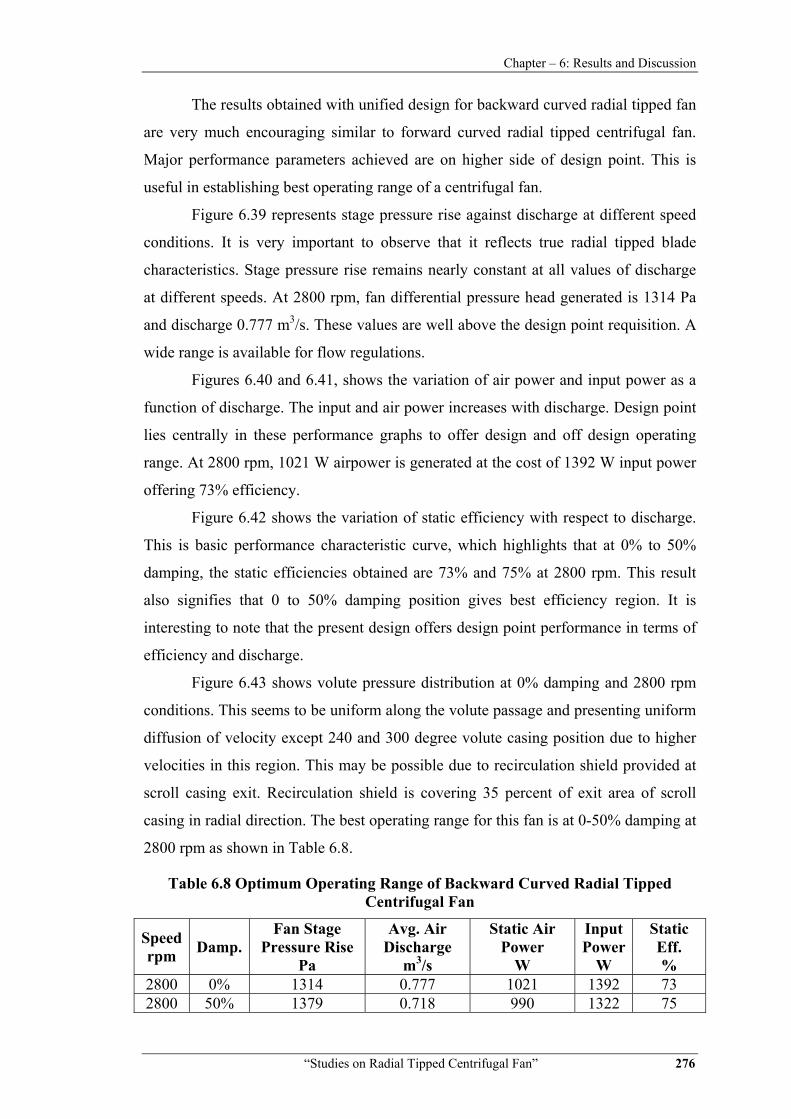
Figure 6.42 shows the variation of static efficiency with respect to discharge.
This is basic performance characteristic curve, which highlights that at 0% to 50%
damping, the static efficiencies obtained are 73% and 75% at 2800 rpm. This result
also signifies that 0 to 50% damping position gives best efficiency region. It is
interesting to note that the present design offers design point performance in terms of
efficiency and discharge.
Figure 6.43 shows volute pressure distribution at 0% damping and 2800 rpm
conditions. This seems to be uniform along the volute passage and presenting uniform
diffusion of velocity except 240 and 300 degree volute casing position due to higher
velocities in this region. This may be possible due to recirculation shield provided at
scroll casing exit. Recirculation shield is covering 35 percent of exit area of scroll
casing in radial direction. The best operating range for this fan is at 0-50% damping at
2800 rpm as shown in Table 6.8.
Table 6.8 Optimum Operating Range of Backward Curved Radial Tipped Centrifugal Fan
Speed rpm Damp.
Fan Stage Pressure Rise
Pa
Avg. Air Discharge
m3/s
Static Air Power
W
Input Power
W
Static Eff. %
2800 0% 1314 0.777 1021 1392 73 2800 50% 1379 0.718 990 1322 75

Chapter – 6: Results and Discussion
“Studies on Radial Tipped Centrifugal Fan” 277
Here it can be summarized that designed fan based on unified design is good
enough to achieve desired performance. With this design, flow regulation is also
possible which can provide flexibility to run fan at off design conditions too.
It is worth to mention that in the case of forward or backward curved radial
tipped centrifugal fan, the unified design thus stands experimentally validated.
6.5.3 Comparative Assessment of FCRT and BCRT centrifugal fans
Comparative performance assessment of forward and backward curved radial
tipped centrifugal fans at 2800 rpm is presented in Table 6.9.
Table 6.9 Optimum Operating Range of FCRT and BCRT Centrifugal Fan
Fan Speed rpm Damp.
Fan Stage Pressure Rise
Pa
Avg. Air Discharge
m3/s
Static Air Power
W
Input Power
W
Static Eff. %
Design Pt. 2800 0% 981 0.500 490 830 74
FCRT 2800 0% 1522 0.865 1316 1888 69.7 FCRT 2800 50% 1544 0.788 1216 1746 69.6 BCRT 2800 0% 1314 0.777 1021 1392 73 BCRT 2800 50% 1379 0.718 990 1322 75
It is concluded from comparative assessment that at same speed of 2800 rpm,
pressure head developed by the forward curve radial tipped centrifugal fan is higher
than backward curved radial tipped centrifugal fan. Hence if there is requirement of
higher stage pressure rise, it is better to go for forward curved centrifugal fan.
Similarly backward curved radial tipped fan consumes less power as compared to
forward curved radial tipped centrifugal fan. The efficiency for the backward curved
fan is comparatively higher than the forward curved fan at similar conditions as
confirmed in literature [10].
These results clearly show that fan based on unified design is good enough to
achieve desired performance. Major performance parameters achieved are on higher
side of design point. Flow regulation is possible between the operating ranges of 0 to
50% damping at 2800 rpm. This can provide flexibility to run fan at off design
conditions, too. This fan is consuming less input power compared to Osborne design
and at the same time gives better efficiency.
Thus, it may be stated that unified design methodology outlined during the
course of present work may be accepted as the experimentally validated design for

Chapter – 6: Results and Discussion
“Studies on Radial Tipped Centrifugal Fan” 278
radial tipped centrifugal fan, which can confidently offer design point performance.
Further, it is most important to note that the performance of the fan achieved as per
unified design surpasses the efficiency target set for centrifugal fans by CSWD [4].
6.6 Phase V: Assessment of Theoretical and Experimental Losses
Centrifugal fan has to be designed for maximum efficiency. To achieve this
objective, there is a need for proper loss estimation. On account of the relatively
longer flow passages and greater turning of flow, the centrifugal stages, suffer higher
losses as compared to axial type.
There are various types of losses occurring when the fluid passes from inlet
duct to outlet duct of a centrifugal fan. The major losses are classified into three
categories as hydraulic or pressure losses, mechanical or power losses and volume
flow or leakage losses. Hydraulic losses reduce the available pressure head developed
by the impeller thereby reducing the Hydraulic efficiency. Mechanical losses are
encountered mainly due to disc Friction and friction between rotating shaft and the
journal bearing. Leakage losses reduce the quantity of fluid delivered per unit time
and hence reduce the volumetric efficiency. The stagnation efficiency of any machine
depends on the various losses occurring in the machine at different stages.
During this course of work, Centrifugal fan with 203 mm outside diameter
backward curved radial tipped impeller and associated scroll casing are fabricated.
Impeller is fabricated from mild steel sheet material and scroll casing is made
transparent by using acrylic sheet material. Fan is designed as per as per unified
design methodology and applying fan affinity laws. Static and velocity pressure heads
at design and off design speed conditions are measured by specially developed and
calibrated five holes probe. Other parameters are recorded simultaneously. Entry and
exit impeller velocity triangles are prepared at different peripheral locations. Slip
factor is calculated at all volute locations for different speed conditions.
Comparative assessment of theoretical estimation of hydraulic, leakage and
power losses suggested by various researchers and experimentally measured losses
are given in Annexure C. Velocity measurements and slip factor calculations for
backward curved radial tipped impeller fan are also given in Annexure C.
The measured dimensions, velocity and pressure parameters at inlet and outlet
conditions are given in Annexure C.

Chapter – 6: Results and Discussion
“Studies on Radial Tipped Centrifugal Fan” 279
As per literature review, estimated losses proposed by different researchers
differ widely. Hence experimental investigations are essential to ascertain real
performance of radial tipped centrifugal fan.
Overall theoretical analysis of losses indicates that hydraulic losses are the
major source of all kind of losses occurring in radial tipped centrifugal fan. Leakage
and mechanical losses are comparatively less than hydraulic losses in terms of
percentile.
Further experiments are carried out to measure hydraulic, leakage, mechanical
losses. Experimental and analytical results are tabulated and given in Annexure C.
When the speed of rotor is reduced, hydraulic losses are significantly reduced. There
is also reduction in leakage and mechanical losses. This leads to the conclusions that
low velocity fluid causes less centrifugal fan losses.
According to A. H. Church [26], among the impeller losses, turbulence in the
impeller vane inlet is the major source of loss. Most of the volute losses are due to
friction and turbulence in the discharge passages. As per W. C. Osborne [28],
impeller entrance loss is the maximum among the all other impeller losses. His
method to estimate volute casing losses is very conservative. It offers very little volute
losses compared to actual one. Eck Bruno’s [14] methodology finds that major
components of impeller losses are impeller entrance and retardation losses. While
D. J. Myles [33] said that leakage losses are much higher when compared to
theoretical estimations. Volute loss is one of the major sources of hydraulic losses and
their contribution is equally important to impeller losses.
According to A. H. Church, W. C. Osborne, Eck Bruno and D. J. Myles,
theoretical leakage loss is 2.52%, 14.47%, 15.79% and 31.75%, respectively for the
fan under consideration. Experimental value of leakage loss is found 4% of design
flow rate.
Similarly A. H. Church, W. C. Osborne, Eck Bruno and D. J. Myles observe
theoretical hydraulic losses as 38.27%, 25.26%, 26.89% and 31.45%, respectively,
while experimentally it is in the vicinity of 35.59%.
The mechanical losses as per A. H. Church, W. C. Osborne, Eck Bruno and D.
J. Myles are 16.32%, 1.57%, 10.18% and 10%, respectively. Experimentally it is
found as 12% of total power consumption. Duct friction losses are negligible as being
less than 1%.

Chapter – 6: Results and Discussion
“Studies on Radial Tipped Centrifugal Fan” 280
The comparison of experimental and theoretical evaluations reveals that there
is no uniformity between experimentally determined and theoretically derived leakage
losses. Experimental hydraulic and mechanical losses are showing uniformity with the
major theoretical values obtained.
Overall analysis on losses indicates that hydraulic losses are the major source
of losses in radial tipped centrifugal blower/fan. Leakage and mechanical losses are
comparatively less. According to all researchers impeller entrance losses are major
source of total impeller losses.
Among all hydraulic losses, impeller losses are experimentally found to be
68% while volute casing losses are observed 31% of total hydraulic losses. This
confirms the study of Andre Kovats [27] and R. J. Kind [60]. Volute losses are also
significant and are one of the major sources of hydraulic losses and their contribution
is equally important to impeller losses. This acknowledges the work of Y. Senoo and
H. Hayami [98], stating that 30% or more kinetic energy at diffuser exit remains
unconverted to pressure energy.
When the speed of rotor is reduced, hydraulic losses are significantly reduced.
There is also reduction in leakage and mechanical losses. This leads to the
conclusions that low velocity fluid causes less centrifugal fan losses.
These facts lead to the conclusion that impeller and volute losses are to be
minimized to improve hydraulic efficiency of the centrifugal fans. Vaned diffuser will
help to reduce eddies in volute casing and hence reducing volute losses.
Comparison of theoretical and experimental losses is presented in Figure 6.44.
If we consider all type of losses as 100%, than contribution of leakage, hydraulic and
mechanical losses are shown in Figure 6.45 by pie chart for experimental losses.

Figure
The
minimized
help to redu
Furt
centrifugal
radial tippe
1
1
2
2
3
3
4
4
% o
f tot
al lo
ss
6.44 Comp
Figu
ese facts lea
to improve
uce eddies i
ther experi
fan under s
ed centrifug
0.00
5.00
0.00
5.00
0.00
5.00
0.00
5.00
0.00
5.00
A.H.C
Le
Hy
Me
“Studies o
parative An
ure 6.45 Dis
ad to the c
hydraulic e
in volute ca
imental inv
study. Phase
al fan, fabri
Church WOs
Comp
Leakage lo
eakage loss
ydraulic loss
echanical loss
on Radial Tipp
nalysis of T
stribution o
onclusion t
efficiency o
sing and he
vestigations
e V experim
icated as pe
W.C. sborne
Ec
parative a
oss Hydr
23%
Expe(% Sh
s
ped Centrifuga
Theoretical
of Experim
that impelle
of the centri
ence reducin
are made
ments were
er unified de
ck Bruno D
analysis of
raulic loss
69%
erimental hare in Tota
Chapter – 6:
al Fan”
and Exper
mental Losse
er and volu
fugal fans. V
ng volute lo
to find ou
made on 8”
esign metho
D.J.Myles E
f losses
Mechanica
8%
Lossesal Losses)
Results and D
rimental Lo
es
ute losses a
Vaned diffu
sses.
ut slip fact
” impeller d
odology.
Experimenta
al loss
Discussion
281
osses
re to be
user will
tor in a
diameter
al

Chapter – 6: Results and Discussion
“Studies on Radial Tipped Centrifugal Fan” 282
Velocity measurements and slip factor calculations for backward curved radial
tipped impeller fan are given in Table 6.10. It also shows comparison of experimental
and empirical values of slip factor.
Table 6.10 Phase V: Experimental Observation Table with Comparison of Experimental and Empirical Value of Slip Factors (Z=16, N=2800 rpm)
Location Peripheral
velocity (m/s)
Flow angle
(degree)
Measured
Absolutevelocity
(m/s)
Whirl Velocity
(m/s)
Exp. Slip
factor
Empirical Values by
Balje Stodola Stanitz
A 31.43 21 17.66 16.49 0.52
0.796 0.804 0.876
B 31.43 44 20.77 14.94 0.48 C 31.43 23 22.26 20.49 0.65 D 31.43 19 24.71 23.36 0.74 E 31.43 20 26.97 25.34 0.81 F 31.43 22 27.18 25.2 0.80
Average slip factor 0.67
The average value of slip factor is found 0.67. This is less than the empirical
value of 0.8 considered for design purpose. Experimental value of slip factor is found
16.7% less than empirical value suggested by Stodola [31], 16% less than suggested
by Balje and 24% less than suggested by Stanitz [9]. Figure 6.46 shows comparative
analysis of empirical and experimental slip factor for 16 numbers of blades at speed of
2800 rpm.
Figure 6.46 Empirical and Experimental Slip Factors for 16 Blades
0.45
0.5
0.55
0.6
0.65
0.7
0.75
0.8
0.85
0.9
0 1 2 3 4 5 6 7
Experimetal
Balje
Stodola
Stanitz

Chapter – 6: Results and Discussion
“Studies on Radial Tipped Centrifugal Fan” 283
Slip factor has closer agreement at design point conditions but deviates at off
design conditions. This indicates that there is more deviation in actual and the
theoretical flow direction at off design conditions. This also confirms study of
Mohamad Memardezfouli and Ahmad Nourbakhsh [87] of comparing experimental
slip factors with the calculated theoretical values. Similarly wide difference was
noticed by Frank Kenyery [83] who concluded that slip factor varies with the flow
rate and even in the case of the nominal flow rate; values for the slip factor produced
by correlations could have errors as large as 52%.
As per conclusions of phase II experiments having 12”impeller diameter
centrifugal fan, there was 3 to 12% experimental slip factor deviation compared to
empirical co-relations. In present case of experiments having 8” impeller diameter,
deviation of slip factor ranges from 16% to 24% compared to empirical values. It
confirms that shorter blade passage height will produce more slip. More
deviation of exit velocities is observed in small size impellers. This is due to absence
of proper flow guidance within blade passage. Blade height is an important parameter
and should be considered while estimating slip factor [22, 81].
The present studies on determination of experimental values of slip factor for
two different designs of impeller with varying speed, flow, number of blades and
suction resistance clearly highlights the lacuna of predictive capabilities of existing
slip factor correlations in the literature and focuses towards a need of more accurate
model for evaluation of slip factor.