Embed Size (px)
Citation preview

Results from Recent Studies Evaluating the Snap Sampler
Louise Parker & Nathan MulherinUSA ERDC CRREL, Hanover, NH
North American Environmental Field Conference
Tampa, FloridaJanuary 16, 2008

What is the Snap Sampler?
• Equilibrated-grab sampler (ITRC 2006, 2007)
– Grab sampler left in well for equilibration period prior to sample collection
• Allows well to recover from disturbance caused by placing sampler in well
– 2 week minimum (ITRC 2001, 2004, 2006, 2007)• Gives materials in sampler time to equilibrate with
analytes in well water
• Collects sample from discrete interval in well screen• Collects whole water samples• Collects samples in “real time”

Components of the Snap Sampler• Sampler body with trigger mechanism• Snap Sampler bottles
– Openings on 2 ends with spring-activated caps– Teflon caps – Teflon-coated spring – 40-mL VOA vials – 250-mL PP bottles
• Trigger line– Teflon-coated wireline cable inside PE tube
• Docking station– Holds sampler in place

Deploying the Snap Sampler• Place bottle in sampler body• Place end caps (of bottles) in open position • Cock sampler & attach trigger line to sampler
– Can deploy up to 4 samplers on single trigger line• Lower sampler by trigger line to sampling
depth & attach to docking station• Leave sampler in well for next sampling event
– Quarterly, semi-annual, or annual sampling event – 2 week minimum equilibration time (ITRC)
Advantages• Sample is sealed under in-situ conditions*• No chance for interaction with water column
as sample is brought to surface• No sample transfer at well head required*
* Can be important for VOCs, gases, metals subject to oxidation/precipitation reactions

Experimental ApproachConduct laboratory and field studies to
evaluate the performance of these samplers
Lab Studies- Compare concentrations of analytes in samples taken with sampler with control samples taken from a standpipe containing a test solution with known concentrations of analytes
Field Studies- Compare concentrations of analytes in samples taken with sampler with samples taken using EPA’s low-flow purging & sampling protocol

• Used a 8-in. ID, 8-ft. tall PVC standpipe • Test Solution contained a suite of either
VOCs, explosives, or inorganics• Samplers deployed at same depth as
sampling spigot • Samplers left to equilibrate with test
solution, typically 24 hours• Control samples collected from spigot• Alternate sampling order between
samplers & control samples
Lab Studies Protocol
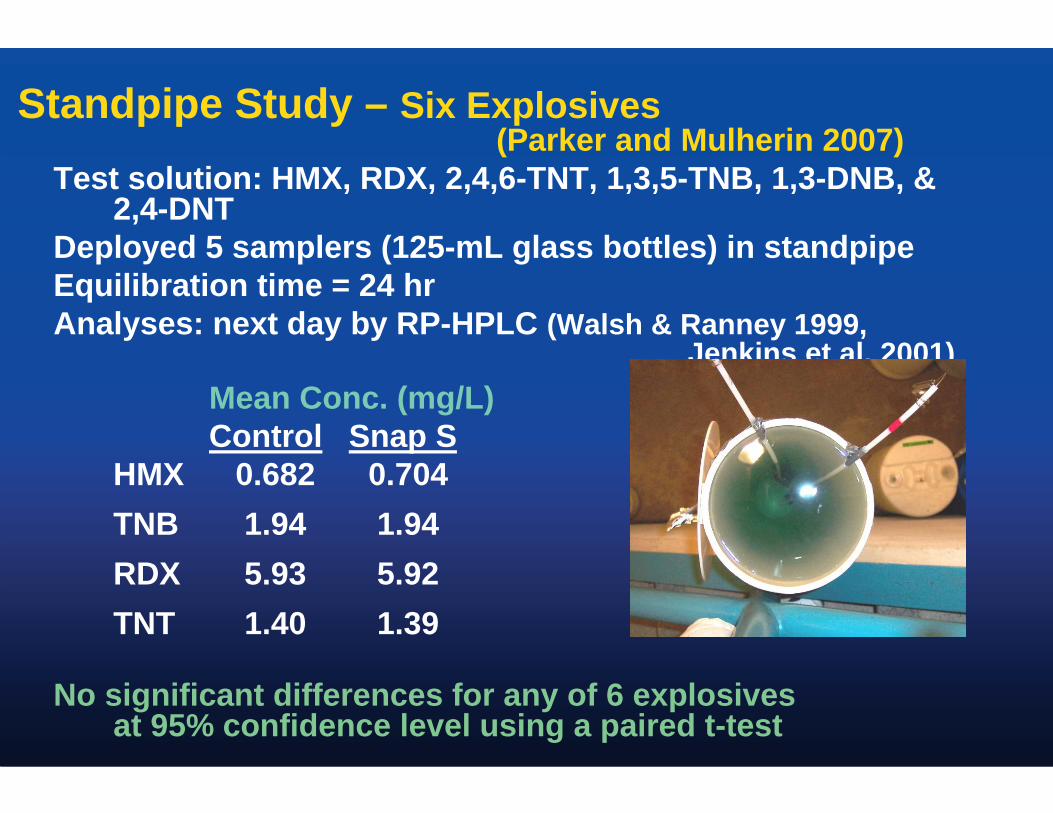
Standpipe Study – Six Explosives(Parker and Mulherin 2007)
Test solution: HMX, RDX, 2,4,6-TNT, 1,3,5-TNB, 1,3-DNB, & 2,4-DNT
Deployed 5 samplers (125-mL glass bottles) in standpipeEquilibration time = 24 hrAnalyses: next day by RP-HPLC (Walsh & Ranney 1999,
Jenkins et al. 2001)Mean Conc. (mg/L)Control Snap S
HMX 0.682 0.704 TNB 1.94 1.94 RDX 5.93 5.92TNT 1.40 1.39
No significant differences for any of 6 explosivesat 95% confidence level using a paired t-test

Holding-time Study – Explosives (Parker & Mulherin 2007)Previous samples analyzed almost immediatelyObjective : Determine if analyte recovery the same for samples
held maximum holding timeSimilar protocol except that samplers held for max. holding time
prior to analyses (i.e., 7 days with no preservative)
Percent recoveryof Snap Sampler
TNB 99.8RDX 99.3DNB 99.4TNT 99.4NB 99.1DNT 100
Essentially 100% recovery with 24-hr equilibration time

Mean Conc. (mg/L)Control Snap Sampler
t-DCE 0.940 0.930BENZ 0.994 0.989TCE 0.970 0.965TOL 0.970 0.962o-DCB 1.02 1.01 m-XYL 0.958 0.947PCE 0.906 0.895
No significant differences for any of 7 VOCs at 95% confidence level using a paired t-test
Standpipe Study – VOCs (Parker & Mulherin 2007)Deployed 6 samplers (40-mL VOA vials)Equilibration time = 24 hrAnalyses: RP-HPLC (Parker & Ranney 1998)

Mean percent recoveryEquilibration time = 1 day 3 days
t-DCE 95.4* 101.5BENZ 99.5 102.9*TCE 94.1* 100.5TOL 94.1* 96.5*o-DCB 91.1* 98.0*m-XYL 64* 77*PCE 84* 96.2*
*Values were significantly different from control valuesConclusions: After 3 days equilibration, differences < 5% except
for m-xylene~3 days equilibration is needed for VOCs
VOCs Holding-Time Study (Parker & Mulherin 2007) Deployed 5 samplersSamples acid preserved & held for max. holding time
(14 days)

Standpipe Study – Metals• Similar protocol to previous studies
– Used 125-mL PP Snap Sampler bottles• Deployed 5 trigger lines with 3 samplers
per line• Test solution contained suite of metals
– As, Cd, Cr, Pb, Ni, & Zn– Concentrations ranged from ~200 to 400 mg/L
• Recovered one set of samples after 24, 48, & 72 hr• Analyses by ICP– Atomic Emission Spectroscopy
– ERDC-EL using EPA method 6010B
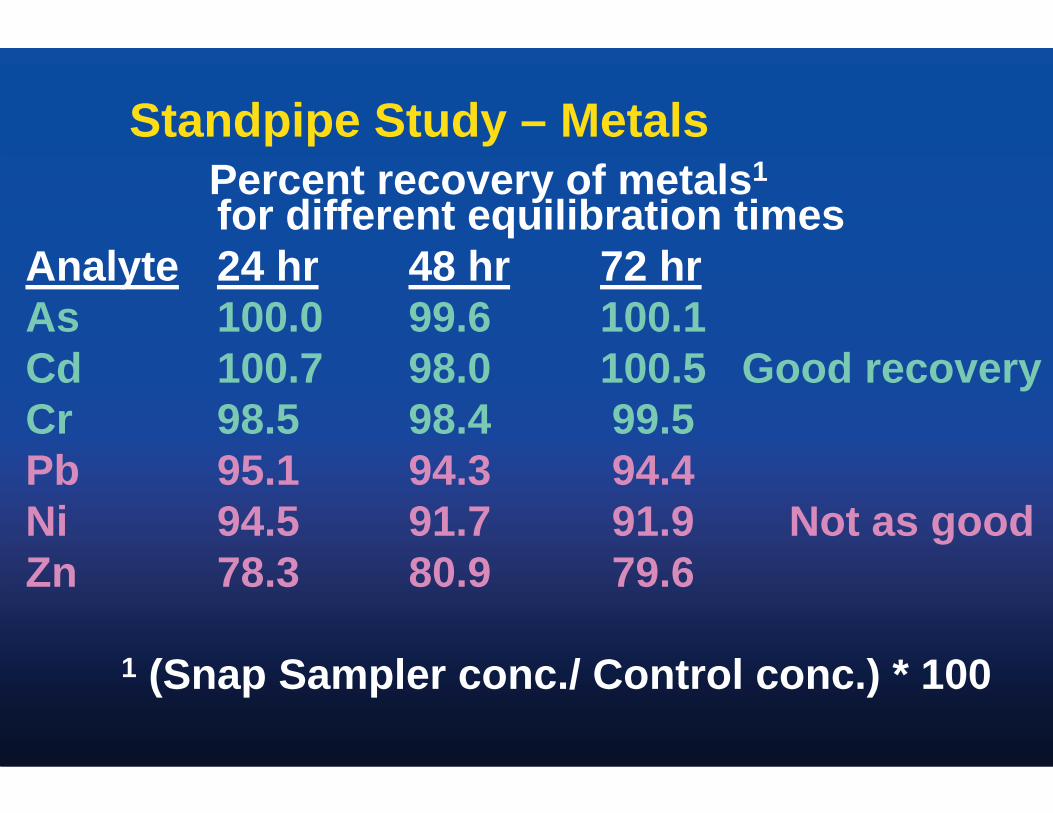
Standpipe Study – MetalsPercent recovery of metals1
for different equilibration timesAnalyte 24 hr 48 hr 72 hrAs 100.0 99.6 100.1Cd 100.7 98.0 100.5 Good recoveryCr 98.5 98.4 99.5Pb 95.1 94.3 94.4Ni 94.5 91.7 91.9 Not as goodZn 78.3 80.9 79.6
1 (Snap Sampler conc./ Control conc.) * 100

Standpipe Study – MetalsPercent recovery of metals1
for different equilibration timesAnalyte 24 hr 48 hr 72 hr 50 dayAs 100.0 99.6 100.1 100.9Cd 100.7 98.0 100.5 100.7Cr 98.5 98.4 99.5 100.2Pb 95.1 94.3 94.4 89.5Ni 94.5 91.7 91.9 93.4Zn 78.3 80.9 79.6 69.2
1 (Snap Sampler conc./ Control conc.) * 100

Standpipe Study – MetalsMean conc. (mg/L)
Arsenic Lead Nickel ZincTime C Snap C Snap C Snap C Snap24 hr 195 195 197 188 373 353 438 34348 hr 195 194 198 187 387 355 428 34672 hr 194 194 199 188 398 365 441 35150 day 188 190 231 207 478 447 1031 714
% increase in controls from day 117% 28% 135%
C = Control sample

Conclusions• Lower concentrations of Pb, Ni, & Zn in Snap
Sampler samples due to leaching of metals from spigot into control samples
• Snap Sampler able to recover representative concentrations of As, Cd, & Cr
• Need confirmation for wider range of inorganics
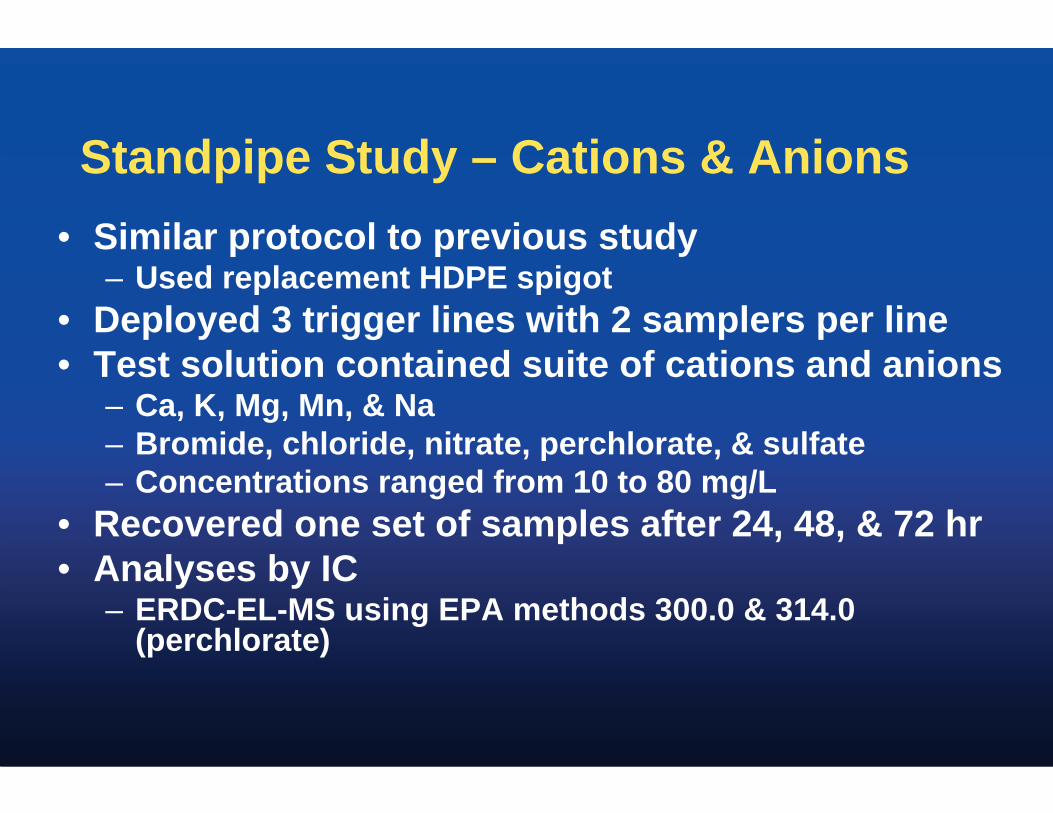
Standpipe Study – Cations & Anions• Similar protocol to previous study
– Used replacement HDPE spigot• Deployed 3 trigger lines with 2 samplers per line• Test solution contained suite of cations and anions
– Ca, K, Mg, Mn, & Na– Bromide, chloride, nitrate, perchlorate, & sulfate– Concentrations ranged from 10 to 80 mg/L
• Recovered one set of samples after 24, 48, & 72 hr• Analyses by IC
– ERDC-EL-MS using EPA methods 300.0 & 314.0 (perchlorate)
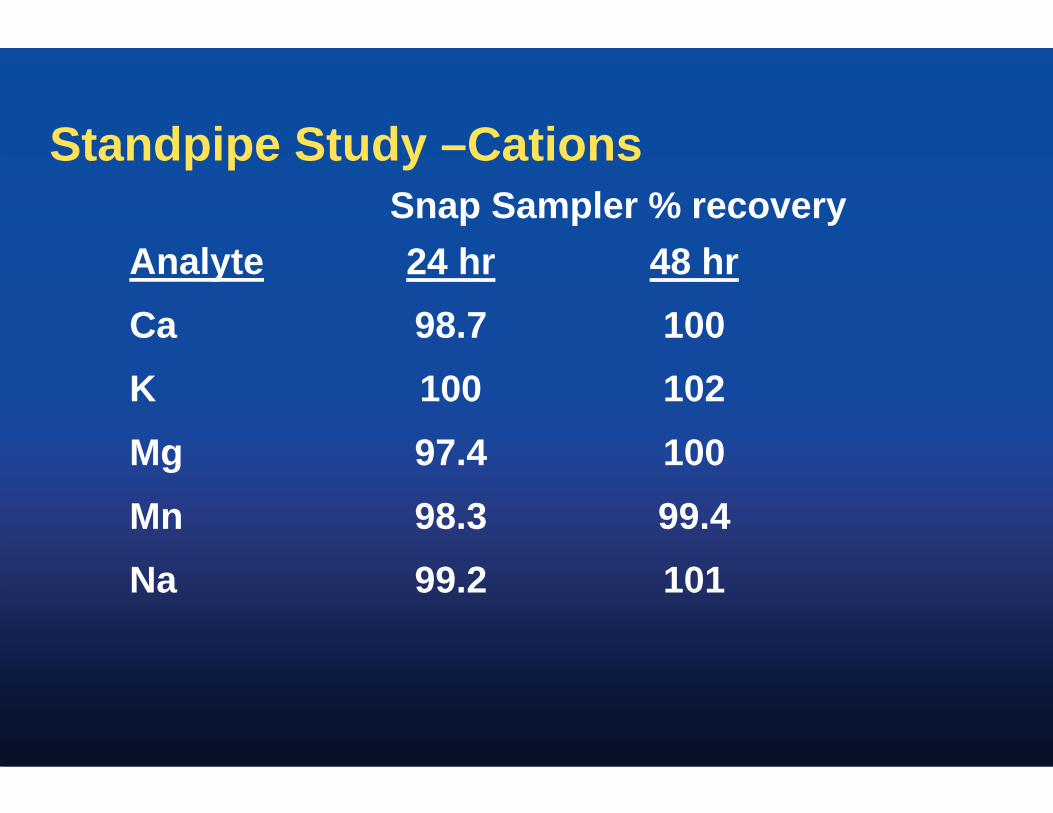
Standpipe Study –CationsSnap Sampler % recovery
10199.2Na99.498.3Mn10097.4Mg102100K10098.7Ca
48 hr24 hrAnalyte

Standpipe Study – Anions Snap Sampler % recovery
102102Sulfate106100.8Perchlorate
100.8100.0Nitrate10796.2Chloride
100.699.1Bromide48 hr24 hrAnalyte
Conclusion: Able to recover 99% or more of all anions and cations after equilibrating sampler
for 48 hours

CRREL Field Study – TCE (Parker & Mulherin 2007) Used CRREL 4-in. well contaminated w/ TCELow-flow samples collected with ¾-in. bladder pumpDeployed Snap Sampler at same depth as pump inlet
(1 VOA vial on trigger line)Equilibration time = 24 hrTriggered Snap Sampler closing sampler Collected low-flow samplesRemoved Snap Sampler from well and recovered
sample vialPlaced new vial in Snap Sampler & returned it to wellRepeated the process until 5 sets of samples were
collected Samples taken to lab & analyzed same day using
RP-HPLC (Parker and Ranney 2000)
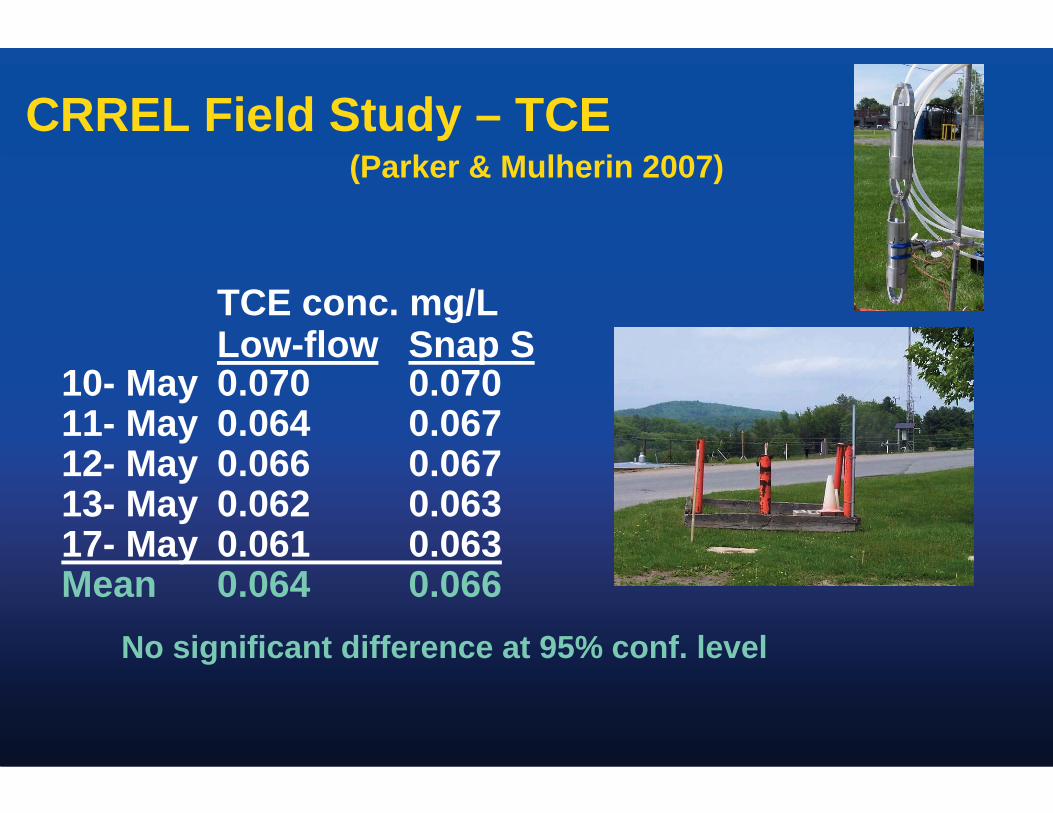
CRREL Field Study – TCE(Parker & Mulherin 2007)
TCE conc. mg/LLow-flow Snap S
10- May 0.070 0.07011- May 0.064 0.06712- May 0.066 0.06713- May 0.062 0.06317- May 0.061 0.063Mean 0.064 0.066
No significant difference at 95% conf. level
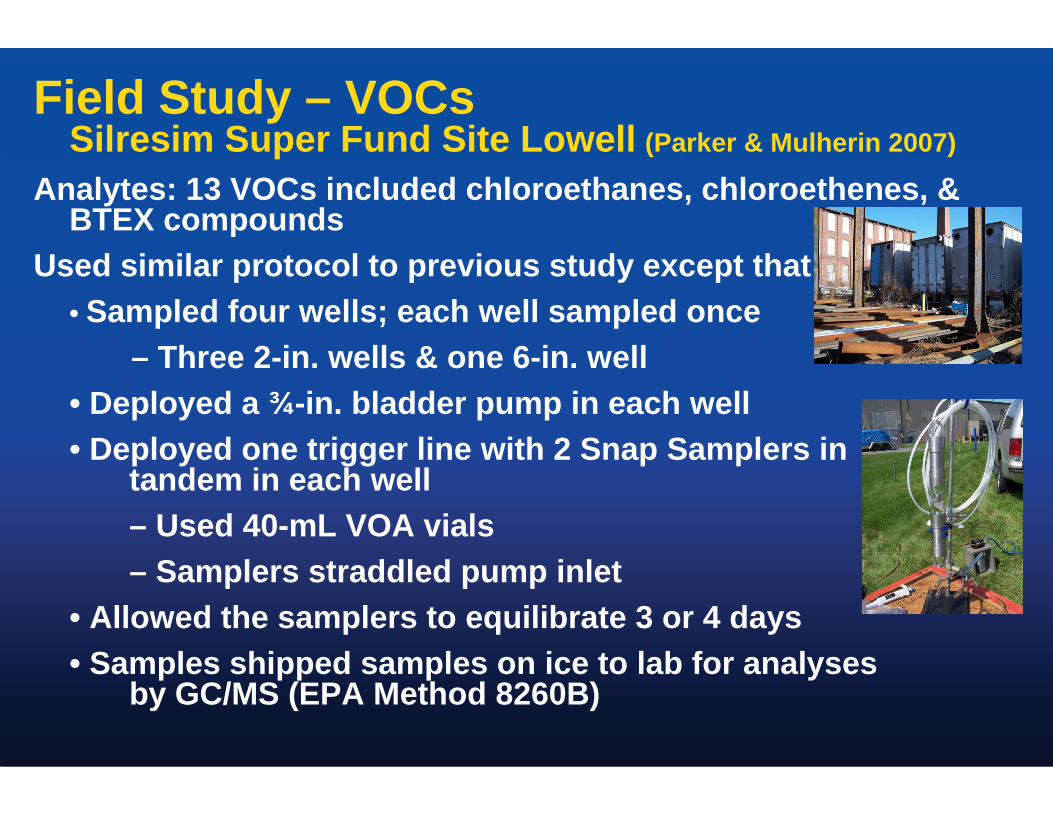
Field Study – VOCsSilresim Super Fund Site Lowell (Parker & Mulherin 2007)
Analytes: 13 VOCs included chloroethanes, chloroethenes, & BTEX compounds
Used similar protocol to previous study except that• Sampled four wells; each well sampled once
– Three 2-in. wells & one 6-in. well• Deployed a ¾-in. bladder pump in each well• Deployed one trigger line with 2 Snap Samplers in
tandem in each well – Used 40-mL VOA vials – Samplers straddled pump inlet
• Allowed the samplers to equilibrate 3 or 4 days• Samples shipped samples on ice to lab for analyses
by GC/MS (EPA Method 8260B)
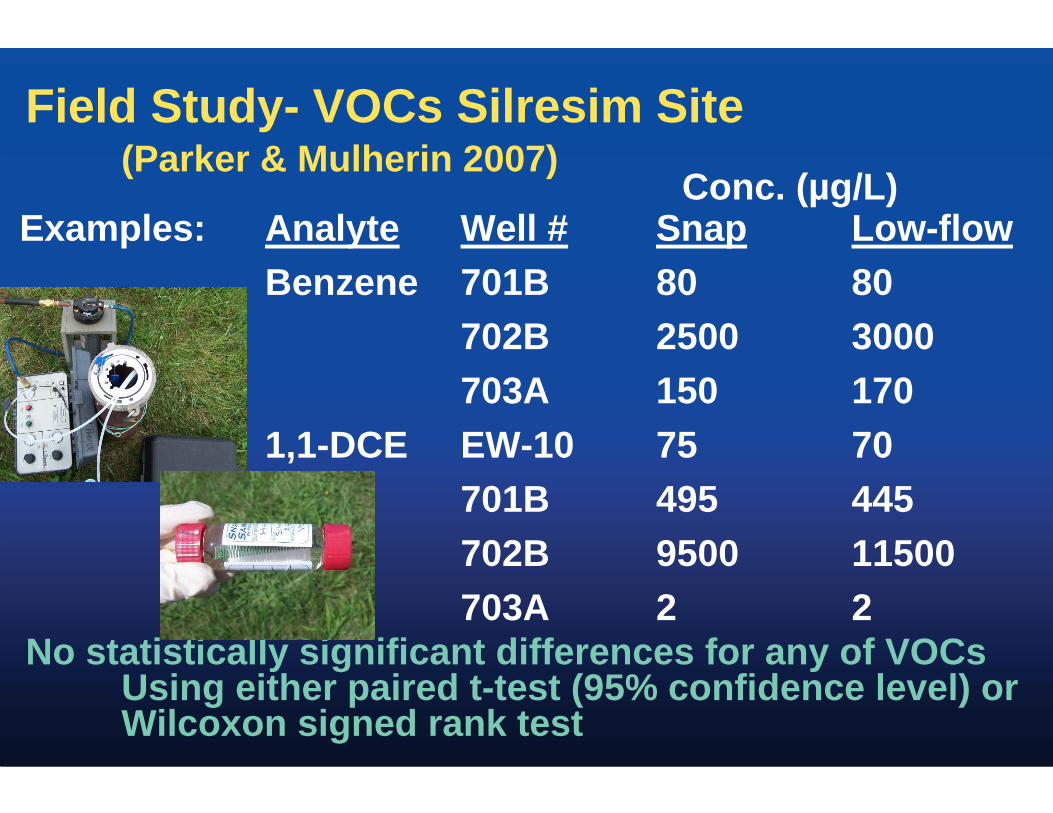
Field Study- VOCs Silresim Site(Parker & Mulherin 2007)
22703A115009500702B445495701B7075EW-101,1-DCE170150703A30002500702B8080701BBenzeneLow-flowSnapWell #Analyte
No statistically significant differences for any of VOCs Using either paired t-test (95% confidence level) or Wilcoxon signed rank test
Conc. (µg/L)Examples:
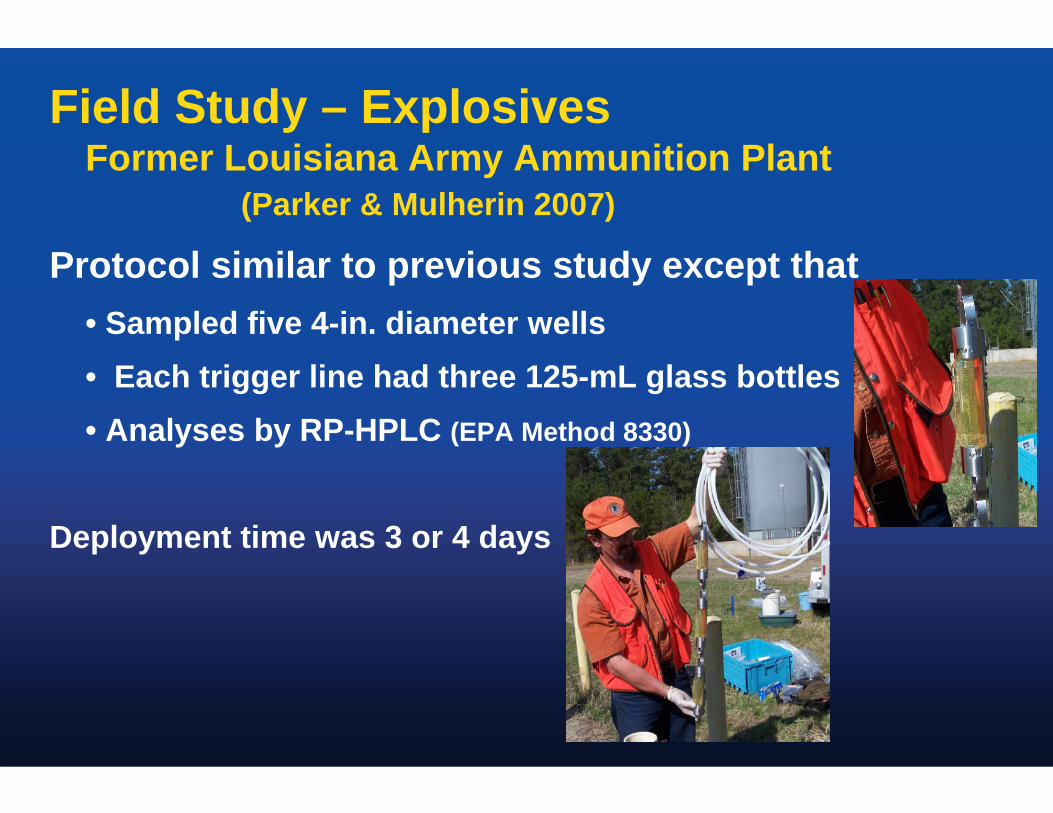
Field Study – Explosives Former Louisiana Army Ammunition Plant
(Parker & Mulherin 2007)
Protocol similar to previous study except that• Sampled five 4-in. diameter wells• Each trigger line had three 125-mL glass bottles • Analyses by RP-HPLC (EPA Method 8330)
Deployment time was 3 or 4 days

Field Study – Explosives (Parker & Mulherin 2007)
0.3120.3451.261.360.0790.0871400.6040.7495.375.430.4970.5261100.7710.8960.4070.3300.0310.0251080.6760.7364.284.300.4240.4481057.567.5016.916.62.182.39104SS LF*SS LF*SS LF*Well #
TNTRDXHMXMean Concentration (mg/L)
No significant difference for any of the 6 analytesat 95% confidence level using a paired t-test
* LF = Low-flow samples

ESTCP-Sponsored Demonstration at former Pease AFB
Analytes: Inorganics (As, Ca, Fe, Mg, Mn, K, & Na) Location: Newington & Portsmouth, NHGeology:
Unconsolidated Units: Fill, Upper Sand, Marine Clay & Silt, Lower Sand, & Glacial Till
Bedrock: Kittery or Elliot formationEight monitoring wells used in the study
Six 10-ft screens, one 5-ft screen, two 15-ft screensBottom of wells ranged from 13’ to 60’ bgsTop of screens were 2’ to 35’ below the water table
Area 13 Bulk fuel storage area 1 overburden well1 bedrock well
Area 32 Building 113 UST3 overburden wells3 bedrock wells

Pease Field Demonstration– InorganicsTen sampling events
Two wells sampled twiceDeployed at same depth
¾-in. bladder pump 1 RGC sampler 2 Snap samplers w/ baffle & weight
Deployment time 14 - 17 daysSamples collected
Snap Sampler, filtered & unfiltered RGC samplerLow-flow Purging & Sampling
filtered & unfilteredQA/QC samples
Field duplicates (10%) Matrix spikes & MSDs (5%)
Well Screen
Baffle
Snap Sampler
Trigger LinePump Tubing
Top Snap Sampler
RGC Sampler
Bottom Snap Sampler
Bladder Pump
Pump Intake & Sampling Level
Bottle Weight

Pease Field Demonstration Plan continuedSampling order
First two wells (32-6064, 32-5020)Snap (left in well), RGC, & low-flow
All remaining wellsSnap (left in well), low-flow, RGC
Chemical Analyses EPA Method 6020B, ICP/MS
Data AnalysesFor each analyte, concentrations in Snap Sampler were compared with concentrations in the low-flow samples & RGC samples
Filtered samples were compared with RGC samplesUnfiltered samples were compared w/ RGC samples
Statistical AnalysesRepeated Measures ANOVA (RM-ANOVA) orFreidman RM-ANOVA (non-parametric)
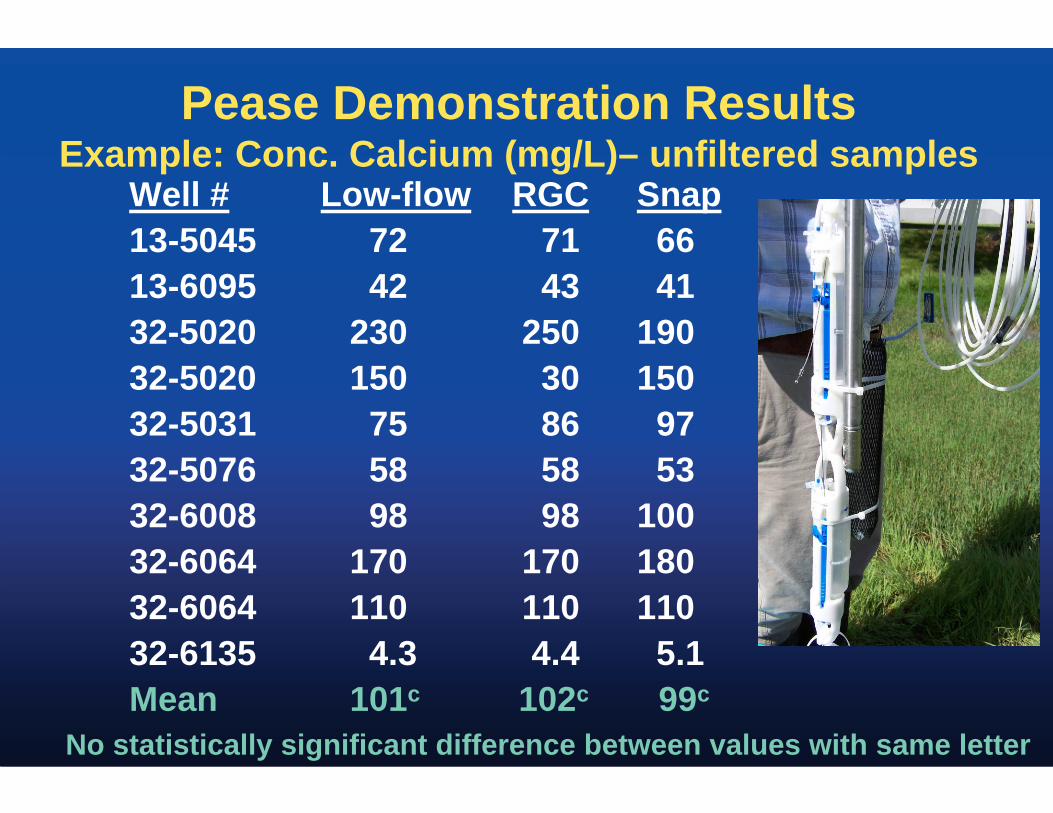
Pease Demonstration ResultsExample: Conc. Calcium (mg/L)– unfiltered samples
Well # Low-flow RGC Snap13-5045 72 71 6613-6095 42 43 4132-5020 230 250 19032-5020 150 30 15032-5031 75 86 9732-5076 58 58 5332-6008 98 98 10032-6064 170 170 18032-6064 110 110 11032-6135 4.3 4.4 5.1Mean 101c 102c 99c
No statistically significant difference between values with same letter
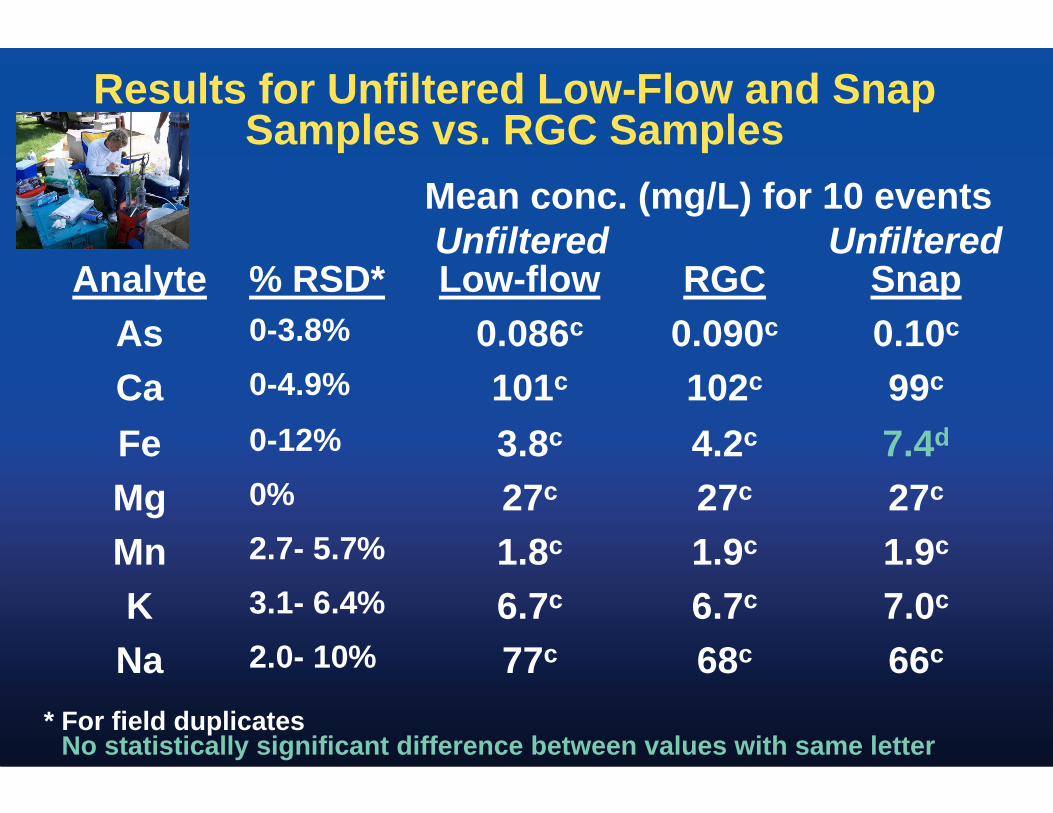
Results for Unfiltered Low-Flow and Snap Samples vs. RGC Samples
66c68c77c2.0- 10%Na7.0c6.7c6.7c3.1- 6.4%K1.9c1.9c1.8c2.7- 5.7%Mn27c27c27c0%Mg7.4d4.2c3.8c0-12%Fe99c102c101c0-4.9%Ca
0.10c0.090c0.086c0-3.8%AsSnapRGCLow-flow% RSD* Analyte
Mean conc. (mg/L) for 10 eventsUnfiltered Unfiltered
* For field duplicatesNo statistically significant difference between values with same letter
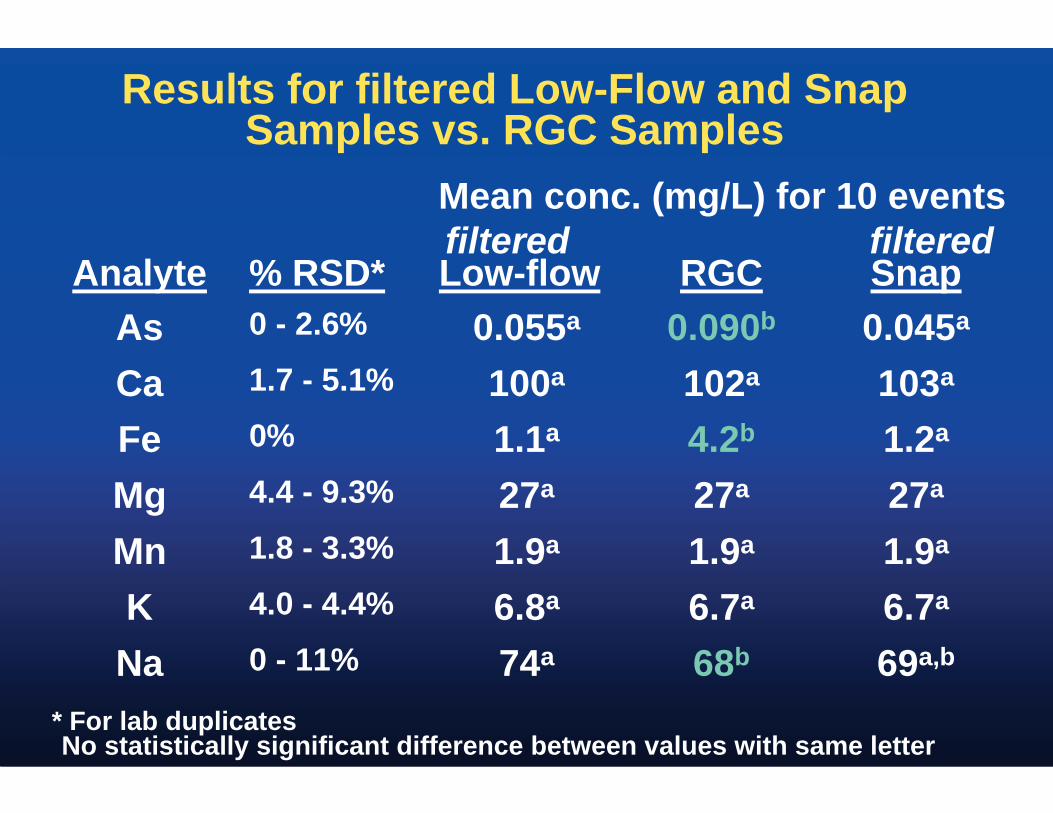
Results for filtered Low-Flow and Snap Samples vs. RGC Samples
69a,b68b74a0 - 11%Na6.7a6.7a6.8a4.0 - 4.4%K1.9a1.9a1.9a1.8 - 3.3%Mn27a27a27a4.4 - 9.3%Mg1.2a4.2b1.1a0%Fe103a102a100a1.7 - 5.1%Ca
0.045a0.090b0.055a0 - 2.6%AsSnapRGCLow-flow% RSD*Analyte
Mean conc. (mg/L) for 10 eventsfiltered filtered
* For lab duplicatesNo statistically significant difference between values with same letter

Summary of Findings from Demonstration at former Pease AFB
• Snap Sampler shown to be able to recover equivalent concentrations of inorganic analytes to those recovered using low-flow sampling
• True for both filtered and unfiltered samples,
–with possible exception of unfiltered Fe
• True for both bedrock and overburden wells

• Lab Studies Snap sampler samples compared with control samples– Able to recover equivalent concentrations of
explosives, with equilibration time of 1 day– Able to recover equivalent concentrations of VOCs,
with equilibration time of ~3 days– Able to recover equivalent concentrations of metals,
with equilibration times of 1 to 2 days
• Field Studies Snap Sampler samples compared with samples taken using EPA’s low-flow purging & sampling method– Able to recover equivalent concentrations of VOCs – Able to recover equivalent concentrations of
explosives– Able to recover equivalent concentrations of inorganics
Final Conclusions

Thanks to our sponsors!ESTCP, Dr. Andrea Leeson, Environmental
Restoration Program ManagerERDC, Dr. Denise MacMillan, Program Manager
To contact Louise Parker:[email protected]
To download Parker & Mulherin (2007): Go to our website
http://www.crrel.usace.army.mil/ & go to technical publications
For additional information on this & other passive samplers:
http://www.itrcweb.org/Questions?