Embed Size (px)
Citation preview
ResultsFor the half year ended 25 March 2016
2
HIGHLIGHTS
Strong growth driven by food to go businesses
Sustained investment in capacity and capability
Further enhancements to strong commercial pipeline
FINANCIAL REVIEW
Alan WilliamsChief Financial Officer
4
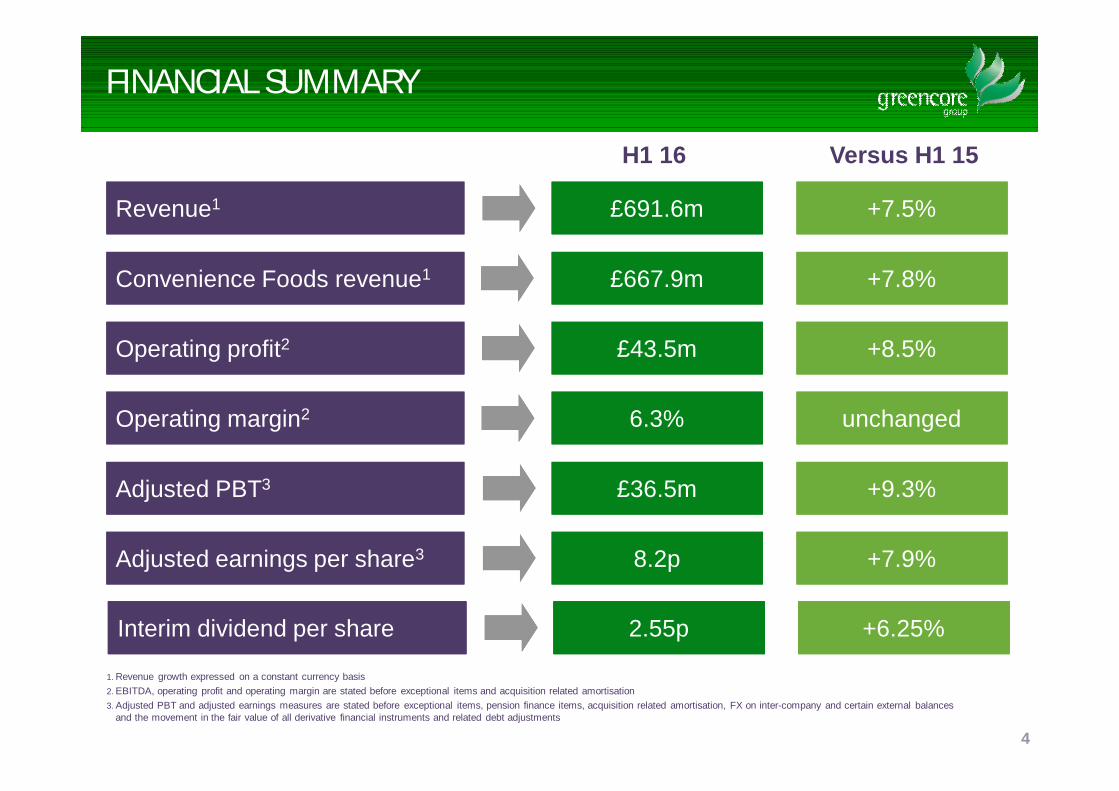
FINANCIAL SUMMARY
£691.6m£691.6mRevenue1Revenue1 +7.5%+7.5%
8.2p8.2pAdjusted earnings per share3Adjusted earnings per share3 +7.9%+7.9%
H1 16 Versus H1 15
£43.5m£43.5mOperating profit2Operating profit2 +8.5%+8.5%
6.3%6.3%Operating margin2Operating margin2 unchangedunchanged
1. Revenue growth expressed on a constant currency basis2. EBITDA, operating profit and operating margin are stated before exceptional items and acquisition related amortisation3. Adjusted PBT and adjusted earnings measures are stated before exceptional items, pension finance items, acquisition related amortisation, FX on inter-company and certain external balances
and the movement in the fair value of all derivative financial instruments and related debt adjustments
+9.3%+9.3%£36.5m£36.5mAdjusted PBT3Adjusted PBT3
£667.9m£667.9mConvenience Foods revenue1Convenience Foods revenue1 +7.8%+7.8%
[2.55p][2.55p]Interim dividend per shareInterim dividend per share +6.25%+6.25%2.55p2.55pInterim dividend per shareInterim dividend per share +6.25%+6.25%
H1 16£m
H1 15£m % change
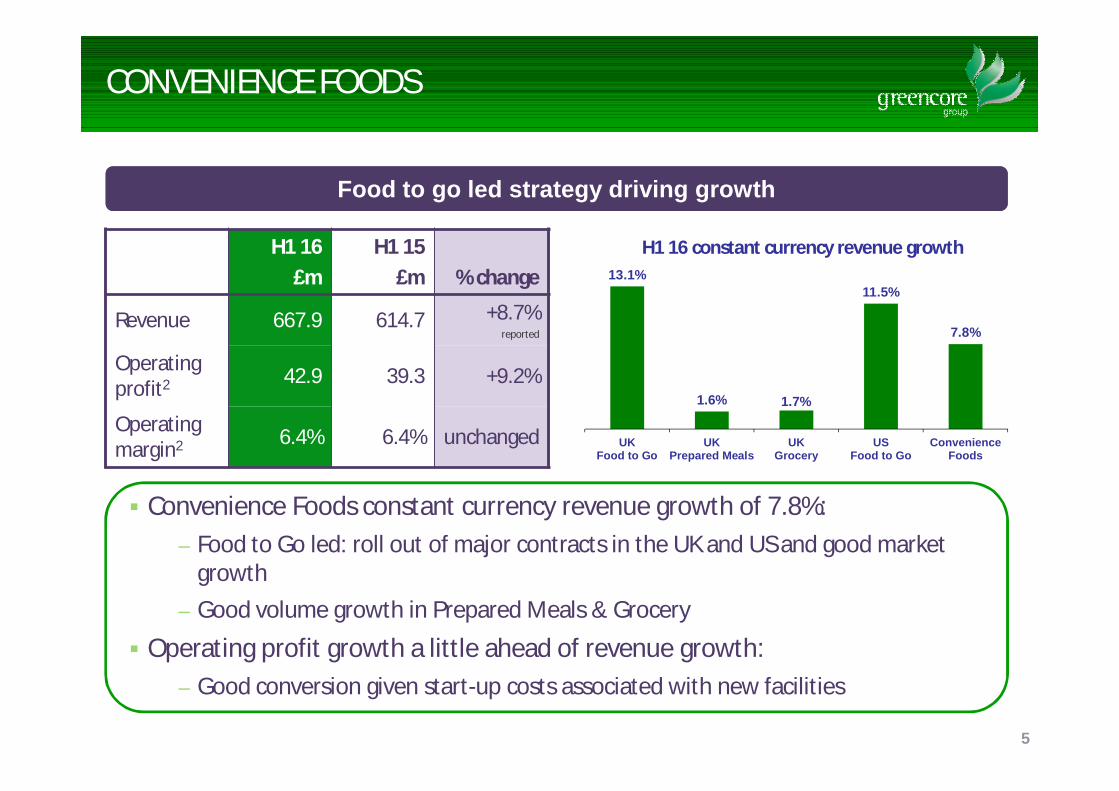
Revenue 667.9 614.7 +8.7%reported
Operating profit2 42.9 39.3 +9.2%
Operating margin2 6.4% 6.4% unchanged
CONVENIENCE FOODS
Convenience Foods constant currency revenue growth of 7.8%:– Food to Go led: roll out of major contracts in the UK and US and good market
growth– Good volume growth in Prepared Meals & Grocery
Operating profit growth a little ahead of revenue growth:– Good conversion given start-up costs associated with new facilities
5
Food to go led strategy driving growthFood to go led strategy driving growth
13.1%
1.6% 1.7%
11.5%
7.8%
UKFood to Go
UKPrepared Meals
UKGrocery
USFood to Go
ConvenienceFoods
H1 16 constant currency revenue growth
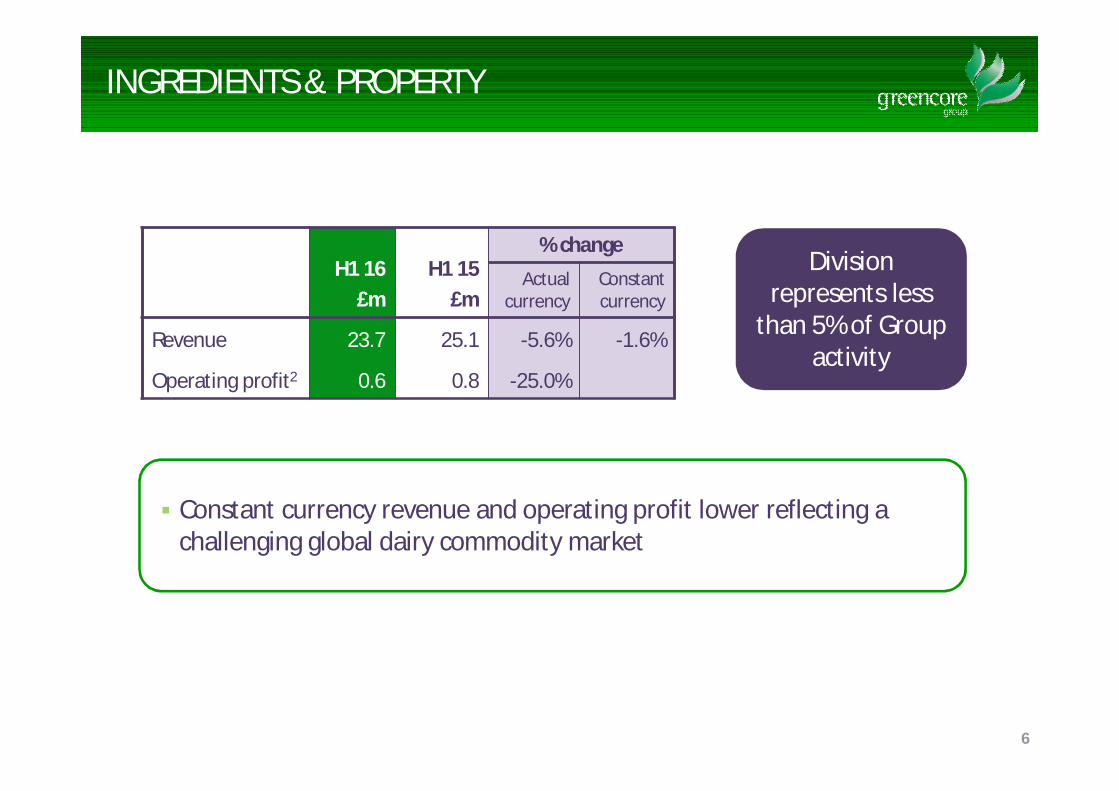
INGREDIENTS & PROPERTY
H1 16£m
H1 15£m
% changeActual
currencyConstant currency
Revenue 23.7 25.1 -5.6% -1.6%
Operating profit2 0.6 0.8 -25.0%
Division represents less
than 5% of Group activity
Constant currency revenue and operating profit lower reflecting a challenging global dairy commodity market
6
7
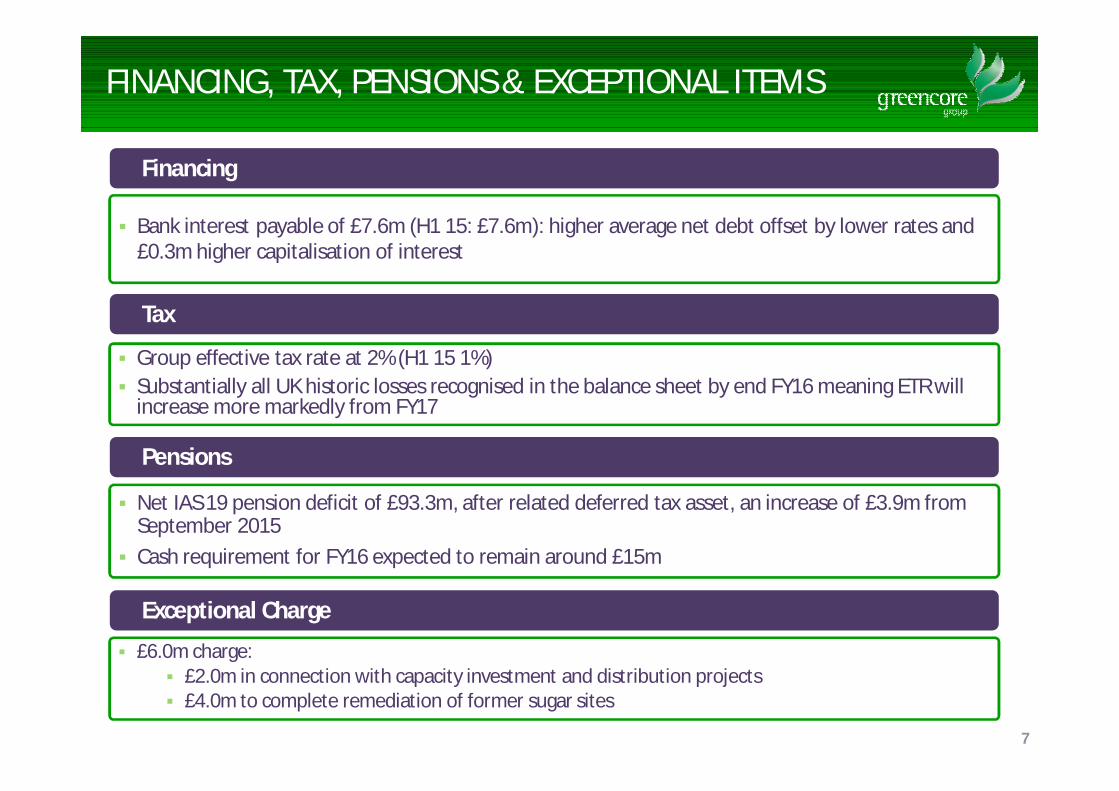
FINANCING, TAX, PENSIONS & EXCEPTIONAL ITEMS
Bank interest payable of £7.6m (H1 15: £7.6m): higher average net debt offset by lower rates and £0.3m higher capitalisation of interest
Financing
Group effective tax rate at 2% (H1 15 1%) Substantially all UK historic losses recognised in the balance sheet by end FY16 meaning ETR will
increase more markedly from FY17
Tax
Net IAS 19 pension deficit of £93.3m, after related deferred tax asset, an increase of £3.9m from September 2015
Cash requirement for FY16 expected to remain around £15m
Pensions
£6.0m charge: £2.0m in connection with capacity investment and distribution projects £4.0m to complete remediation of former sugar sites
Exceptional Charge
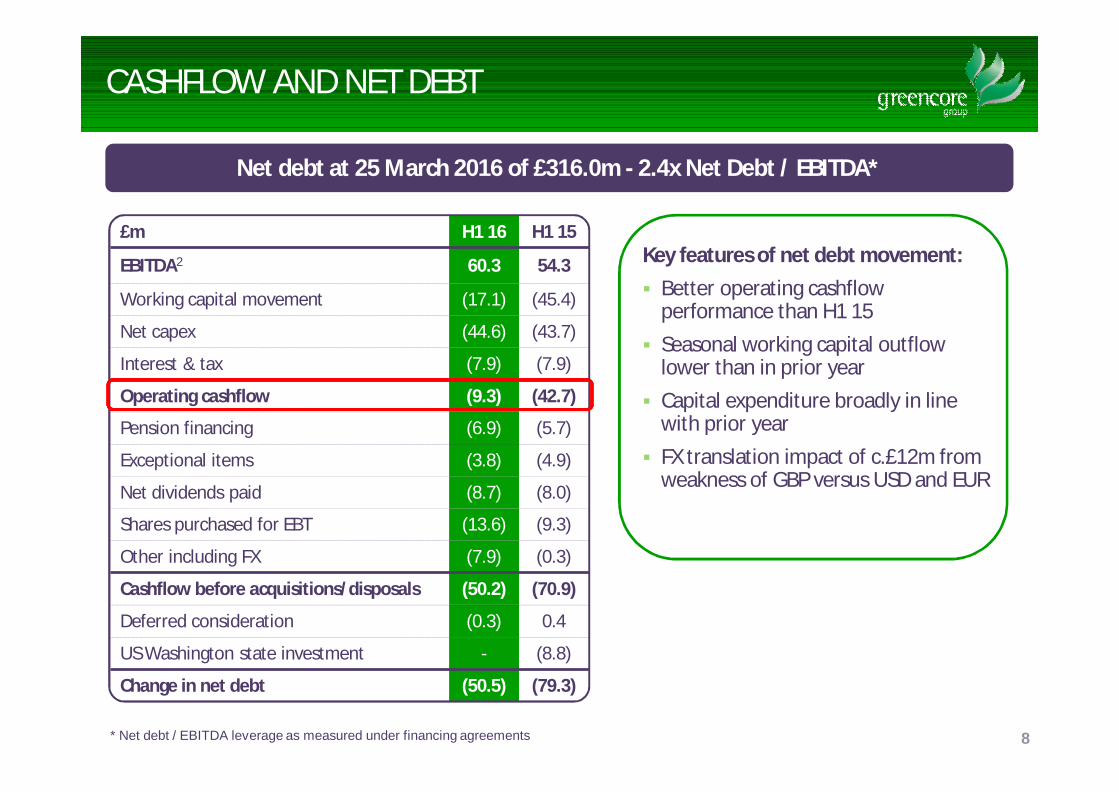
£m H1 16 H1 15
EBITDA2 60.3 54.3
Working capital movement (17.1) (45.4)
Net capex (44.6) (43.7)
Interest & tax (7.9) (7.9)
Operating cashflow (9.3) (42.7)
Pension financing (6.9) (5.7)
Exceptional items (3.8) (4.9)
Net dividends paid (8.7) (8.0)
Shares purchased for EBT (13.6) (9.3)
Other including FX (7.9) (0.3)
Cashflow before acquisitions/disposals (50.2) (70.9)
Deferred consideration (0.3) 0.4
US Washington state investment - (8.8)
Change in net debt (50.5) (79.3)
CASHFLOW AND NET DEBT
8
Net debt at 25 March 2016 of £316.0m - 2.4x Net Debt / EBITDA*
Key features of net debt movement: Better operating cashflow
performance than H1 15 Seasonal working capital outflow
lower than in prior year Capital expenditure broadly in line
with prior year FX translation impact of c.£12m from
weakness of GBP versus USD and EUR
* Net debt / EBITDA leverage as measured under financing agreements
BORROWINGS PROFILE
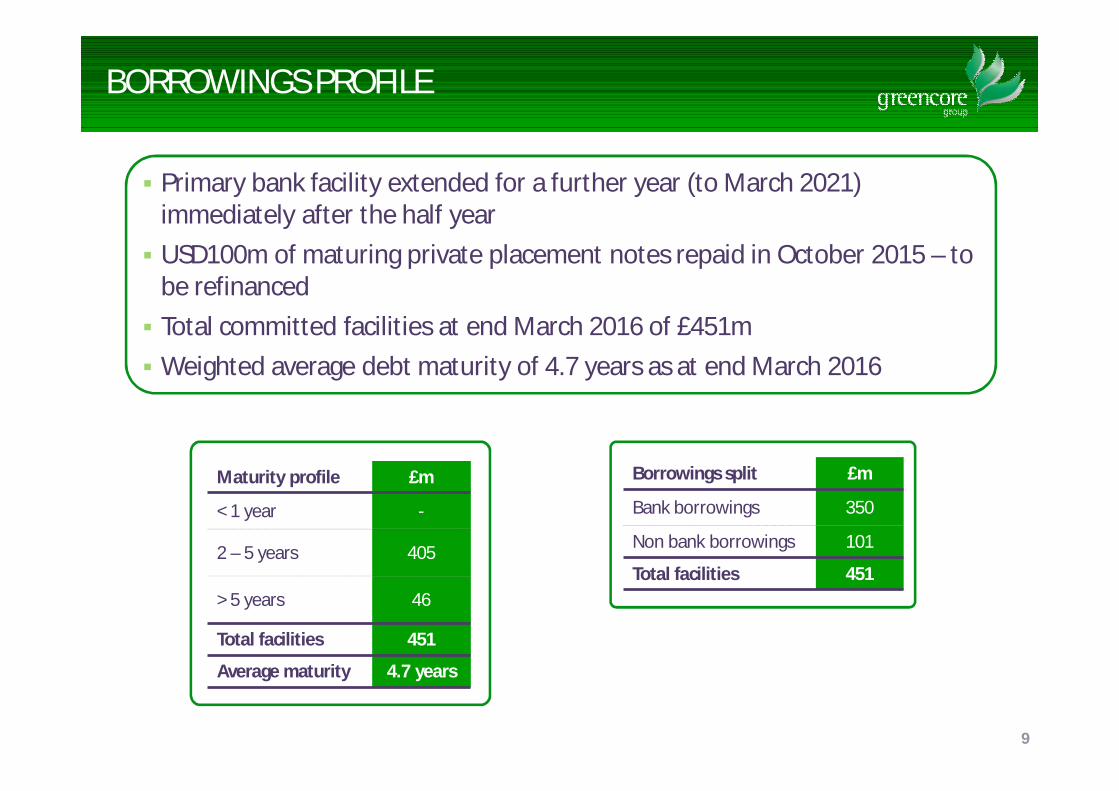
Primary bank facility extended for a further year (to March 2021) immediately after the half year USD100m of maturing private placement notes repaid in October 2015 – to
be refinanced Total committed facilities at end March 2016 of £451m Weighted average debt maturity of 4.7 years as at end March 2016
9
Maturity profile £m
< 1 year -
2 – 5 years 405
> 5 years 46
Total facilities 451
Average maturity 4.7 years
Borrowings split £m
Bank borrowings 350
Non bank borrowings 101
Total facilities 451
10
SUMMARY FINANCIAL PERFORMANCE
Strong revenue growth driven by food to go businesses
Operating profit growth of 8.5% and margin maintained despite pressure from start-up costs and capability investments
Adjusted EPS up 7.9% versus H1 15
OPERATING REVIEW AND OUTLOOK
Patrick CoveneyChief Executive Officer
12
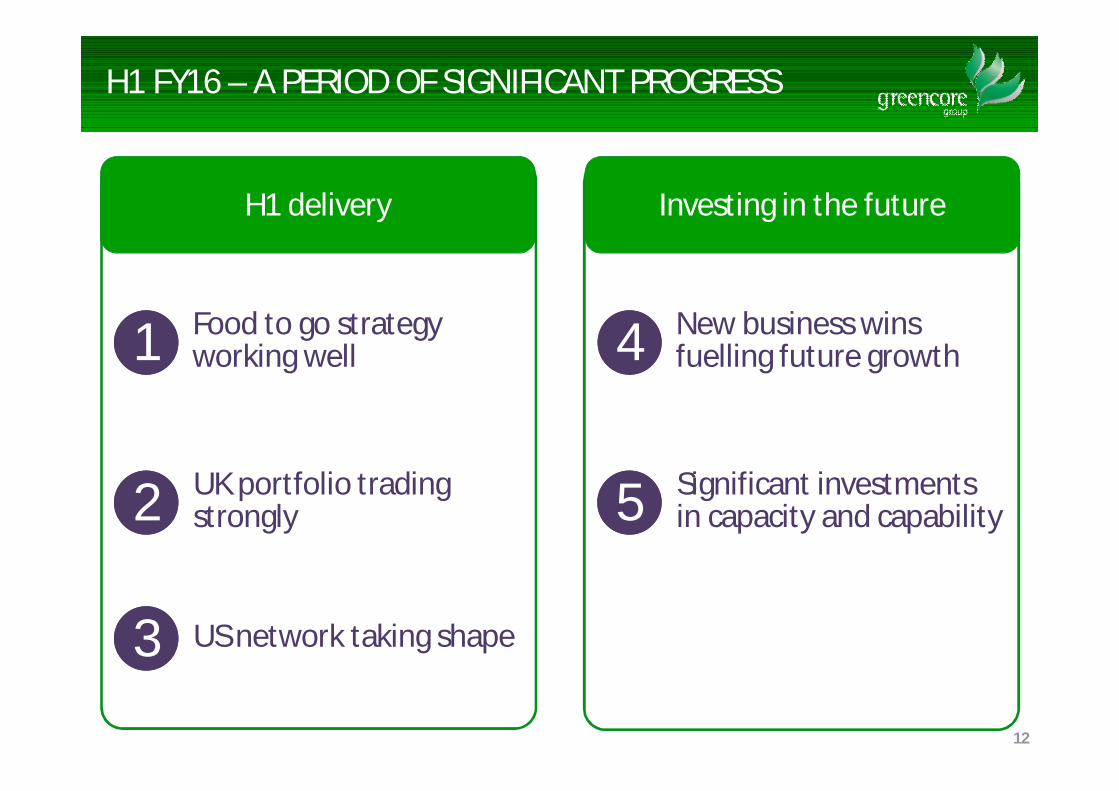
H1 FY16 – A PERIOD OF SIGNIFICANT PROGRESS
Food to go strategy working well11
UK portfolio trading strongly22
33 US network taking shape
New business wins fuelling future growth44
Significant investments in capacity and capability55
H1 delivery Investing in the future
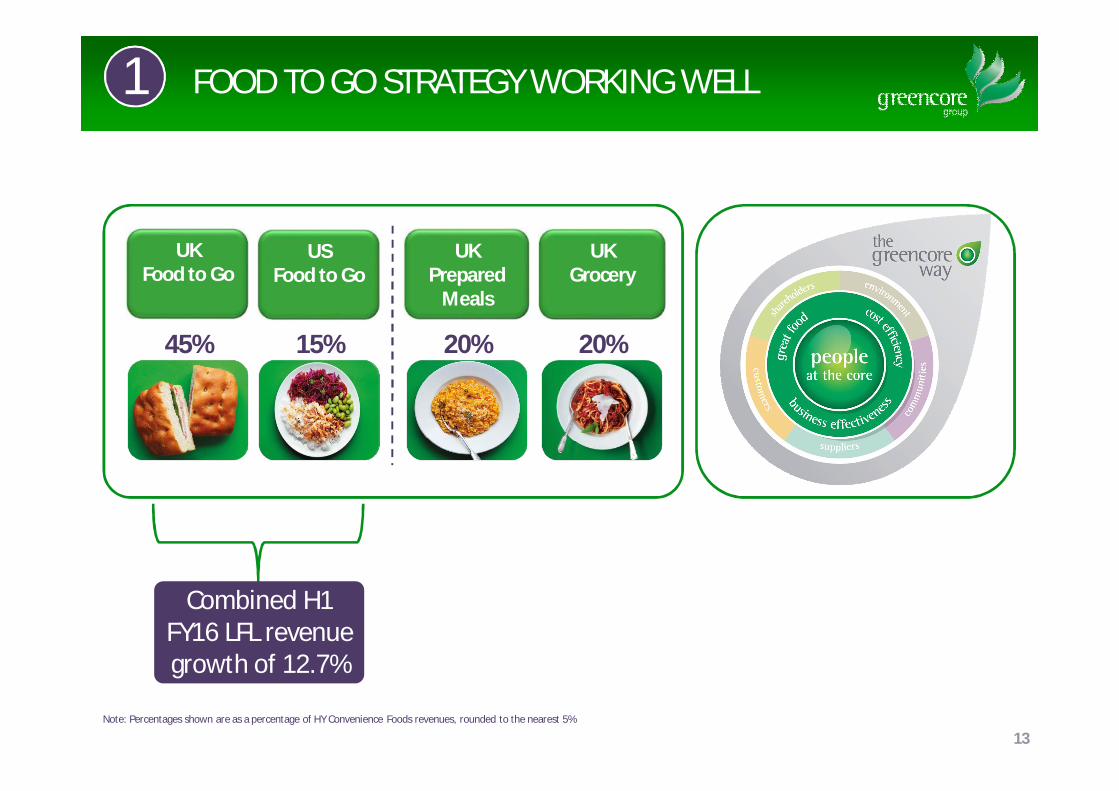
FOOD TO GO STRATEGY WORKING WELL
UKFood to Go
45%
US Food to Go
15%
UK Prepared
Meals
20%
UK Grocery
20%
13Note: Percentages shown are as a percentage of HY Convenience Foods revenues, rounded to the nearest 5%
Combined H1FY16 LFL revenue growth of 12.7%
11
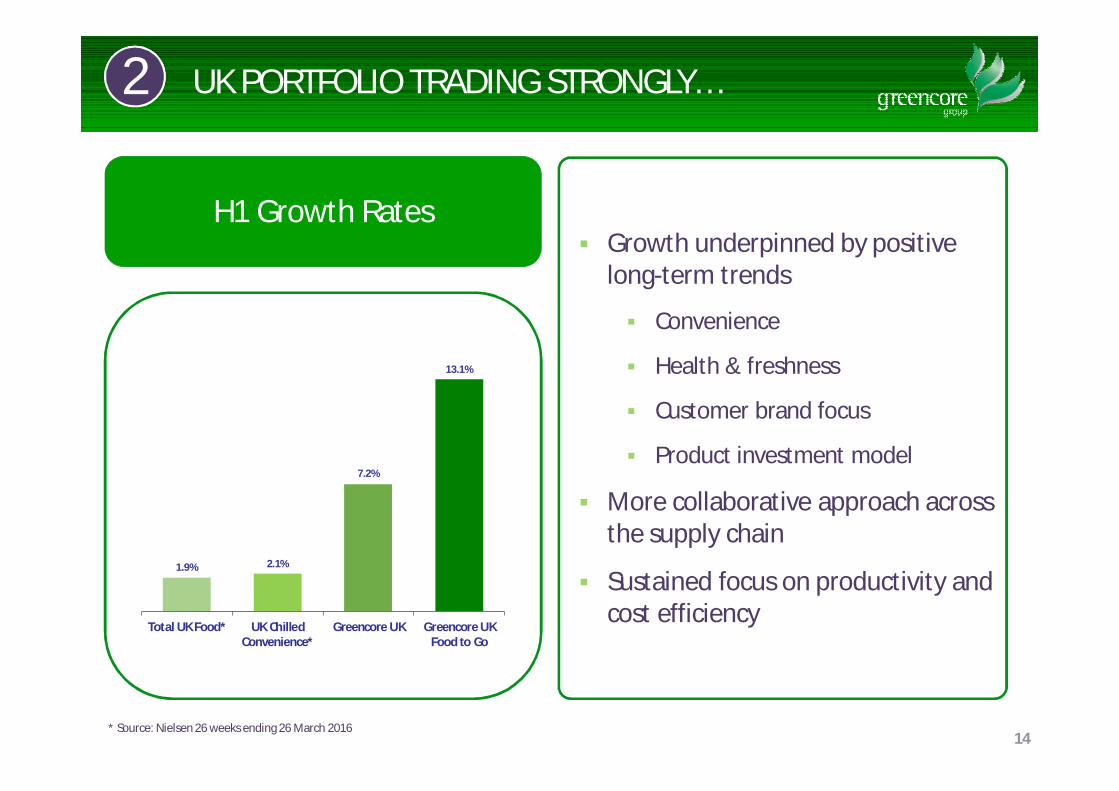
1.9% 2.1%
7.2%
13.1%
Total UK Food* UK ChilledConvenience*
Greencore UK Greencore UKFood to Go
UK PORTFOLIO TRADING STRONGLY…
14
22
Growth underpinned by positive long-term trends
Convenience
Health & freshness
Customer brand focus
Product investment model
More collaborative approach across the supply chain
Sustained focus on productivity and cost efficiency
* Source: Nielsen 26 weeks ending 26 March 2016
H1 Growth Rates
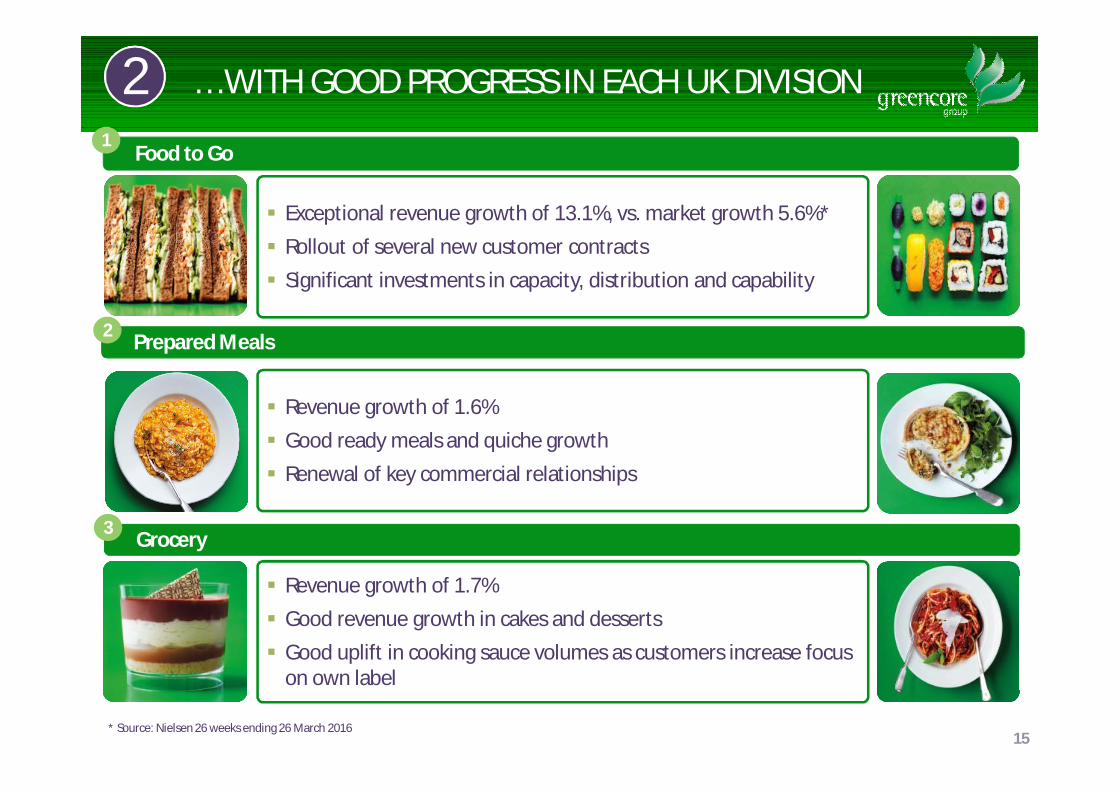
Exceptional revenue growth of 13.1%, vs. market growth 5.6%* Rollout of several new customer contracts Significant investments in capacity, distribution and capability
Revenue growth of 1.6% Good ready meals and quiche growth Renewal of key commercial relationships
Revenue growth of 1.7% Good revenue growth in cakes and desserts Good uplift in cooking sauce volumes as customers increase focus
on own label
Grocery3
Food to Go1
Prepared Meals2
… WITH GOOD PROGRESS IN EACH UK DIVISION22
* Source: Nielsen 26 weeks ending 26 March 201615
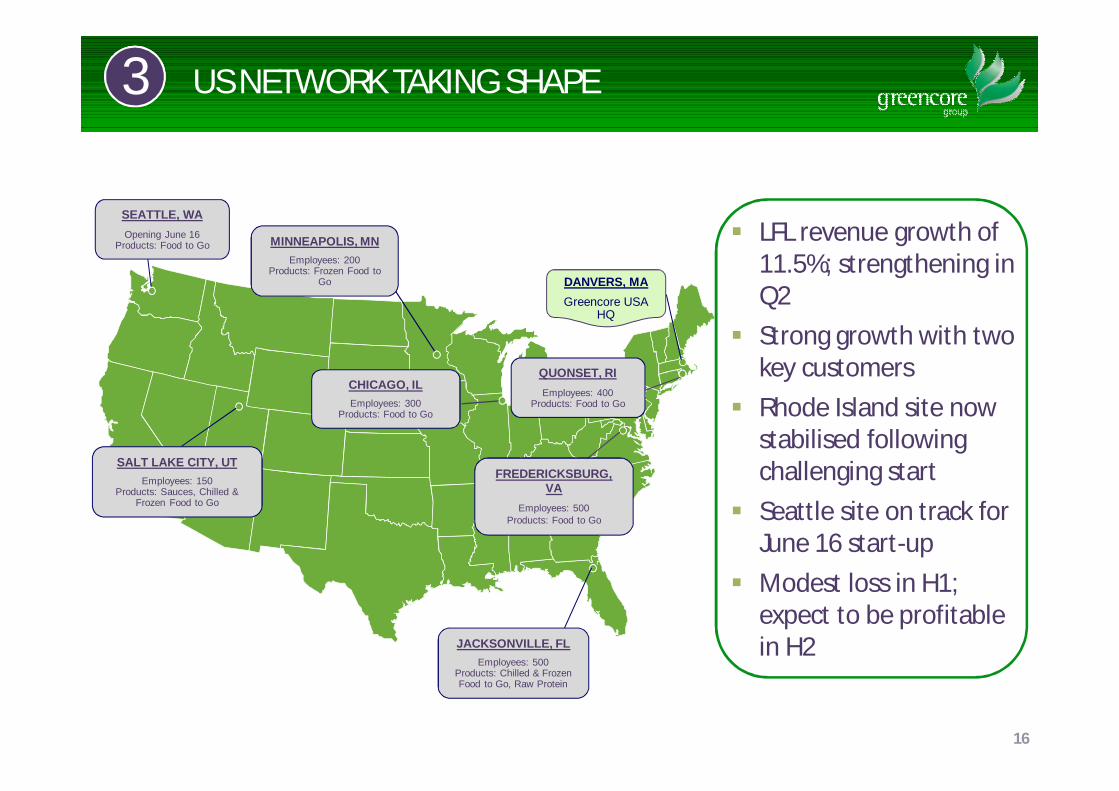
GREENCORE USA - GEOGRAPHIC FOOTPRINT
SALT LAKE CITY, UTEmployees: 150
Products: Sauces, Chilled & Frozen Food to Go
CHICAGO, ILEmployees: 300
Products: Food to Go
FREDERICKSBURG, VA
Employees: 500Products: Food to Go
DANVERS, MAGreencore USA
HQ
JACKSONVILLE, FLEmployees: 500
Products: Chilled & Frozen Food to Go, Raw Protein
QUONSET, RIEmployees: 400
Products: Food to Go
MINNEAPOLIS, MNEmployees: 200
Products: Frozen Food to Go
SEATTLE, WAOpening June 16
Products: Food to Go
US NETWORK TAKING SHAPE
16
33
LFL revenue growth of 11.5%; strengthening in Q2
Strong growth with two key customers
Rhode Island site now stabilised following challenging start
Seattle site on track for June 16 start-up
Modest loss in H1; expect to be profitable in H2
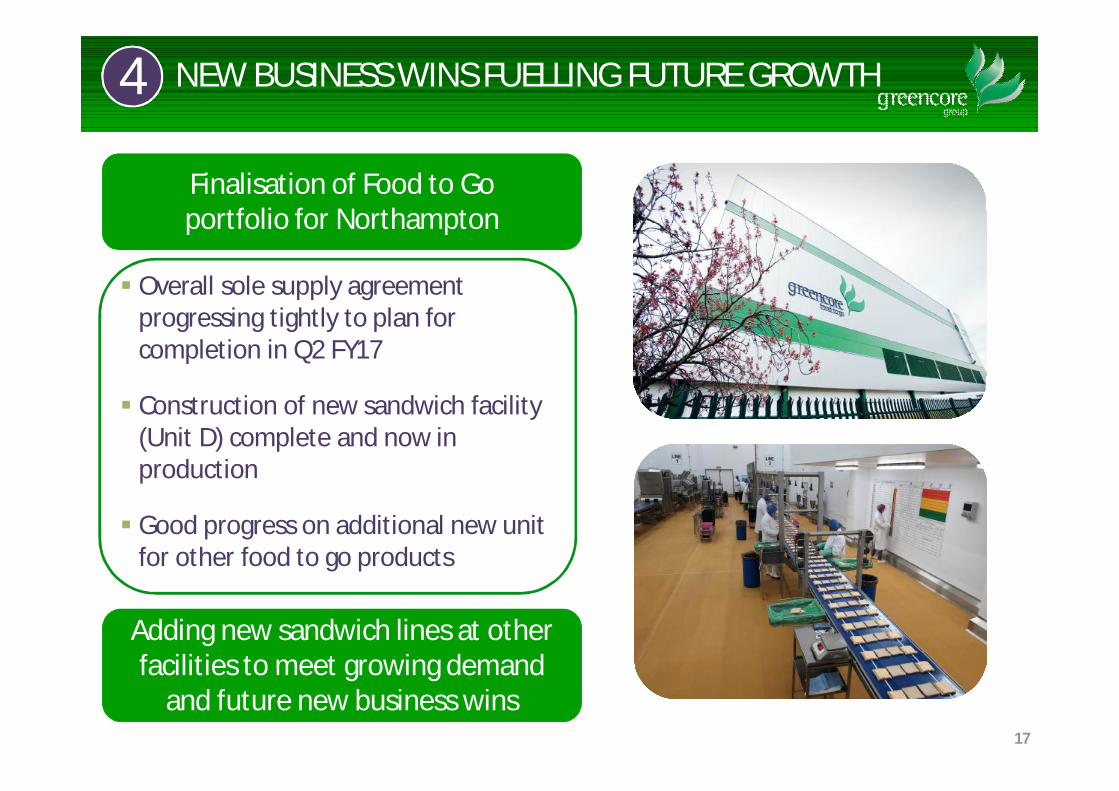
NEW BUSINESS WINS FUELLING FUTURE GROWTH
17
44
Finalisation of Food to Go portfolio for Northampton
Overall sole supply agreement progressing tightly to plan for completion in Q2 FY17
Construction of new sandwich facility (Unit D) complete and now in production
Good progress on additional new unit for other food to go products
Adding new sandwich lines at other facilities to meet growing demand
and future new business wins
18
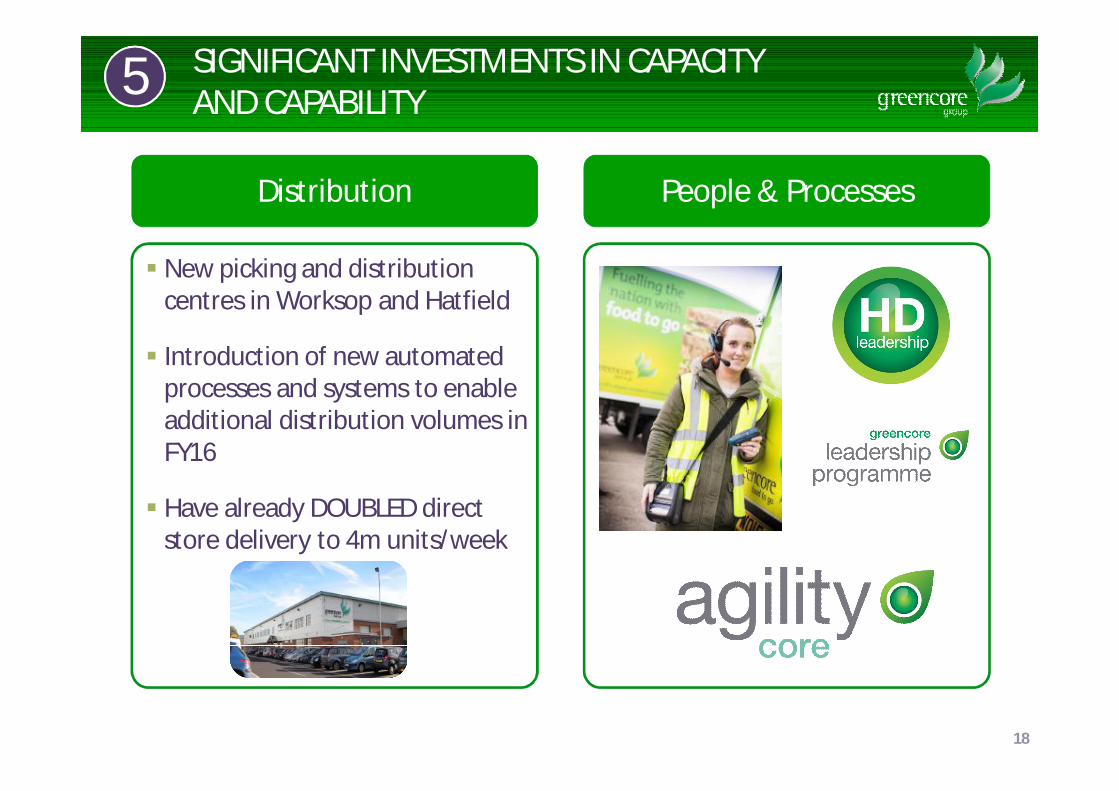
SIGNIFICANT INVESTMENTS IN CAPACITY AND CAPABILITY55
Distribution People & Processes
New picking and distribution centres in Worksop and Hatfield
Introduction of new automated processes and systems to enable additional distribution volumes in FY16
Have already DOUBLED direct store delivery to 4m units/week
19
SUMMARY AND OUTLOOK
Strong performance in H1 16 led by food to go
strategy and growth
Significant step-up in capability and capacity
investments to enable new business growth
Challenging industry and political backdrop
Confident in ability to deliver performance in
line with market expectations