Embed Size (px)
Citation preview

Results Presentation
For the year ended 31 March 201716 May 2017

Disclaimer
1
This presentation does not constitute an invitation to underwrite, subscribe for or otherwise acquire or dispose of any shares or other securities of DCC plc (“DCC”).
This presentation contains some forward-looking statements that represent DCC’s expectations for its business, based on current expectations about future events,which by their nature involve risk and uncertainty. DCC believes that its expectations and assumptions with respect to these forward-looking statements are reasonable;however because they involve risk and uncertainty as to future circumstance, which are in many cases beyond DCC’s control, actual results or performance may differmaterially from those expressed or implied by such forward-looking statements. DCC undertakes no duty to and will not necessarily update any such statements in lightof new information or future events, except to the extent required by any applicable law or regulation. Recipients of this presentation are therefore cautioned that anumber of important factors could cause actual results or outcomes to differ materially from those expressed in or implied by any forward-looking statements.
Any statement in this presentation which infers that transactions may be earnings accretive does not constitute a profit forecast and should not be interpreted to meanthat DCC’s earnings or net assets in the first full financial year following the transactions, nor in any subsequent period, would necessarily match or be greater than thosefor the relevant preceding financial year.
Your attention is drawn to the risk factors referred to in the Principal Risks and Uncertainties section of DCC’s Annual Report. These risks and uncertainties do notnecessarily comprise all the risk factors associated with DCC and/or any recently acquired businesses. There may be other risks which may have an adverse effect on thebusiness, financial condition, results or future prospects of DCC. In particular, it should be borne in mind that past performance is no guide to future performance.Persons needing advice should contact an independent financial advisor.
DCC Results Presentation – 16 May 2017
Agenda
2
• Introduction and highlights
• Business review
• Financial review
• Summary and Q&A
DCC Results Presentation – 16 May 2017

Highlights
3
For the year ending 31 March 2017
• Year of strong growth and development in DCC
• Group operating profit on continuing basis up 20.9% (12.8% ccy) to £345.0 million - all divisions recording strong growth
• Adj. EPS on continuing basis up 18.1% (10.3% ccy) to 286.6p
• Final dividend increase of 16.3% results in 15% increase for the year - 23rd consecutive year of dividend growth since DCC listed in 1994
• Excellent cash flow performance, with free cash flow conversion of 114% and a return on total capital employed of 20.3%
DCC Results Presentation – 16 May 2017

Highlights
4
For the year ending 31 March 2017
• Very active period for acquisition activity with over £550m committed
• Esso Retail Norway
• Shell Hong Kong & Macau
• Further activity across Energy, Healthcare and Technology
• Including Gaz Européen, Hammer and Medisource
• Agreed disposal of Environmental division for £219m brings increased strategic focus to the Group
DCC Results Presentation – 16 May 2017

Financial summary
5
For the year ending 31 March 2017
DCC Results Presentation – 16 May 2017
£’m 2017 2016 % change
Revenue – continuing1 12,270 10,448 +17.4%
Operating profit2 – continuing1 345.0 285.3 +20.9%
Group operating profit2 363.6 300.5 +21.0%
Adjusted EPS2 – continuing1 286.6 pence 242.8 pence +18.1%
Total adjusted EPS2 303.7 pence 257.1 pence +18.1%
Free cash flow3 415.5 291.1 +42.7%
Net debt 121.9 54.5
Dividend per share 111.80 pence 97.22 pence +15.0%
ROCE - continuing1 20.3% 21.9%
1 Excluding DCC Environmental, the agreed disposal of which was announced on 5 April 20172 Excluding net exceptionals and amortisation of intangible assets3 After net capital expenditure and before net exceptionals, interest and tax payments

Acquisitions and capital expenditure
6
For the year ending 31 March 2017
DCC Results Presentation – 16 May 2017
£’m Acquisitions Capex Total
DCC Energy 461.3 79.9 541.2
DCC Healthcare 28.4 8.0 36.4
DCC Technology 64.2 36.9 101.1
Continuing operations 553.9 124.8 678.7
DCC Environmental - 6.6 6.6
Total 553.9 131.4 685.3

Business review
Tommy BreenChief Executive
Divisional results
8
For the year ending 31 March 2017
DCC Results Presentation – 16 May 2017
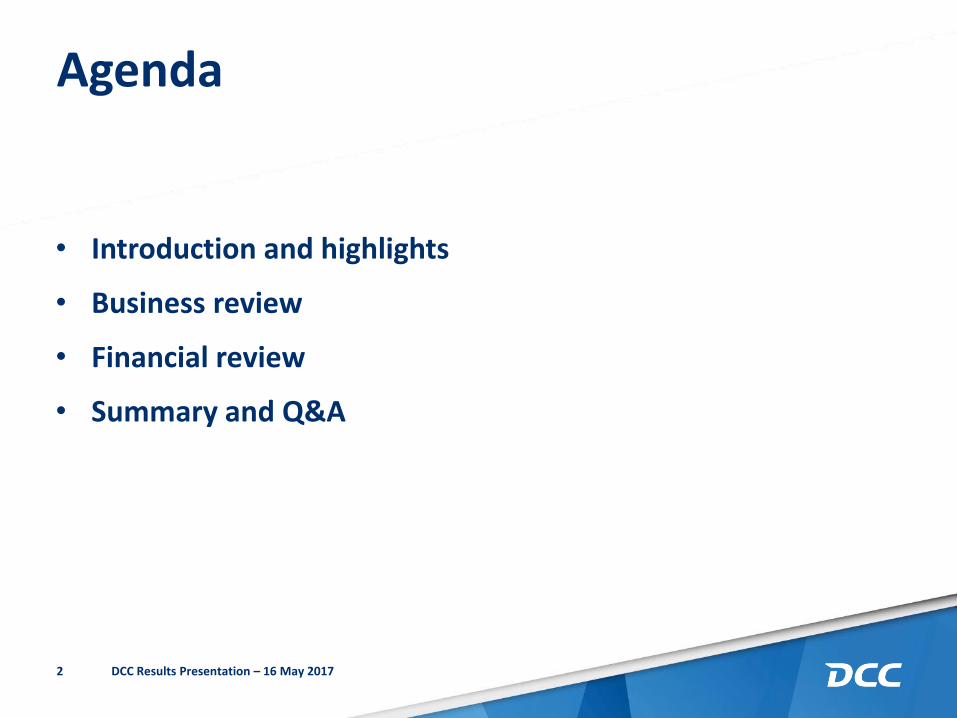
1 Excluding net exceptionals and amortisation of intangible assets2 Excluding DCC Environmental, the agreed disposal of which was announced on 5 April 2017
£’m 2017 2016 % change% ccy
change
Operating profit1
DCC Energy 254.9 205.2 +24.3% +13.9%
DCC Healthcare 49.0 45.0 +8.7% +8.0%
DCC Technology 41.1 35.1 +17.1% +12.5%
Continuing operations2 345.0 285.3 +20.9% +12.8%
Discontinued (Environmental) 18.6 15.2 +22.2% +22.3%
Group operating profit1 363.6 300.5 +21.0% +13.3%
By Division2
74%
14%
12%Energy
Healthcare
Technology
By Geography2
52%43%
5%ContinentalEurope/other
UK
Ireland

DCC Energy
9 DCC Results Presentation – 16 May 2017
2017 2016 % change
Volume (bn litres) 14.649 13.021 +12.5%
Operating profit (£’m) 254.9 205.2 +24.3%
Operating profit / litre 1.74p 1.58p
ROCE 21.6% 24.4%
Operating profit:
63%
37% LPG
Retail & Oil
• Excellent year of growth and development with operating profits up 24.3% (13.9% ccy)
• LPG business had an excellent year, with operating profit growth of 37.4% (23.6% ccy)
• Organic volume growth of 6.1% broadly based, reflecting strong performance with commercial and industrial customers in particular
• Benefited from full year of Butagaz and from acquisition of Gaz Européen in January 2017
• Good margin performance, particularly in light of higher product price environment
• Natural gas development and investment in France to leverage the Butagaz brand
• Agreed acquisition of Shell Hong Kong & Macau provides strong market position and development platform in Asia over the medium term

DCC Energy
10 DCC Results Presentation – 16 May 2017
Operating profit:
• Retail & Oil business had a good year, operating profits up 6.9% (1.2% ccy)
• Volume growth of 7.9% driven by full year contribution of Esso Retail France and acquisition of Dansk Fuels in November 2016. Organic volumes in line with the prior year
• The Retail business performed well, with good growth in France, Sweden and Fuelcards
• Oil performance more difficult in the UK and Ireland, but good progress in developing adjacencies, such as aviation and lubricants
• Restructuring and integration of Dansk Fuels in Denmark progressing in line with expectations
• Acquisition of Esso Retail Norway another significant step in building leading European petrol retailing network
2017 2016 % change
Volume (bn litres) 14.649 13.021 +12.5%
Operating profit (£’m) 254.9 205.2 +24.3%
Operating profit / litre 1.74p 1.58p
ROCE 21.6% 24.4% 63%
37% LPG
Retail & Oil

DCC Healthcare
11 DCC Results Presentation – 16 May 2017
2017 2016 % change
Revenue (£’m) 506.5 490.7 +3.2%
Operating profit (£’m) 49.0 45.0 +8.7%
Operating margin 9.7% 9.2%
ROCE 17.5% 17.1%
Revenue by business:
67%
33% DCC Vital
DCC H&BS
• DCC Healthcare achieved strong profit growth of 8.7% (8.0% ccy) and further improved its operating margin and ROCE
• DCC Vital: • Strong growth in supply of products and services to GP’s and also recorded good growth in medical devices• Pharma margins in Britain impacted by weaker sterling• Medisource, acquired in January 2017, has strengthened pharma offering in Ireland and has performed well
since acquisition
• DCC Health & Beauty: • Good growth across both nutrition and beauty sectors
• Nutrition growth broadly based, across all product formats
• Beauty benefited from strong growth in premium skincare sector and growth in the US market, as well as cross-selling of sachet capability

DCC Technology
12 DCC Results Presentation – 16 May 2017
2017 2016 % change
Revenue (£’m) 2,689 2,442 +10.1%
Operating profit (£’m) 41.1 35.1 +17.1%
Operating margin 1.5% 1.4%
ROCE 17.1% 17.8%
Revenue by business:
76%
17%
7% UK&I
Cont. Europe
Supply Chain
• Strong profit growth of 17.1% (12.5% ccy), reflecting strong organic growth in the UK&I and acquisition of CUC and Hammer
• UK delivered strong growth in audio visual, print and office supplies, smart tech, security and enterprise solutions – mobile and computing market remains flat
• New UK NDC operational and transition from existing sites to be completed over next 12 months
• Strong organic growth in Ireland and Middle East, good progress in retail and mobile offering
• Continental Europe saw good performance from CUC and further progress in Nordics, French retail focused business more difficult
• Supply Chain achieved good organic growth due to new contract wins

Financial review
Fergal O’DwyerChief Financial Officer

Financial summary
14
For the year ending 31 March 2017
DCC Results Presentation – 16 May 2017
£’m Revenue % change Gross Margin ppl / % of sales
change Operating costsppl / % of
sales change
DCC Energy 9,074 +20.7% 6.40ppl +0.87ppl 682 -0.70ppl
Group ex-Energy 3,196 +9.0% 10.2% +0.30% 236 -0.20%
Total – continuing1 12,270 1,263 918
1 Excluding DCC Environmental, the agreed disposal of which was announced on 5 April 2017
• Revenue ex-DCC Energy up 9.0% (5.0% ccy), driven by acquisition activity in DCC Technology
• DCC Energy gross margin increasing to 6.40ppl, 5.87ppl on a ccy basis (2016: 5.53ppl), ccy increase reflecting full year impact of Butagaz
• Gross margin excluding DCC Energy of 10.2% (2016: 9.9%)
• Operating costs +£193m (acq’s +£122m, organic +£4m, currency +£67m); organic +0.5%
• DCC Energy operating costs of 4.66ppl, 4.28ppl on a ccy basis (2016: 3.96ppl) reflects full year impact of higher cost to serve in Butagaz
• Excluding DCC Energy, operating costs as a % of revenue of 7.4% (2016: 7.2%)

Financial summary
15
For the year ending 31 March 2017
DCC Results Presentation – 16 May 2017
2017 2016 % change
Operating profit2 – continuing1 (£’m) 345.0 285.3 +20.9%
Group operating profit2 (£’m) 363.6 300.5 +21.0%
Finance costs (£’m) (32.1) (29.0)
Effective tax rate 17.5% 16.0%
Adjusted EPS2 – continuing1 286.6 pence 242.8 pence +18.1%
Total adjusted EPS2 303.7 pence 257.1 pence +18.1%
1 Excluding DCC Environmental, the agreed disposal of which was announced on 5 April 20172 Excluding net exceptionals and amortisation of intangible assets
• Operating profit growth of 20.9% (12.8% ccy); approx. one third of ccy growth was organic
• Finance costs increase driven by non-cash charge on liabilities acquired at NPV in Butagaz
• Effective tax rate increase to 17.5% reflects larger proportion of Continental European profits
• Adjusted EPS growth of 18.1% (10.3% ccy) reflects operating profit growth and higher tax rate

Strong free cash flow continues
16 DCC Results Presentation – 16 May 2017
Cash Flow £mConversion
%
Operating profit 363.6
Decrease in working capital 84.0
Depreciation and other 99.3
Operating cash flow 546.9 150%
Capex (131.4)
Free cash flow 415.5 114%
Interest and tax (91.2)
Free cash flow after interest and tax 324.3
Acquisitions (262.4)
Exceptional items (31.5)
Dividends (95.3)
Share issues 2.6
Translation and other (5.1)
Net cash outflow (67.4)
Opening net debt (54.5)
Closing net debt (121.9)
• Decrease in working capital driven by increase in oil price and seasonal reduction in businesses acquired in H2
• Working capital days up slightly to (3.3) days, from (3.9) days as acquired businesses have modestly higher working capital requirement
• Capex exceeded depreciation by £39.4 million reflecting greater development spend in Energy and NDC in Technology
• Free cash flow conversion an excellent 114%
• Acquisition cash spend of £262.4m
• Net debt / EBITDA of c. 0.3x. Allowing for committed acquisitions of Esso Retail Norway and Shell HK&M and disposal of DCC Environmental pro-forma of c. 0.6x

Summary and Q&A
Tommy Breen Chief Executive

Summary and Q&A
18
• Year of strong growth and development for DCC
• Good growth in each division, excellent cash flow performance and redeploying capital in acquisition activity
• Disposal of Environmental division sharpens strategic focus
• Balance sheet remains in strong position to facilitate further development
The Group expects that the year ending 31 March 2018 will be another year of profit growth and development
DCC Results Presentation – 16 May 2017

23 year CAGR
14.3%
19
17 19 22 24 2936 43 51 56 62 71 75 82
95117
149171
196
161
187208
228
301
364
5 6 7 89 10 11 13 15 18
23 2529
3440
52
6063
68 7077
85
97
112
19 22 26 30 32 38 42 50 58 6574 78 85
98116
140158
173
142
171191
209
257
304
Free cash flow conversion (%)23 year CAGR
14.7%
23 year CAGR
12.9%
23 year conversion
104%
1994 2017 1994 2017
1994 2017 1994 2017
Operating profit (£m) EPS (pence)
Dividend (pence)
Strategy continues to deliver
DCC Results Presentation – 16 May 2017
0%
20%
40%
60%
80%
100%
120%
140%
160%