Embed Size (px)
Citation preview

SUSTENTABILIDAD PARA EL USO DEL SUELO EN PUERTO RICO
Centro de Estudios para el Desarrollo Sustentable Escuela de Asuntos Ambientales Universidad Metropolitana
30 de marzo de 2009
RESUMEN EJECUTIVO

EQUIPO DE TRABAJO
Desarrollo del Modelo de Sustentabilidad
Carlos M. Padín, Ph.D., planificador ambiental y decano de la Escuela de Asuntos Ambientales María A. Juncos, M.S., gerente ambiental y directora del Centro de Estudios para el Desarrollo Sustentable Jorge Hernández, M.P., planificador urbano e investigador José Rivera Santana, M.P., planificador ambiental e investigador Harrison W. Flores, M.A., geógrafo y analista de GIS Juan Lara, Ph.D., economista, socio de Advantage Business Consulting
Apoyo en el desarrollo y la validación de los indicadores
Joaquín Villamil, economista y CEO de Estudios Técnicos, Inc. Wanda Crespo, M.P., planificadora y coordinadora del Grupo de Planificación, Estudios Técnicos, Inc. Carlos R. Olmedo, M.P., planificador y analista de GIS de Estudios Técnicos, Inc.
El Informe Final con detalles de la metodología, los resultados y las recomendaciones está accesible en nuestra página electrónica de proyectos en línea: www.proyectosambientales.info.
Centro de Estudios para el Desarrollo Sustentable (CEDES) Escuela de Asuntos Ambientales (EAA) Universidad Metropolitana (UMET)
P.O. Box 278 Bayamón, Puerto Rico 00960-0278 Tel: (787) 288-1100, ext. 8251
Fax: (787) 751-5540 E-mail: [email protected]
Derechos reservados © 2009 por CEDES, EAA, UMET
3 Resumen Ejecutivo: Sustentabilidad para el uso del suelo en Puerto RicoResumen Ejecutivo: Sustentabilidad para el uso del suelo en Puerto RicoResumen Ejecutivo: Sustentabilidad para el uso del suelo en Puerto RicoResumen Ejecutivo: Sustentabilidad para el uso del suelo en Puerto Rico Marzo 2009Marzo 2009Marzo 2009Marzo 2009
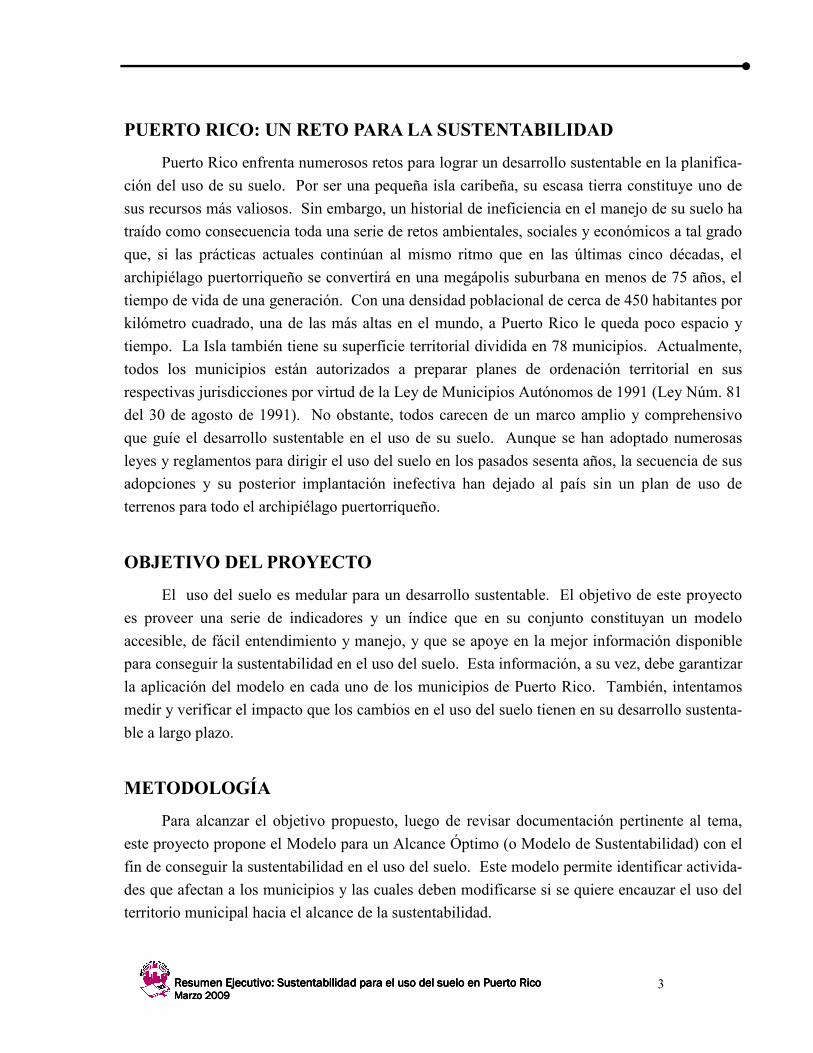
PUERTO RICO: UN RETO PARA LA SUSTENTABILIDAD
Puerto Rico enfrenta numerosos retos para lograr un desarrollo sustentable en la planifica-
ción del uso de su suelo. Por ser una pequeña isla caribeña, su escasa tierra constituye uno de
sus recursos más valiosos. Sin embargo, un historial de ineficiencia en el manejo de su suelo ha
traído como consecuencia toda una serie de retos ambientales, sociales y económicos a tal grado
que, si las prácticas actuales continúan al mismo ritmo que en las últimas cinco décadas, el
archipiélago puertorriqueño se convertirá en una megápolis suburbana en menos de 75 años, el
tiempo de vida de una generación. Con una densidad poblacional de cerca de 450 habitantes por
kilómetro cuadrado, una de las más altas en el mundo, a Puerto Rico le queda poco espacio y
tiempo. La Isla también tiene su superficie territorial dividida en 78 municipios. Actualmente,
todos los municipios están autorizados a preparar planes de ordenación territorial en sus
respectivas jurisdicciones por virtud de la Ley de Municipios Autónomos de 1991 (Ley Núm. 81
del 30 de agosto de 1991). No obstante, todos carecen de un marco amplio y comprehensivo
que guíe el desarrollo sustentable en el uso de su suelo. Aunque se han adoptado numerosas
leyes y reglamentos para dirigir el uso del suelo en los pasados sesenta años, la secuencia de sus
adopciones y su posterior implantación inefectiva han dejado al país sin un plan de uso de
terrenos para todo el archipiélago puertorriqueño.
OBJETIVO DEL PROYECTO
El uso del suelo es medular para un desarrollo sustentable. El objetivo de este proyecto
es proveer una serie de indicadores y un índice que en su conjunto constituyan un modelo
accesible, de fácil entendimiento y manejo, y que se apoye en la mejor información disponible
para conseguir la sustentabilidad en el uso del suelo. Esta información, a su vez, debe garantizar
la aplicación del modelo en cada uno de los municipios de Puerto Rico. También, intentamos
medir y verificar el impacto que los cambios en el uso del suelo tienen en su desarrollo sustenta-
ble a largo plazo.
METODOLOGÍA
Para alcanzar el objetivo propuesto, luego de revisar documentación pertinente al tema,
este proyecto propone el Modelo para un Alcance Óptimo (o Modelo de Sustentabilidad) con el
fin de conseguir la sustentabilidad en el uso del suelo. Este modelo permite identificar activida-
des que afectan a los municipios y las cuales deben modificarse si se quiere encauzar el uso del
territorio municipal hacia el alcance de la sustentabilidad.

4 Resumen Ejecutivo: Sustentabilidad para el uso del suelo en Puerto RicoResumen Ejecutivo: Sustentabilidad para el uso del suelo en Puerto RicoResumen Ejecutivo: Sustentabilidad para el uso del suelo en Puerto RicoResumen Ejecutivo: Sustentabilidad para el uso del suelo en Puerto Rico Marzo 2009Marzo 2009Marzo 2009Marzo 2009
El Modelo define los indicadores como agravantes o atenuantes del desarrollo sustenta-
ble. Mediante ellos brindamos información sobre la situación actual, pero también brindamos
una situación óptima de modo que podamos medir el progreso o el retroceso habido con relación
a la sustentabilidad, usando para ello umbrales específicos u objetivos de planificación. Ade-
más, se le asigna a cada indicador un peso relativo en cada una de sus categorías para luego
calcular un índice que comunique de manera sencilla y resumida el estatus de la sustentabilidad:
desde una sustentabilidad muy baja hasta una sustentabilidad muy alta; y para medir el progreso
alcanzado.
Un Comité Asesor Externo, compuesto por funcionarios y expertos locales, (tanto del
sector público como del privado), fue parte integral del Modelo para tomar las decisiones
fundamentales.
2
1
1 Los indicadores agravantes se definen como factores que reducen la sustentabilidad y los indicadores atenuantes son aquellos que mejoran la sustentabilidad. 2 Como umbrales, el proyecto adoptó objetivos de política pública locales, internacionales o científicamente acepta-dos. Cuando no hubo umbrales, el proyecto adoptó objetivos de planificación para Puerto Rico, propuestos y acordados en consenso por funcionarios y expertos locales del Comité Asesor Externo del proyecto.
Figura 1. Modelo de Sustentabilidad
Comité Asesor Externo: funcionarios y expertos locales
Diferencia/ cambio (+/-) en 8 años
Situación actual
Situación óptima
Índice de Sustentabilidad
en el Uso del Suelo (INSUS)
Recomendaciones para la sustentabilidad
Indicadores (agravantes y atenuantes)
Umbrales
Objetivos locales de planificación
Información y datos digitales más
confiables, relevantes y accesibles

5 Resumen Ejecutivo: Sustentabilidad para el uso del suelo en Puerto RicoResumen Ejecutivo: Sustentabilidad para el uso del suelo en Puerto RicoResumen Ejecutivo: Sustentabilidad para el uso del suelo en Puerto RicoResumen Ejecutivo: Sustentabilidad para el uso del suelo en Puerto Rico Marzo 2009Marzo 2009Marzo 2009Marzo 2009
El período de evaluación propuesto es de ocho años, dado que los planes de ordenación
territorial deben de ser revisados por lo menos cada ocho años, según establece la Ley Núm. 81
de 1991.
Se utilizaron cuatro municipios como casos de estudio porque representaban diferentes
escenarios socioeconómicos y geográficos: Barceloneta, Caguas, Carolina y Ponce.
Luego de seleccionar los indicadores y aplicarles a cada uno de ellos los umbrales o los
objetivos de planificación, así como los pesos relativos, se calculó el Índice de Sustentabilidad
en el Uso del Suelo (INSUS), que es un índice compuesto. Los indicadores agravantes (n) son
indexados y agregados al Índice Agravante (IA) de la siguiente manera:
Los indicadores atenuantes (m) fueron entonces indexados y agregados al Índice
Propiciador (IP) de la siguiente manera:
Ambos índices se combinaron luego en uno solo, para medir la sustentabilidad:
La multiplicación por 100, así como la raíz cuadrada, no son sino transformaciones
matemáticas diseñadas para generarle al INSUS una escala fácil de leer. El INSUS puede
asumir valores que pueden ir desde 1 hasta 100. Un valor de 100 representa el mejor escenario,
mientras que un valor de 1 representa el peor. Un valor de 10 se registra cuando el IA y el IP
ostentan los mismos valores, en cuya situación se cancelan mutuamente. Cuando los valores son
por debajo de 10, el IA es mayor al IP y el INSUS es dominado por los factores agravantes.
Cuando los valores son mayores de 10, el INSUS es dominado por factores atenuantes o
propiciadores de la sustentabilidad. Una lectura de 10 implica un empate de los factores agra-
vantes y atenuantes y marcaría el comienzo de un umbral para la sustentabilidad.
ζn
γ3
β2
α1 ...XXXXIA =
ζm
γ3
β2
α1 ...YYYYIP =
100xIA
IPINSUS =
6 Resumen Ejecutivo: Sustentabilidad para el uso del suelo en Puerto RicoResumen Ejecutivo: Sustentabilidad para el uso del suelo en Puerto RicoResumen Ejecutivo: Sustentabilidad para el uso del suelo en Puerto RicoResumen Ejecutivo: Sustentabilidad para el uso del suelo en Puerto Rico Marzo 2009Marzo 2009Marzo 2009Marzo 2009
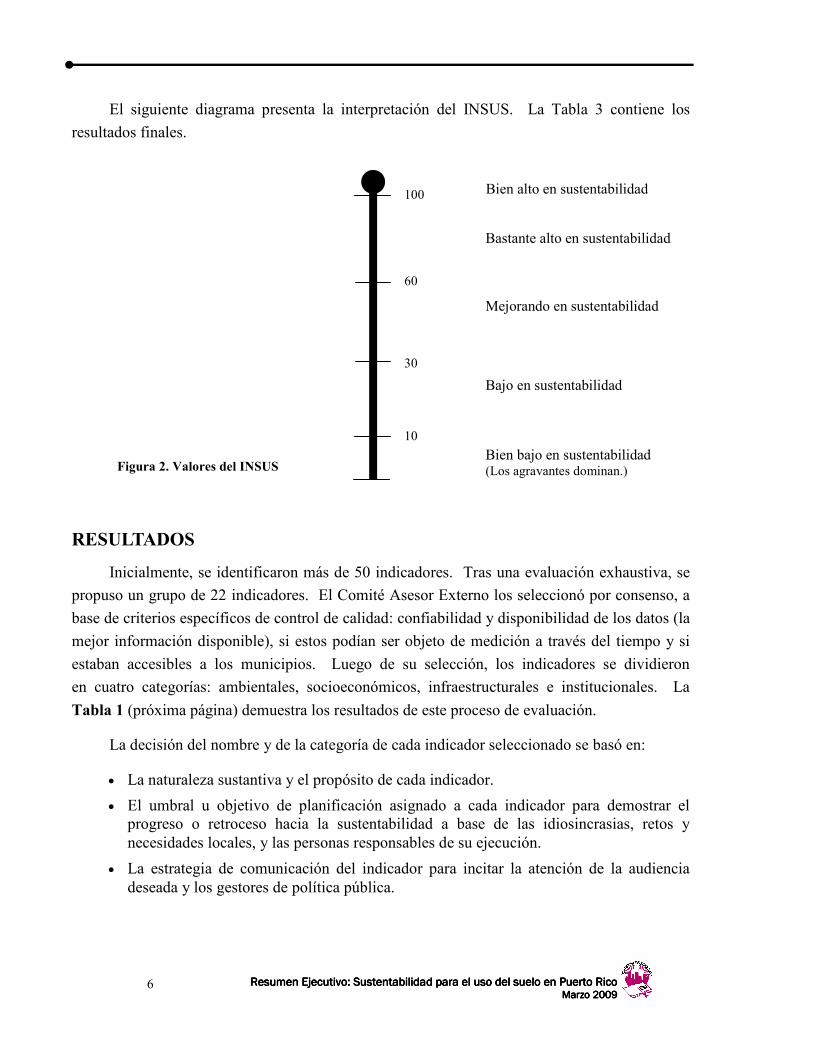
El siguiente diagrama presenta la interpretación del INSUS. La Tabla 3 contiene los
resultados finales.
RESULTADOS
Inicialmente, se identificaron más de 50 indicadores. Tras una evaluación exhaustiva, se
propuso un grupo de 22 indicadores. El Comité Asesor Externo los seleccionó por consenso, a
base de criterios específicos de control de calidad: confiabilidad y disponibilidad de los datos (la
mejor información disponible), si estos podían ser objeto de medición a través del tiempo y si
estaban accesibles a los municipios. Luego de su selección, los indicadores se dividieron
en cuatro categorías: ambientales, socioeconómicos, infraestructurales e institucionales. La
Tabla 1 (próxima página) demuestra los resultados de este proceso de evaluación.
La decisión del nombre y de la categoría de cada indicador seleccionado se basó en:
• La naturaleza sustantiva y el propósito de cada indicador.
• El umbral u objetivo de planificación asignado a cada indicador para demostrar el progreso o retroceso hacia la sustentabilidad a base de las idiosincrasias, retos y necesidades locales, y las personas responsables de su ejecución.
• La estrategia de comunicación del indicador para incitar la atención de la audiencia deseada y los gestores de política pública.
Figura 2. Valores del INSUS
Bien alto en sustentabilidad
Bastante alto en sustentabilidad
Mejorando en sustentabilidad
Bajo en sustentabilidad
Bien bajo en sustentabilidad (Los agravantes dominan.)
100
60
30
10

7 Resumen Ejecutivo: Sustentabilidad para el uso del suelo en Puerto RicoResumen Ejecutivo: Sustentabilidad para el uso del suelo en Puerto RicoResumen Ejecutivo: Sustentabilidad para el uso del suelo en Puerto RicoResumen Ejecutivo: Sustentabilidad para el uso del suelo en Puerto Rico Marzo 2009Marzo 2009Marzo 2009Marzo 2009
Tabla 1. Indicadores y Categorías de Indicadores para la Sustentabilidad en el Uso del Suelo
Ambientales
1. Riesgo de contaminación de los cuerpos de agua por falta de conexión al sistema de alcantarillado sanitario 2. Presión de desarrollo sobre el suelo rural
3. Accesibilidad a espacios naturales públicos en áreas urbanas
4. Generación, por residente, de desperdicios sólidos no peligrosos
5. Total de desperdicios sólidos no peligrosos reciclados
6. Riesgo de inundaciones costeras
7. Emisiones de CO2 por hogar
8. Emisiones de sustancias tóxicas al ambiente por parte de las industrias
9. Consumo de agua por hogar
Socioeconómicos
10. Suelo de alto valor agrícola
11. Suelo en uso agrícola
12. Residentes que trabajan donde viven
13. Repoblamiento de las áreas urbanas
14. Residentes que viven en los cauces de inundación
15. Índice Socioeconómico
Infraestructurales
16. Inaccesibilidad a la transportación pública
17. Uso de la transportación pública para llegar al trabajo
18. Huella de la red vial
19. Inaccesibilidad a agua potable
Institucionales
20. Plan de Ordenación Territorial aprobado
21. Índice de Fragilidad Fiscal
22. Suelo oficialmente protegido
8 Resumen Ejecutivo: Sustentabilidad para el uso del suelo en Puerto RicoResumen Ejecutivo: Sustentabilidad para el uso del suelo en Puerto RicoResumen Ejecutivo: Sustentabilidad para el uso del suelo en Puerto RicoResumen Ejecutivo: Sustentabilidad para el uso del suelo en Puerto Rico Marzo 2009Marzo 2009Marzo 2009Marzo 2009
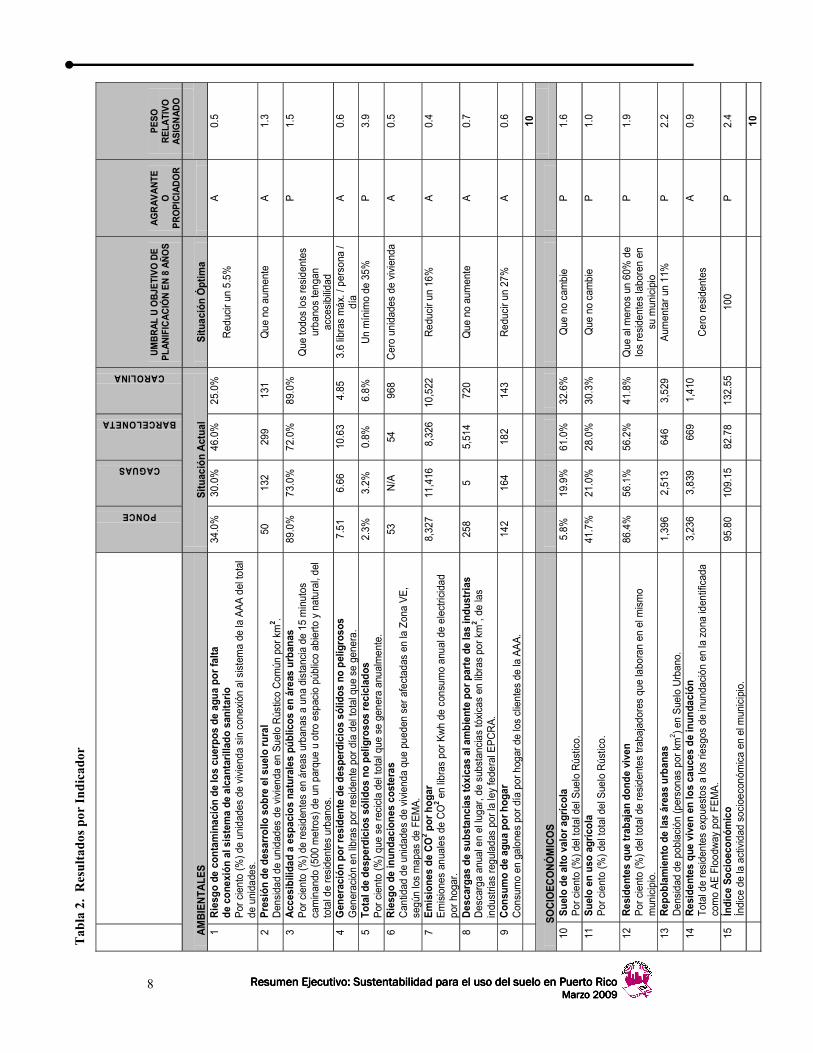
Tabla 2. Resultados por Indicador
PONCE
CAGUAS
BARCELONETA
CAROLINA
UMBRAL U OBJE
TIVO DE
PLANIFICACIÓN EN 8 AÑOS
AGRAVANTE
O
PROPICIADOR
PESO
RELATIVO
ASIGNADO
AMBIENTALE
S
Situa
ción Actua
l Situ
ación Óptim
a
1 Riesg
o de
con
taminac
ión de
los cu
erpo
s de
agu
a po
r falta
de co
nexión
al sistema de
alcan
tarillado sanitario
Por ciento (%) de unidades de vivienda sin conexión al sistema de la AAA del total
de unidades.
34.0%
30.0%
46.0%
25.0%
Reducir un 5.5%
A
0.5
2 Presión
de desarrollo
sob
re el s
uelo rural
Densidad de unidades de vivienda en Suelo Rústico Com
ún por km
2 .
50
132
299
131
Que no aumente
A
1.3
3 Acc
esibilida
d a espacios na
turales pú
blicos
en áreas urban
as
Por ciento (%) de residentes en áreas urbanas a una distancia de 15 minutos
caminando (500 metros) de un parque u otro espacio público abierto y natural, del
total de residentes urbanos.
89.0%
73.0%
72.0%
89.0%
Que todos los residentes
urbanos tengan
accesibilidad
P
1.5
4 Gen
eración po
r residen
te de des
perdicios só
lidos
no peligroso
s Generación en libras por residente por día del total que se genera.
7.51
6.66
10.63
4.85
3.6 libras máx. / persona /
día
A
0.6
5 Total de despe
rdicios só
lidos
no peligroso
s reciclad
os
Por ciento (%) que se recicla del total que se genera anualmente.
2.3%
3.2%
0.8%
6.8%
Un mínimo de 35%
P
3.9
6 Riesg
o de
inun
dacion
es cos
teras
Cantidad de unidades de vivienda que pueden ser afectadas en la Zona VE,
según los mapas de FEMA.
53
N/A
54
968
Cero unidades de vivienda
A
0.5
7 Emisione
s de CO
2 por hog
ar
Emisiones anuales de CO
2 en libras por Kwh de consumo anual de electricidad
por hogar.
8,327
11,416
8,326
10,522
Reducir un 16%
A
0.4
8 Des
cargas
de su
bstanc
ias tóxicas al ambiente po
r pa
rte de
las indu
strias
Descarga anual en el lugar, de substancias tóxicas en libras por km
2 , de las
industrias reguladas por la ley federal EPCRA.
258
5 5,514
720
Que no aumente
A
0.7
9 Con
sumo de ag
ua po
r hog
ar
Consumo en galones por día por hogar de los clientes de la AAA.
142
164
182
143
Reducir un 27%
A
0.6
10
S
OCIOECONÓMICOS
10
Suelo de
alto
valor ag
ríco
la
Por ciento (%) del total del Suelo Rústico.
5.8%
19.9%
61.0%
32.6%
Que no cambie
P
1.6
11
Suelo en
uso
agrícola
Por ciento (%) del total del Suelo Rústico.
41.7%
21.0%
28.0%
30.3%
Que no cambie
P
1.0
12
Res
iden
tes que
trab
ajan
don
de viven
Por ciento (%) del total de residentes trabajadores que laboran en el mismo
municipio.
86.4%
56.1%
56.2%
41.8%
Que al menos un 60% de
los residentes laboren en
su municipio
P
1.9
13
Rep
oblamiento de las áreas urban
as
Densidad de población (personas por km
2 ) en Suelo Urbano.
1,396
2,513
646
3,529
Aum
entar un 11%
P
2.2
14
Res
iden
tes que
viven
en lo
s ca
uces
de inun
dación
Total de residentes expuestos a los riesgos de inundación en la zona identificada
como AE Floodway por FEMA.
3,236
3,839
669
1,410
Cero residentes
A
0.9
15
Índice
Socioe
conó
mico
Índice de la actividad socioeconóm
ica en el municipio.
95.80
109.15
82.78
132.55
100
P
2.4
10

9 Resumen Ejecutivo: Sustentabilidad para el uso del suelo en Puerto RicoResumen Ejecutivo: Sustentabilidad para el uso del suelo en Puerto RicoResumen Ejecutivo: Sustentabilidad para el uso del suelo en Puerto RicoResumen Ejecutivo: Sustentabilidad para el uso del suelo en Puerto Rico Marzo 2009Marzo 2009Marzo 2009Marzo 2009
INFR
AEST
RUCTU
RALE
S
16
Inaccesibilid
ad a la
tran
sportación
púb
lica
Del total de barrios, por ciento (%) que no son servidos, por lo menos, por una ruta
de transporte público al centro urbano.
55%
9%
0%
23%
100%
(que todos los
barrios sean servidos)
A 5.8
17
Uso
de la tran
sportación
púb
lica pa
ra lleg
ar al traba
jo
Cam
bio en puntos porcentuales en el uso del transporte público para llegar al
trabajo de la cantidad de residentes trabajadores que han estado usando este
medio en la última década.
-4.9%
-7.0%
-7.4%
-3.8%
Que aum
ente 6 puntos
porcentuales
P 1.1
18
Hue
lla de la re
d vial
Kilómetros de carreteras por km2 del total del territorio municipal.
4.36
5.18
4.6
6.11
Que no aumente
A 1.5
19
Inaccesibilid
ad a agu
a po
table
Total de residentes, clientes o no clientes de la AAA, que son servidos por
sistem
as de agua potable que no cumplen de forma significativa con la
reglam
entación federal sobre calidad del agua potable.
2,865
649
0 0
Cero residentes o cero
sistem
as que no cumplen
de manera significativa
A 1.6
10
INST
ITUCIONALE
S
20
Plan
de Orden
ación Te
rrito
rial a
prob
ado
Plan aprobado por la Junta de Planificación.
1 1
1 1
Aprobado
P 3.8
21
Índice de Frag
ilida
d Fiscal
Índice que mide la situación fiscal del municipio.
13.53
-9.51
0.22
0.06
0 A
4.4
22
Suelo oficialm
ente protegido
Por ciento (%) del territorio del municipio que está protegido oficial y activam
ente,
ya sea por adquisición o manejo de los gobiernos federales, estatales o
municipales, o de una ONG, y están clasificados com
o Suelo Rústico
Especialmente Protegido.
33.1%
4.5%
52.6%
22.5%
Que no reduzca
P 1.8
10
10 Resumen Ejecutivo: Sustentabilidad para el uso del suelo en Puerto RicoResumen Ejecutivo: Sustentabilidad para el uso del suelo en Puerto RicoResumen Ejecutivo: Sustentabilidad para el uso del suelo en Puerto RicoResumen Ejecutivo: Sustentabilidad para el uso del suelo en Puerto Rico Marzo 2009Marzo 2009Marzo 2009Marzo 2009
Luego de dividir los indicadores entre agravantes y atenuantes, y de asignarles un umbral
o un objetivo de planificación y un peso relativo a cada uno (Tabla 2, páginas anteriores), se
calculó el INSUS.
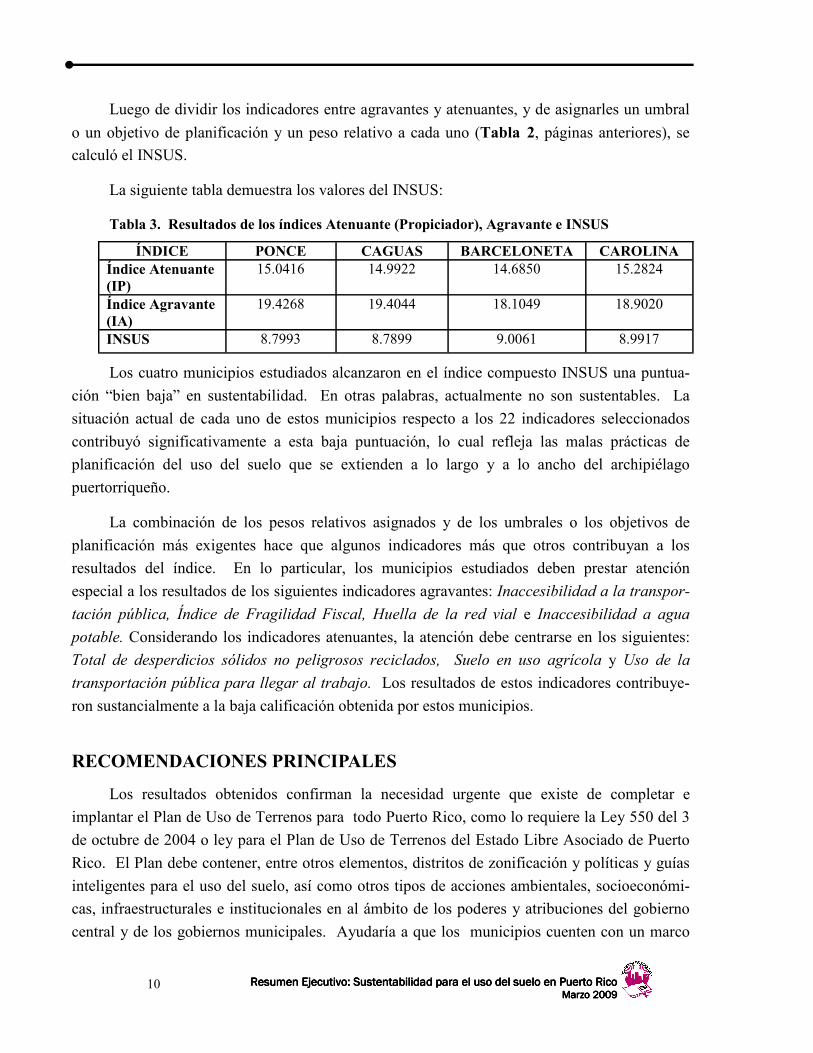
La siguiente tabla demuestra los valores del INSUS:
Tabla 3. Resultados de los índices Atenuante (Propiciador), Agravante e INSUS
Los cuatro municipios estudiados alcanzaron en el índice compuesto INSUS una puntua-
ción “bien baja” en sustentabilidad. En otras palabras, actualmente no son sustentables. La
situación actual de cada uno de estos municipios respecto a los 22 indicadores seleccionados
contribuyó significativamente a esta baja puntuación, lo cual refleja las malas prácticas de
planificación del uso del suelo que se extienden a lo largo y a lo ancho del archipiélago
puertorriqueño.
La combinación de los pesos relativos asignados y de los umbrales o los objetivos de
planificación más exigentes hace que algunos indicadores más que otros contribuyan a los
resultados del índice. En lo particular, los municipios estudiados deben prestar atención
especial a los resultados de los siguientes indicadores agravantes: Inaccesibilidad a la transpor-
tación pública, Índice de Fragilidad Fiscal, Huella de la red vial e Inaccesibilidad a agua
potable. Considerando los indicadores atenuantes, la atención debe centrarse en los siguientes:
Total de desperdicios sólidos no peligrosos reciclados, Suelo en uso agrícola y Uso de la
transportación pública para llegar al trabajo. Los resultados de estos indicadores contribuye-
ron sustancialmente a la baja calificación obtenida por estos municipios.
RECOMENDACIONES PRINCIPALES
Los resultados obtenidos confirman la necesidad urgente que existe de completar e
implantar el Plan de Uso de Terrenos para todo Puerto Rico, como lo requiere la Ley 550 del 3
de octubre de 2004 o ley para el Plan de Uso de Terrenos del Estado Libre Asociado de Puerto
Rico. El Plan debe contener, entre otros elementos, distritos de zonificación y políticas y guías
inteligentes para el uso del suelo, así como otros tipos de acciones ambientales, socioeconómi-
cas, infraestructurales e institucionales en al ámbito de los poderes y atribuciones del gobierno
central y de los gobiernos municipales. Ayudaría a que los municipios cuenten con un marco
ÍNDICE PONCE CAGUAS BARCELONETA CAROLINA Índice Atenuante (IP)
15.0416 14.9922 14.6850 15.2824
Índice Agravante (IA)
19.4268 19.4044 18.1049 18.9020
INSUS 8.7993 8.7899 9.0061 8.9917

11 Resumen Ejecutivo: Sustentabilidad para el uso del suelo en Puerto RicoResumen Ejecutivo: Sustentabilidad para el uso del suelo en Puerto RicoResumen Ejecutivo: Sustentabilidad para el uso del suelo en Puerto RicoResumen Ejecutivo: Sustentabilidad para el uso del suelo en Puerto Rico Marzo 2009Marzo 2009Marzo 2009Marzo 2009
de referencia que guíe los planes y actividades relacionados con el uso del suelo en sus respecti-
vas jurisdicciones.
La regionalización y la municipalización también se recomiendan como herramientas
útiles para responder con rapidez y eficiencia a los retos de la sustentabilidad, sobre todo en la
implantación de políticas públicas, programas y planes para estos fines, tal y como se ha hecho
en otras partes del mundo y como recomienda la Organización de las Naciones Unidas. Deben
emplearse mayores recursos para involucrar y educar a los gestores locales y así lograr acciones
consistentes y eficaces hacia la sustentabilidad.
Por último, Puerto Rico cuenta con suficiente reglamentación, planes y programas para
lograr un desarrollo sustentable en el uso del suelo. El reto está en la falta de implantación. La
Isla no necesita más normativas; sólo la implantación eficaz de estas normativas y, de ser
preciso, que sean enmendadas y atemperadas a las realidades y los retos del siglo XXI.
LOGROS Y CONTRIBUCIONES DE ESTE PROYECTO
Esta es la primera vez que se realiza este tipo de proyecto en Puerto Rico, en el cual se
recopilaron y estudiaron datos relevantes para el desarrollo de un modelo de sustentabilidad para
el uso del suelo, compuesto por indicadores y un índice. Esperamos que constituya un primer
paso en el proceso de evaluar el progreso o retroceso de Puerto Rico con respecto a la sustenta-
bilidad, usando los municipios como unidad de planificación.
El modelo propuesto es accesible, fácil de usar y viable. También cumple con los criterios
de selección de los indicadores. Permite dos niveles de comunicación para las personas intere-
sadas. Por un lado, brinda información detallada de las fuentes de datos y de las metodologías
empleadas, lo que permite su revisión técnica y futuras investigaciones para mejorar los datos y
el modelo mismo. Por otro lado, brinda en un lenguaje sencillo información resumida para
comenzar a analizar tendencias útiles al tomar decisiones e implantar políticas públicas.
El proyecto obtuvo un gran respaldo de representantes de los sectores público y privado
dentro del Comité Asesor Externo. La participación de estos representantes en el Comité fue de
un 70%. El proyecto también permitió el trabajo en equipo de forma eficiente de técnicos y
personas que toman decisiones en áreas programáticas similares en diversos niveles del gobier-
no (federal, central y municipal), así como de expertos de universidades y organizaciones
profesionales.

12 Resumen Ejecutivo: Sustentabilidad para el uso del suelo en Puerto RicoResumen Ejecutivo: Sustentabilidad para el uso del suelo en Puerto RicoResumen Ejecutivo: Sustentabilidad para el uso del suelo en Puerto RicoResumen Ejecutivo: Sustentabilidad para el uso del suelo en Puerto Rico Marzo 2009Marzo 2009Marzo 2009Marzo 2009
Contribuciones Específicas
Una herramienta para tomar decisiones: Los municipios pueden utilizar sus propios
datos y tendencias históricas y empezar a autoevaluarse. También pueden compararse con otros
municipios. Este proyecto es único en este particular.
Una herramienta de evaluación capaz de impulsar políticas públicas: Los resultados
de cada uno de los indicadores empleados, así como los resultados del índice, podrían impulsar
la revisión de políticas públicas que apoyen la sustentabilidad.
Una iniciativa para lograr convenios de colaboración: La difusión de esta herramienta
podría promover la creación de convenios de colaboración intersectoriales como apoyo a los
proyectos de sustentabilidad que impulsen los municipios.
Una iniciativa para promover futuras investigaciones sobre la base de las lecciones
aprendidas: Este trabajo brinda la oportunidad de que en futuras investigaciones se mejoren los
indicadores cuyos datos ahora no son suficientemente precisos o consistentes. También brinda
la oportunidad de expandir el Modelo a nivel regional, ya sea para que abarque una cuenca
hidrográfica o regiones territoriales de planificación municipal. Además, podría ser transferible
y adaptable a iniciativas de investigación similares en islas con escenarios comparables al de
Puerto Rico, lo que podría conducir a futuras oportunidades de acuerdos de investigación.
Una oportunidad para aumentar la escala del Modelo y posicionarlo como una
herramienta de evaluación a nivel de toda la isla: Con el tiempo, este proyecto permitirá
desarrollar un “Informe sobre el Uso del Suelo en Puerto Rico”, y clasificar a los municipios
cada cuatro a ocho años en función de su “ecoeficiencia”.
PRINCIPALES OBSTÁCULOS O LIMITACIONES ENCONTRADOS
En Puerto Rico, la confiabilidad y disponibilidad de datos estadísticos y metadata para
usar la herramienta del Sistema Información Geográfica (GIS, por sus siglas en inglés) constitu-
yen un gran reto. También lo constituyen la accesibilidad y disponibilidad de los técnicos en las
agencias que crean los datos para su validación. No obstante, los indicadores empleados fueron
seleccionados a partir de la mejor información disponible, accesible, confiable y medible, tanto
en formatos digitales como no digitales. En el futuro deben realizarse investigaciones dirigidas
a mejorar la base técnica de la información, de modo que se amplíe el alcance del Modelo y se
incremente su exactitud y utilidad.
13 Resumen Ejecutivo: Sustentabilidad para el uso del suelo en Puerto RicoResumen Ejecutivo: Sustentabilidad para el uso del suelo en Puerto RicoResumen Ejecutivo: Sustentabilidad para el uso del suelo en Puerto RicoResumen Ejecutivo: Sustentabilidad para el uso del suelo en Puerto Rico Marzo 2009Marzo 2009Marzo 2009Marzo 2009
Los municipios, como unidades de planificación, poseen limitaciones respecto a la aplica-
ción y recopilación de datos estadísticos porque en muchos casos el alcance de estos datos es de
naturaleza regional o de todo Puerto Rico. Esto ocasionó que muchos indicadores potenciales
tuviesen que descartarse. Una línea de investigación futura basada en este modelo podría ser el
desarrollo de un modelo de escala regional o insular (con consideraciones regionales). Además,
la metodología podría refinarse para tomar en cuenta condiciones disímiles entre municipios.
Tal como lo evidencia la documentación estudiada, pocos, si algunos de los indicadores más
importantes, son de igual aplicación incluso en situaciones o sistemas similares.
__________________________________________________________________

SUSTAINABILITY OF LAND USE IN PUERTO RICOReport
for Presentation atThe Angora Convention Center,
Caguas, Puerto RicoMarch 30, 2009
Center for Sustainable Development StudiesSchool of Environmental affairs
Universidad Metropolitana
Aguadilla Isabela
Moca
Aguada
Rincón
Añasco
San Sebastián
Quebradillas
Camuy
Lares
Hatillo
Arecibo
UtuadoLas Marías
Mayagüez
Maricao
Cabo Rojo
Hormigueros
San GermánSabanaGrande
Lajas
Guánica
Yauco
Adjuntas
Guayanilla
Peñuelas PonceJuana Díaz
Villalba
JayuyaOrocovis
Ciales
Florida
Barceloneta
ManatíVegaBaja Vega
Alta
MorovisCorozal
DoradoToa Baja
BayamónToa Alta
Naranjito
Barranquitas
Coamo
Aibonito
Salinas
Santa Isabel Guayama
Cayey
Cidra
Caguas
AguasBuenas
Comerío
Guaynabo
San Juan
TrujilloAlto
Gurabo
LoízaCarolina
Río Grande
Canóvanas
Luquillo
Fajardo
CeibaNaguabo
HumacaoLas
PiedrasSan
Lorenzo
Juncos
Yabucoa
Maunabo
Patillas
Arroyo
Vieques
Culebra

Center for Sustainable Development StudiesSchool of Environmental AffairsUniversidad Metropolitana
Carlos M. Padín, Ph.D.Environmental Planner andDean of the School of Environmental Affairs
María A. Juncos, M.S.Environmental Manager andDirector of the Center for Sustainable Development Studies
Jorge Hernández, M.P.Researcher and Urban Planner
José Rivera Santana, M.P.Researcher and Environmental Planner
Juan Lara, Ph.D.Economist
This Report can also be downloaded at www.proyectosambientales.info.Copyright ©2009 by CSDS, SEA, UMET.
P.O. Box 278Bayamón, P.R. 00960-0278
Tel 787 288 1100, ext. 8251
Fax 787 288 1995

SUSTAINABILITY OF LAND USE IN PUERTO RICO
Aguadilla Isabela
Moca
Aguada
Rincón
Añasco
San Sebastián
Quebradillas
Camuy
Lares
Hatillo
Arecibo
UtuadoLas Marías
Mayagüez
Maricao
Cabo Rojo
Hormigueros
San GermánSabanaGrande
Lajas
Guánica
Yauco
Adjuntas
Guayanilla
Peñuelas PonceJuana Díaz
Villalba
JayuyaOrocovis
Ciales
Florida
Barceloneta
ManatíVegaBaja Vega
Alta
MorovisCorozal
DoradoToa Baja
BayamónToa Alta
Naranjito
Barranquitas
Coamo
Aibonito
Salinas
Santa Isabel Guayama
Cayey
Cidra
Caguas
AguasBuenas
Comerío
Guaynabo
San Juan
TrujilloAlto
Gurabo
LoízaCarolina
Río Grande
Canóvanas
Luquillo
Fajardo
CeibaNaguabo
HumacaoLas
PiedrasSan
Lorenzo
Juncos
Yabucoa
Maunabo
Patillas
Arroyo
Vieques
Culebra
Printed on recycled paper.

TABLE OF CONTENT
ABSTRACT i
INTRODUCTION PUERTO RICO: A SUSTAINABLE CHALLENGE 1AIM OF THE PROJECT 4ACHIEVEMENTS AND CONTRIBUTIONS 4
ACHIEVEMENTS 4SPECIFIC CONTRIBUTIONS 5
CHALLENGES AND LESSONS LEARNED 6
THEORETICAL BACKGROUND 6SUSTAINABLE DEVELOPMENT 6INDICATORS 8
INDICES 12METHODOLOGY 14
THE CONCEPTUAL MODEL: CURRENT TO OPTIMAL (CUTOP MODEL) 14
STEPS IN THE METHODOLOGICAL APPROACH OF THE CUTOP MODEL 15TERRITORIAL UNIT 16TARGET AUDIENCE 16
PROGRESS EVALUATION PERIOD 16CASE STUDIES 16INDICATORS’ SELECTION CRITERIA 18
MATHEMATICAL MODEL TO DEVELOP THE INDEX 18REQUIRED ACTIONS TO DEVELOP THE INDEX 18THE COMPONENT SERIES: INDICATORS 19
THE STRESSORS INDEX (STI) 19THE RELIEVERS INDEX (RI) 20
THE INDEX OF SUSTAINABLE LAND USE ACTIVITY (ISLA) 20
OUTREACH AND EXTERNAL COLLABORATION 22EXTERNAL ADVISORY COMMITTEE 22PUBLIC MEETING 22
GOVERNMENT OUTREACH 23OTHERS 23
SCIENTIFIC SOUNDNESS AND RELEVANCE 24
QUALITY CONTROL 25RESULTS 26
RESULTS OF THE INDICATORS 26
RESULTS OF THE ISLA 30FINAL REMARKS 32GENERAL RECOMMENDATIONS 36
RECOMMENDATIONS BY INDICATOR 41LIMITATIONS 59APPENDIX A LAND USE PLANNING: 1942 - PRESENT 61
APPENDIX B PUERTO RICO MAIN ENVIRONMENTAL ANDSOCIO-ECONOMIC CHARACTERISTICS 67
APPENDIX C EXTERNAL ADVISORY COMMITTEE 71
APPENDIX D RATIONALE AND METHODOLOGY OF EACH INDICATOR 75APPENDIX E EXAMPLE OF A PUBLIC ORDINANCE FOR IMPLEMENTATION 153APPENDIX F ACRONYMS 157
REFERENCES 158

ABSTRACT
Puerto Rico faces a considerable number of challenges for sustainable
land use planning. As a small Caribbean island, land is a scarce and highly valuable
resource. A history of inefficiency in land use has resulted in many environmental,
social and economic challenges, and if current practices continue at the same
rate they have in the last five decades, the whole island of Puerto Rico will become
a suburban megalopolis in less than 75 years, the life span of one generation.
With a population density of almost 450 inhabitants per square kilometer, one of
the highest in the world, Puerto Rico is running out space and time. The Island
also faces the political reality that its surface area is divided into 78 municipalities.
Currently all of these municipalities have the authority to prepare individual land
use plans by virtue of the Autonomous Municipalities Act (Public Law 81 of August
30, 1991). However, they lack a larger and comprehensive sustainable land use
framework to guide them. Although numerous laws and regulations regarding
land use planning have been approved during the past sixty years, the sequence
of their enactment and their subsequent ineffective implementation have left the
island without an island-wide land use plan.
Since land use is at the heart of sustainability, this project developed
and proposes the Current to Optimal Model (CUTOP Model), with an accessible,
easy-to-use, and feasible set of indicators and an index, based on the best
available and reliable data, to measure and monitor progress towards sustainability
at a municipal level. The evaluation period is eight years since municipal land use
plans have to be revised at least every eight years, as established by Public Law
81. Four municipalities are used as case studies because they represent different
regions and varying socio-economic and landscape scenarios: Barceloneta,
Caguas, Carolina and Ponce. An External Advisory Committee, composed of
stakeholders and local experts from the public and private sectors, is an integral
part of the Model for decision-making.
ABSTRACT
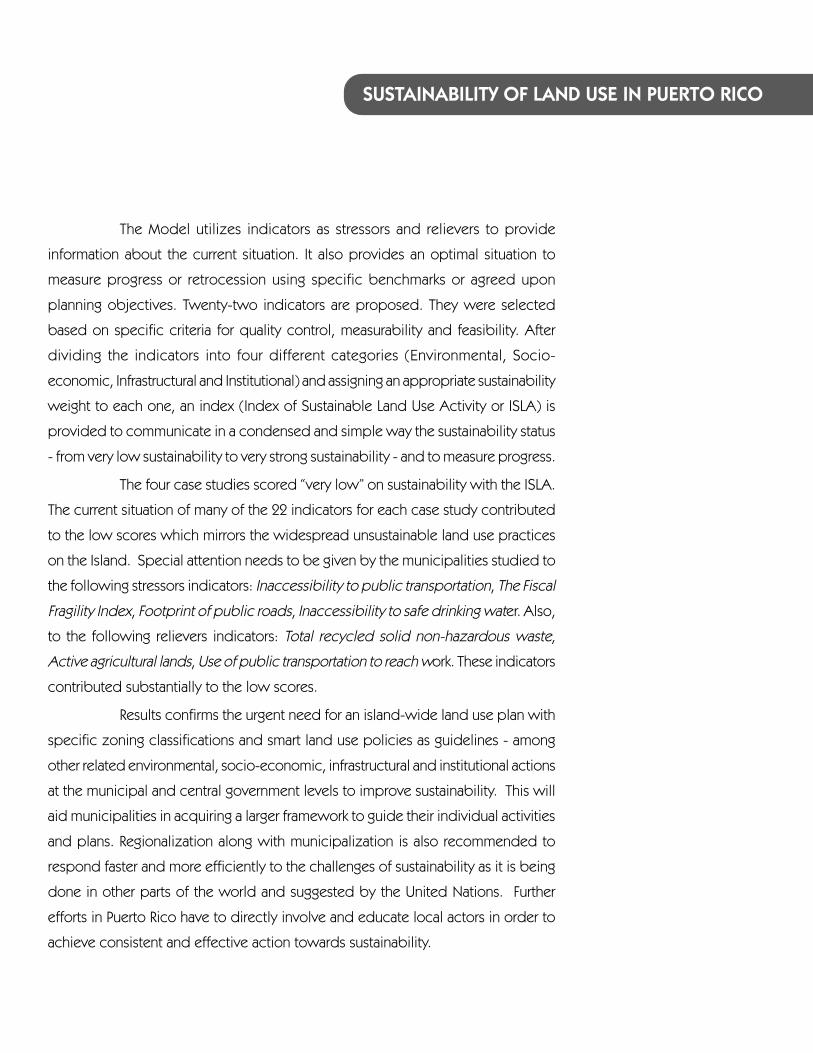
The Model utilizes indicators as stressors and relievers to provide
information about the current situation. It also provides an optimal situation to
measure progress or retrocession using specific benchmarks or agreed upon
planning objectives. Twenty-two indicators are proposed. They were selected
based on specific criteria for quality control, measurability and feasibility. After
dividing the indicators into four different categories (Environmental, Socio-
economic, Infrastructural and Institutional) and assigning an appropriate sustainability
weight to each one, an index (Index of Sustainable Land Use Activity or ISLA) is
provided to communicate in a condensed and simple way the sustainability status
- from very low sustainability to very strong sustainability - and to measure progress.
The four case studies scored “very low” on sustainability with the ISLA.
The current situation of many of the 22 indicators for each case study contributed
to the low scores which mirrors the widespread unsustainable land use practices
on the Island. Special attention needs to be given by the municipalities studied to
the following stressors indicators: Inaccessibility to public transportation, The Fiscal
Fragility Index, Footprint of public roads, Inaccessibility to safe drinking water. Also,
to the following relievers indicators: Total recycled solid non-hazardous waste,
Active agricultural lands, Use of public transportation to reach work. These indicators
contributed substantially to the low scores.
Results confirms the urgent need for an island-wide land use plan with
specific zoning classifications and smart land use policies as guidelines - among
other related environmental, socio-economic, infrastructural and institutional actions
at the municipal and central government levels to improve sustainability. This will
aid municipalities in acquiring a larger framework to guide their individual activities
and plans. Regionalization along with municipalization is also recommended to
respond faster and more efficiently to the challenges of sustainability as it is being
done in other parts of the world and suggested by the United Nations. Further
efforts in Puerto Rico have to directly involve and educate local actors in order to
achieve consistent and effective action towards sustainability.
SUSTAINABILITY OF LAND USE IN PUERTO RICO

SUSTAINABILITY OF LAND USE IN PUERTO RICO

With the industrialization in the 1940’s and 50’s the following factors contributed to the
accelerated urbanization of the Puerto Rican society:
The devaluation and abandonment of agriculture as a main economic sector.
The lack of tillage as a result of the absence of policies to protect this economic activity in the
industrialization process left land available for other more profitable uses,
specifically housing development.
The lack of a mass transportation policy.
The government did not promote or prioritize mass transportation
during the accelerated stage of urbanization.
The implicit and/or explicit subsidy of private vehicles.
The government explicitly encouraged the use of cars with tax credits, and implicitly encouraged
policies of keeping fuel costs low which was exacerbated by the practice of accommodating road
construction to the unplanned development of residential projects.
Inadequate valuation or appraisal of the different housing development alternatives.
The emphasis on short-term cost reduction has favored housing construction on
“inexpensive” land far from the urban centers instead of encouraging reconstruction
and densification of the residential spaces of urban centers.
The interaction of these factors and the increasing demand for housing from an urban
upwardly mobile middle class were the basis for sprawling development.
Public policy, as well as private initiatives, followed the path of least resistance
without planning guidelines for a denser, more efficient development.
Source: Universidad Metropolitana (UMET), 2001.
1
INTRODUCTION
PUERTO RICO: A SUSTAINABLE CHALLENGE
Puerto Rico, a commonwealth under the jurisdiction of the United States,faces a considerable number of challenges for sustainable land use planning. As a smallisland in the Caribbean, land is a scarce and highly valuable resource. Measuring 8,870square kilometers with a population density of almost 450 inhabitants per square kilometer(in July, 2008, the Puerto Rico Planning Board [PRPB] estimated the island’s population atapproximately 4.0 million1), one of the highest population densities in the world andthe fourth highest in America,2 Puerto Rico is running out space and out of time.
According to the classifications of the U.S. Census in 2000, already 50% ofthe island is urban and 50% is rural. The majority of this population (94%) lives in urbanareas. This is a significant change from 1900-1930, when almost 80% of the island’spopulation was rural (U.S. Census Bureau, 1900-19303, 2000). Industrialization in PuertoRico followed the United States model of suburban growth in the 1940’s and 50’s, andthis paved the way for an accelerated urbanization of Puerto Rican society. Urban sprawlbecame one of its more evident consequences and one of the greatest threats tosustainability on the island.
Locally, land use cover in Puerto Rico has been studied using a variety ofmethods (Thomlinson et al., 1996; Thomlinson and Rivera, 2000; López et al., 2001;Ramos González, 2001; Helmer et al., 2002; Martinuzzi et al., 2007, Gould et al., 2007,2008ab). The most recent studies (Martinuzzi et al., 2007, 2008 and Gould et al., 2008ab)calculated that 16% of Puerto Rico is considered urban4 (specifically, 11% of the islandis composed of urban/built-up surfaces). The compact pattern of construction of urban/built-up land (high-density) encompasses nearly 60% of developed lands within theurban centers and along their important connections, and within non-contiguous exurbanagglomerations. It predominates in the coastal plains and valleys where the mostproductive agricultural lands are located (development is closely related to thetopography, it decreases rapidly as slope increases). Thirty-six percent (36%) is denselypopulated rural5 (suburban developments) and 40% of Puerto Rico is considered to beexperiencing a high degree of low-density or non-contiguous sprawl development6
which is widespread across most of the island starting just outside the urban centers,
1 PRPB, Census Office, retrieved on 1/29/09 from www.censo.gobierno.pr (“proyecciones de población/2001-2010, años sencillos”).
2 United Nations, Department of Economics and Social Affairs, United Nations Statistic Division. DemographicYear Book. Retrieved on 1/29/09 from http://unstats.un.org/unsd/demographic/products/dyb/dyb2006.htm(Table #3).
3 The Census information for 1900-1930 was retrieved on 1/29/09 from http://www2.census.gov/prod2/decennial/documents/00476569ch4.pdf
4 According to the authors, urban is defined as those regions where developed areas (developed pixels) perkm2 is more than 20% of the surface.
5 According to the authors, densely populated rural lands (or what they call territory of expansion of urbancenters) refers to those regions where developed areas (developed pixels) per km2 is less than 20% and,according to the core census block groups or blocks (2000 Census Urban and Rural classifications), have apopulation density of at least 1,000 people per mi2 and the surrounding census blocks with an overall densityof at least 500 people per mi2. The rest is considered sparsely populated rural area.
6 The calculation of the 40%, according to the authors, considered densely populated rural and part of theurban-use areas (including exurban agglomerations and low density developments).
INTRODUCTION

2
SUSTAINABILITY OF LAND USE IN PUERTO RICO
following the linear features of the roads (it predominates in the hills and mountainsfollowing the extensive rural-road network) and some of the biggest highways and routes.This sprawl has encroached in the most valuable agricultural lands, eliminating open spacesand covering watersheds with impervious surfaces. Few open regions appear with minimalhuman impact, mostly areas protected by the government for conservation, agriculturefields, higher elevations or rugged topography (Martinuzzi et al., 2007, 2008 and Gould etal., 2008ab).
According to López and Villanueva (2006) in the last 25 years there has beenan increase of approximately 35% in this urban coverage. In spite of the fact that it is stillnot the biggest coverage, it is the one that has grown at a faster rate. In addition, only 7.6%of the land is protected by some form of management for biodiversity (Gould et al., 2007).Urbanization for housing and development have produced enormous pressures on theisland’s diverse and delicate ecosystems which range from the only tropical rainforest ofthe United States (El Yunque National Forest), to the Guánica Dry Forest (declared anInternational Biosphere Reserve by UNESCO) to the northern karst region which, accordingto studies, has a sustain yield of about 25 million gallons of water per day for consumption.In the description of each indicator presented in the technical section of this Report(Rationale and Methodology of the Indicators), many of the environmental, economic andsocial impacts of this unsustainable land use pattern are described and evidenced in theresults.
Puerto Rico is also an island with topographical limitations, and a seriouscombination of natural hazards. Two-thirds of the land is mountainous, while the remainingone-third is composed of valleys and low-lying lands, with a coastline of 501 km, whichbears the brunt of suburban development. Also, many lands are flood-prone areas, aresult of hydrologic characteristics such as the island’s 224 named rivers and 553 creeks,with 55 main rivers that flow into the sea, as well weather patterns characteristic of tropicalareas (Puerto Rico Department of Natural and Environmental Resources [DNER] (2007).
Not a single ecological resourcehas escaped the impact of urban
sprawl on the Island. Coupled withthe infrastructure built to sustain
growth and social activities, it hasleft an imprint on the land and thenatural systems on a scale unseen
until the last two decades. Thereal cost, however, goes far
beyond strictly environmentalconcerns, and any economic
exercise to quantify this cost facesenormous hurdles. According tothe study by UMET (2001) in the
case study area inside the SanJuan Metropolitan Area that
included the municipalities of SanJuan (Capital City), Carolina,
Cataño, Guaynabo, Toa Alta, ToaBaja and Trujillo Alto, the recurrent
cost of urban sprawl is estimated
FIGURE 1. LOCATION OF PUERTO RICO IN THE CARIBBEAN
The Island of Puerto Rico is located in thegeographic coordinates of 18 15 N, 66 30W. It is situated at the northeast of theCaribbean Sea, at the east of the DominicanRepublic and to the west of the UnitesStates Virgin Islands, exactly at the junctionof the Greater and Lesser Antilles. Thearchipelago of Puerto Rico includes themain island Puerto Rico, which is thesmallest island of the Greater Antilles, anda number of other smaller islands (whichincludes the island-municipalities ofVieques and Culebra) and keys. SeeAppendix B for a short description of PuertoRico’s main environmental and socio-economic characteristics.
3
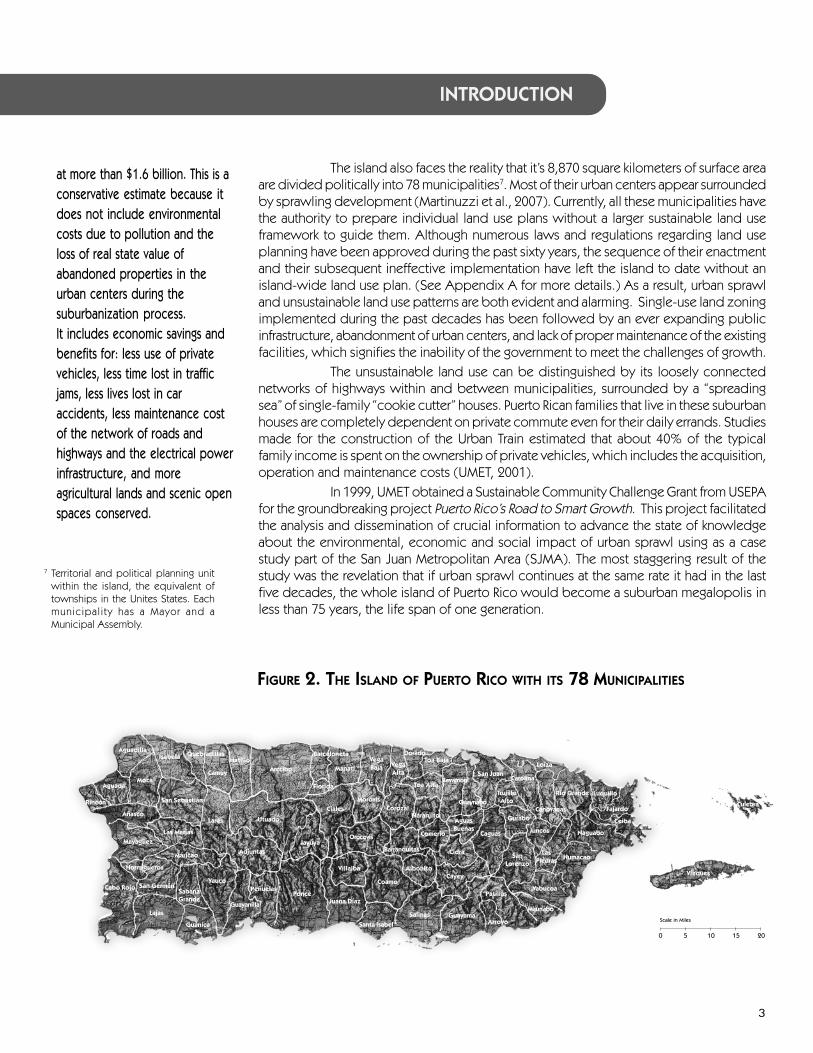
The island also faces the reality that it’s 8,870 square kilometers of surface areaare divided politically into 78 municipalities7. Most of their urban centers appear surroundedby sprawling development (Martinuzzi et al., 2007). Currently, all these municipalities havethe authority to prepare individual land use plans without a larger sustainable land useframework to guide them. Although numerous laws and regulations regarding land useplanning have been approved during the past sixty years, the sequence of their enactmentand their subsequent ineffective implementation have left the island to date without anisland-wide land use plan. (See Appendix A for more details.) As a result, urban sprawland unsustainable land use patterns are both evident and alarming. Single-use land zoningimplemented during the past decades has been followed by an ever expanding publicinfrastructure, abandonment of urban centers, and lack of proper maintenance of the existingfacilities, which signifies the inability of the government to meet the challenges of growth.
The unsustainable land use can be distinguished by its loosely connectednetworks of highways within and between municipalities, surrounded by a “spreadingsea” of single-family “cookie cutter” houses. Puerto Rican families that live in these suburbanhouses are completely dependent on private commute even for their daily errands. Studiesmade for the construction of the Urban Train estimated that about 40% of the typicalfamily income is spent on the ownership of private vehicles, which includes the acquisition,operation and maintenance costs (UMET, 2001).
In 1999, UMET obtained a Sustainable Community Challenge Grant from USEPAfor the groundbreaking project Puerto Rico’s Road to Smart Growth. This project facilitatedthe analysis and dissemination of crucial information to advance the state of knowledgeabout the environmental, economic and social impact of urban sprawl using as a casestudy part of the San Juan Metropolitan Area (SJMA). The most staggering result of thestudy was the revelation that if urban sprawl continues at the same rate it had in the lastfive decades, the whole island of Puerto Rico would become a suburban megalopolis inless than 75 years, the life span of one generation.
at more than $1.6 billion. This is aconservative estimate because itdoes not include environmentalcosts due to pollution and theloss of real state value ofabandoned properties in theurban centers during thesuburbanization process.It includes economic savings andbenefits for: less use of privatevehicles, less time lost in trafficjams, less lives lost in caraccidents, less maintenance costof the network of roads andhighways and the electrical powerinfrastructure, and moreagricultural lands and scenic openspaces conserved.
FIGURE 2. THE ISLAND OF PUERTO RICO WITH ITS 78 MUNICIPALITIES
AguadillaIsabela
MocaAguada
Rincón
Añasco
San Sebastián
Quebradillas
Camuy
Lares
HatilloArecibo
Utuado
Las MaríasMayagüez
Maricao
Cabo Rojo
Hormigueros
San GermánSabanaGrande
Lajas
Guánica
Yauco
Adjuntas
Guayanilla
PeñuelasPonce
Juana Díaz
Villalba
JayuyaOrocovis
Ciales
Florida
Barceloneta
ManatíVegaBaja Vega
Alta
MorovisCorozal
DoradoToa Baja
BayamónToa Alta
Naranjito
Barranquitas
Coamo
Aibonito
SalinasSanta Isabel
Guayama
Cayey
Cidra
Caguas
AguasBuenas
Comerío
Guaynabo
San Juan
TrujilloAlto
Gurabo
Loíza
Carolina
Río Grande
Canóvanas
Luquillo
Fajardo
Ceiba
Naguabo
HumacaoLas
PiedrasSan
Lorenzo
Juncos
Yabucoa
Maunabo
Patillas
Arroyo
Vieques
Culebra
Cataño
INTRODUCTION
7 Territorial and political planning unitwithin the island, the equivalent oftownships in the Unites States. Eachmunicipality has a Mayor and aMunicipal Assembly.
AguadillaIsabela
MocaAguada
Rincón
Añasco
San Sebastián
Quebradillas
Camuy
Lares
HatilloArecibo
Utuado
Las MaríasMayagüez
Maricao
Cabo Rojo
Hormigueros
San GermánSabanaGrande
Lajas
Guánica
Yauco
Adjuntas
Guayanilla
PeñuelasPonce
Juana Díaz
Villalba
JayuyaOrocovis
Ciales
Florida
Barceloneta
ManatíVegaBaja Vega
Alta
MorovisCorozal
DoradoToa Baja
BayamónToa Alta
Naranjito
Barranquitas
Coamo
Aibonito
Salinas
Santa IsabelGuayama
Cayey
Cidra
Caguas
AguasBuenas
Comerío
Guaynabo
San Juan
TrujilloAlto
Gurabo
Loíza
Carolina
Río Grande
Canóvanas
Luquillo
Fajardo
Ceiba
Naguabo
HumacaoLas
PiedrasSan
Lorenzo
Juncos
Yabucoa
Maunabo
Patillas
Arroyo
Vieques
Culebra
0 5 10 15 20
Scale in Miles
4
SUSTAINABILITY OF LAND USE IN PUERTO RICO
AIM OF THE PROJECT
The aim of the project is to provide an accessible, easy-to-use and, at thesame time, reliable and feasible set of indicators and index model to guarantee its practicaluse and applicability for the municipalities in Puerto Rico. It also intends to measure andmonitor the impacts of land use changes for long term sustainability.
Sustainability cannot be achieved without addressing the issue of land use.Land use is at the heart of many of the environmental, social and economic issues in anypart of the world. Learning to recognize the linkages between the economic, social andenvironmental impacts of land use decisions is the essence of sustainability.
Sustainability of Land Use in Puerto Rico focuses on a preventive approach tohelp reduce the impact of unsustainable land use, and to strengthen and continue PuertoRico’s Road to Smart Growth project initiative, which was designed to diagnose the problemand create awareness.
ACHIEVEMENTS AND CONTRIBUTIONS
ACHIEVEMENTS
This is a groundbreaking project for Puerto Rico. It is envisioned as a first stepin the process of assessing Puerto Rico’s progress towards (or away from) sustainabilityusing the municipalities as reference. It’s the first time that relevant data are compiled andstudied for the development and completion of sustainable land use indicators and anindex. Further areas of research will be recommended to enhance the model, its scientificbase and increase its scope for public policy.
The model developed is accessible, easy-to-use- and, at the same time reliableand feasible. In general terms, it complies with the project’s definition of success since itmeets all of the selected criteria for the development of the indicators and index – includingtransferability. The model developed allows two levels for communicating the results tostakeholders: it provides uncondensed and detailed information of data sources andmethodologies for technical revision and for the analysis of further areas of research toimprove data and the model (technical language). It also provides condensed informationto begin analyzing trends for informed decision-making and public policy in an easy tocomprehend language. The use of the project’s results for decision-making and publicpolicy is considered in the original proposal as mid-term definition of success.
The project also achieved a highly satisfactory participation of key stakeholdersthrough a representative group, the External Advisory Committee. The members of theCommittee had a 70% participation rate throughout the duration of the project (specifically,78% for the representatives of the government agencies, and 56% for the representativesof the municipalities).
The project also provided effective team work for technical and decision-making personnel of the same programmatic areas and different governmental levels(federal, state or local-central and municipal), as well as different expert groups (academiaand professional organizations) in their task to develop and apply the proposed modelwith its indicators and index.

5
SPECIFIC CONTRIBUTIONS
• A DECISION-MAKING TOOL
Stakeholders can begin examining municipal land use choices and actions in terms ofhow they contribute in favor or against sustainability. Specifically, municipalities canbegin evaluating themselves using their own data and historical trends, and begincomparing themselves with other municipalities. Our project provides agroundbreaking initiative and a contribution in this direction.
• AN ASSESMENT TOOL THAT COULD SPEARHEAD PUBLIC POLICY
The results of each individual indicator used in the model, as well as the result of theindex, can trigger revisions of existing and the creation of new public policies towardssustainability. (Example: The results of the previous USEPA sponsored project at UMET- Puerto Rico’s Road to Smart Growth – helped to enact three Smart Growth andenvironmental related policies: Urban Center Revitalization Act, San Juan EcologicalCorridor Act, and Puerto Rico Land Use Plan Act.)
• A COLLABORATIVE AGREEMENT INCENTIVE
The disemination of this tool can promote intersectorial collaborative agreements tosupport municipalities in specific sustainability projects (educational, research andpublic policy).
• AN INITIATIVE TO PROMOTE FURTHER RESEARCH BASED ON LESSONS LEARNED
The work provides opportunities for improvement to some indicators that at presentlack more dependable and current data. It also provides research opportunities toexpand the indicators to a regional scale using watersheds or other regional municipalinitiatives as territorial planning units.
• AN OPPORTUNITY TO SCALE-UP AS AN ISLAND-WIDE MUNICIPAL MONITORING TOOL
The plan for this project is to eventually develop a Puerto Rico “state of land use forsustainability report” in which municipalities would be ranked every four to eight yearsaccording to their land use “eco-efficiency”.
• AN EXAMPLE FOR OTHER ISLANDS
The proposed model could be transferable to similar research initiatives in islandswith comparable scenarios.
AIM, ACHIEVEMENTS AND CONTRIBUTIONS

6
SUSTAINABILITY OF LAND USE IN PUERTO RICO
CHALLENGES AND LESSONS LEARNED
These were the main challenges encountered during the research processand the lessons learned.
• In Puerto Rico, reliability and availability of the metadata, especially for the use ofGeographic Information System (GIS), is a major challenge. Because of this specificchallenge, the use of GIS as the main technical and scientific tool for the model wasruled out. Consequently, the aim of the project was reoriented to “provide anaccessible, easy-to-use and, at the same time, reliable and feasible set of indicatorsand index model to guarantee its practical use and applicability for the municipalitiesin Puerto Rico, and to help measure and monitor the impacts of land use changes forlong term sustainability.”
• Many indicators have no clear or agreed upon benchmarks to measure progress towardssustainability. These indicators had to be evaluated separately with the stakeholdersto determine local planning goals. Objectivity was a major challenge which was keptin check when selecting these goals.
• The municipality as a territorial unit poses difficulties in data collection and analysiswhen the scope and origin of many of the land use activities have a regional or island-wide nature. Because of this, many potential indicators had to be eliminated.
• The modeling method had to consider dissimilar conditions across municipalities.
• Stakeholders’ participation from the beginning resulted in a successful collaborationand encouraged interest in the results of the project which was important for decision-making.
THEORETICAL BACKGROUND
SUSTAINABLE DEVELOPMENT
The dictionary defines “Sustainability” as “constant renewal, perpetuity andan inexhaustible system”. It also defines “Development” as “progress, change and expansionfor the better”. The sustainable development concept has evolved since the 1972 whenthe United Nations Conference on the Human Environment in Stockholm stated the goal ofjointly addressing economic development, ecological health and social equity concernsdue to the reality of the reduction of the Earth’s capacity to sustain life in the face of theoverwhelming growth of the world population, it’s consumption rate and, it’s depletion ofthe natural systems. The Conference urged the international community to prepareinternational, regional an sub-regional reports on the state and outlook of the environment.As a result, during the 1970’s and early 1980’s, a number of scientists, activists and policymakers began researching to respond to environmental, social and economic issues. Thefirst reports described the current situation and trends in the state-of-the environment andwere aimed at raising awareness (United Nations Environmental Programme [UNEP], 19728;2006; Porter, 2000; Rogers et al. 2008).

7
However, the terms “sustainability” and “sustainable development” were notofficially defined until 1987, when the United Nations’ World Commission on Environmentand Development released its report Our Common Future. This Report brought theseterms into widespread use. Our Common Future (also known as the Brundtland Report,after the Commisssion’s Chairman, Norwegian Primer Minister Grö Harlem Brundtland)defined sustainable development as a “development which meets the needs of the presentgeneration without compromising the ability of future generations to meet their own needs.”This definition is still the one mostly used around the world to establish the link betweendecision-making – usually related to the political will of governments – and balancing theeconomic and social needs of the human population with consideration for the regenerativecapacity of the natural systems (United Nations Organization [ONU], 19879; Krizek andPower, 1996; Porter, 2000; Rogers et al., 2008).
The dimensions of sustainable development (economic, environmental andsocial) can be summarized as follows (ONU, 1987; Krizek and Power, 1996; Bell andMorse, 2003; Sustainable Measures, 1998-2006; Rogers et al., 2008; International Institutefor Sustainable Development [IISD], 2009):
• THE ECONOMIC DIMENSION
The economic future of humanity depends on the integrity of natural systems. Incomecannot be maximized without maintaining constant or increasing stock of capital. Inother words, there is a need for a long term view of “living off the dividens” of ournatural resources by not exceeding their generation-rate capacity.
• THE ENVIRONMENTAL DIMENSION
The need to mantain the resilience and health of natural systems and ecologicalprocesses.
• THE SOCIO-CULTURAL DIMENSION
The need to achieve social equity and fairness, especially meeting the needs of thepoor, and the stability of cultural systems.
• MULTIDIMENSIONAL SYSTEM THINKING
The need to understand the interconnection and integration of the above threedimensions.
• INTERGENERATION JUSTICE
The need to preserve as many economic, social and environmental resources andoptions as possible for future generations because they have the right, as previousgenerations did, to determine their needs.
So a system with “strong sustainability” is a system where the existing stock ofnatural capital is mantained and enhanced because it is understood that the functions itperforms to sustain life is not duplicated by manufactured capital. And a system with“weak sustainability” is the system that assumes that the natural capital can be replaced orduplicated by manufactured goods and services. In other words, that it can be usedindefinitely and converted into manufactured capital of equal value (Hart, 1999).
THEORETICAL BACKGROUND
8 For more information about thisinitiative also see http://www.unep.org/Documents.Multilingual/Default.asp?DocumentID=97.
9 For more information about thisinitiative also seehttp://www.un-documents.net/wced-ocf.htm.

8
SUSTAINABILITY OF LAND USE IN PUERTO RICO
In the June, 1992, the United Nations’ Conference on Environment andDevelopment in Río de Janeiro, Brazil (commonly referred to as the Río de Janeiro EarthSummit), representatives from almost every nation adopted a broad action strategy with aset of principles, programs and activites in the form of international treaties and agreementsto achieve sustainable development under what was called Agenda 21 (or agenda for the21st century). One of the activities called for the first time on governments and non-government organizations at the national and international levels for the development ofsustainable development indicators for decision-making (Chapter 40 of Agenda 2110). Asa result, the United Nations’ Commission on Sustainable Development (CSD)11, under theDivision of Sustainable Development12, adopted a work programme for the developmentand disemination of a core list of indicators for sustainable development. During 1996and 1999 the first draft set of indicators was developed with their methodological sheetsfor discussion jointly with the Statisctics Division13, both within the United NationsDepartment of Economics and Social Affairs. From 1996 to 1999, 22 countries pilot-testedthis set of indicators and, since then, a large number of government and non-governmentorganizations around the world have developed their own particular set of indicatorsusing CDS guidelines. In other words, sustainable development indicators are deeply rootedin the Agenda 21 initiative. Unfortunately, progress towards using indicators for theimplementation of sustainable development plans has been very slow (United NationsDepartment and Economic and Social Affairs [UNDESA], 2007; Bell and Morse, 2008; IISD,2009).
INDICATORS
There are a number of tools and methodologies to help determine progresstowards sustainability. One example is the “carrying capacity” of an ecosystem that is mostlyused by ecologists: The size of the population that can be supported indefinitely uponthe available resources and services (or living within the limits of an ecosystem). Anotheris the ecological footprint which is mostly expressed quantitatively as the amount of landarea required to maintain the unit that is being analyzed. For example, if the unit beinganalyzed is a country, the amount of land area needed, in terms of natural resources, tomantain the actual economic and social activities of that country. The greater the land areato maintain that unit, the greater the resources needed to sustain the existence of that unitand, as a result, the larger it’s ecological footprint. Even though the ecological footprinthas gained popularity in recent years, the most common approach to measure sustainabilityis still the use of indicators and indices (Hart, 1999; Bell and Morse, 2003).
Indicators help translate complex data into comprehensive information andcan show progress towards a goal. Indicators can be understood as “signs that point out,or stand for, something. They provide clues about the condition or viability of a system orthe state of its health” (UNEP, 2006). “They are symbolic representations designed tocommunicate a property or trend in a complex system or entity. They are a communicationtool. Failure to communicate makes the indicator worthless” (Moldan and Dahl, 2007).They are “variables that summarize or otherwise simplify relevant information, make visibleor perceptible phenomena of interest, and quantify, measure, and communicate relevantinformation” (Gallopin, 1997).
10 For more details about Agenda 21and its Chapter 40 see http://www.un.org/esa/sustdev/documents/agenda21/english/agenda21toc.htm or http://www.un.org/esa/dsd/dsd_aofw_ind/ind_index.shtml.
11 For more details about CSD seehttp://www.un.org/esa/dsd/csd/csd_aboucsd.shtml
12 For more details about this Divisionsee http://www.un.org/esa/dsd/index.shtml.
13 For more information about thisDivision and its contribution in theimplementation of Agenda 21 seehttp://unstats.un.org/unsd/aboutus.htm.

9
There are many examples of indicators. It depends on “why, where, whenand how much” when developing a set of indicators for a specific country, region, city oreven community. According to Meadows (1998) and Bell and Morse (2003), most of thereported sustainability indicators are place, cultural and time specific, and there are veryfew, if any, key indicators that could apply the same way across similar systems. “Given thatsustainable development typically envisaged as having environmental, social and economicdimensions, then the usual approach is to develop a framework of indicators that cover allof these, perhaps in conjunction with a single index that tries to bring them all togetherinto a numerical value” (Mitchell, 1996 as quoted in Bell and Morse, 2003).
The quality of an indicator depends on a number of factors. In general terms(Guy and Kibert, 1998; Meadows, 1998; Hart, 1999; United Nations Education Scientificand Cultural Organization [UNESCO], 2003b; UNEP, 2006; Sustainable Measures, 1998-2006; Moldan and Dahl, 2007; Bell and Morse, 2003, 2008; UNDESA, 2007; IISD, 2009), anindicator should have:
• PURPOSE AND APPROPRIATENESS (represent the phenomenon concerned)
• SPECIFICITY AND ACCURATENESS (clearly define the objective and relate to outcomes)
• USABILITY (practicality)
• RESPONSIVENESS (respond quickly and measurably to changes)
• MEASURABILITY OR POTENTIALITY TO REVEAL TRENDS OVER TIME (implies quantitativevalue)
• RELIABILITY AND FEASIBILITY (well-founded basis in quality data based on the bestavailable and usable information or in scientific methodologies)
• AVAILABILITY (with data that is relatively easy to collect, and available on a regularbasis and in the future)
• SIMPLICITY AND COMMUNICABILITY TO THE TARGET AUDIENCE (understood by thelay person, kept to the necessary minimum number of indicators and translated intosome type of visual form for presentation to the audience [graphs, tables, maps, etc.])
• HIERARCHY (a user will be able to understand the technical details or can also get thegeneral message quickly)
• COST EFFECTIVENESS (affordability to access, manage and reproduce)
• TRANSPARENCY THROUGH A PARTICIPATORY PROCESS IN ITS DEVELOPMENT,ENGAGING STAKEHOLDERS AND DECISION-MAKERS
• RELEVANCE FOR PUBLIC POLICY (can trigger and facilitate action for decision-makers)
THEORETICAL BACKGROUND
10
SUSTAINABILITY OF LAND USE IN PUERTO RICO
In order to develop indicators, data availability is one of the most importantselection criteria. They can be quantitative and/or qualitative in value, however the bestavailable data needs to be feasible and reliable following agreed upon quality standards.Although it is always possible to improve data quality and to develop new data sets, thiscan be costly for stakeholders. If the aim of developing indicators is to promote theiraction towards sustainability, costs must be kept low. So simplicity and practicality are keyin their development (UNEP, 2006; Molan and Dahl, 2007). “Indicators are merely assesmenttools, for which the cost of improvements should not limit the capacity to implementpolicy. The two must be matched in cost-effective ways” (Molan and Dahl, 2007).
Indicators are also used to show historical trends and / or show performanceby calculating their progress towards a benchmark (a scientifically determined threshold)or a target (endpoints based on human values or policy-oriented goals). The aim is to havethe indicator reach the desired optimal goal, such as a best practice for the indicator. Thishelps decision-makers and managers evaluate and understand the gap between the currentand the optimal state of the environmental, social and/or economic progress. In theenvironmental dimension, for example, there are legal targets for levels of pollutantsemissions or concentrations in the air and water, and beyond that level scientists agreethat the system is no longer sustainable. There are also historical (for example, using aspecific year as baseline against which to plan the future), geographical (percentage ofland area, for example), and theoretical references, as well as experts’ opinions (what arethe “worst” and “best” conditions) to base decisions for an optimal state which representssustainability. When the opinion of experts and stakeholders are used there may be someunalienable subjectivity and value judgment in the process, but in most cases it is still thebest available reference. Also, when developing indicators, all of these approaches foroptimal conditions to calculate deviations can be combined. Different ones can be usedfor each indicator, depending on the available information and framework (Bell and Morse,2003; UNEP, 2006).
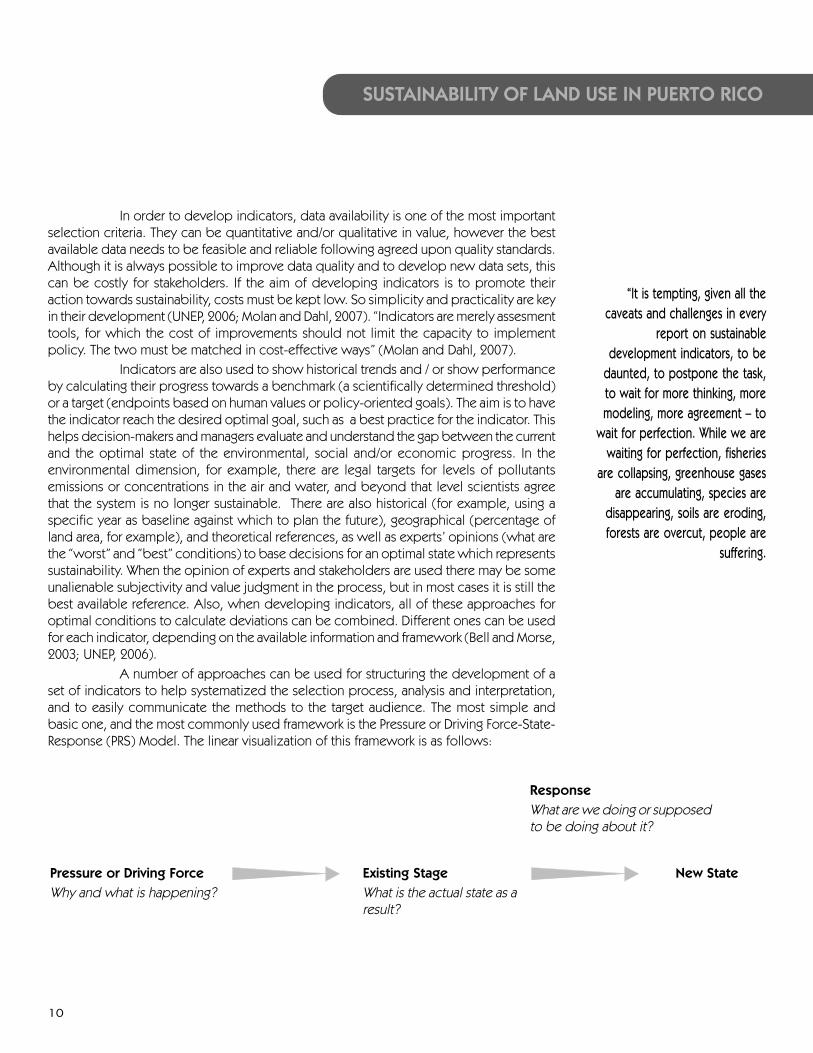
A number of approaches can be used for structuring the development of aset of indicators to help systematized the selection process, analysis and interpretation,and to easily communicate the methods to the target audience. The most simple andbasic one, and the most commonly used framework is the Pressure or Driving Force-State-Response (PRS) Model. The linear visualization of this framework is as follows:
“It is tempting, given all thecaveats and challenges in every
report on sustainabledevelopment indicators, to be
daunted, to postpone the task,to wait for more thinking, moremodeling, more agreement – to
wait for perfection. While we arewaiting for perfection, fisheries
are collapsing, greenhouse gasesare accumulating, species are
disappearing, soils are eroding,forests are overcut, people are
suffering.
Existing StageWhat is the actual state as aresult?
ResponseWhat are we doing or supposedto be doing about it?
Pressure or Driving ForceWhy and what is happening?
New State

11
This approach assumes a target (the desired or new state) which could bereached if changes are made to improve the existing stage. It is very useful in understandingthe relationship between a problem and the forces that are causing the existing state. Italso helps to understand the responses needed to prevent it or to fix it, providing a levelof analysis to be used by decision-makers (Hart, 1999; Bell and Morse, 2003; Esty et al.2005; UNEP, 2006; Sustainable Measures, 1998-2006; UNDESA, 2007).
The PRS Model was first used by the Organization for the EconomicCooperation and Development (www.oecd.org) in 1994. After the PRS Model wasintroduced, other cause-and-effect variations and approaches has been developed bynumerous entities using the PRS Model as a framework. For example, the Driving Force-Pressure-Sate-Impact Response (DPSIR); the Driving Force-Sate-Response (DSR); thePressure-State-Impact-Response (PSIR) and the Driving Force-Pressure-State-Exposure-Effects-Action (DPSEEA) (for more information about these approaches see UNESCO,2003b; Bell and Morse, 2003; UNEP, 2006; Moldan and Dahl, 2007). Although the PRS Modelhas been criticized for being simplistic in its linear cause-and-effect approach to considerall the complexities and subjectivity involved in understanding the pressure, state andresponses, and their enclosement in a larger system with human - environment interactions,it is still the most applied approach. The important thing to keep in mind is its use as aframework tool to structure the development of indicators but not to assume underlyingfunctional causalities (Galloping, 1997; UNEP, 2006). As mentioned earlier, simplicity andcommunicability to the target audience and the lay person is a desirable must.
The same applies to individual indicators. “Indicators cannot replace scientificstudies of cause and effect. They are presentations of associations and links betweenvariables. When we choose to present variables together as part of an indicator, we makean explicit assumption of their connection. Indicators, therefore, can never replace statisticalanalyses of data or the development and testing of sound hypotheses.” The PRS Model, aswell as the individual indicators, are just one of the “necessary parts of the flow ofinformation to help us understand the world, make decisions, and plan actions”. Therewill always be a degree of incompleteness, imperfection and uncertainity in the use ofmodels and in the selection of a set of indicators. “When a system is extremely complex,it takes trial-and-error, and learning to produce a serviceable set of indicators.” The importantfactor is to continue reducing these pitfalls and difficulties (Meadows, 1998; EAA, 2002as quoted in Moldan and Dahl, 2007). Also, there is not an “ideal” best framework model.The important thing is that it works well for the intended purpose (Sustainable Measure,1998-2006).
Literature indicates that another major challenge is the lack of commitmentfrom stakeholders to implement sustainability indicators. This could be in part due to thereluctantness of the scientific community to get involved in the socio-political arena. Usuallythe emphasis in the development of indicators has been on the technical excellence andnot helping manage change for decision-makers. This is probably the reason why sustainableindicators are not being as widely used as desired by decision-makers and end up asanother research initiative in a data collection division of an agency. There are two importantsteps to addressing this problem. First, is engaging the stakeholders from the outset in aparticipatory process for the selection and construction of the indicators, and second isto circumscribe a set of performance indicators to which decision-makers can be heldresponsible.
THEORETICAL BACKGROUND
So it is important to get somepreliminary indicators out thereand into use, the best we cando at the moment. That way, aslong as we are willing toevaluate and make corrections,we can start to learn, which isthe only way we can everachieve sustainabledevelopment. We need tolearn, but we need to waste notime with our learning.”
Donella Meadows, 1998
12
SUSTAINABILITY OF LAND USE IN PUERTO RICO
The development of sustainability indicators should not become focused onmethodological and technical issues. They need to also have practical use to bring aboutchange. Policy effective indicators are the ones that can link changes in variables to policyefforts. If decision-makers and other stakeholders are involved in the process of selectingand constructing the indicators, they also end up having some resposibility in their use toattain positive changes. This is important and should be taken into consideration in themodels used to structure the development of indicators. Decision-makers are always lookingfor tools that can help them identify problems, track trends and set priorities for policies,investments and actions (Bell and Morse, 2003; Esty et al., 2005; Moldan and Dahl, 2007).
INDICES
Condensing complex information for analysis and easy interpretation bydecision-makers and other stakeholders (usually non-specialists) is highly desirable. Theuse of indices is a way to condense and simplify so as not to overwhelm the target audiencewith detailed information and technical data. Specifically, “an index is a mathematicalaggregation of variables or indicators, often across different measurement units so that theresult is condensed and dimensionless” (UNESCO, 2003b). The advantage of an index isthat it provides an overall picture of a system being evaluated in a simple but compellingway for stakeholders and the general public (Esty et al. 2005). Scientists and techniciansare more interested in the details of the methodology and they usually prefer rawuncondensed data. On the other hand, decision-makers and the general public prefercondensation and more visual interpretation of the data in a way that is manageable onhow it relates to benchmarks and targets. So, a hybrid approach is generally recommendedin the presentation with the unwrapped detailed information to reveal the underlying dataand methods and the wrapped result in an index (Meadows, 1998; Bell and Morse, 2003).
In addition, an index should include a weighing scheme to balance out therelationships among the disparate indicators and their dependence on subjectiveinterpretation. The aggregation and weighing methods need to be transparent and basedon a clearly defined mathematical model. This is important since the main limitations ofindices are that they can become too abstract or/and that they can hide defects in thecondensing of many variables into a single measure (Bell and Morse, 2003; UNESCO, 2003b;Esty et al., 2005; UNEP, 2006). Also, the risk of oversimplifying the complexities of therelationship and interaction processes between the social, economic and environmentaldimensions is always an issue when developing indicators and indices. This is the reasonwhy correlative conclusions should be drawn from indicators and indices rather than ascientifically causal relationship between trends and stressors, or between implementedpolicies and positive or negative changes in the state towards sustainable development(UNEP, 2006).

13
Indices
Indicators
Data
Public
Scientists and Technicians
Policy-makers &Managers
FIGURE 3: PYRAMID OF INDICATORS SETS
Increasing condensation of data
THEORETICAL BACKGROUND
Source: Braat (1991) and OECD (1998) as published in Bell and Morse (2003).
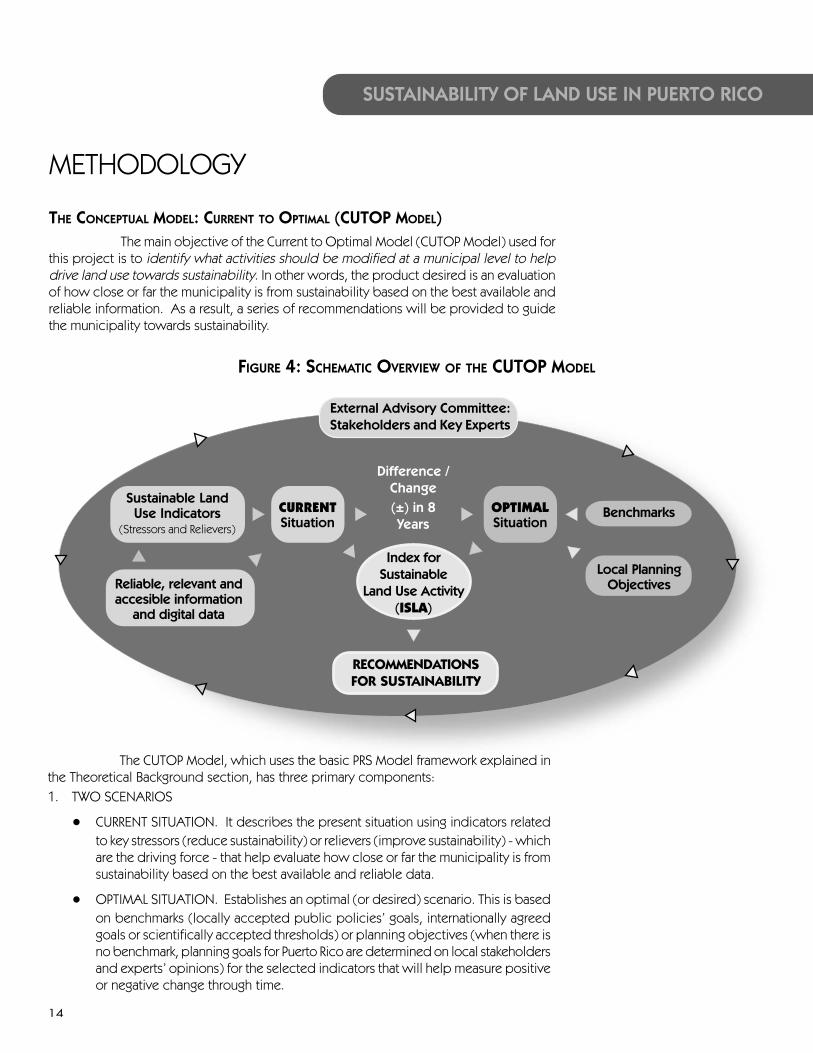
14
SUSTAINABILITY OF LAND USE IN PUERTO RICO
METHODOLOGY
THE CONCEPTUAL MODEL: CURRENT TO OPTIMAL (CUTOP MODEL)The main objective of the Current to Optimal Model (CUTOP Model) used for
this project is to identify what activities should be modified at a municipal level to helpdrive land use towards sustainability. In other words, the product desired is an evaluationof how close or far the municipality is from sustainability based on the best available andreliable information. As a result, a series of recommendations will be provided to guidethe municipality towards sustainability.
The CUTOP Model, which uses the basic PRS Model framework explained inthe Theoretical Background section, has three primary components:1. TWO SCENARIOS
• CURRENT SITUATION. It describes the present situation using indicators relatedto key stressors (reduce sustainability) or relievers (improve sustainability) - whichare the driving force - that help evaluate how close or far the municipality is fromsustainability based on the best available and reliable data.
• OPTIMAL SITUATION. Establishes an optimal (or desired) scenario. This is basedon benchmarks (locally accepted public policies’ goals, internationally agreedgoals or scientifically accepted thresholds) or planning objectives (when there isno benchmark, planning goals for Puerto Rico are determined on local stakeholdersand experts’ opinions) for the selected indicators that will help measure positiveor negative change through time.
FIGURE 4: SCHEMATIC OVERVIEW OF THE CUTOP MODEL
External Advisory Committee:Stakeholders and Key Experts
RECOMMENDATIONSFOR SUSTAINABILITY
Difference /Change(±) in 8Years
Reliable, relevant andaccesible information
and digital data
Sustainable LandUse Indicators
(Stressors and Relievers)
CURRENTSituation
OPTIMALSituation
Benchmarks
Local PlanningObjectives
Index forSustainable
Land Use Activity(ISLA)

15
2. PROVIDE AN INDEX to communicate in a simple way status (Current Situation) andmeasure progress.
3. RECEIVE CONSTANT FEEDBACK AND COLLABORATION for the decision-makingprocess and for recommendations by stakeholders, experts and partners (ExternalAdvisory Committee and key experts).
STEPS IN THE METHODOLOGICAL APPROACH OF THE CUTOP MODEL
Sixteen steps were taken in this methodological approach:
1. Definition of the information needed and literature review on the topic (understandthe context for sustainability indicators and indices).
2. Construction of the Conceptual Model based on the aim of the project (clarify themethodology).
3. Site selection and characterization (selection of the case studies to establish theparameters which will eventually be used for other municipalities).
4. Selection and gathering of external stakeholders in an advisory committee forcollaboration in the research and the decision-making processes, and for theendorsement of the project.
5. Selection of a preliminary list of possible indicators.
6. Collection and analysis of available information and digital data for the preliminaryindicators.
7. Analysis of GIS maps, aerial photographs and satellite data for the preliminary indicatorsthat needed to be developed with this technical tool.
8. Validation of indicators with sufficient and reliable data and elimination of indicatorswith insufficient or unreliable data.
9. Selection of the final list of indicators based on specific criteria.
10. Development of the mathematical model for the index.
11. Development of the selected indicators with their results (Current Situation, how thingsare) after steps 5, 6, 7, 8 and 9, and dividing them into categories.
12. Selection of benchmarks or planning objectives for each indicator (Optimal Situation,how things should be); and dividing them into stressors or relievers.
13. Assignment of appropriate sustainability weight to the indicators under each category.
14. Final reevaluation and validation all the information and digital data, the methodologiesused for the development of each indicator and its result by the Project Team (one-to-one interviews with key technical personnel from Commonwealth and federalagencies and other experts), the External Advisory Committee and an external evaluator.
15. Data integration for the sustainability index (composite index model).
16. Analysis and evaluation of the outcomes for each indicator and the index for conclusionand recommendations.
METHODOLOGY
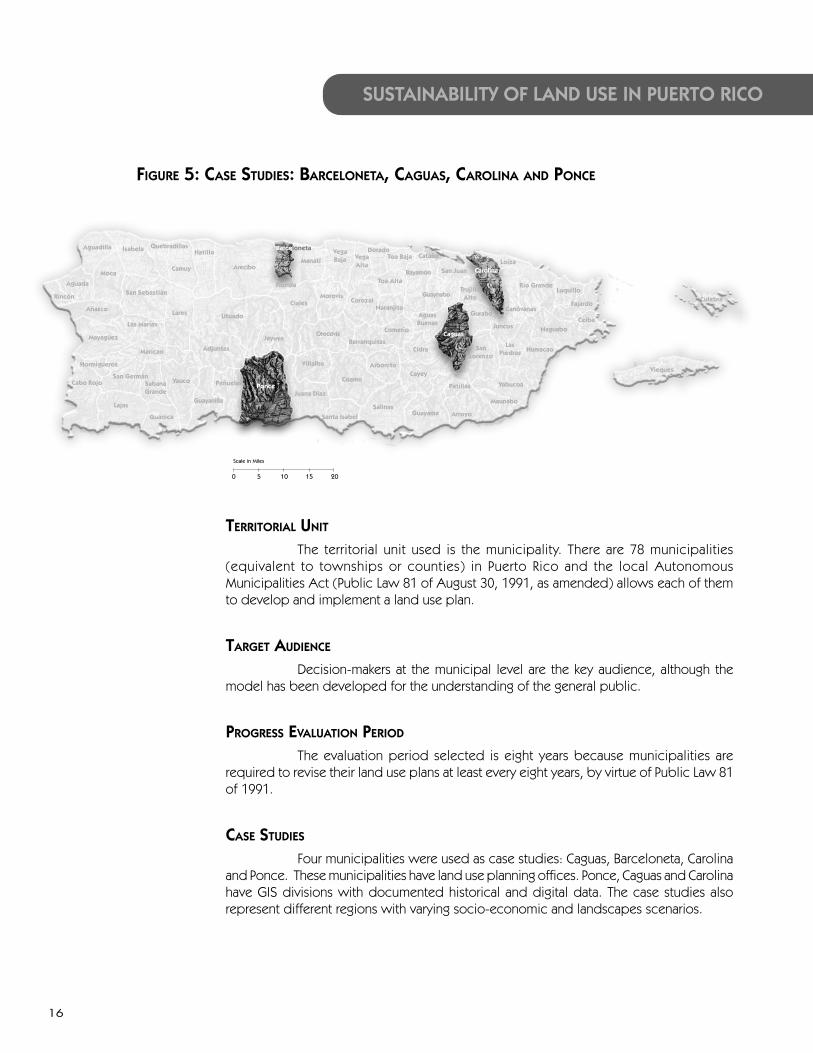
16
SUSTAINABILITY OF LAND USE IN PUERTO RICO
TERRITORIAL UNIT
The territorial unit used is the municipality. There are 78 municipalities(equivalent to townships or counties) in Puerto Rico and the local AutonomousMunicipalities Act (Public Law 81 of August 30, 1991, as amended) allows each of themto develop and implement a land use plan.
TARGET AUDIENCE
Decision-makers at the municipal level are the key audience, although themodel has been developed for the understanding of the general public.
PROGRESS EVALUATION PERIOD
The evaluation period selected is eight years because municipalities arerequired to revise their land use plans at least every eight years, by virtue of Public Law 81of 1991.
CASE STUDIES
Four municipalities were used as case studies: Caguas, Barceloneta, Carolinaand Ponce. These municipalities have land use planning offices. Ponce, Caguas and Carolinahave GIS divisions with documented historical and digital data. The case studies alsorepresent different regions with varying socio-economic and landscapes scenarios.
FIGURE 5: CASE STUDIES: BARCELONETA, CAGUAS, CAROLINA AND PONCE
Aguadilla Isabela
Moca
Aguada
Rincón
Añasco
San Sebastián
Quebradillas
Camuy
Lares
Hatillo
Arecibo
UtuadoLas Marías
Mayagüez
Maricao
Cabo Rojo
Hormigueros
San GermánSabanaGrande
Lajas
Guánica
Yauco
Adjuntas
Guayanilla
Peñuelas PonceJuana Díaz
Villalba
JayuyaOrocovis
Ciales
Florida
Barceloneta
ManatíVegaBaja Vega
Alta
MorovisCorozal
DoradoToa Baja
BayamónToa Alta
Naranjito
Barranquitas
Coamo
Aibonito
Salinas
Santa Isabel Guayama
Cayey
Cidra
Caguas
AguasBuenas
Comerío
Guaynabo
San Juan
TrujilloAlto
Gurabo
LoízaCarolina
Río Grande
Canóvanas
Luquillo
Fajardo
CeibaNaguabo
HumacaoLas
PiedrasSan
Lorenzo
Juncos
Yabucoa
Maunabo
Patillas
Arroyo
Vieques
Culebra
0 5 10 15 20
Scale in Miles
Cataño

17
TABLE 1: HIGHLIGHTS OF THE CASE STUDIES14
Variable Barceloneta Caguas Carolina Ponce
1. Year founded 1881 1775 1857 1692
2. Km2 48.43 152.03 117.33 297.07
3. Wards (“barrios”) 4 11 13 31
5. Population 22,322 140,502 186,076 186,475
6. Population density by km2 461 924 1,586 628
7. Median age 31.1 33.3 33.5 33.5
8. Housing units 8,375 50,568 71,347 66,471
9. Employment rate 76.2 83.8 92.9 74.9
10. Major employment sector(s)
Coastal / south-central. Mostlysubtropical dryforest (coastal
south), where theweather is
relatively dry andhot, and to the
north mountainouswith subtropicalmoist and west
forest. The coastalsouth has dry saline
wetlands andalluvial plain, andthe mountainous
north is part of thecentral volcanic
region.
Industrial(mostly
pharmaceutical)
Educational,Health and Social
Services
Retail Trade Retail Trade andConstruction
(Considered theeconomic pole ofthe southern part
of the island)
11. Location, ecological life zones and substrate (geoclimatic information)
Costal / north-central. Subtropical
moist forest. Thenorthern portion
consists ofwetlands (moistsaline and non-
saline) and alluvialplain, and the
southern part islimestone (tropical
karst).
Interior / central.Mostly
subtropicalmoist forest with
somesubtropical wet
forest to thesouth.
Dominated bymountains from
the centralvolcanic region
of the island andalluvial plain
(Caguas Valley).
Coastal / north-east. Subtropicalmoist forest. Thenorthern portionis dominated bywetlands (moistsaline), alluvialplain and the
south is part ofthe central
volcanic region.
METHODOLOGY
14 Most of the information is fromthe 2000 U.S. Census and Gouldet al.,2008.

18
SUSTAINABILITY OF LAND USE IN PUERTO RICO
INDICATORS’ SELECTION CRITERIA
Based on the reviewed literature, the following eight criteria were used toselect the indicators for this project:
1. RELIABILITY AND VALIDITY of the all the data based on the best availabletechnical and scientific information in government agencies and other sources(complete, most recent information, and with a methodology).
2. SIMPLICITY AND LIMITED IN NUMBER for easy comprehension to the targetaudience and the general public.
3. RELEVANCE, FUNCTIONALITY AND PRACTICALITY for planning and for assessingprogress at the municipal level to help improve outcome of decision-making,preferably through the implementation of public policy.
4. AVAILABILITY AND EASY ACCESSIBILITY AND MANAGEMENT of theinformation for the municipalities to be able to obtain, verify and reproduce.
5. ADAPTABILITY TO DIFFERENT SCENARIOS because there are 78 municipalitieswith varying environmental, social and economic characteristics.
6. ABILITY TO EVALUATE CURRENT SITUATION AND FUTURE TRENDS for continuityin their use (the data can be collected and updated with some frequency orcan be used to forecast tendencies).
7. HAVE QUANTITATIVE AND QUALITATIVE VALUE for the target audience andthe general public.
8. AFFORDABILITY in the process of obtaining the data, its validation, thereproduction of the indicators and the feasibility of initiating a monitoringprocess that will help measure progress in the future.
MATHEMATICAL MODEL FOR THE INDEX
REQUIRED ACTIONS TO DEVELOP THE INDEX
To develop the index, the Project Team and the External Advisory Committeecarried out the following tasks:
• Selected the final indicators;
• defined benchmarks or planning objectives for each of the indicators;
• classified the indicators into relievers and stressors;
• and assigned weights for each of the indicators.
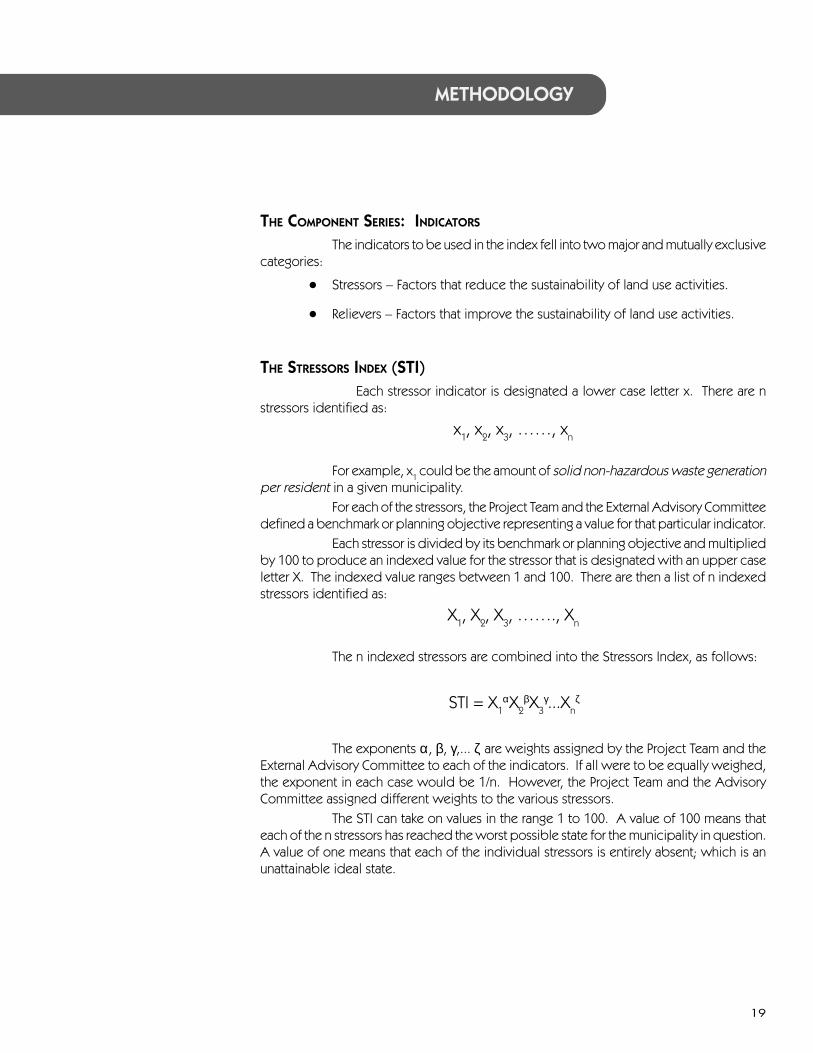
19
THE COMPONENT SERIES: INDICATORS
The indicators to be used in the index fell into two major and mutually exclusivecategories:
• Stressors – Factors that reduce the sustainability of land use activities.
• Relievers – Factors that improve the sustainability of land use activities.
THE STRESSORS INDEX (STI)Each stressor indicator is designated a lower case letter x. There are n
stressors identified as:
x1, x
2, x
3, ……, x
n
For example, x1 could be the amount of solid non-hazardous waste generation
per resident in a given municipality.For each of the stressors, the Project Team and the External Advisory Committee
defined a benchmark or planning objective representing a value for that particular indicator.Each stressor is divided by its benchmark or planning objective and multiplied
by 100 to produce an indexed value for the stressor that is designated with an upper caseletter X. The indexed value ranges between 1 and 100. There are then a list of n indexedstressors identified as:
X1, X
2, X
3, ……., X
n
The n indexed stressors are combined into the Stressors Index, as follows:
n321 ...XXXXSTI =
The exponents α, β, γ,... ζ are weights assigned by the Project Team and theExternal Advisory Committee to each of the indicators. If all were to be equally weighed,the exponent in each case would be 1/n. However, the Project Team and the AdvisoryCommittee assigned different weights to the various stressors.
The STI can take on values in the range 1 to 100. A value of 100 means thateach of the n stressors has reached the worst possible state for the municipality in question.A value of one means that each of the individual stressors is entirely absent; which is anunattainable ideal state.
STI = X1αX
2βX
3γ...X
nζ
METHODOLOGY

20
SUSTAINABILITY OF LAND USE IN PUERTO RICO
THE RELIEVERS INDEX (RI)Each reliever indicator is designated a lower case letter y. There are m relievers
identified as:
y1,y
2, y
3, ……, y
m
For example, y1 could be the percentage of land officially protected in a
given municipality.For each of the relievers, the Project Team and the External Advisory Committee
defined a benchmark or planning objective representing an optimal value for that particularindicator.
Each reliever is divided by its benchmark and multiplied by 100 to produce anindexed value for the reliever that will be designated with an upper case letter Y. The indexedvalue ranges between 1 and 100. There are a list of m indexed relievers identified as:
Y1, Y
2, Y
3, ……., Y
m
The m indexed relievers are then combined into the Relievers Index, as follows:
m321 ...YYYYRI =
The exponents α, β, γ,…ζ are weights assigned by the Project Team and theExternal Advisory Committee to each of the indicators. If all were to be equally weighed,the exponent in each case would be 1/m. However, the Project Team and the AdvisoryCommittee assigned different weights to the various relievers.
The RI can take on values in the range 1 to 100. A value of 100 means thateach of the m relievers have reached the best possible state for the municipality in question.A value of one means that each of the individual relievers is entirely absent; which is theworst possible state.
THE INDEX OF SUSTAINABLE LAND USE ACTIVITY (ISLA)The Relievers Index and the Stressors Index are then combined into a single
index to measure sustainability, as shown below:
100xSTI
RIISLA =
Multiplication by 100 and the taking of the square root are mathematicaltransformations designed to generate an easy-to-read scale for the index. As designed,the index can take on values between 1 and 100. A value of 100 is the best-case state,while a value of 1 is the worst-case state.
RI = Y1αY
2βY
3γ...Y
mζ
ISLA = RISTI
X 100

21
A value of 10 happens when the STI and RI have the same value, in whichcase they cancel each other out. For readings below 10, the STI is larger than the RI andISLA is stressor-dominated (or very low in sustainability). For values higher than 10, ISLA isreliever-dominated (or starting to improve in sustainability). A reading of 10 is a stalematemarking the threshold in sustainability. The figure above presents the proposed interpretationof the ISLA values.
FIGURE 6: ISLA VALUES FROM VERY LOW SUSTAINABILITY TO VERY STRONG SUSTAINABILITY
METHODOLOGY
100
60
30
10
Very Strong Sustainability
Strong Sustainability
Improving Sustainability
Weak Sustainability
Very Low Sustainability (Stressors Rule)

22
SUSTAINABILITY OF LAND USE IN PUERTO RICO
OUTREACH AND EXTERNAL COLLABORATION
The systematization of the link between stakeholders and the project wasachieved through:
• An External Advisory Committee that met regularly.
• The Project Team participation in public activities.
• One-to-one meetings and interviews with informed representatives of keygovernment agencies.
• The collaboration of the University with government agencies in related publicpolicy initiatives.
EXTERNAL ADVISORY COMMITTEE
The Committee met regularly once every two to three months during the firsttwo years of the project. The last year, the Committee met once for the presentation of thefinal results and to discuss conclusions and recommendations. Its members were assignedrepresentatives from the following federal and local government entities (see Appendix Cfor the participants):
• U.S. Department of Agriculture (USDA), Forest Service, International Instituteof Tropical Forestry
• USDA, Natural Resources Conservation Services (NRCS)
• P.R Department of Agriculture (PRDA)
• P.R. Department of Natural and Environmental Resources (PRDNER)
• PR Environmental Quality Board (PREQB)
• PR Planning Board (PRPB)
• 13 municipalities (as a sample of the 78 municipalities in Puerto Rico), includingthe 4 case studies.
• A representative from the Puerto Rico Planning Society’s Board of Directors.
• Estudios Técnicos, Inc. and Advantage Busines Consulting, two local planningand economic consulting firms from the private sector.
PUBLIC MEETING
An important opportunity for stakeholders’ participation, in addition to theExternal Advisory Committee, was the Puerto Rico Social Forum held the week of November13, 2006 at the University of Puerto Rico, Río Piedras Campus. The activity, which had morethan 1,500 attendees, presented a wide range of topics, including our project: Sustainabilityof Land Use in Puerto Rico. During our presentation on November 19, several importantrecommendations for the indicators were provided by the attendees. Some of these wereincorporated into the final list of indicators.

23
GOVERNMENT OUTREACH
An important task was obtaining the collaboration of key federal and localgovernment agencies in order to obtain and validate information. The Project Team metand interviewed key technical personnel from the following agencies:
• USEPA’s Caribbean Office
• USDA, NRCS
• USDA, Forest Service, International Institute of Tropical Forestry
• PRDA
• P.R. Department of Health (PRDOH)
• PRDNER
• P.R. Electric Power Authority (PREPA)
• PREQB
• PRPB
• P.R. Solid Waste Management Authority (PRSWMA)
• P.R. Aqueduct & Sewer Authority (PRASA)
OTHERS
The Project Team interviewed Aurelio Mercado, Ph.D., Director of the CoastalHazards Center, Sea Grant Program, Department of Marine Science of the University ofPuerto Rico, Mayaguez Campus for two of the indicators: Coastal flood hazard and Residentsliving in floodways.
Also, the University was invited to be part of the Sustainable Committee forthe PRPB’s Land Use Plan (required by the Puerto Rico Land Use Plan Act, Public Law 550 ofOctober 3, 2004) and to collaborate with the PREQB on the development of island-wideenvironmental indicators for Puerto Rico (required by the Sustainable Development PublicPolicy Act, Public Law 267 of September 10, 2004, as part of the Puerto Rico AnnualEnvironmental Quality Report for the Legislature and the Governor as required by the newamendment of the Environmental Public Policy Act, Public Law 416 of September 22,2004).
In addition, this project enhances key ongoing initiatives at UMET. First, thePuerto Rico Spanish version of the International City / County Management Association(ICMA) and Smart Growth Network’s educational publication Getting to Smart Growth:100 Policies for Implementation (available to download in PDF in the Internet atwww.proyectosambientales.info). Second, the two-day seminar on Urban Redevelopment:Incorporating Communities held on January 18 and 19, 2007 with the participation of theOffice of Policy, Economics and Innovation of the Development, Community andEnvironmental Division of the USEPA in Washington, D.C., the University of Maryland andSmart Growth Network.
OUTREACH AND EXTERNAL COLLABORATION

24
SUSTAINABILITY OF LAND USE IN PUERTO RICO
SCIENTIFIC SOUNDNESS AND RELEVANCE
The analysis involved selecting, evaluating and validating the indicators throughpublished research studies, best available and accessible quantifiable data sources indifferent government agencies, and interviews with local scientists and informedstakeholders for the quality control and relevance of the indicators to the aim of the projectand the realities of Puerto Rico.
The following environmental assessment approach was used for the overallresearch process:
• The collection, organization and analysis of available and best reliable data inPuerto Rico to evaluate the likelihood of the impact of different stressors orrelievers that could measure progress towards sustainability. See page 18 forthe indicators’ selection criteria list and Appendix D: Rational and Methodologyof Each Indicator.
In addition, the use of GIS as a technical and analytical tool for geoprocessingto generate derived data sets. This includes, among other things, line distance,spatial and cluster analysis for building some of the indicators. See AppendixD. The digital data used are official and updated (most reliable and recent)from various federal and Commonwealth agencies, and from case studies(municipal governments): PRPB; PRDNER; Municipal Revenue Collection Center(MRCC); municipal planning and land use offices from the four case studies;2000 U.S. Census Bureau data sets (Housing units shapefile [block centroids]-Summary File 3 [SF-3], Population shapefile [block centroids]-Summary File 1[SF-1] and TIGER/Line files for roads); USDA, NRCS’ GIS soils database; andFederal Emergency Management Agency’s (FEMA) Flood Insurance Rate Maps(FIRM). These digital data were provided via disks, e-mail or downloadedfrom the agencies’ electronic bulletin boards or as hard copy. They were alsoreceived in different formats: ArcView shapefiles, ArcInfo coverages, and Arcexport files.
• The proposal of a conceptual model to develop a sustainability index wasbased on: (a) two basic scenarios – the current situation and a desired oroptimal situation for sustainability – (b) and measurement endpoints usingindicators with benchmarks or planning objectives for the optimal level foreach indicator. See page 14 for the CUTOP Model.
• An index that summarizes and integrates the quantities and qualitativeexpressions of unsustainability risk (from weak or low in sustainability to strongor high in sustainability). These expressions are accompanied by an explanatorytext interpreting the results and recommendations for actions or public policiesfor sustainability purposes. See page 18 for the ISLA (index) and the Resultsand Recommendations sections.
• The use of case studies to establish the parameters that will be used later forother municipalities on the island. See page 16 for the case studies.

25
QUALITY CONTROL
The Project Team assessed quality in the research process through:
• One-to-one interviews with executives and key technical personnel ingovernment agencies which provided most of the information and digitaldata for the indicators and with other local experts on the related topics.
• Revision of the rationale, methodology and the results of each indicator by anexternal evaluator (Estudios Técnicos, Inc.).
• Presentation of the methodologies and the results of each indicator to theExternal Advisory Committee composed of key stakeholders for their feedbackand final validation.
• For the indicators that use the GIS tool, the analyses were performed severaltimes with two GIS Analysts to corroborate the results. This, in turn, helpedreevaluate and refine the methodologies of these indicators.
SCIENTIFIC SOUNDNESS & QUALITY CONTROL
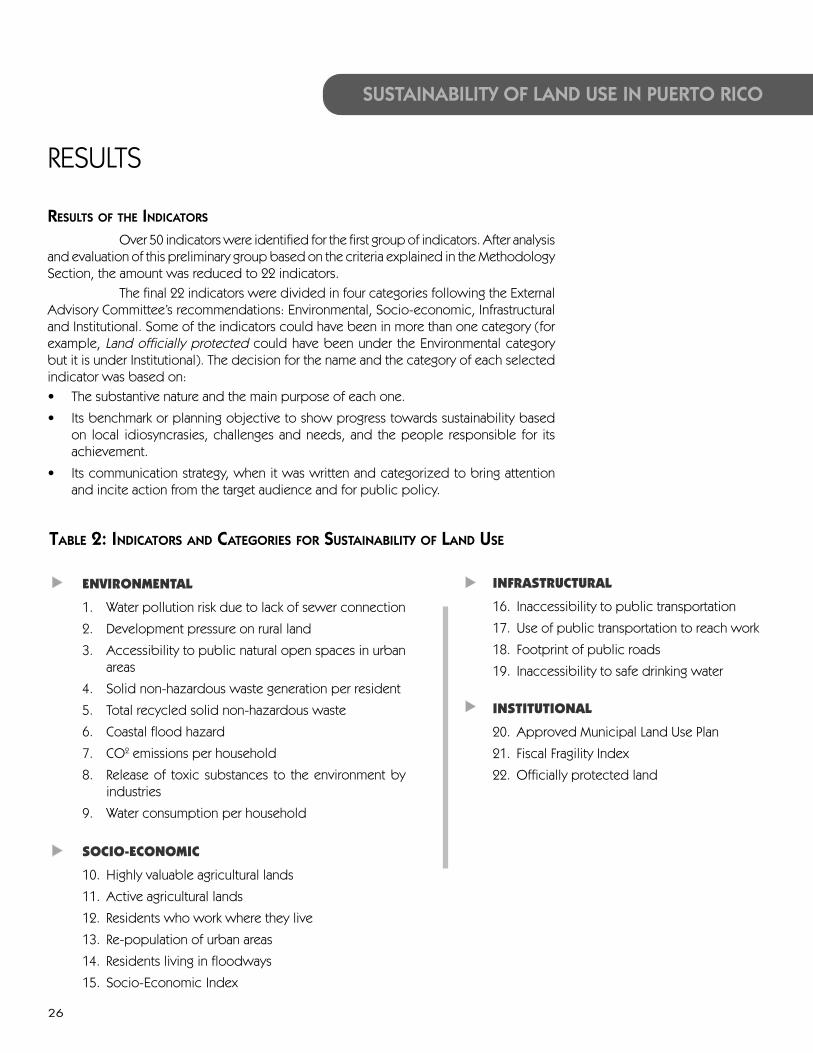
26
SUSTAINABILITY OF LAND USE IN PUERTO RICO
RESULTS
RESULTS OF THE INDICATORS
Over 50 indicators were identified for the first group of indicators. After analysisand evaluation of this preliminary group based on the criteria explained in the MethodologySection, the amount was reduced to 22 indicators.
The final 22 indicators were divided in four categories following the ExternalAdvisory Committee’s recommendations: Environmental, Socio-economic, Infrastructuraland Institutional. Some of the indicators could have been in more than one category (forexample, Land officially protected could have been under the Environmental categorybut it is under Institutional). The decision for the name and the category of each selectedindicator was based on:• The substantive nature and the main purpose of each one.
• Its benchmark or planning objective to show progress towards sustainability basedon local idiosyncrasies, challenges and needs, and the people responsible for itsachievement.
• Its communication strategy, when it was written and categorized to bring attentionand incite action from the target audience and for public policy.
ENVIRONMENTAL
1. Water pollution risk due to lack of sewer connection
2. Development pressure on rural land
3. Accessibility to public natural open spaces in urbanareas
4. Solid non-hazardous waste generation per resident
5. Total recycled solid non-hazardous waste
6. Coastal flood hazard
7. CO2 emissions per household
8. Release of toxic substances to the environment byindustries
9. Water consumption per household
SOCIO-ECONOMIC
10. Highly valuable agricultural lands
11. Active agricultural lands
12. Residents who work where they live
13. Re-population of urban areas
14. Residents living in floodways
15. Socio-Economic Index
INFRASTRUCTURAL
16. Inaccessibility to public transportation
17. Use of public transportation to reach work
18. Footprint of public roads
19. Inaccessibility to safe drinking water
INSTITUTIONAL
20. Approved Municipal Land Use Plan
21. Fiscal Fragility Index
22. Officially protected land
TABLE 2: INDICATORS AND CATEGORIES FOR SUSTAINABILITY OF LAND USE

27
RESULTS
After the final list of indicators was selected and categorized, the followingsteps were followed, as explained in the Methodology Section, to calculate the ISLA(index). This was done with the continuous counsel of the External Advisory Committee:
1. Development of each selected indicator with their results (Current Situation).
2. Selection of a benchmark or planning objective for each indicator (OptimalSituation).
3. Classification of the indicators into stressors and relievers.
4. Assignment of sustainability weights under each category.
Table 3 in the next pages (pages 28 and 29) illustrates the results of the abovefour steps. For details by indicator see Appendix D (Rationale and Methodology of EachIndicator).

28
SUSTAINABILITY OF LAND USE IN PUERTO RICO
TABLE 3: RESULTS BY INDICATOR PER CASE STUDY
ENVIRONMENTAL
1 Water pollution risk due to lack of sewer connection Measurement: Houses without a sewer connection to PRASA asa percentage of the total number of housing units.
2 Development pressure on rural land Measurement: Housing density on the Common Rural Land (houses per km2).
3 Accessibility to public natural open spaces in urban areas Measurement: Residents living in the urban area within a15-minute walk (500 meters) from parks and other public natural open spaces as a percentage of the total urban population.
4 Solid non-hazardous waste generation per resident Measurement: Solid non-hazardous waste generation in poundsper resident per day from total municipal waste generation.
5 Total recycled solid non-hazardous waste Measurement: Total recycled solid non-hazardous waste as a percentage oftotal annual municipal waste.
6 Coastal flood hazard Measurement: Total housing units in coastal flood hazard areas (Zone VE) to be potentially affectedby storm surges.
7 CO2 emissions per household Measurement: Annual release in pounds of CO2 per kWh of electric energy consumptionper household.
8 Release of toxic substances to the environment by industries Measurement: Annual on-site disposal of toxic substancesin pounds, per km2, by industries regulated by EPCRA.
9 Water consumption per household Measurement: Water consumption in gallons per household (PRASA’s residentialclients) per day.
SOCIO-ECONOMIC
10 Highly valuable agricultural lands Measurement: Highly valuable agricultural lands as a percentage of total Rural Land.
11 Active agricultural lands Measurement: Active agricultural lands as a percentage of total Rural Land.
12 Residents who work where they live Measurement: Total number of residents who work in the municipality as apercentage of the total number of workers-residents.
13 Re-population of urban areas Measurement: Population density in urban areas or Urban Land (persons per km2).
14 Residents living in floodways Measurement: Total number of residents living in floodways (AE floodways).
15 The Socio-Economic Index Measurement: Index of municipal socio-economic activity.
INFRASTRUCTURAL
16 Inaccessibility to public transportation Measurement: Wards that are not served by at least one public transportationroute that connects to the urban center as a percentage of total wards.
17 Use of public transportation to reach work Measurement: Change in percentage points in the use of public transportationto reach work by workers-residents 16 years and over.
18 Footprint of public roads Measurement: Kilometers of public roads per square kilometers of municipal land.
19 Inaccessibility to safe drinking water Measurement: Total number of residents served by PRASA and the Non-PRASApublic water systems that are “significant non-compliers” (SNC).
INSTITUTIONAL
20 Approved Municipal Land Use Plan Measurement: Municipal Land Use Plan approved by the PRPB.
21 The Fiscal Fragility Index Measurement: Index to measure the municipal fiscal situation.
22 Officially protected land Measurement: Land officially and actively protected through management or ownership by federal,state and municipal governments, and NGOs, classified as Specially Protected Rural Land, as a percentage of total municipal land.

29
RESULTS
34.0% 30.0% 46.0% 25.0% 5.5% reduction S 0.5
50 132 299 131 No increase S 1.3
89.0% 73.0% 72.0% 89.0% All the urban residents R 1.5
7.51 6.66 10.63 4.85 3.6 pounds max / pers / day S 0.6
2.3% 3.2% 0.8% 6.8% 35% R 3.9
53 N/A 54 968 No housing units (0) S 0.5
8,327 11,416 8,326 10,522 16% reduction S 0.4
258 5 5,514 720 No increase S 0.7
142 164 182 143 27% decrease S 0.6 / 10
5.8% 19.9% 61.0% 32.6% No change R 1.6
41.7% 21.0% 28.0% 30.3% No change R 1.0
86.4% 56.1% 56.2% 41.8% 60% R 1.9
1,396 2,513 646 3,529 11% increase R 2.2
3,236 3,839 669 1,410 No residents (0) S 0.9
95.80 109.15 82.78 132.55 100 R 2.4 / 10
55.0% 9.0% 0% 23.0% 100% - all wards S 5.8
-4.9% -7.0% -7.4% -3.8% 6% points increase R 1.1
4.36 5.18 4.6 6.11 No increase S 1.5
2,865 649 0 0 No residents or 0 SNC water systems S 1.6 / 10
1 1 1 1 1 Approved R 3.8
13.53 -9.51 0.22 0.06 0 S 4.4
33.1% 4.5% 52.6% 22.5% No reduction R 1.8 / 10
PONCE CAGUAS BARCELONETA CAROLINA BENCHMARK / STRESSOR / ASSIGNEDOBJECTIVE IN 8 YEARS WEIGHTRELIEVER
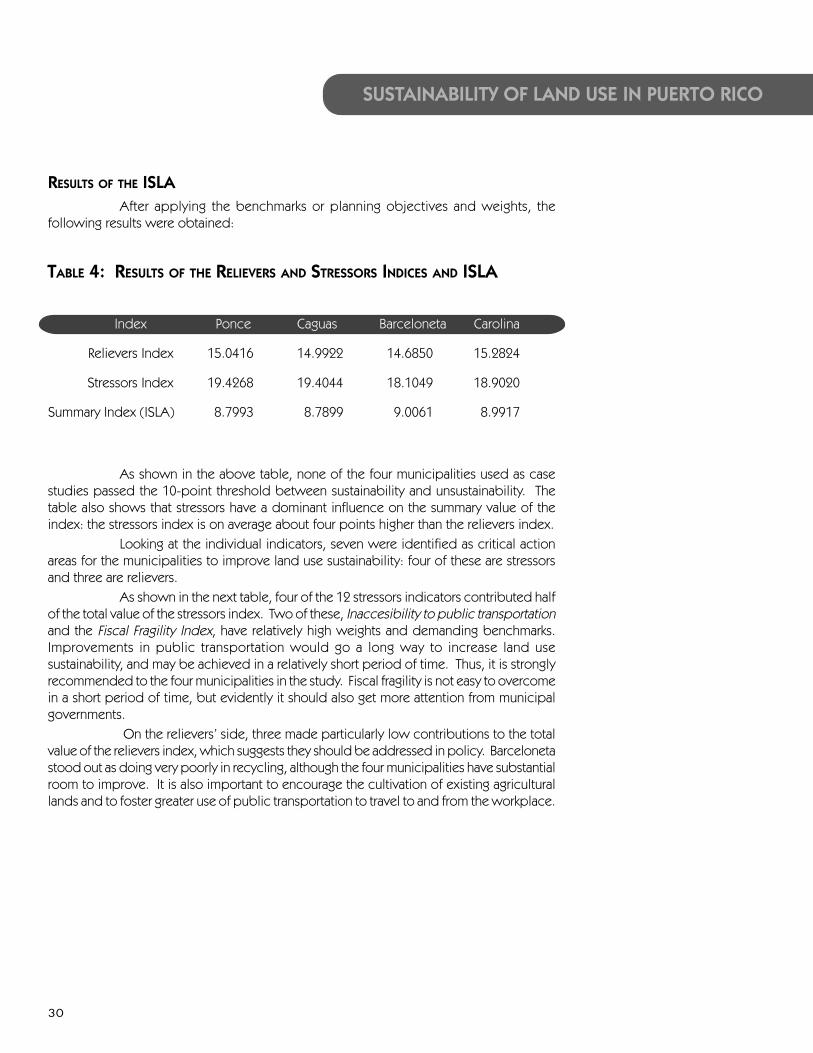
30
SUSTAINABILITY OF LAND USE IN PUERTO RICO
RESULTS OF THE ISLAAfter applying the benchmarks or planning objectives and weights, the
following results were obtained:
As shown in the above table, none of the four municipalities used as casestudies passed the 10-point threshold between sustainability and unsustainability. Thetable also shows that stressors have a dominant influence on the summary value of theindex: the stressors index is on average about four points higher than the relievers index.
Looking at the individual indicators, seven were identified as critical actionareas for the municipalities to improve land use sustainability: four of these are stressorsand three are relievers.
As shown in the next table, four of the 12 stressors indicators contributed halfof the total value of the stressors index. Two of these, Inaccesibility to public transportationand the Fiscal Fragility Index, have relatively high weights and demanding benchmarks.Improvements in public transportation would go a long way to increase land usesustainability, and may be achieved in a relatively short period of time. Thus, it is stronglyrecommended to the four municipalities in the study. Fiscal fragility is not easy to overcomein a short period of time, but evidently it should also get more attention from municipalgovernments.
On the relievers’ side, three made particularly low contributions to the totalvalue of the relievers index, which suggests they should be addressed in policy. Barcelonetastood out as doing very poorly in recycling, although the four municipalities have substantialroom to improve. It is also important to encourage the cultivation of existing agriculturallands and to foster greater use of public transportation to travel to and from the workplace.
oli-
Index Ponce Caguas Barceloneta Carolina
Relievers Index 15.0416 14.9922 14.6850 15.2824
Stressors Index 19.4268 19.4044 18.1049 18.9020
Summary Index (ISLA) 8.7993 8.7899 9.0061 8.9917
TABLE 4: RESULTS OF THE RELIEVERS AND STRESSORS INDICES AND ISLA

31
RESULTS
TABLE 5: KEY INDICATORS TO IMPROVE SUSTAINABILITY
# Description Benchmark Weight Contribution %
STRESSORS
16 Inaccessibility to public transportation 0 5.8 20.75
inaccessibility
(100% of all wards)
21 The Fiscal Fragility Index 0 4.4 14.32
18 Footprint of public roads No increase 1.5 7.62
19 Inaccessibility to safe drinking water 0 residents 1.6 7.58
RELIEVERS
5 Total recycled solid non-hazardous waste 35% minimum 3.9 7.93
11 Active agricultural lands No negative change 1.0 8.28
17 Use of public transportation to reach work 6% points increase 1.1 8.34

32
SUSTAINABILITY OF LAND USE IN PUERTO RICO
FINAL REMARKSAccording to the results of the CUTOP Model, Ponce, Caguas, Barceloneta
and Carolina are not sustainable. Although these municipalities have taken specific measuresto become more sustainable, the Model indicates that they are making slow progress. Thefour case studies reflect the situation in Puerto Rico, and if trends are not reversed, itappears that the Island will continue on an unsustainable path. So the results of most ofthe indicators (Current Situation) and the ISLA confirm that Puerto Rico and its municipalitiesare not sustainable. The Model proposed allows the municipalities to establish policiesand actions that will move them towards becoming more sustainable.
Some of the most important challenges for sustainability in Puerto Rico havealready been mentioned in the introduction of this Report and in the rationale of eachindicator in Appendix D. To summarize, some of the most fundamentals challenges are:
1. INEFFICIENCY IN LAND USE
Forty percent (40%) of Puerto Rico is experiencing a high degree of urban sprawlencroaching rural and valuable agricultural lands according to a recent study. Most ofthe urban centers in the municipalities appear surrounded by sprawling development.In addition, the increase in constructed area does not correspond with the increase inpopulation. For example, while constructed area increased by 1,286% between 1936and 2000 in the SJMA, population increased 303%, showing a high degree ofinefficiency in land use. Land use is at the heart of achieving sustainability, and this iscritical for Puerto Rico due to its size, overpopulation and the political reality of beingdivided into 78 municipalities with individual influence over land use decisions byvirtue of the Autonomous Municipalities Act of 1991.
2. MUNICIPAL FISCAL FRAGILITY
In spite of the fact that the Autonomous Municipalities Act of 1991 allowsdecentralization for land use decisions and regulations (subject to a series of proceduraland substantive conditions), according to statements made by the executive directorsof the two groups that represent the mayors of the 78 municipalities (the Associationof Mayors and the Federation of Mayors), 49 of the 78 municipalities (63%) do notgenerate enough income to pay 50% of their regular expenses. And of those 49municipalities, 18 (23%) depend a total of 75% on the Central Government to covertheir expenses and 5 (6%) depend a total of 90% (Santana-Ortíz, 2007ab). This meansthat half of the municipalities do not have or have very few economic and fiscalresources to invest in programs, projects and activities that might be needed to movetowards sustainability.
3. ABSENCE OF AN EFFICIENT, RELIABLE AND INTEGRATED PUBLIC TRANSPORTATIONSYSTEM AND A HIGH PROPORTION OF KILOMETERS OF ROAD BY KM2 OF TERRITORY
Puerto Rico ranks third in the world in density of vehicles per inhabitant (in 2005 it had2.8 million vehicles, almost one car per inhabitant). This gives an idea of the amount ofCO
2 the island is emitting to the atmosphere if an average passenger car emits about
one pound of CO2
for every mile traveled. Approximately 89% of the workers useprivate vehicles to reach their work place and about half of these works in municipalities
33
different from the one where they live. Daily commuting is most common amongmunicipalities. The increase in the number of automobiles registered can be correlatedwith the increase of kilometers of roads. The island has one of the highest proportionsof kilometers of road by km2 of territory when compared to other countries (1.50kilometers of road per km2 of territory).
4. SOLID WASTE GENERATION AND MANAGEMENT
Puerto Rico generates more solid waste per person per day (5.56 lbs.) as comparedto countries in Latin America (1.7 lbs.), Europe (2.2 lbs.) and the United States (4.5lbs.), according to published data. Generation of solid waste continues to increase.Between 2003 and 2007, solid waste generation increased by 16% even thoughpopulation rate decreased. In addition, recycling rate is low compared to othercountries and compared to our own recycling goal of a 35% recycling rate, accordingto Act 70 of 1992 as amended in 1996 and 2000. In 2008, this goal had not yet beenreached. Our traditional recycling rate island-wide at the present moment isapproximately 15% (the amount of recyclable materials per person per day is around.49 pounds and this contrasts with our disposal rate of 5.56 lbs.). This situation worsenwhen considering that there are 32 landfills on the island with a useful life of only 12years and of these, five will start to close in the next five years due to non-compliancewith environmental laws.
5. FOOD SECURITY / AGRICULTURAL ACTIVITY
Approximately 85% to 90% of all the food consumed in Puerto Rico is imported. Atthe present moment only .75% of the island’s GNP and .49% of the GDP comes fromagriculture, as a result of the devaluation and abandonment of agriculture in favor ofindustrialization in the 1940’s and 50’s. In addition, the past 30 years have representeda loss of approximately 30% of agricultural lands to other non-agricultural uses.
6. ACCESSIBILITY TO SAFE DRINKING WATER
Even though the great majority of Puerto Ricans have access to safe drinking water; in2008, 49% of all the reported PRASA and Non-PRASA public water systems were insome sort of violation. Of these, 9% of PRASA systems and 55% of Non-PRASA systemswere persistent violators.
7. POLLUTION OF WATER BODIES
Approximately 30.3% of all monitored river and stream miles are impaired and do notsupport their designated uses. All the lakes are considered to be impaired for aquaticlife. Sixty six percent (66%) of the monitored estuarine acres and 53.3% of streammiles that form part of the estuaries are also impaired. In addition, 45% of the populationin Puerto Rico, almost two million people, lacks sanitary sewer service. Most use septictanks which do not work adequately due to lack of proper monitoring and maintenance.This might be one of the principal sources of water pollution.
FINAL REMARKS

34
SUSTAINABILITY OF LAND USE IN PUERTO RICO
8. WATER AVAILABILITY FOR CONSUMPTION
Published data have shown that Puerto Rico is included in the 30% of the countries thathave less water available per capita. According to PRASA, consumption of water is stillgrowing and the island currently does not have sufficient space to construct more damns.
9. LAND CONSERVATION FOR FUTURE GENERATIONS AND FOR BIODIVERSITY
Only 7.6% of the land is officially protected by some form of management forbiodiversity according to the recent Puerto Rico Gap Analysis Project. The Governmentof Puerto Rico has established a goal to increase the amount of protected lands by100,000 acres in the next 5 years. If the goal is met, the land officially protected willrepresent around 12% of the territory. The Gap Analysis Project recommends a minimumof 15% for the protection of biodiversity. The Nature Conservancy recommends 30%.
10. CO2 EMISSIONS AND CONTRIBUTION TO GLOBAL WARMING
Ninety nine percent (99.5%) of the energy produced in Puerto Rico comes from burningfossil fuels. Puerto Rico has the highest consumption of electric power by squarekilometer and it is the third in the world in consumption of megawatts per inhabitant.The Director of the Caribbean Division of the EPA calculates that Puerto Rico contributesto global warming 230% more than the average inhabitant worldwide and 333% morethan the average inhabitant of Latin America and the Caribbean.
11. COASTAL FLOOD HAZARD
Puerto Rico is not taking measures to counteract erosion in coastal areas nor to protectlife and properties due to the expected increases in the frequency and intensity ofstorm surges and the average sea level as a result of climate change. Construction inthe coastal maritime zone boundaries continues even though there are laws that limitconstruction in this zone and, as a result, the population living in coastal areas exposedto storm surges keeps increasing (studies show that in the last decade the populationincreased by 12.1%).

35
When using the CUTOP Model stakeholders should also take into account thefollowing points for its implementation:
SHARED JURISDICTION BEYOND THE INDIVIDUAL MUNICIPAL BOUNDARY
As mentioned before, a challenge encountered in this Report was the use ofthe municipality as a unit of analysis. Considering that the average size of the 78municipalities is only 113.7 km2, a considerable amount of the information gathered forthe indicators overlapped in scope and origin since the impacts of most land use relatedactivities are at the regional scale. Natural systems, such as watersheds, do not correspondto political boundaries and this is a challenge that should also be considered whenpreparing or updating municipal land use plans. So to intervene in these systems, theremust be cooperation in shared jurisdictions between adjacent municipalities that couldseek out opportunities to work as a region with the support of several central governmentagencies or public corporations.
SPECIFIC CONSIDERATIONS FOR EACH MUNICIPALITY
Even though the CUTOP Model has been designed to help jurisdictionsevaluate themselves across time and against each other, it is important to point out that theuse of the Model should also consider dissimilar conditions between municipalities whendoing individual historical trends evaluations or when doing comparisons with otherjurisdictions. The use of the Model should incorporate the geographic, environmentaland socio-economic context of each municipality to better define the application of eachof the indicators and their assigned sustainability weight. This is important since some ofthe indicators (either stressors or relievers) can vary somewhat based on the specific localrealities and this should be taken into account. This is something that will always comeacross when selecting indicators and when calculating an index to compare performanceamong countries, regions, cities or communities since, as evidenced in the literature review,there are few, if any, key indicators that could apply the same way across even similarsystems.
IMPLEMENTATION OF LAWS AND REGULATIONS
As mentioned in Appendix A, from a legal standpoint Puerto Rico has enoughlaws and regulations, as well as plans and programs, in place that aknowledge theimportance of sustainable development and land management. The Island does not needmore normatives in this area. Normatives just need to be effectively implemented and,when necessary, ammended or tempered to meet the realities and challenges of the 21st
century.
FINAL REMARKS

36
SUSTAINABILITY OF LAND USE IN PUERTO RICO
GENERAL RECOMMENDATIONS
AN ISLAND-WIDE LAND USE PLAN
This report highlights the pressing need for Puerto Rico to have in place afunctional island-wide-land use plan. The PRPB would use this island-wide land use planas a framework to guide the integral development of the Island and to provide directionand coherence to the municipalities on their local land use plans.
In 2004 the Puerto Rico Legislative Assembly ordered the PRPB, by virtue ofPublic Law 550, to develop the Puerto Rico Land Use Plan. In February of 2006, the PRPBdeveloped a draft version of the Plan with information presented in public hearings duringthat same year. However, at the present time there is no island-wide land use plan ortimetable to finish it.
The sustainable development of the scarcest resource in Puerto Rico (land)depends heavily on the making of this Plan. With the inclusion of clear smart land usepolicies and a common agreed vision into the plan, Puerto Rico could be on the path to asustainable future.
Responsible entities: PR Legislative Assembly and PRPB
MUNICIPALIZATION AND REGIONALIZATION
Because of the serious limitations imposed by the excessive centralization offunctions in the central government, which has led to inefficiency, as well as jurisdictionaland fiscal limitations of the municipalities, it is recommended the decentralization of thecentral in regional governments. Such regional governments should be composed of severalmunicipalities that would represent equally the total population of the Island, and withthe economic capacity to carry out activities that are now executed by the State. Thisregionalization, by virtue of public policy, should emphasize cooperation and sharedresponsibilities for those social, economic and environmental activities that are moreregional in scope and impact.
By grouping municipalities in regions and facilitating them with keyadministrative decision-making powers, this would allow them to respond faster and moreeffectively to the challenges of sustainability. As the international known phrase goes “ThinkGlobally, Act Locally”.
Already the United Nations Institute for Training and Research (UNITAR) hasrecognized the importance of local and regional players in the achievement of sustainabilitythrough its Decentralization Cooperation Programme (DCP)15 which provides training tolocal actors (authorities, public and private companies, civil society and academia) toenhance their capacity to implement international agreements and the United Nations’Millennium Development Goals16. The training sessions focus on four major areas:environment and sustainable development, urban services, economic development andlocal governance, and human security. The seminars are implemented through a networkof regional associated training centers known as CIFAL (“Centre International de Formationdes Autorités/Acteurs Locaux” or International Training Centre for Local Authorities/Actors).
37
GENERAL RECOMMENDATIONS
Regionalization policies all over the world have been used as a smartdevelopment strategy. For example, since the 1980’s, the European Union promotes anintegral strategy of the territories of its Members-States based on (Council of Europe, 1983):
• A balanced socio-economic development of the regions,
• the improvement of the quality of daily life,
• the responsible management of the natural resources and the protection ofthe environment,
• and the rational use of the land.
Responsible entities: PR Legislative Assembly and the municipal governments.
INCORPORATE THE USE OF THE INDICTORS AND THE ISLA (INDEX) IN THE DECISION-MAKING PROCESS
Municipalities can incorporate the indicators, with their benchmarks orrecommended planning objectives, and the ISLA in their core processes of decision-makingthrough a municipal ordinance. Appendix E provides an example of such an ordinance.
Responsible entities: The Mayor and the Municipal Assembly
ADOPTION OF SMART GROWTH PRINCIPLES
According to the Smart Growth Network17 “what, where and how we buildhave major impacts on our personal lives, our communities and our nation. And incommunities where development has improved daily life, the economy, and theenvironment, Smart Growth principles have been a key to that success.” The term “smartgrowth” refers to the concept that integrates the best planning and urban developmentpractices which consider the well being of communities and the environment. The concepthas international acceptance and recognition because of its universal character and thecommon sense of its principles which are framed within the sustainable developmentcontext of justice for generations to come.
15 For more information about UNITAR and DCP see http://dcp.unitar.org.16 The Millennium Development Goals (MDGs) are eight goals to be achieved by 2015 that respond to the main
development challenges for the 21st century. They are drawn from the actions and targets contained in theMillennium Declaration which was adopted by 189 nations during the UN Millenium Summit in September 2000.The eight MDGs break down into 21 specific and quantifiable targets that are measured by 60 indicators.The eight goals are:
(1) Eradicate extreme poverty and hunger(2) Achieve universal primary education(3) Promote gender equality and empower women(4) Reduce child mortality(5) Improve maternal health(6) Combat HIV/AIDS, malaria and other diseases(7) Ensure environmental sustainability(8) Develop a Global Partnership for Development
17 As quoted in the Smart Growth Network web page: http://www.smartgrowth.org

38
SUSTAINABILITY OF LAND USE IN PUERTO RICO
Smart Growth is fundamentally based on the following 10 principles:1. Mix land uses. (Zoning for multiple uses.)
2. Compact building design. (Densification and more efficient use of the land.Well planned mixed land uses and compact building design create safe andhealthy communities for all ages where homes, offices, schools and shopsare at walkable distances and the surrounding infrastructure promotes publichealth and welfare.)
3. Increase of the range of housing opportunities and choices. (Convenientneighborhoods with affordable homes for everyone, including residents withlower incomes and retirees.)
4. Walkable cities and neighborhoods. (Wide sidewalks, with adequate treesproperly maintained to provide a pleasant urban landscape and coolerenvironment so as to promote walking to different destinations within the city.)
5. Distinctive, attractive communities with a strong sense of place. (Placesdesigned for people, at a human scale dimension, which foster socialinteraction and a sense of community and belonging.)
6. Preservation of open space, farmland, natural beauty and critical environmentalareas. (Active protection and preservation of our natural heritage andagricultural lands.)
7. Development towards existing communities. (Wise investment of taxpayers’money, where time, attention, and resources are invested in maintaining andrestoring community living with the revitalization of urban centers and thedevelopment of compact, mixed use neighborhoods, all of which reducethe costs of providing government related services and infrastructure [healthcare, public safety, education, new roads and sewage, etc.].)
8. Variety of transportation choices. (Freedom for people to choose their modeof transport, either walking, biking, by public transportation or automobile.)
9. Predictable, fair and cost effective development decisions. (Developmentdecisions that are transparent and fair to everyone which balance the needsof residents and developers.)
10. Community and stakeholders collaboration in all the processes. (Differentsectors working together for the common good.)
All the ten principles are viable in the municipalities through the adoption ofclear Smart Growth public policies and through the implementation of plans, incentives,and regulations. They could positively impact – directly or indirectly- most of the indicators.But specifically they would directly impact the following: Development pressure in ruralland, Residents who work were they live, Re-population or urban areas, Inaccessibility topublic transportation, Use of public transportation to reach work, Footprint of public roadsand Officially protected land.

39
GENERAL RECOMMENDATIONS
An adaptation of the Smart Growth principles and strategies to Puerto Rico byUMET’s Center for Sustainable Development Studies is now available to the public throughthe publication “Hacia el desarrollo inteligente: 10 principios y 100 estrategias para PuertoRico”, a Puerto Rican version of the educational publication Getting to Smart Growth: 100Policies for Implementation of the Smart Growth Network and the International City/CountyManagement Association. It can be downloaded from www.proyectosambientales.info.The adaptation provides local examples of Smart Growth in our municipalities and relatesstrategies to local norms.
Responsible entities: PR Legislative Assembly, PRPB, PREQB, PRDNER and themunicipal governments.
ENDORSING THE “EARTH CHARTER”Municipalities can go a further step in their support for sustainable
development by endorsing the document of the Earth Charter. At stated in their webpage, the Earth Charter is a widely recognized, global consensus statement on ethics andvalues for a sustainable future, developed over a period of ten years through an extensiveglobal consultation process. This initiative, also known as the “Earth Charter Initiative” is abroad-based, voluntary, civil society effort that includes renowned internationalorganizations (UNESCO and the World Conservation Union), national and city governments,non-government organizations and community-based groups, among others. It has alreadybeen endorsed by over 2,500 different organizations.18 The Municipality of Caguas, one ofour case studies, signed the Earth Charter on March 30, 2007 as part of the inauguration ofthe Caguas Botanical and Cultural Garden.
The mission of the Earth Chapter is to promote the transition to sustainableways of living and a global society founded on a shared ethical framework that includesrespect and care for the community of life, ecological integrity, universal human rights,respect for diversity, economic justice, democracy, and a culture of peace.
The endorsement of the Earth Charter means that the entity, in this case a citygovernment or a municipality, has accepted the following mission to demonstrate therelevance of the Earth Charter’s values and principles to global governance:
“We, the undersigned, endorse the Earth Charter. We embrace the spirit andaims of the document. We pledge to join the global partnership for a just, sustainable, andpeaceful world and to work for the realization of the values and principles of the EarthCharter.”19
Responsible entities: The Mayor and the Municipal Assembly.
18 For more information see web page http: //www.earthcharterinaction.org/content/.
19 For more information about the Earth Charter’s endorsement document go to
http://www.earthcharterinaction.org/content/pages/Read-the-Charter.html.
�

40
SUSTAINABILITY OF LAND USE IN PUERTO RICO
FUTURE RESEARCH OPPORTUNITIES
1. This work provides the opportunity to expand the CUTOP Model to all theother municipalities. As a next step, the University can develop a “state ofland use for sustainability report” for Puerto Rico in which municipalities couldbe ranked every four to eight years according to their land use “eco-efficiency”.Special recognition would be given to those with the greatest progress madein the implementation of the sustainability indicators. Possible partners in theselection of these municipalities could include the USEPA-Caribbean Division,the Association and Federation of Mayors, and local professional organizationssuch as the Puerto Rico College of Architects and Landscape Architects andthe Puerto Rico Planning Society.
2. Many indicators encountered some limitations in their development due tothe challenge of the reliability, measurability and availability of local data.Future work can be oriented towards addressing these limitations. This couldinclude the development of specific data collection parameters and protocolsfor better quality control.
3. In the first and original list of indicators, there were several good indicatorsthat were discarded because there were no reliable and measurable data.Future work can include the development of the data needed for some ofthese indicators.
4. Studies have shown that there is a correlation between public health andland use. Diseases like obesity and asthma, among others, are also related tourban sprawl and how we develop our urban areas. Future work can includehealth related indicators.
5. Another potential area of research is the development of a regional modelbased on the CUTOP Model for municipalities. As previously mentioned inthis Report, the municipality as a territorial unit poses difficulties in datacollection and analysis because many land use activities are regional in scopeand impact. Another alternative is the development of an island-wide modelbased on this Model which can include regional considerations.
6. The proposed Model and its results can be presented as an education tool inappropriate forums in the Caribbean and in the United Sates to explore itstransferability and adaptability to similar scenarios. This could lead to futurecollaborative research opportunities.

41
RECOMMENDATIONS BY ENVIRONMENTAL INDICATOR
RECOMMENDATIONS BY INDICATOR
ENVIRONMENTAL INDICATORS
1. WATER POLLUTION RISK DUE TO LACK OF SEWER CONNECTION
To help achieve the planning objective of reducing by 5.5% the number of housingunits without sewer connection:
•· An adequate and a consistent monitoring program of septic tanks should beestablished by the PRDOH in collaboration with ARPE (for strict compliancewith the design and construction norms of septic tanks for single family housingunits), USEPA (due to the requirements of the Clean Water Act) and themunicipalities. This includes the assignment of additional funds to the AuxiliarySecretariat for Environmental Health of the PRDOH to hire regional inspectorsthat can specialize in this area (at present, regional inspectors are overwhelmedwith other inspections, including restaurants, animal farms, etc.). Municipalitiescan help develop and keep an inventory and maintanance schedule of singlefamily units’ septic tanks within their jurisdiction for the best monitoring.
• PRASA’s annual Capital Improvements Program should integrate, as a priorityand as a strategic objective, a significant reduction in the number of housingunits that have septic tanks.
• PRDOH’s educational efforts for health and water quality protection shouldalso include information of the proper design, construction and maintenanceof septic tanks to their owners with the collaboration of ARPE and USEPA.Educational materials could be available, free of charge, at the municipalities’planning, permits and endorsements and/o environmental offices.
• As soon as the USEPA’s Stormwater NPDES Program is well established inPuerto Rico and this federal agency starts granting the Stormwater NPDESPermit, this permit should also be included as a water quality indicator forhighly urbanized jurisdictions as explained in the indicator’s methodologicalsheet.
Responsible entities: PRDOH, PRASA, ARPE, the municipal governments andUSEPA.

42
SUSTAINABILITY OF LAND USE IN PUERTO RICO
2. DEVELOPMENT PRESSURE ON RURAL LAND
To help achieve the planning objective of not increasing housing units density in themunicipality’s Common Rural Land:
• Municipalities’ planning and/or land use offices should prepare an assessmentof the problem of individual segregations of private parcels of lands in ruralareas for additional housing units (known locally as “lotificaciones simples” orsimple segregations) to monitor its impact on land use changes on an annualbasis and reduce it as much as possible with different Smart Growth strategiesand incentives (see recommendations for the Re-population of urban areasindicator). An example of a strategy is the Transferable Development Rights(TDR), as provided by the Autonomous Municipalities Act (Public Law 81 of1991) in its Article13.024. TDR can be used for protected rural land bytransferring development rights to urban areas20. Even though the Act allowsfor the use of this tool by the municipalities for land use planning, as of thisproject it has not been properly implemented by any municipality. Theapproval of land use plans by the PRPB and/or the delegation of powers tothe municipalities, as allowed by Public Law 81 of 1991, should be contingenton municipalities making it a priority.
Responsible entities: PRPB and municipal governments.
3. ACCESSIBILITY TO PUBLIC NATURAL OPEN SPACES IN URBAN AREAS
To help achieve the benchmark that all urban population in the municipality shouldlive within a 500 meters (approximately 15-minute walking distance) from a park orother public natural open space:
• As explained in the Limitations section of this indicator, municipalities needto define better the land use zoning category of parks and public naturalopen spaces for a more accurate analysis of the indicator and comparisonwith other municipalities.
• With the help of the central government, the municipalities can adopt aprogram of acquisition or de-appropriation of parcels of lands that have thepotential of being converted into parks or other natural open spaces withinurban areas to improve social, environmental and economic conditions (.i.e.,increase of property values) within these developed areas.
• Prepare an inventory of the land in and around urban areas that are easementsof PRASA, PREPA, PRDTPW (to protect public infrastructure) or PRDNER (aroundwaters bodies to protect the resource) in order to determine the possibilityof conditioning theses easements as natural open public spaces for passiverecreation.
• Implement the recommendations provided in the State ComprehensiveOutdoor Recreational Plan (SCORP) for 2008-2013. One of theserecommendations is the need to provide pedestrian accessibility by creatinga system of trails through linear parks that could connect different municipalor national parks, urban forests, botanical gardens and other outdoor passiverecreational spaces as natural hubs in urban areas.
Responsible entities: PRPB, PRDNER, PR National Parks Company, the PRDepartment of Recreation and Sports and the municipalgovernments.

43
4. SOLID NON-HAZARDOUS WASTE GENERATION PER RESIDENT
To help achieve the benchmark of reducing the amount of solid waste generated byresidents to a maximum of 3.6 lbs.:
• The Reduction and Recycling Act (Public Law 70 of 1992, as amended intoPublic Law 411 in 2000) and the Regulation for the Reduction, Reuse andRecycling of Solid Waste (Regulation 6825) that provide norms, incentivesand mechanism for the municipalities21 and for the private sector in order toreduce waste disposal and reach the 35% recycling rate goal for the Island,both need to be consistently and appropriately implemented. So far, this hasnot been the case.22 More funds should be provided to implement thereduction and recycling norms and, if necessary, amend the Act and theRegulation to be more stringent in their implementation.
• Establish a “pay-as-you-throw program” (PAYT) after recycling in eachmunicipality as part of a municipal tax. In a PAYT program, residents are chargebased on the amount of weighed waste the municipality collects from theirhomes after recycling. This provides a direct economic incentive to generateless waste and to recycle more. Collecting waste is then considered like anyother consumption related public service or utility (electricity and water).According to the USEPA, in the United Sates communities with PAYT programsin place have reported significant increases in recycling and reductions inwaste.23
• The PRSWMA shall update the actual data for solid waste generation since theonly data available is from 2003 (Wehran-Puerto Rico Study). The update ofthis study should include a characterization analysis of the solid wastegenerated by the local population and by municipality or region (adjacentgroup of municipalities) to better plan.
• Any action plan should include the design and implementation of an effectiveeducational campaign to create awareness about the reasons and the needto reduce solid waste generation (this should go hand-in-hand with educatingabout our consumption patterns that cause the excessive generation of waste).The municipalities can help in this educational campaign by distributingeducational material among its residents and offering educational presentationsin its different neighborhoods and/or wards.
• All the landfills should have a weighing systems in place to keep accuratedata of the historical trends of solid waste disposition. As explained in theLimitation section of this indicator, the lack of these weighing systems compelsPRSWMA to work exclusively with projections.
Responsible entities: PRSWMA, PR Legislative Assembly and the municipalgovernments.
RECOMMENDATIONS BY ENVIRONMENTAL INDICATOR
20 There are several web pages that provideinformation about TDR: http://www.state.nj.us/dca/osg/resources/tdr/index.shtml (Sate of NewJersey), http://ohioline.osu.edu/cd-fact/1264.html(Ohio State University), http://www.kingcounty.gov/environment/stewardship/sustainable-building/transfer-development-rights.aspx (King County inWashington), among many others.
21 This includes the obligation of hiring a MunicipalRecycling Coordinator and assigning funds to theMunicipal Recycling Office.
22 See http://www.ads.gobierno.pr/secciones/reciclaje/ley4112000.htm for a copy of theamendments to Public Law 70 (Public Law 411).
23 See USEPA web site about the benefits a PAYTprogram can provide at http://www.epa.gov/epawaste/conserve/tools/payt/index.htm.

44
SUSTAINABILITY OF LAND USE IN PUERTO RICO
5. TOTAL RECYCLED SOLID NON-HAZARDOUS WASTE
To help achieve the benchmark of increasing the recycling rate to a minimum of 35%,the recommendations for the previous indicator Solid non-hazardous waste generationper resident also apply to this indicator. In addition:
• Municipalities should comply regularly and on time with their trimester reportsdeadlines and with the certifications of the recycling and drop off centers forthe validation of the delivered materials. The PRSWMA should implement sometype of penalty to the municipalities that do not comply with these normsconsistently and timely. The PRSWMA should also establish a regular monitoringor inspection program to guarantee consistency of recycling data collectionamong municipalities.
• Recycling is still not seen in Puerto Rico as a business venture. It is mostly seenas a voluntary good will activity. The same assistance and incentives providedto other companies for starting and conducting business in Puerto Rico, shouldalso apply to commercial recycling initiatives. In addition, special supportshould be provided to existing recycling cooperatives in Puerto Rico.
• All new development, including housing, commercial and industrial projects,should include a well designed recycling and composting space as a requisiteto obtain construction permits. At the present moment, Puerto Rico has theAct to Create Areas in Housing Complexes for the Recuperation of RecyclableMaterial (PRSWMA Public Law 61 of 2002) that makes mandatory theconstruction of this space in residential projects. Section 20 of the Segregationand Urbanization Regulation (PRPB Regulation 3) provides specific guidelineson how to design and build this space. So far, the Law has not beenconsistently and effectively implemented (ARPE oversees its implementationadvised by PRSWMA).24 In addition, the Act and the Regulation (Section 20)could be amended to extend this requirement to commercial and industrialprojects. The Leadership in Energy and Environmental Design (LEED) of theGreen Building Council also provides guidelines for the design andconstruction of this space.
Responsible entities: PRSWMA, ARPE and the municipal governments.
6. COASTAL FLOOD HAZARD
To help achieve the proposed planning objective that no one should be living incoastal flood hazard areas (specifically, Zone VE as identified by the FEMA’s FIRM):
• The costal maritime zone delimitation and definition should be tempered tothe realities of the 21st century. At the present moment, the definition of thiszone is base on old laws when Puerto Rico was a territory of Spain (WatersAct of 1866 and Ports Act of 1886). This old definition is based on the realitiesof the coasts of Spain of almost two centuries ago and does not represent thereality of a Caribbean island in the 21st century. As a result, the definition ofthe delimitation of the coastal maritime zone has been arbitrarily interpretedby the government and the proponents of coastal projects as only that zonethat the waves cover in their constant flow (raise and fall) of tides, and avoidingthe dangerous waves associated with tropical storms or hurricanes. Thisinterpretation also does not consider the actual reality of climate change and,as a result, the rise in the intensity and frequency of climatologically extremes
24 Interview with Adalis Martínez Cruz,Environmental Analyst of the PlanningDepartment of the PRSWMA on 3/16/09.
25 Mercado-Irizarry (2008). Also,interview with the author, AurelioMercado-Irizarry, Director of theCoastal Hazards Center, Sea GrantProgram at the University of PuertoRico, Mayaguez Campus on 3/09/09.

45
events. This is why this project recommends considering Public Law Project3031 of the House of Representatives and Public Law Project 1703 of theSenate presented to the Legislature between 2005 and 2006, to create thenew Puerto Rico Coastal Act. This proposed act presented an objective, clearand updated coastal maritime zone delimitation for the Island which wasdefined as starting in the line of lower tides (or inferior limit) up to the inlandline that dangerously high waves can reach (waves as defined in the VE Zoneby FEMA’s FIRM, which can be up to 3 feet in high and that propagate over thecyclonic tide of a 100 years recurrence hurricane). This zone should be of aminimum of 50 meters starting at the line of higher tides during the year and itreaches until where the influence of the sea can be measured inland, and itextends to the margins of the rivers and their tributaries, and throughout otherbodies of water until they can be navigated or until changes in tides can bemeasurable. This new definition also provides for the covering of the right tofree access to the beaches as public spaces and guarantees public safety.
• Another important point is that FEMA’s maps do not consider the erosionproblem in coastal areas which increases coastal hazard. Because of this, alsorecommended is what is known as the “setback area” which relates the widthof the area to be protected with the annual erosion rate of that particularcoastal place. A good example is the “Shoreline Setback Areas” (SSA) usedin Hawaii to control development along its coasts which are also considered“Special Management Areas”. More information can be found at http://www.honolulu.gov/refs/roh/23.htm and http://www.hawaii-county.com/planning/rules/rule%2311.pdf.
The “Coastal Construction Control Line” (CCCL) is another example that is beingused in the State of Florida which forms part of their Coastal Zone ManagementProgram. The CCCL considers erosion and the combined impact of erosionand cyclonic tides of a 100 years recurrence hurricane. To address this, theState of Florida, in addition of using FEMA maps, also includes the stability ofthe shore (fluctuations in its localization and its erosion pattern throughhistorical studies using maps and aerial photos), the topography and how itrelates to the tide (the inland line of the 3 feet waves) and the floods andcyclonic tides of 100 years recurrence through simulated computer modeling.They also use the “Erosion Line” (EL) which was established in 1985 to prohibitmajor constructions between the actual shore and the projected shore in 30years due to the erosion rate. If the EL is inside the CCCL, then only the CCCLapplies. More information about the CCCL and the EL in the State of Floridacan be obtained at http://www.dep.state.fl.us/beaches/programs/ccclprog.htm.25
• Coastal municipalities, with the help of FEMA and the Central Government,can also do an assessment and prepare an inventory of the actual amount ofhousing units in Zone VE (so as not to depend only on the estimates of thedecennial census) to prepare a plan for the gradual and eventual re-localizationof people living in this Zone. Once this assessment is done, the coastalmunicipalities should also consider prohibiting, through a municipal ordinance,any new major construction or housing development is this Zone.
Responsible entities PR Legislative Assembly, PRPB, FEMA and the municipalgovernments.
RECOMMENDATIONS BY ENVIRONMENTAL INDICATOR

46
SUSTAINABILITY OF LAND USE IN PUERTO RICO
6. CO2 EMISSIONS PER HOUSEHOLD
To help achieve the benchmark of 16% reduction of CO2 from current CO
2 emissions:
• Municipalities’ should adopt the Sierra Club’s Cool Cities (“Ciudades Cool”)goal for Puerto Rico of reducing by 2% per year the total of CO
2 emission in
order to achieve an 80% reduction by 2050. As mentioned in themethodological sheet of this indicator in Appendix D, six municipalities havealready joined the Cools Cities campaign by signing a municipal ordinanceprovided by the local chapter of the Sierra Club. The adoption of this goalshould be accompanied by an implementation plan and an educationalinitiative directed towards the municipal residents. The Club’s local chapterweb page (http://puertorico.sierraclub.org/ciudadescool/index.html) storesthe document “Manual para hacer tu ciudad cool en cuatro pasos” (How toMake Your City Cool in Four Steps26) which has specific recommendations atthe municipal level to achieve the proposed goal of CO
2 reduction and an
example of the municipal ordinance. Both can be downloaded from the Club’sweb page. The U.S. Mayor Climate Protection Center (http://www.usmayors.org/climateprotection/) also provides information, guidanceand assistance for mayors to help them lead their cities’ efforts to reducegreenhouse gas emissions. There is clear evidence that mayoral leadership isfundamental to produce business and community support for policies thatreduce CO
2. The Center facilitates leadership experiences by providing the
necessary knowledge and tools. A manual for best practices for climateprotection can also be downloaded from their web site.
• As the Sierra Club’s Cool Cities campaign proposes, municipalities can achievesubstantial energy efficiency improvements through policies and specificaction plans to provide incentives and promote the use of efficienttechnologies, and integrate them into planning decisions. Specifically, adoptthe LEED of the U.S. Green Building Council as a strict requirement for all newdevelopments, including housing developments, within the municipality. LEEDstandards provide energy efficiency design guidelines for different types ofbuilding and developments. Also, municipalities can establish a plan to retrofitexisting buildings, including residential houses, to achieve energy efficiency.The U.S. Building Council has also LEED retrofit standards for exiting buildings.
• USEPA and the U.S. Department of Energy’s Energy Star program (http://www.energystar.gov/) also provide specific guidelines to achieve energyefficiency. Homes can also be certified as Energy Star homes. Municipalitiescan also consider using EPA’s Energy Star standards as requisite for all newhousing developments and to help existing homes improve their energyefficiency through a retrofit educational program with PREPA’s collaboration.
• Recently, in Puerto Rico there have been several initiatives towards achievingenergy efficiency through executive orders and public laws. The importantthing, right know, is their full implementation. Some examples are:
26 The four steps are:
1. Take the “Cool Cities” Pledge
2. Conduct a Global WarmingEmissions Inventory.
3. Create a Solutions Plan, and
4. Implement and MonitorProgress.
47
Public Law 229 of August 9, 2008 or the Green Building Act which mainpurpose is to promote efficiency in energy and water use in new and existingpublic buildings.
Public Law 114 of August 16, 2007, as amended, to order PRPEA theestablishment of a net metering program for its client who has installedrenewable energy equipment. This Law enables a connection between PREPA’stransmission and distribution system and clients who has installed renewableenergy systems to get credit for the energy they generate.
Public Law 248 of August 10, 2008 to amend the tax laws and provideincentives for the acquisition and installation of photovoltaic panels (includinga 75% credit between the Fiscal Years 2007-2008 and 2008-2009!)
Executive Order 2007-40 to order all the agencies, instrumentalities and publiccorporations acquire equipment and products that are certified as EnergyStar and efficient illumination systems.
Executive Order 2007-41 to promote the construction and use of sustainablebuildings through the cost-effective application of the Green Building Council’sLEED rating system.
Executive Order 2008-33 to establish a fund of $5 million dollars to provide a$500 voucher program for the acquisition of solar water heaters, and toestablish a low interest loan program for the purchase of solar water heatersin local cooperatives.
Responsible entities: PR Legislative Assembly, PREPA, ARPE and the municipalgovernments.
RECOMMENDATIONS BY ENVIRONMENTAL INDICATOR

48
SUSTAINABILITY OF LAND USE IN PUERTO RICO
7. RELEASE OF TOXIC SUBSTANCES TO THE ENVIRONMENT BY INDUSTRIES
To help achieve the planning objective of zero (0) increase in the TRI:
• Municipalities could provide specific local incentives, maybe through areduction in the percentage of municipal taxes or patents that industries pay,in order to reduce the TRI per industry in its jurisdiction and, as a result, withinthe municipality’s territorial boundaries.
• Promote the ISO 1400027 certification and the USEPA’s EnvironmentalManagement Systems28 among all local and international industries operatingin Puerto Rico. This can also become a prerequisite for industries which wouldlike to establish their operation within local jurisdictions.
• The Zoning Regulation 4 of Puerto Rico, as amended, contains two districts ofindustrial zoning: the Light Industrial District and the Heavy Industrial District.The Heavy Industrial District is established to classify areas that by its natureand intensity they require of a special location…The delimitation of theextension of lands for heavy industries is based on the potentialities of thearea for the development of heavy industries, the direction of the winds,negative effects of the heavy industries on the air, water or other…. excludingin this district the commercial and residential uses, and light industries…29
Municipalities should use these zoning categories wisely to limit the locationof new industries that might contribute to their TRI.
Responsible entities: PRPB, the municipal governments and the PR Depart-ment of Economic and Commerce.
27 For more information see ISO14000 Essentials at the ISO International Organization for Standardizationat http://www.iso.org/iso/iso_14000_essentials (downloaded on 5/3/09)
28 For more information see USEPA’s web site on EMS at http://www.epa.gov/ems/(downloaded on5/3/09).
20 PRB, Zoning Regulation 4 , as amended, Section 20.01

49
8. WATER CONSUMPTION PER HOUSEHOLD
To help achieve the benchmark of a 27% reduction of water consumption by municipalresidents:
• As global warming is making scarce the availability of freshwater, especially insmall islands as explained in the indicator’s methodological sheet in AppendixD, for strategic and public safety reasons, the government should adopt normsand programs to promote the reduction of per capita water consumption aswell as its efficient use. This includes the effective implementation of thePRDNER’s Comprehensive Plan for Water Resources in Puerto Rico (2007).
• With the collaboration of PRASA, municipalities should carry out a moreaggressive educational campaign to make the public aware of the need toreduce their drinking water consumption.
• Through an agreed collaboration plan that might include the assignment ofsome funds to the municipalities for inspection and repair support activities,PRASA should also incorporate the municipalities in the task of identifyingand repairing leakages and breakages of the PRASA’s distribution system aswell as identifying and penalizing illegal connections within the municipalities’territorial boundary.
• Municipalities, with the support of PRASA, should also provide incentives forfamilies to reduce their consumption rate by providing for free retrofitequipments for showers, toilets and faucets through a well established retrofitprogram.
Responsible entities: PRASA and the municipal governments.
RECOMMENDATIONS BY ENVIRONMENTAL INDICATOR

50
SUSTAINABILITY OF LAND USE IN PUERTO RICO
SOCIO-ECONOMIC INDICATORS
9. HIGHLY VALUABLE AGRICULTURAL LANDS
To help achieve the proposed planning goal that the amount of highly valuableagricultural lands should not be reduced over time:
• The central government, as well as each individual municipality in their landuse plans, should adopt as a public policy the conservation of the agriculturallands necessary to ensure food security. At the municipal level, this couldalso include a municipal ordinance to assure the future protection of thoseareas already assigned as Common Rural Land within their municipalities thathave valuable agricultural lands as well as active agricultural lands.
• By the development of proper legislation or the amendment of existinglegislation, the protection of highly valuable agricultural lands, as identifiedby the USDA/NRCS and the PRDA, should not be under the discretionarypowers of the PRPB. At the present moment, the USDA/NRCS and the PRDAcan only comment and recommend during the inter-agencies comments andendorsements phase and during the public hearings when incompatibledevelopments are proposed inside valuable agricultural lands. Because ofthe importance of guaranteeing food security for sustainability in the 21st
century, the PRDA should be allowed to have veto power when in comes todecisions related to land use in valuable agricultural lands.
• Since there are several municipalities – mostly in the central mountainousareas - with important agricultural activities in land classified by the USDA/NRCS as values 5-8 as well, it is recommended that the calculation of thisindicator for these particular municipalities take into consideration theagricultural importance of these lands as well.
• Create easements that serve as buffer zones around highly valuable agriculturallands to protect these lands from incompatible land use changes in theirsurroundings.
Responsible entities: PR Legislative Assembly, PRPB, PRDA and the municipalgovernments.

51
10. ACTIVE AGRICULTURAL LANDS
To help achieve the proposed planning objective of no negative change in activeagricultural lands:
• Zone all the lands – from values 1 to 8 as classified by the USDA/NRCS - thatare actually being use for agricultural activities but that are still not zoned assuch, as A-P (“Agrícola Productivo” or Agricultural Productive) A-G (AgriculturalGeneral), according to the PRPB Zoning Regulation 4, as amended.
• At the present moment, agricultural activities represent less than 1% of PuertoRico’s GDP and the GNP. The PRDA has over 100 regulations to protect andpromote agriculture activities. The challenge that the agriculture sector has atthe present moment is the lack of sufficient funds to implement theseregulations effectively and consistently among local farmers. The governmenthas to provide attention to this sector, the same way it gives attention to theconstruction, commercial and industrial sectors. As explained in theIntroduction section of the Report, since the industrialization of Puerto Rico inthe 1940’s and 50’s there has been a gradual devaluation and abandonmentof agriculture as a viable economic activity in the Island’s portfolio.
Responsible entities PR Legislative Assembly, PRPB, PRDA and the municipalgovernments.
11. RESIDENTS WHO WORK WHERE THEY LIVE
To help achieve the planning objective that at least 60% (Puerto Rico average for2000) of the number of workers-residents should work in the same municipality wherethey live:
• Public policies, programs, and specific area plans should be established toencourage the integration of mixed land use in urban areas by both, the centralgovernment and the municipalities in their land use plans (one of the SmartGrowth strategies). See also the recommendation of the next indicador Re-population of urban areas.
• A balance between the development levels of the different geographicalregions within the Island should be established as an island-wide public policyto promote the needed mix of activities within groups of adjacentmunicipalities.
Responsible entities: PRPB and the municipal governments.
RECOMMENDATIONS BY SOCIO-ECONOMIC INDICATOR

52
SUSTAINABILITY OF LAND USE IN PUERTO RICO
12. RE-POPULATION OF URBAN AREAS
To help achieve the proposed planning objective of increasing the population densityin urban areas at least by 11%:
• The central government and the municipalities should adopt public policieson the densities that each municipality should observe in their urban areasbased on specific criteria for the optimal use of the land.
• The Urban Centers Revitalization Act’s (Public Law 212 of August 29, 2002, asamended) main purpose is the revitalization, redevelopment, densificationand repopulation of urban centers through private-public partnerships forinvestments in specific urban areas. This Act could have been a perfect toolto promote re-population in urban areas but, in its implementation phase,municipalities and private investors confronted many challenges in order tocomply with all the requirements imposed by the Treasury Department andby the Directorate of Urbanism of the PRDTPW.
Ammendments to the regulations that help implement the Act have substantiallyreduced the incentives needed to achieve the main goal of the Act. In orderto revitalize, redevelop and re-populate the urban areas this should bereversed. Attractive and effective incentives are required to attract potentialinvestors.
• Promote land banking in the urban areas for new mix use and mid to highdensity developments.
• Increase public safety in the redevelopment areas.
• Adopt Smart Growth principles (see general recommendations) throughpublic policies, plans, programs and activities.
Responsible entities: PRPB and the municipal governments.
13. PEOPLE LIVING IN FLOODWAYS
To achieve the benchmark that no one should be living in floodways (AE Floodway):
• Municipalities need only to comply with the PRPB Planning Regulation 13 thatconsiderably limits development in these areas.
• An eight-year gradual relocation plan could be established with the help ofFEMA for those already living in floodways. After relocating people, anystructure in these areas should be removed.
• In the Municipal Land Use Plan the AE Floodway areas, as identified by FEMAFIRM, should be rezoned to only allow natural open spaces (easements underthe PRDNER), like lineal parks along rivers (examples are Caguas Honor al Ríoand Río Bayamón, both linear parks) or biological corridors, for the protection

53
of water bodies, passive recreation and to provide additional spaces for nativefauna movement and migration. Passive linear parks in floodways could bemanaged in collaboration with the PR National Parks Company and/or themunicipalities.
Responsible entities: PRPB, PRDNR, FEMA and the municipal governments.
14. THE SOCIO-ECONOMIC INDEX
To help achieve the benchmark of no less than 100 (numerical value for the Index):
• Municipalities, as well as the central government, should adopt this Index aspart of the necessary information they need to design plans, programs andactivities to eradicate poverty.
Responsible entities: PRPB, MRCC, Office of the Commissioner of MunicipalAffairs, PR Department of Education, PR Department ofthe Family and the municipal governments.
RECOMMENDATIONS BY SOCIO-ECONOMIC INDICATOR
54
SUSTAINABILITY OF LAND USE IN PUERTO RICO
INFRASTRUCTURAL INDICATORS
15. INACCESSIBILITY TO PUBLIC TRANSPORTATION
To help achieve the planning objective that all wards within the municipality shouldhave at least one public transportation route to the urban center:
• Data of public transportation by each municipal ward should be collectedand maintained on a regular basis.
• Municipalities, with the support of the central government, should adoptpublic policies that guarantee public transportation for each of their wards.
• Public-private partnerships should also be established to supply more efficient,frequent and timely public transportation to and from the wards and the urbancenters, between wards and between municipalities through buses or “carrospúblicos” (public taxis).
• Integrate the public transportation system in and between all the municipalities(island-wide) through buses and public taxis. Assigned transportation funds,both from the federal and local governments, should give priority toestablishing an island-wide mass transportation system (see alsorecommendations for the indicator Footprint of public roads).
Responsible entities: PRDTPW, Puerto Rico Service Commission, PRPB and themunicipal governments.
16. USE OF PUBLIC TRANSPORTATION TO REACH WORK
To help achieve the proposed planning objective of increasing 6% points the use ofpublic transportation to reach work:
• Recommendations for the indicator Inaccessibility to public transportationwill help improve this indicator as well.
• The government must encourage the use of public transportation to reach theplace of work through different incentives and assertive programs.Municipalities can provide frequent and reliable public transportation withintheir urban center and within their wards and the urban center for residentsthat work in the same municipality by the use of trolleys, as some municipalitiesare already doing. This service can offer packages of reduced monthly orannual fares for residents. Some municipalities have already this type of trolleyservice but still need to improve in frequency and reliability.
•· The implementation of Smart Growth principles and strategies for urban areascan also help (see general recommendations). This is paramount in theachievement of sustainability due to the population high dependence onprivate vehicles.

55
• Since the only information available for Puerto Rico is the use of publictansportation to reach work by worker-residents from the U.S. Census, asexplained in the methodological sheet of the this indicator in Appendix D,Puerto Rico can become a partner of the Add-On Participants Program of theU.S. Department of Transportation’s (DOT) National Household Travel Survey(NHTS), formerly the Nationwide Personal Transportation Survey (NPTS), whichserves as the nation’s inventory of personal travel. It is the only trusted sourceof national data on personal travel behavior (including purpose of the trip,means of transportation, trip length, day of the week and month of the year,number of people on the trip, and a host of other trip-making characteristics).Since it is based on a survey basis (it is not a census and Puerto Rico is notincluded in the survey), therefore results cannot be extrapolated to PuertoRico. Nonetheless, the DOT, for its 2008 NHTS, has the Add-On ParticipantsProgram. This Program is designed for states, Metropolitan PlanningOrganizations (MPOs) and regional transportation organizations so they canpurchase additional samples in the NHTS to get more accurate data for theirrespective areas. By becoming a partner in the Add-On Program, Pueto Ricowould be able to acquire additional valuable data about local personaltransportation distances, tendencies and choices for better decision-makingwhen developing and imlpementing transportation plans.30
Responsible entities: PRDTPW, PRPB and the municipal governments.
17. FOOTPRINT OF PUBLIC ROADS
To help achieve the proposed planning objective of no change or increase over timein the public road’s footprint:
• The government should prioritize significantly in the maintenance andimprovement (i.e., Intelligent Transportation Systems [ITS]31) of the network ofexisting roads and in the development and integration of a massive publictransportation system, instead of constructing new roads which bringsscattered low density development along the edges. Puerto Rico already hasone of the highest proportions of roads per km2 in the world with all theresulting unsustainable environmental impacts this has brought in the worldto local land use. Municipalities can influence the central government towardsthis direction when related to transportation decisions within their municipalboundaries.
• The central and municipal governments can coordinate within the differentagencies and offices different work hours for their employees to help reducepeak transit rush hours.
Responsible entities: PRDTPW, PRPB, and the municipal governments.
RECOMMENDATIONS BY INFRASTRUCTURAL INDICATOR
30 More information can be found ontheir web site:http://www.fhwa.dot.gov/policy/ohpi/nhts/aboutnhts.cfm.
31 The ITS program of the DTO wasdesigned to facilitate deploymentof technology to enhance theefficiency, safety, and con-venience of surface transportation,resulting in improved access,saved lives and time, andincreased productivity mostly fore x i s t i n g r o a d s . F o r m o r ein fo rma t ion see : h t tp : / /www.its.dot.gov/about.htm

56
SUSTAINABILITY OF LAND USE IN PUERTO RICO
18. INACCESSIBILITY TO SAFE DRINKING WATER
To help achieve the benchmark of eliminating all systems from USEPA’s SNC list:
• Special attention should be given to Non-PRASA systems. Since 1997 the“Enforcement and Compliance Strategy for Non-PRASA Public Water SupplySystems” (known as the Non-PRASA Strategy) under the leadership of PRDOHand USEPA, has been in place and implemented with some positive progress.But there is still much to be done.
The Non-PRASA Strategy’s main objectives are to:
• “Connect Non-PRASA systems to PRASA, when possible.
• Install disinfection units in all Non-PRASA systems.
• Reduce the number of surface water systems (surface water intakes).
• Create a surveillance program to assure adequate operation and maintenanceof the Non-PRASA systems.
• Reduce the number of positive bacteriological results” (PRDDOH et al., 2006).
The PRDOH and USEPA need the full support of the municipalities to assistthe Non-PRASA communities and achieve the above objectives. These Non-PRASA communities represent a challenge for land use sustainability becausethey are mostly informally and unplanned built communities, established inremote and/or mountainous areas. Therefore, municipalities encounterdifficulties in providing these communities with appropriate utilities and publicservices, such as safe drinking water, especially in emergency situations (i.e.hurricanes or natural disasters). Municipalities should avoid future informaldevelopment of these communities and, as much as possible, work with thosealready established to improve their accessibility to adequate public services.
An example of a municipality that has worked with Non-PRASA systemcommunities is the Municipality of Caguas. In this case, the Municipality and alocal university worked with 17 communities (organized as ASOCAGUAS,Inc. communities) to educate and empower them in order to comply withthe federal Safe Drinking Water and Clean Water Act for their Non-PRASAsystems. Another, example is the “Cooperativa de Acueductos de Patillas”(Patillas Aqueduct Cooperative) in the Municipality of Patillas. This Cooperativeconsists of five communities that, with the help of a local university, got togetherto learn how to properly administer and operate their Non-PRASA system inaccordance with federal laws.32
• The “Four Year Capital Improvements Program” of the government shouldrequire the funds for the maintenance of the existing drinking water systemsas a prerequisite before authorizing new projects.
Responsible entities: PRDOH, PRASA, PRPB, USEPA and the municipalgovernments.
32 Interview with CristinaMaldonado, Environmental Sci-entist of USEPA’s CaribbeanDivision, Municipal WaterPrograms Branch.

57
INSTITUTIONAL INDICATORS
19. APPROVED MUNICIPAL LAND USE PLAN
To help achieve the benchmark that every municipality should have an approvedLand Use Plan:
• The central government should review resources and the procedures to ensure,with agreed deadlines, that all municipalities have a Land Use Plan.
Responsible entities: PR Legislative Assembly, PRPB, municipal governmentsand the Association and Federation of Mayors.
20. THE FISCAL FRAGILITY INDEX
To help achieve the benchmark of above 0 (numerical value for the Index):
• The municipalities, as well as the central government, should adopt this Indexas an economic analysis tool to evaluate the jurisdictions’ fiscal health and foraccountability with their communities.
Responsible entities: Government Development Bank, PRPB, MRCC, Office ofthe Commissioner of Municipal Affairs and the municipalgovernments.
21. LAND OFFICIALLY PROTECTED
To help achieve the planning objective of no negative change or zero (0) decreaseof Specially Protected Rural Land (SPRL):
• As previously recommended in the indicator Development pressure in ruralland a tool that can be use by municipalities is the Transferable DevelopmentRights (TDR), as provided by the Autonomous Municipalities Act (Public Law81 of 1991) in its Article13.024. TDR can help to protect and increase SPRL.
• In addition, and as explained in the Limitations of this indicators’methodological sheet in Appendix D, some municipalities have establishedin their individual land use plans land use zoning districts in urban zones thathave conservation restrictions. Since the indicator only considers land classifiedas SPRL - as defined by the central government- municipalities should consideradding to this indicator the amount of land of said municipal land conservationdistricts when evaluating this indicator for their territorial units. An example isDistrict “BM” (“Bosque Municipal” or municipal forest) in the Municipality ofCarolina.
RECOMMENDATIONS BY INSTITUTIONAL INDICATOR

58
SUSTAINABILITY OF LAND USE IN PUERTO RICO
• Important to mention is Section 2 of Act 49 of January 4, 2003, as amended,known as the Act to Set Forth the Public Policy of Puerto Rico on FloodPrevention and the Preservation of Rivers and Ravines. This Act set forth that inany urbanization works, or any lotification adjacent to a river, ravine, lagoon,or any body of water, a section of land shall be dedicated to public use inthe general interest of the preservation of the body of water, by means ofinscription in the Registry of the Property, consisting of a minimum of fivelinear meters at both sides of the riverbed, or the bed of the stream, ravine,lagoon, or lake. Said section of land shall remain expeditious, and may onlybe used for preservation purpose.33 Municipalities should be aware of therequirement in this Act when setting aside and classifying its SPRL.
• At the central government level, and with the help of the municipalities sincehighly valuable ecological lands identify for conservation fall inside municipaljursidictions, a plan should be established through public policy to achievethe minimum recommended by the GAP Analysis Project (Gould et al., 2008)for the Island of 15% of SPRL for the protection of biodiversity. According tothis study, special attention should be given to expanding reserves in thelimestone hills and coastal plains (the matrix of wetland and upland vegetationthat is found in the former Roosevelt Roads and Sabana Seca Naval Base, theNortheast Ecological Corridor, and Piñones, among other areas).
Responsible entities: PR Legislative Assembly, PRDNER, PRPB and the municipalgovernments.
33 Retrieved on 12/15/08 from http://www.oslpr.org/download/en/2003/0049.pdf

59
LIMITATIONS
LIMITATIONS
THE SERIOUS CONSTRAINTS IMPOSED BY THE ABSENCE OF STATISTICAL DATA, THEIR
RELIABILITY AND REGULARITY
The truth is that there is a general dissatisfaction and numerous criticism forthe delays with which information is supplied by government agencies and the credibilityof the indicators and reports of the results of opinion surveys, as well as of the proceduresused to produce them both in the public and private level (Statement of Motives, “TheInstitute of Statistics of Puerto Rico Act, Public Law 209 of August 28, 2003).
As the Institute of Statistics of Puerto Rico began operations in mid-2007 (http://www.estadisticas.gobierno.pr), the situation described in the preceding paragraphprevailed throughout the period of time that took to develop this research project. As aresult, the major challenge encountered was to address the reliability of many of theinformation and digital data available for the indicators. It was what consumed the mosttime in the research conducted because there are no metadata for many data sets.Information was sometimes not available in digital form but distributed in documents inseveral government agencies, so the gathering, analysis and validation of the data was amajor challenge and took much longer than expected.
Multiple references to the quality of the statistical data produced by theGovernment of Puerto Rico can be found in the Limitations section of each of the 22indicators (Appendix D). In fact, the problem of data reliability was one of the main reasonsfor which most of all the potential indicators considered had to be eliminated. Otherindicators were carefully reevaluated and changed in scope in the validation process.Even the use of GIS as the main technical and scientific tool for the model, as originallyproposed, was ruled out as explained before in Challenges and Lessons Learned. Theselected indicators are based on the best reliable and readily available information anddigital data. Notwithstanding, it is important to point out that in regards to reliability, theinformation used for the different analyses of this project is official, authorized andpublished by the pertinent government agencies at the time of the preparation andpublication of this work. Thus, the pertinent metadata as well as the geomatics used in theproject, correspond to those responsible for the original creation of each layer. 34
Another limitation was the lack of availability and disposition of the technicalexperts in the agencies for interviews and validation of the information. This made theresearch process even a greater challenge.
34 It is important to mention that the information used in the demographic and spatial analyses through the GIS has,in general terms, the limitation that there is no particular organization or institution who takes responsibility for thequality, updating, precision and accuracy of the geospatial data available in Puerto Rico. This responds, in greatmeasure, to the fact that the majority of the agencies (state as well as municipal and federal) that producegeospatial information in any way as part of their performance and administrative functions, still conduct workwith their own protocol and quality control system for the development of information or with the criteria selectedfor such a task (scale, projection, format in the system of coordinates, precision). That is, digitalized geospatialinformation of the different agencies does not necessarily have the same precision ranges, the same level or scale,the same temporal frequency, the same method of information collection and digitalization method (automatic,manual, software, hardware, etc.) Thus, independently of the declarations of the limitations in the use of anyinformation, there is always some degree of uncertainty in total compatibility and reliability of the data, especiallywhen the sources of information are varied and disperse, as is the case of this project due to its magnitude andextension.
60
SUSTAINABILITY OF LAND USE IN PUERTO RICO
LIMITATIONS OF THE ISLAThe ISLA index has two major limitations, which could be overcome in a later
version of the study. These are:1. High sensitivity to benchmarks and weights. Researchers must choose
benchmarks for —or planning objectives when there are no specificbenchmarks— and assign weights to each of the stressors and relieversindicators. The study found that standard technical data on which to basebenchmarks and weights are not as readily available as was originally expected.The resulting need to rely on experts’ opinions leaves the index susceptibleto subjectivity on the part of the researchers.
2. The mathematical formulation does not allow for incremental measures ofstressors or relievers intensity for indicators that overshoot their benchmarks.If such incremental sensitivity is desired, the formula for the index may needto be modified in the future.