Embed Size (px)
Citation preview
State of the Industry Research Series :
The Future of Retail Analytics
www.eknresearch.com
2013
EKN is part of the Edgell Family
®
Premier Sponsor
Table of Contents
Executive Summary 3
The Future of Retail Analytics: From Intelligence to Outcome 6
Research Findings 12
Recommendations 30
EKN Analytics Maturity Assessment Framework (Excerpt) 34
Retail Analytics Vendor Landscape 37
Executive Summary
EKN 4
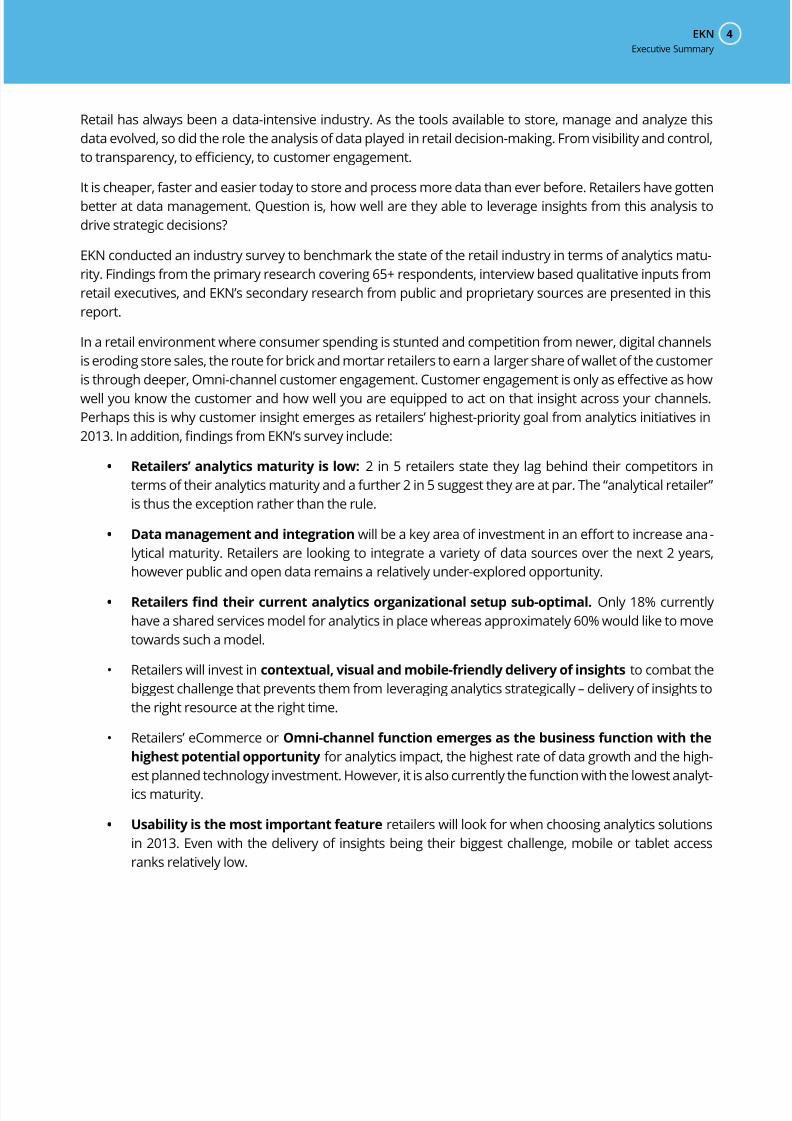
Retail has always been a data-intensive industry. As the tools available to store, manage and analyze this
data evolved, so did the role the analysis of data played in retail decision-making. From visibility and control,
to transparency, to eciency, to customer engagement.
It is cheaper, faster and easier today to store and process more data than ever before. Retailers have gotten
better at data management. Question is, how well are they able to leverage insights from this analysis to
drive strategic decisions?
EKN conducted an industry survey to benchmark the state of the retail industry in terms of analytics matu-
rity. Findings from the primary research covering 65+ respondents, interview based qualitative inputs from
retail executives, and EKN’s secondary research from public and proprietary sources are presented in this
report.
In a retail environment where consumer spending is stunted and competition from newer, digital channels
is eroding store sales, the route for brick and mortar retailers to earn a larger share of wallet of the customer
is through deeper, Omni-channel customer engagement. Customer engagement is only as eective as how
well you know the customer and how well you are equipped to act on that insight across your channels.
Perhaps this is why customer insight emerges as retailers’ highest-priority goal from analytics initiatives in
2013. In addition, ndings from EKN’s survey include:
• Retailers’ analytics maturity is low: 2 in 5 retailers state they lag behind their competitors in
terms of their analytics maturity and a further 2 in 5 suggest they are at par. The “analytical retailer”
is thus the exception rather than the rule.
• Data management and integration will be a key area of investment in an eort to increase ana -
lytical maturity. Retailers are looking to integrate a variety of data sources over the next 2 years,
however public and open data remains a relatively under-explored opportunity.
• Retailers nd their current analytics organizational setup sub-optimal. Only 18% currently
have a shared services model for analytics in place whereas approximately 60% would like to move
towards such a model.
• Retailers will invest in contextual, visual and mobile-friendly delivery of insights to combat the
biggest challenge that prevents them from leveraging analytics strategically – delivery of insights to
the right resource at the right time.
• Retailers’ eCommerce or Omni-channel function emerges as the business function with the
highest potential opportunity for analytics impact, the highest rate of data growth and the high-
est planned technology investment. However, it is also currently the function with the lowest analyt-
ics maturity.
• Usability is the most important feature retailers will look for when choosing analytics solutions
in 2013. Even with the delivery of insights being their biggest challenge, mobile or tablet access
ranks relatively low.
Executive Summary
State of the Industry Research Series: The Future of Retail Analytics5
The traditional view of data management and analysis in retail has been tool-driven – be it relational data-
bases of decades past or Business Intelligence tools more recently. In EKN’s view, “business analytics” is a
concept that focuses on decisions and outcomes, and is a far better indicator of the future of retail analytics.
Executive Summary
Research Findings Fast Facts:
• Retailers rate Amazon, Wal-Mart and Target
as leaders in customer analytics
• 84% of retailers employ data analysts
• Web or Social Media Analytics software is
expected to have a 96% install base among
surveyed retailers over the next 2 years
Inside the report:
• EKN’s Business Analytics Software Vendor
Landscape
• The Analytics Honor Board
• EKN’s Analytics Maturity Assessment Frame-
work (Excerpt)
EKN 6
The Future of RetailAnalytics:From Intelligence toOutcome
State of the Industry Research Series: The Future of Retail Analytics7
What’s in a Name?
Retail technology terms are an etymologist’s delight. What is the dierence between Business Intelligence
and analytics? Between analytics and Big Data analytics? Far from being trivial, the distinction is important
for retailers to know, especially those in conversation with software providers who classify themselves as
providing solutions in one or the other of these areas.
Business Intelligence refers exclusively to tools and software focused on retrieving, analyzing and report-
ing data stored in an existing enterprise database such as a data warehouse or data mart. BI tools typically
focus on querying, reporting, On-Line Analytics Processing (OLAP) and alerts. They help answer the ques-
tions – what happened, how many, how often, where the problem is, and what actions are needed.1
Analytics is a more ambiguous term since it overlaps with Business Intelligence in that BI tools play an active
role in analytics. EKN sees the term analytics comprised of two distinct ideas, both of which are important to
understand separately – business analytics and analytics software.
Business analytics is the art, science and philosophy of utilizing insights to improve decision-mak-
ing in the context of a particular business function or process. It is focused on a continuous, ongo-
ing, and iterative exploration of past business or business process performance to gain insight, drive
business planning, and deliver a particular business outcome.
Analytics software is a class of tools that leverages data to create context-rich, actionable insight.
Compared to Business Intelligence tools, analytics software typically have improved visualization,
the ability to work with real-time data, and include additional functionality such as forecasting, re-
gression, and modeling. Business analytics is focused on the questions – why is this happening,
what if the trends continue, what will happen next (predict), and what is the best that can happen
(optimize)2. Jeremy Kirk of IDG News Services provides a good example3 of a customer trying to
withdraw money from a cash machine as illustrative of how application of analytics must inuence
a specic action. “The data being leveraged is a bank account balance, the process is the withdrawal,
the context-specic insight is the fact that the customer has no overdraft protection, and the action
is the conscation of the debit card.”
In its State of the Industry Research on Big Data in Retail4, EKN dened Big Data as collectively referring to
the strategy, business processes, tools and technologies that pertain to datasets whose size and complexity
is beyond the ability of typical database software tools to capture, store, manage, and analyze.
The Future of Retail Analytics: From Intelligence to Outcome
1 International Institute of Business Analysis2 International Institute of Business Analysis3 Analytics buzzword needs careful denition4 EKN State of the Industry Research, Big Data in Retail
EKN 8
Analytics in Retail: A Historical Context
Retail is a data-intensive industry. We serve millions of customers, move hundreds of thousands of items,
stock thousands of SKUs in hundreds of stores, in pursuit of that one goal – a protable relationship with
customers.
For decades retailers have focused on data and its analysis to drive improvements in core business pro-
cesses and to improve operational decision-making. With advances in analytical tools and an improved un-
derstanding of the value of such tools, the functions that benetted most were Supply Chain, Finance and
Merchandising. Even recently, Marketing’s adoption of web and social media analytics was initially driven
more from a channel performance measurement and improvement perspective, rather than a need to un-
derstand consumer behavior and preferences better.
Not only have the volume (amount), variety (dierent sources and types) and velocity (the speed at which
this data ows through the enterprise’s decision making processes) of data that a retailer needs to process
through its business information systems increased exponentially over the last few years, retailers’ goals
from the analysis of this data have also changed dramatically. From being focused on transparency, ef-
ciency and business agility, retailers now need to focus their analytics eorts on customer insight and
engagement.
In the new normal of retailing where the consumer is value-conscious, always-on, mobile-enabled, socially-
active and channel-agnostic, retailers are nding it dicult to dierentiate themselves based on traditional
factors such as price, promotions, location and assortment alone.
On the other hand, with consumers themselves reliant on
technology – personal computers, tablets, mobile and smart
phones, the Internet, and social media – they are leaving
behind digital breadcrumbs and displaying their “digital body
language”. Combined with how consumers interact with
retailers across their own channels, loyalty programs,
promotions and customer service, this mass of consumer data
oers retailers their best chance yet to really know their
customer.
Knowing the customer better than competition and having the ability to orchestrate business decisions at
the speed of insight is the new retail competitive battleeld, and business analytics, not Business Intelligence,
can be one of the strongest weapons in a retailer’s arsenal.
Business analytics will only evolve further into a strategic capability that sits at the intersection of customer
preferences, business strategy and business processes. Insights will be deeply embedded across a retailer’s
functional value chain, aording it both the ability to be investigative and predictive (strategic), as well as the
adeptness to be ecient and agile (operational). Therein lies the future of retail analytics.
From being focused on
transparency, eciency and
business agility, retailers now
need to focus their analytics
eorts on customer insight and
engagement.
The Future of Retail Analytics: From Intelligence to Outcome
State of the Industry Research Series: The Future of Retail Analytics9
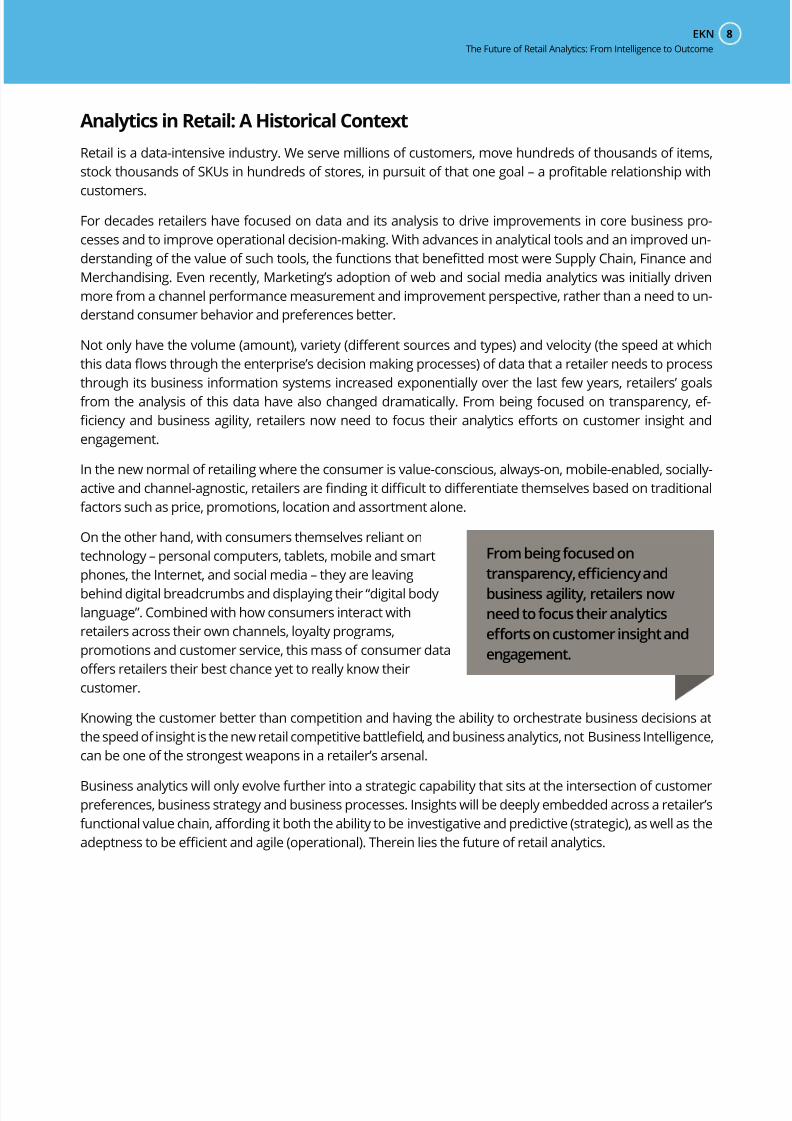
Analytics Through the Ages:
Business Focus
Investment Wave
Wave 1:
Visibility and
Control
Wave 2:
Infrastructure and
Operations
Wave 3:
Execution and
Excellence
Wave 4:
Customer
Engagement
Analytics Age Stone Age Bronze Age Iron Age Modern Age
Focused on
Improving visibility
into key aspects of
stock and sales
Integrating data
across business
functions
Building an
enterprise data
repository
Gleaning customer
insights from
enterprise and
external data
Buzzword SpreadsheetDecision Support
System (DSS)Optimization Big Data
Dening moment
Kroger decides to
participate in the
experimental UPC
program (1970)
Wal-Mart’s database
in 1999 is said to be
200TB, one of the
largest in the world.
Amazon’s
proclamation that
it is a technology
company rst (2011).
Target predicts a
teen is pregnant,
before her father
knows. (2013)
New Retailer
Target/Dayton
Hudson
(1902)
Wal-Mart
(1962)
Amazon
(1994)
Apple Store
(2001)
The Future of Retail Analytics: From Intelligence to Outcome
EKN 10
From Business Intelligence to Business Analytics
In a recent point of view, EKN describes the convergence of
4 key trends that is reshaping retail, including an explosion
of consumer and enterprise data that dwarfs anything we,
as an industry, have ever dealt with before.
Yet, the biggest challenge facing retailers isn’t managing the
volume or variety of data. It is having the ability to identify
what business outcomes they can impact through the
integration and analysis of this data, and the execution
capability to glean relevant insights and deliver them to the relevant person to be able to
act on them at the right time.
At dierent levels of maturity and to varying degrees of success, leading retailers such as Best Buy, CVS,
Amazon, Target and Wal-Mart among others are leveraging analytics to:
• Gain a deeper understanding of their customers’ behaviors, needs and preferences to build a more
personal relationship.
• Improve marketing eectiveness through micro-targeting, personalization and delivery of context
and channel sensitive promotions and oers that increase the likelihood of purchase.
• Optimize the supply chain to ensure the most protable outcome in terms of demand fulllment
balanced against cost of carrying excess inventory.
• Determine pricing, including bundle and basket pricing, based on the value customers attach to
their needs at any given time.
• Spot ash trends, such as a celebrity sighting in a particular pair of jeans, that have an impact on
demand to be able to turn them into revenue capturing opportunities.
Even as such industry leaders evolve their business structures, strategies, tools and resources in an eort
to embed analytics into the very fabric of the organization, most retailers, by their own assessment (43% in
EKN’s survey stated they lagged behind competitors in their strategic use of analytics), are still struggling with
wide ranging issues that prevent them from leveraging analytics strategically.
Knowing the customer better
than competition and having the
ability to orchestrate business
decisions at the speed of
insight is the new competitive
battleeld of retail.
The Future of Retail Analytics: From Intelligence to Outcome
State of the Industry Research Series: The Future of Retail Analytics11
• They are overwhelmed by a data tsunami (from POS systems, enterprise transactional data, ma-
chine logs, loyalty data, unstructured and semi-structured data from emails and machine logs, so-
cial media data) and are unable to build a data management and integration strategy best aligned
with their format and business goals.
• They nd the multitude of software types and an increasingly crowded vendor landscape
confusing. And, in an environment where investments in IT are justiably scrutinized, some may
nd themselves battling for internal justication and investment due to failed ROI metrics from
prior analytical tools.
• Business Intelligence, as dened above, is tool dependent, whereas business analytics depends as
much on the organization’s culture and outlook towards analytics as it does on tools. Most retailers
have adopted BI tools as a matter of natural progression of systems. BI tools can thus oer insights
that can prompt bottom-up change. A culture of business analytics, however, has to be driven from
the top down. Some retailers may nd it dicult to truly embrace “analytical retail” due to their
management’s archaic or under-informed outlook towards analytics.
• The single biggest stumbling block facing business analytics is the lack of skilled resources that
can help retailers make sense of data and contextualize insights for improved decision making.
• A related issue that is as important is how business analytics teams are structured in the enterprise.
Retailers are struggling with how their teams and resources are currently structured , a fact
that is borne out by ndings from EKN’s research, presented in a subsequent section of this report.
• Another skill related issue for retailers is re-training existing employees who perform roles that
have transformed to be increasingly dependent on analytics. Traditionally, some of these roles may
have been seen as art more than science, which makes the issue even more complicated given the
personalities involved. Such roles include retail marketers, buyers and merchants.
EKN Analytics Maturity Assessment Framework (Appendix A) provides a quick reference method for retailers
to benchmark where they stand.
The Future of Retail Analytics: From Intelligence to Outcome
EKN 12
Research Findings
State of the Industry Research Series: The Future of Retail Analytics13
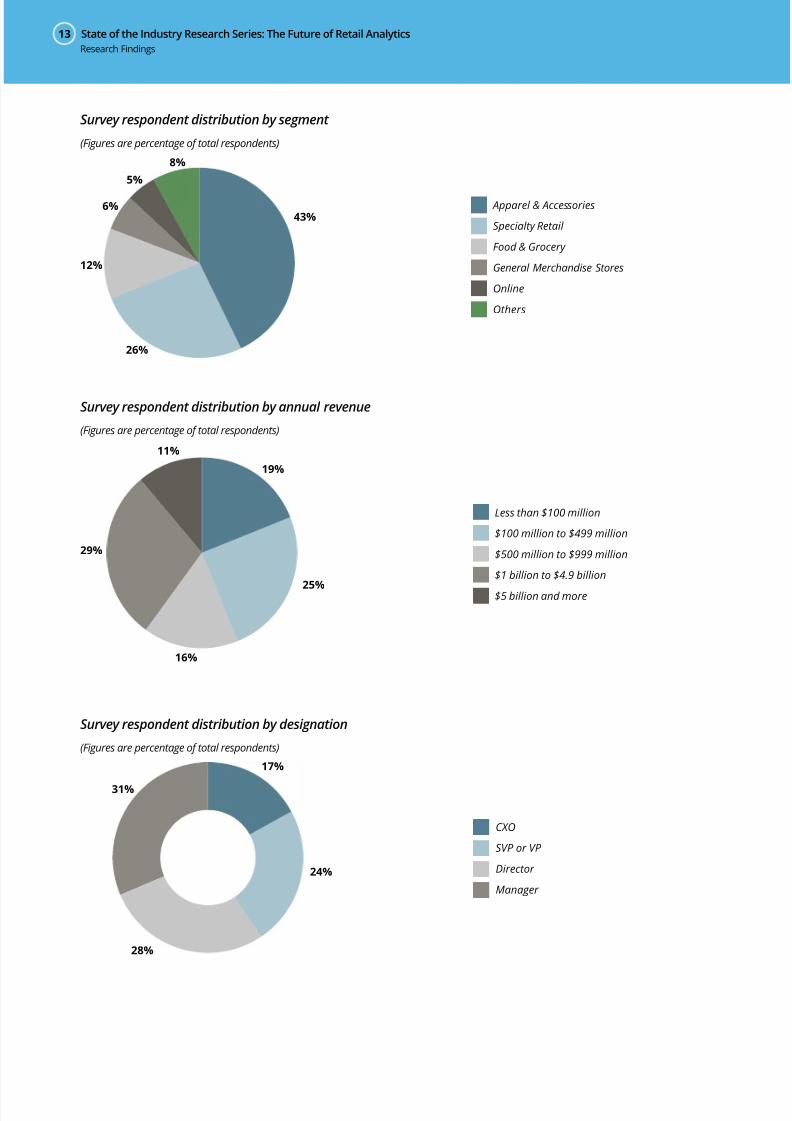
Survey respondent distribution by segment
(Figures are percentage of total respondents)
Apparel & Accessories
Specialty Retail
Food & Grocery
General Merchandise Stores
Online
Others
43%
26%
12%
6%
5%
8%
Survey respondent distribution by annual revenue
(Figures are percentage of total respondents)
19%
25%
16%
29%
11%
Less than $100 million
$100 million to $499 million
$500 million to $999 million
$1 billion to $4.9 billion
$5 billion and more
Survey respondent distribution by designation
(Figures are percentage of total respondents)
CXO
SVP or VP
Director
Manager
17%
24%
28%
31%
Research Findings
EKN 14
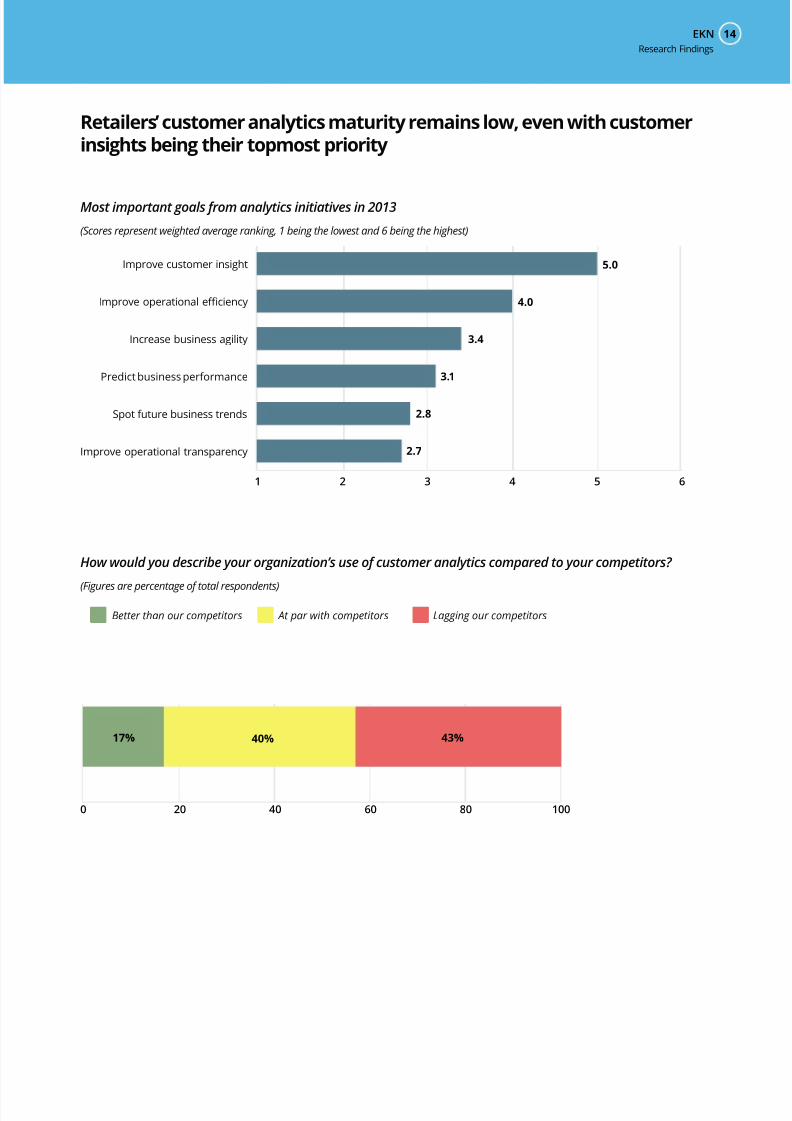
Retailers’ customer analytics maturity remains low, even with customerinsights being their topmost priority
Most important goals from analytics initiatives in 2013
(Scores represent weighted average ranking, 1 being the lowest and 6 being the highest)
1 2 3 4 5 6
Improve operational transparency
Spot future business trends
Predict business performance
Increase business agility
Improve operational efficiency
Improve customer insight 5.0
4.0
3.4
3.1
2.8
2.7
How would you describe your organization’s use of customer analytics compared to your competitors?
(Figures are percentage of total respondents)
0 20 40 60 80 100
Better than our competitors At par with competitors Lagging our competitors
17% 40% 43%
Research Findings
State of the Industry Research Series: The Future of Retail Analytics15
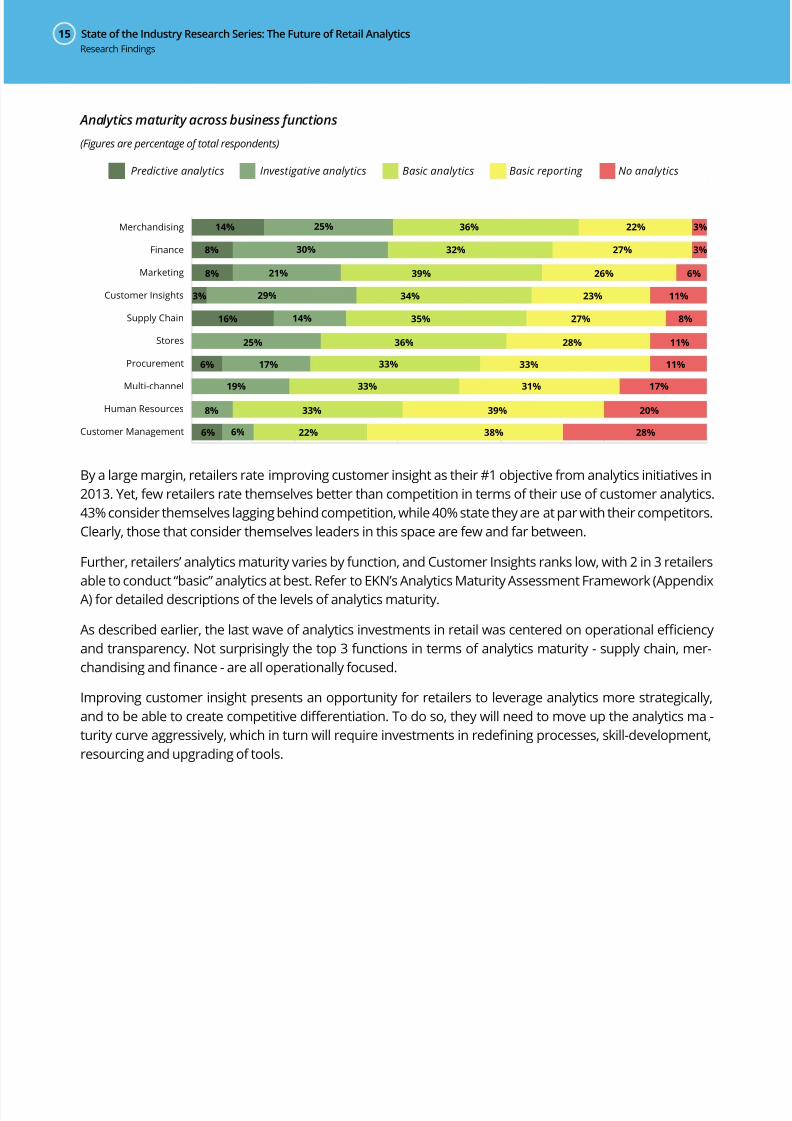
Analytics maturity across business functions
(Figures are percentage of total respondents)
Predictive analytics Investigative analytics Basic analytics Basic reporting No analytics
Customer Management
Human Resources
Multi-channel
Procurement
Stores
Supply Chain
Customer Insights
Marketing
Finance
Merchandising 14% 25% 36% 22% 3%
8% 30% 32% 27% 3%
8% 21% 39% 26% 6%
3% 29% 34% 23% 11%
16% 14% 35% 27% 8%
25% 36% 28% 11%
6% 17% 33% 11%33%
19% 33% 31% 17%
8% 33% 39% 20%
6% 22% 38% 28%6%
By a large margin, retailers rate improving customer insight as their #1 objective from analytics initiatives in
2013. Yet, few retailers rate themselves better than competition in terms of their use of customer analytics.
43% consider themselves lagging behind competition, while 40% state they are at par with their competitors.
Clearly, those that consider themselves leaders in this space are few and far between.
Further, retailers’ analytics maturity varies by function, and Customer Insights ranks low, with 2 in 3 retailers
able to conduct “basic” analytics at best. Refer to EKN’s Analytics Maturity Assessment Framework (Appendix
A) for detailed descriptions of the levels of analytics maturity.
As described earlier, the last wave of analytics investments in retail was centered on operational eciency
and transparency. Not surprisingly the top 3 functions in terms of analytics maturity - supply chain, mer-
chandising and nance - are all operationally focused.
Improving customer insight presents an opportunity for retailers to leverage analytics more strategically,
and to be able to create competitive dierentiation. To do so, they will need to move up the analytics ma -
turity curve aggressively, which in turn will require investments in redening processes, skill-development,
resourcing and upgrading of tools.
Research Findings
EKN 16
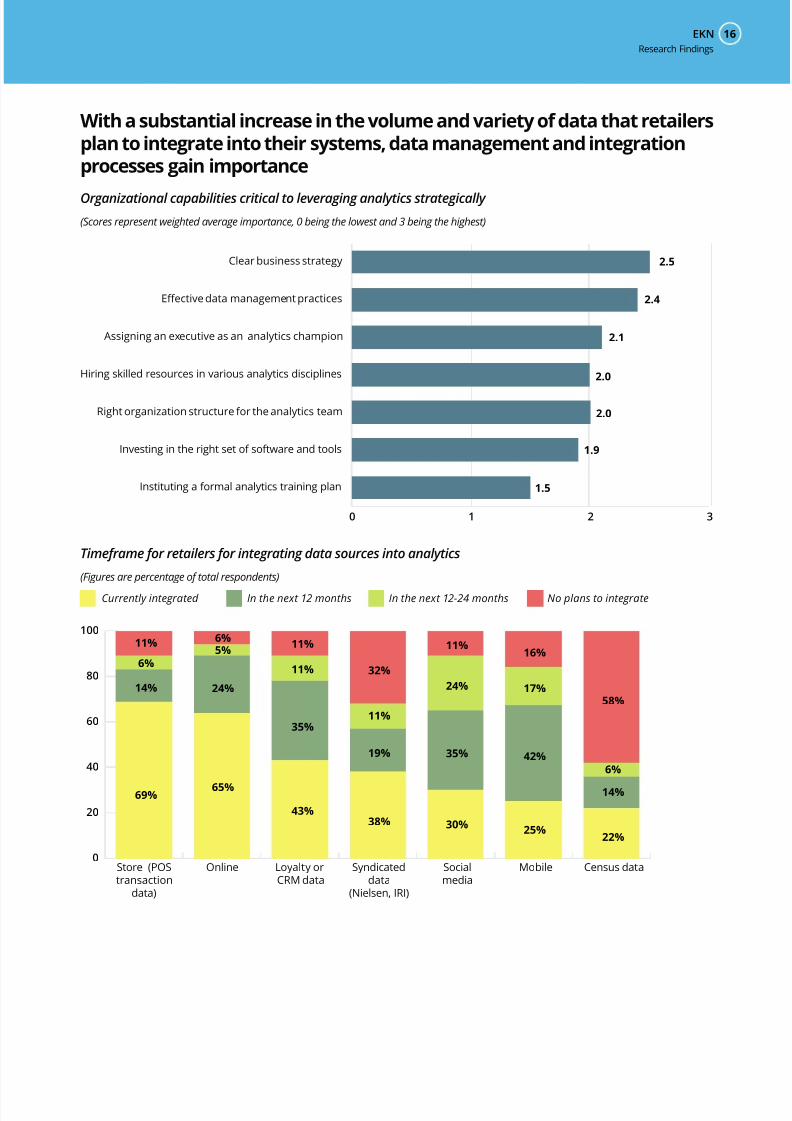
With a substantial increase in the volume and variety of data that retailersplan to integrate into their systems, data management and integrationprocesses gain importance
Organizational capabilities critical to leveraging analytics strategically
(Scores represent weighted average importance, 0 being the lowest and 3 being the highest)
0 1 2 3
2.5
2.4
2.1
2.0
2.0
1.9
1.5
Clear business strategy
Effective data management practices
Assigning an executive as an analytics champion
Hiring skilled resources in various analytics disciplines
Right organization structure for the analytics team
Investing in the right set of software and tools
Instituting a formal analytics training plan
Timeframe for retailers for integrating data sources into analytics
(Figures are percentage of total respondents)
0
20
40
60
80
100
69% 65%
43%
38% 30%25%
22%
14%
6%
58%
42%
17%
16%
35%
24%
19%
11%
11%
32%
35%
11%
11%
24%
5%
6%
14%
6%
11%
Store (POStransaction
data)
Online Loyalty orCRM data
Syndicateddata
(Nielsen, IRI)
Socialmedia
Mobile Census data
Currently integrated In the next 12 months In the next 12-24 months No plans to integrate
Research Findings
State of the Industry Research Series: The Future of Retail Analytics17
Retailers rate having a clearly dened analytics business strategy and an eective data management and
integration process as the most important organizational capabilities required to be able to leverage analyt-
ics more strategically.
As retailers institute a stronger data management and integration process, they will improve their ability to
successfully integrate a variety of sources of data into their customer insights process. For those struggling
to navigate the syntactical and conceptual mineeld Big Data can be, this provides a real glimpse into retail-
ers’ data integration plans over the next 2 years.
• Current state: Store (POS transaction data), online and loyalty or CRM data emerge as the top 3
sources of data retailers already integrate as part of their analytics initiatives. Yet, this integration is
far from being an industry standard.
• Future state: Retailers will plug gaps in the aforementioned areas. The most aggressive data inte-
gration plans have to do with social media – as those retailers integrating this data will go from 30%
in 2013 to approximately 90% in 2015. Mobile data will see a similar growth in integration, albeit
from an even smaller base.
• Missed opportunities: 58% of retailers have no plans to integrate public or open data such as Cen-
sus data. EKN believes such readily available, free to use data provides retailers an opportunity to
further enrich insights gleaned from internal and external customer data. 1 in 3 retailers also report
no plans to integrate syndicated data from sources such as Nielsen and IRI.
In EKN’s State of the Industry Research on Big Data in Retail, retailers at a higher level of analytics maturity
identied data variety as their biggest data management challenge (as compared to data volume for those
at a lower level of maturity). As retailers integrate a larger variety of data over the next 2 years, Big Data will
nd a real meaning in their organizations. It will be humbler than the conquer-the-world aspirations typically
associated with it; but it will be a start.
Research Findings
EKN 18
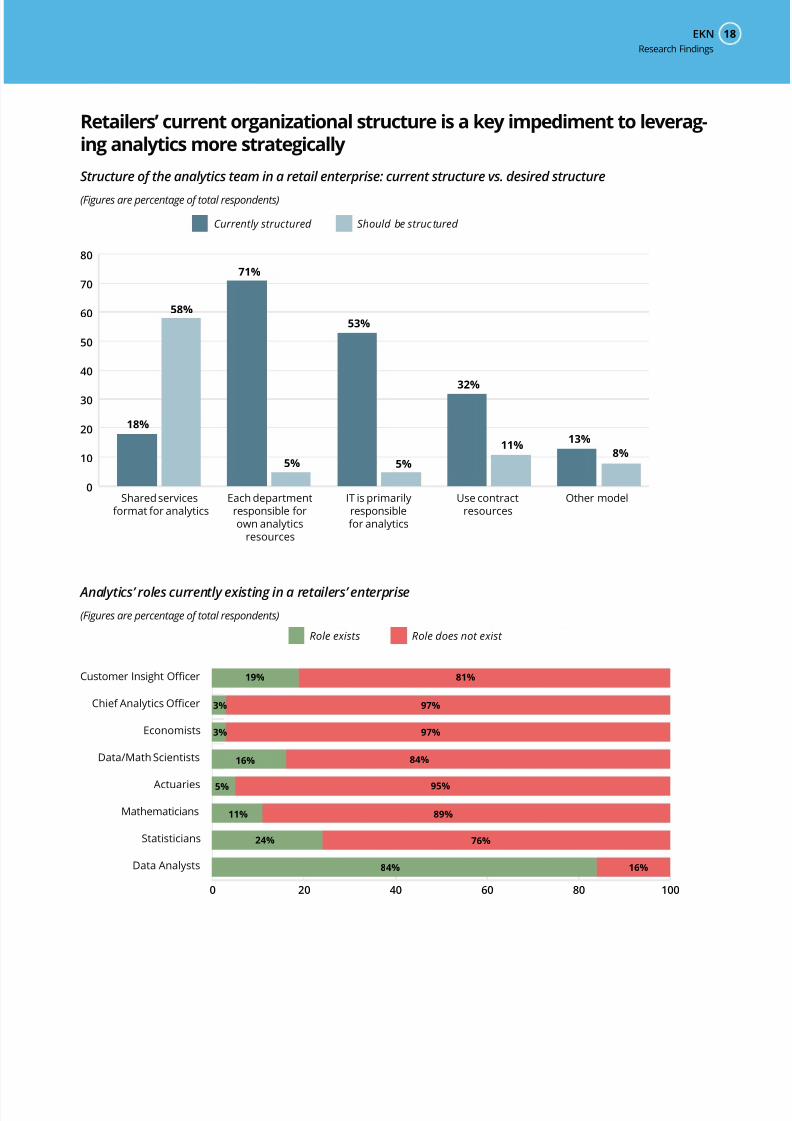
Retailers’ current organizational structure is a key impediment to leverag-ing analytics more strategically
Structure of the analytics team in a retail enterprise: current structure vs. desired structure
(Figures are percentage of total respondents)
Currently structured Should be struc tured
0
10
20
30
40
50
60
70
80
18%
58%
71%
5% 5%
53%
32%
11% 13%
8%
Shared servicesformat for analytics
Each departmentresponsible forown analytics
resources
IT is primarilyresponsiblefor analytics
Use contractresources
Other model
Analytics’ roles currently existing in a retailers’ enterprise
(Figures are percentage of total respondents)
0 20 40 60 80 100
19%
3% 97%
3%
16%
5%
11%
24%
84% 16%
76%
89%
95%
84%
97%
81%Customer Insight Officer
Chief Analytics Officer
Economists
Data/Math Scientists
Actuaries
Mathematicians
Statisticians
Data Analysts
Role exists Role does not exist
Research Findings
State of the Industry Research Series: The Future of Retail Analytics19
Towards leveraging analytics more strategically, a trifecta of organizational structure and stang related
factors emerge as critically important: assigning a senior executive owner, analytics resources of various
disciplines, and an optimal organizational structure. While these are seen as critically important by retailers,
their current stang and structure set up is found wanting.
• Senior executive owners: Less than 20% of retailers have instituted a position of Customer In-
sights Ocer or Chief Analytics Ocer. Along with other structural changes, EKN believes institut -
ing such a position is a step in the right direction for larger retailers looking to elevate the strategic
importance of analytics in their organizations. Smaller retailers should also dene the role, but may
choose to have an existing executive position take it on as additional responsibility.
• Organizational structure: 71% of retailers currently have individual departments responsible for
their own analytics resources while 53% rely on the IT function primarily for analytics support. Only
5% state either of these as their desired state. Contrastingly, 3 in 5 retailers would like to move to a
shared services model for analytics, up from 1 in 5 today.
• Multi-disciplinary stang: Retail analytics stang is heavily focused on one particular skill, with
84% respondents reporting they employ data analysts. While data analysts will continue to be the
largest constituents of an analytics team, EKN believes retailers will need to invest in specialist skills
such as statisticians, actuaries, data scientists and economists, especially with a move towards a
shared service model.
Research Findings
EKN 20
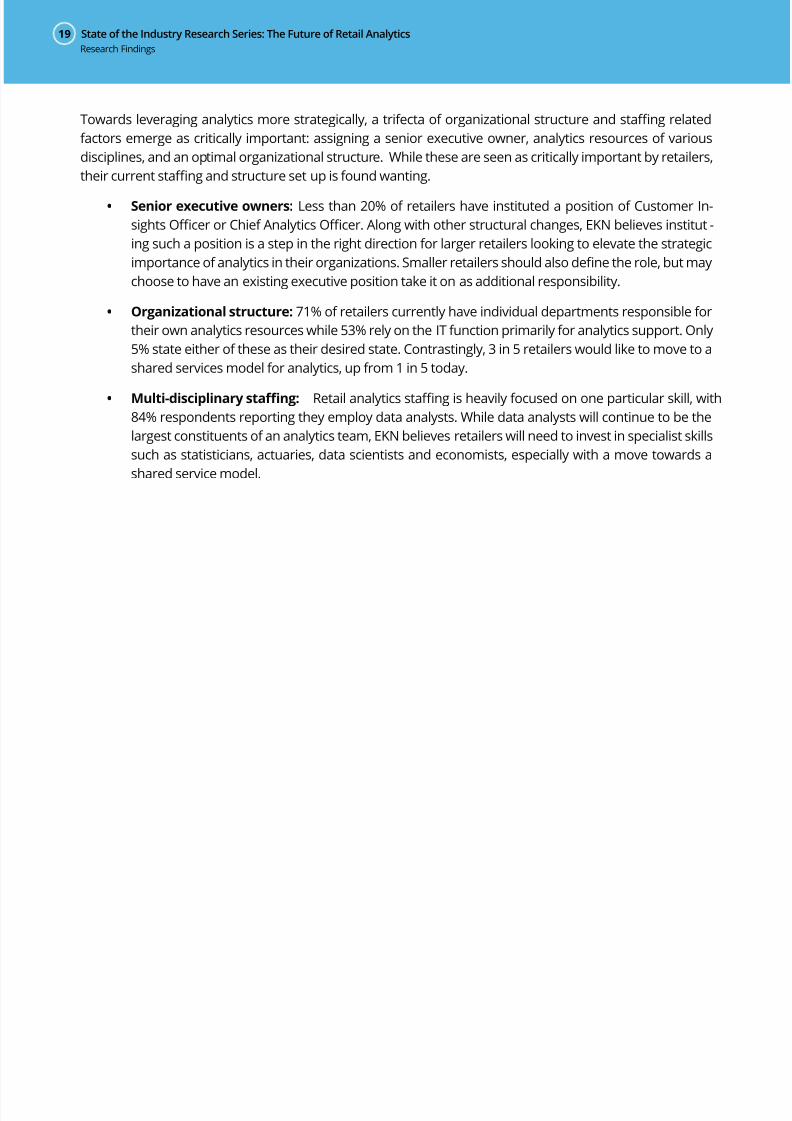
Delivering insights to the right resource at the right time is retailers’ top-most analytics challenge
Challenges that prevent retailers from leveraging analytics more strategically
(Scores represent weighted average importance, -2 being unimportant and +2 being most important)
-2 -1 0 1 2
0.8
-0.8
0.7
0.6
0.3
0.3
-0.3
0.2
Delivery of insights to the right resource at the right time
Lack of clearly articulated analytics strategy
Inadequate analytics resources
Poor data quality
Outdated software and tools
Difficulty in measuring analytics ROI
Management style restraining data-driven decisions
Previous failure in analytics investment
Of the list of challenges available to them, respondents in EKN’s survey chose the ‘inability to deliver insights
to the right person at the right time’ as the biggest. It is a bigger challenge than the perennial lack of resourc-
es. During interviews with EKN, many retail executives said exactly the same thing – as much as we would like
to keep upgrading our analytics capabilities and produce more incisive insights, the insights we do produce
aren’t always acted upon due to a gap in who it is delivered to and when.
As retailers look to address this challenge, EKN suggests retailers evaluate their business processes and
tools to ensure the delivery of insights are:
• Time-sensitive: As much as there is need for real-time and on-demand insights, not all analysis
needs to be delivered in real-time. Real time insights need to be viewed with the lter of response
time; real time information is meaningless if you can’t act on it immediately. It is easy to visualize
how real time price, stock and sales information can help you dynamically adjust prices online and
optimize your margins, but the same information isn’t that valuable in real time for a brick and mor-
tar retailer that takes a week to implement a markdown. Insight delivery should be time-sensitive
and aligned to when you can act on a decision, i.e. optimized to be delivered at the time its con-
sumption will be most valuable.
• Rich: Contains as much context as necessary, so a business user can make an informed decision.
• Relevant: Delivered to the appropriate business user.
• Consumable: Easy for the business user to consume, without requiring knowledge of fundamen-
tals of statistics. Visualization can help a larger audience consume and react to insights.
Research Findings
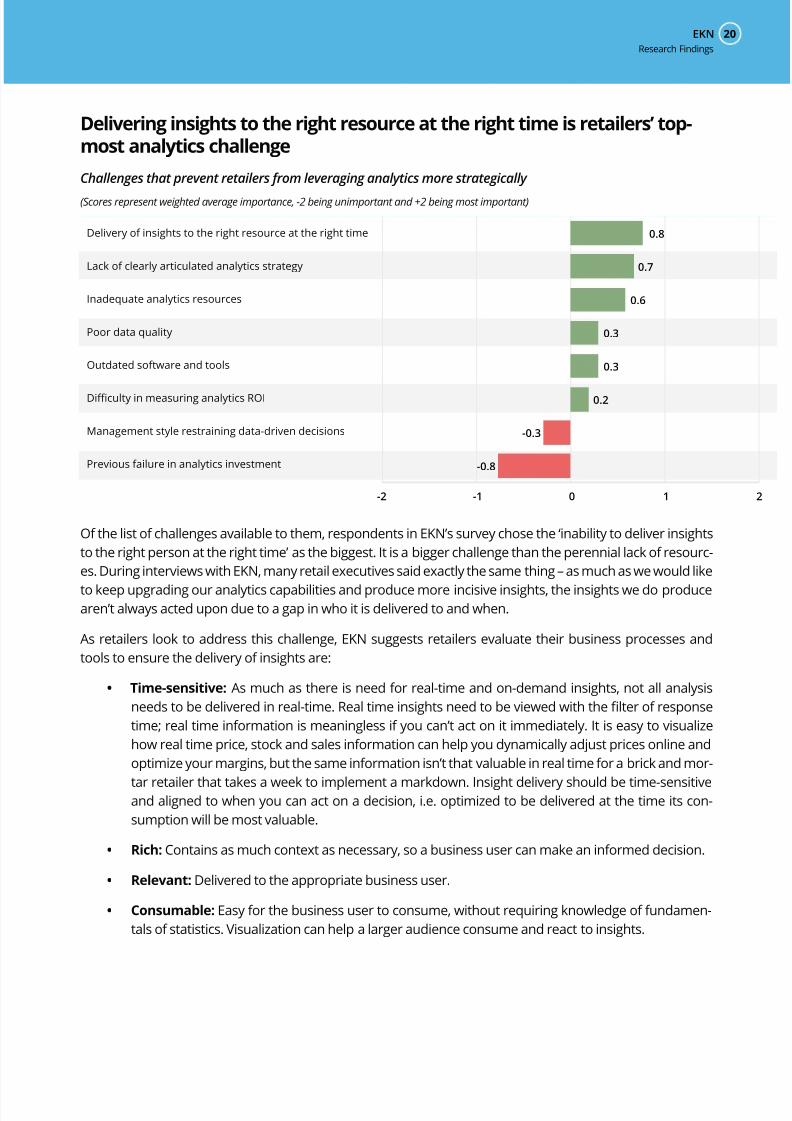
State of the Industry Research Series: The Future of Retail Analytics21
Retailers’ technology investments over the next 2 years are focused onimproving insights delivery and analytics maturity
Adoption of Business Analytics solutions by retailers, current use vs. plans for adoption in future
(Figures are percentage of total respondents)
Currently use Implement in the next 12 months Implement in the next 12-24 months
0
20
40
60
80
100
69% 68%61%
48%
33% 32%
41%
17%
15%
15%
13%
32% 33% 35%
35%
3%
28%
25%
25%
22%
23%
33%
28%
20%
20%
5%
10%12%
12%7%
EnterpriseData
Warehouse
OLAP + BasicReporting
& Querying
EnterpriseBI Analytics
tools
Web orSocial
Media Analytics
DataVisualization
DigitalDashboards
MasterData
Management
Big DataAnalytics
PredictiveAnalytics
MobileBusiness
Intelligence
Adoption of Optimization solutions by retailers, current use vs. plans for adoption in future
(Figures are percentage of total respondents)
0
20
40
60
80
100
52%48%
33%
13%
46% 37% 37%32%
22%
27%
28%
28%
15%
25%
20%
13%
22%
17%
37%
10%
27%
12%
29%
12%
MarketingSpend
Optimization
SpacePlanning
Optimization
LaborSchedulingOptimization
DistributionOptimization
PricingOptimization
AssortmentOptimization
ReplenishmentOptimization
InventoryOptimization
Currently use Implement in the next 12 months Implement in the next 12-24 months
Research Findings
EKN 22
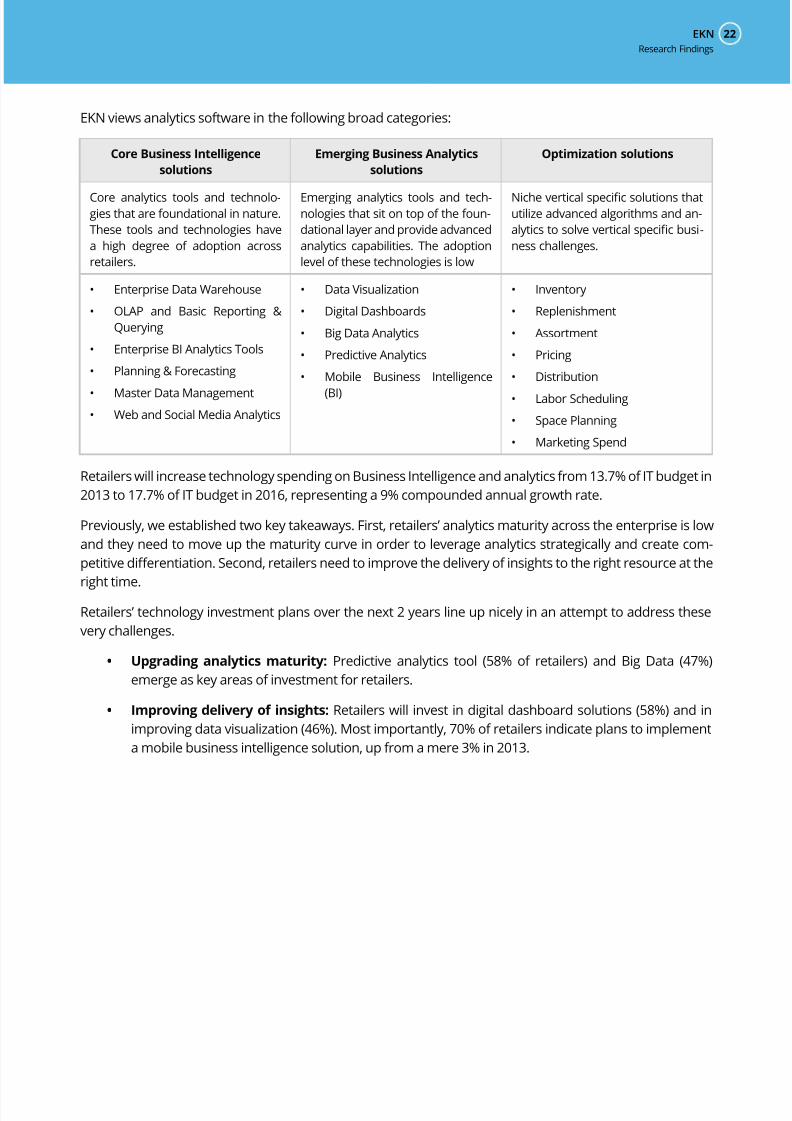
EKN views analytics software in the following broad categories:
Core Business Intelligence
solutions
Emerging Business Analytics
solutions
Optimization solutions
Core analytics tools and technolo-
gies that are foundational in nature.
These tools and technologies have
a high degree of adoption across
retailers.
Emerging analytics tools and tech-
nologies that sit on top of the foun-
dational layer and provide advanced
analytics capabilities. The adoption
level of these technologies is low
Niche vertical specic solutions that
utilize advanced algorithms and an-
alytics to solve vertical specic busi-
ness challenges.
• Enterprise Data Warehouse
• OLAP and Basic Reporting &
Querying
• Enterprise BI Analytics Tools
• Planning & Forecasting
• Master Data Management
• Web and Social Media Analytics
• Data Visualization
• Digital Dashboards
• Big Data Analytics
• Predictive Analytics
• Mobile Business Intelligence
(BI)
• Inventory
• Replenishment
• Assortment
• Pricing
• Distribution
• Labor Scheduling
• Space Planning
• Marketing Spend
Retailers will increase technology spending on Business Intelligence and analytics from 13.7% of IT budget in
2013 to 17.7% of IT budget in 2016, representing a 9% compounded annual growth rate.
Previously, we established two key takeaways. First, retailers’ analytics maturity across the enterprise is low
and they need to move up the maturity curve in order to leverage analytics strategically and create com-
petitive dierentiation. Second, retailers need to improve the delivery of insights to the right resource at the
right time.
Retailers’ technology investment plans over the next 2 years line up nicely in an attempt to address these
very challenges.
• Upgrading analytics maturity: Predictive analytics tool (58% of retailers) and Big Data (47%)
emerge as key areas of investment for retailers.
• Improving delivery of insights: Retailers will invest in digital dashboard solutions (58%) and in
improving data visualization (46%). Most importantly, 70% of retailers indicate plans to implement
a mobile business intelligence solution, up from a mere 3% in 2013.
Research Findings
State of the Industry Research Series: The Future of Retail Analytics23
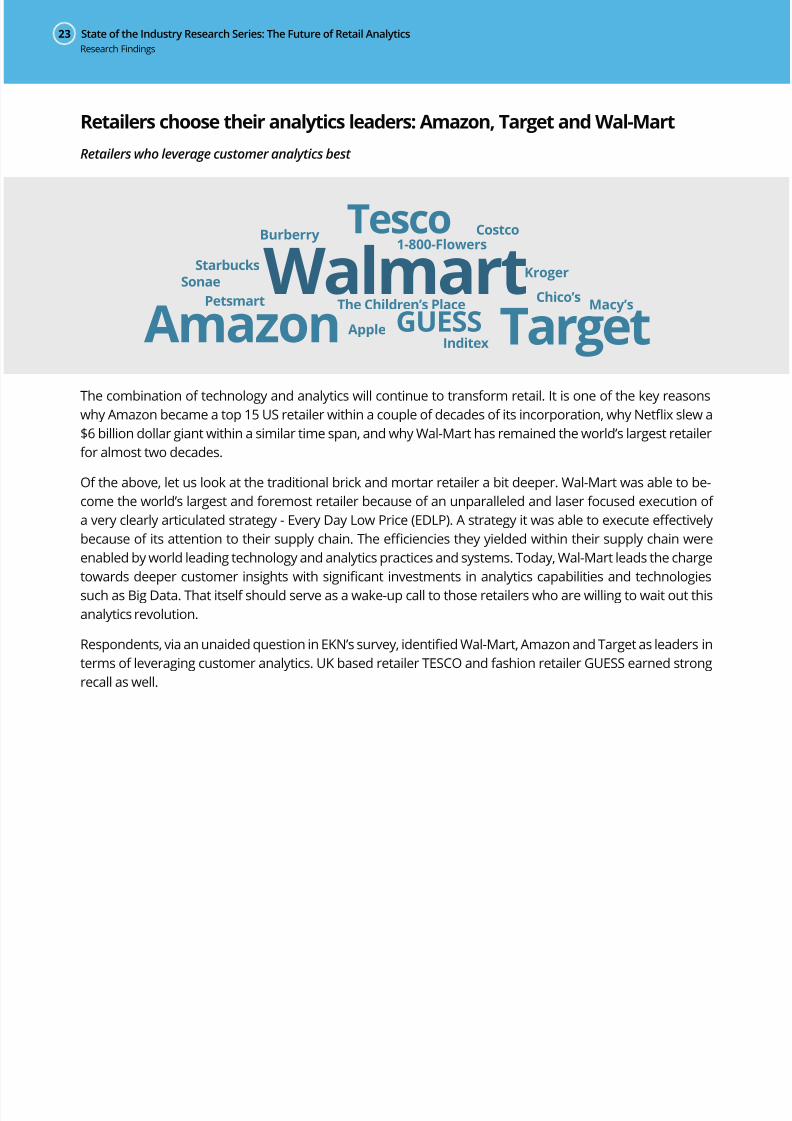
Retailers choose their analytics leaders: Amazon, Target and Wal-Mart
Retailers who leverage customer analytics best
WalmartAmazon Target
Tesco
GUESSChico’s
InditexApple
Costco
Petsmart
Burberry
Starbucks
The Children’s Place
Sonae
Macy’s
1-800-Flowers
Kroger
The combination of technology and analytics will continue to transform retail. It is one of the key reasons
why Amazon became a top 15 US retailer within a couple of decades of its incorporation, why Netix slew a
$6 billion dollar giant within a similar time span, and why Wal-Mart has remained the world’s largest retailer
for almost two decades.
Of the above, let us look at the traditional brick and mortar retailer a bit deeper. Wal-Mart was able to be-
come the world’s largest and foremost retailer because of an unparalleled and laser focused execution of
a very clearly articulated strategy - Every Day Low Price (EDLP). A strategy it was able to execute eectively
because of its attention to their supply chain. The eciencies they yielded within their supply chain were
enabled by world leading technology and analytics practices and systems. Today, Wal-Mart leads the charge
towards deeper customer insights with signicant investments in analytics capabilities and technologies
such as Big Data. That itself should serve as a wake-up call to those retailers who are willing to wait out this
analytics revolution.
Respondents, via an unaided question in EKN’s survey, identied Wal-Mart, Amazon and Target as leaders in
terms of leveraging customer analytics. UK based retailer TESCO and fashion retailer GUESS earned strong
recall as well.
Research Findings
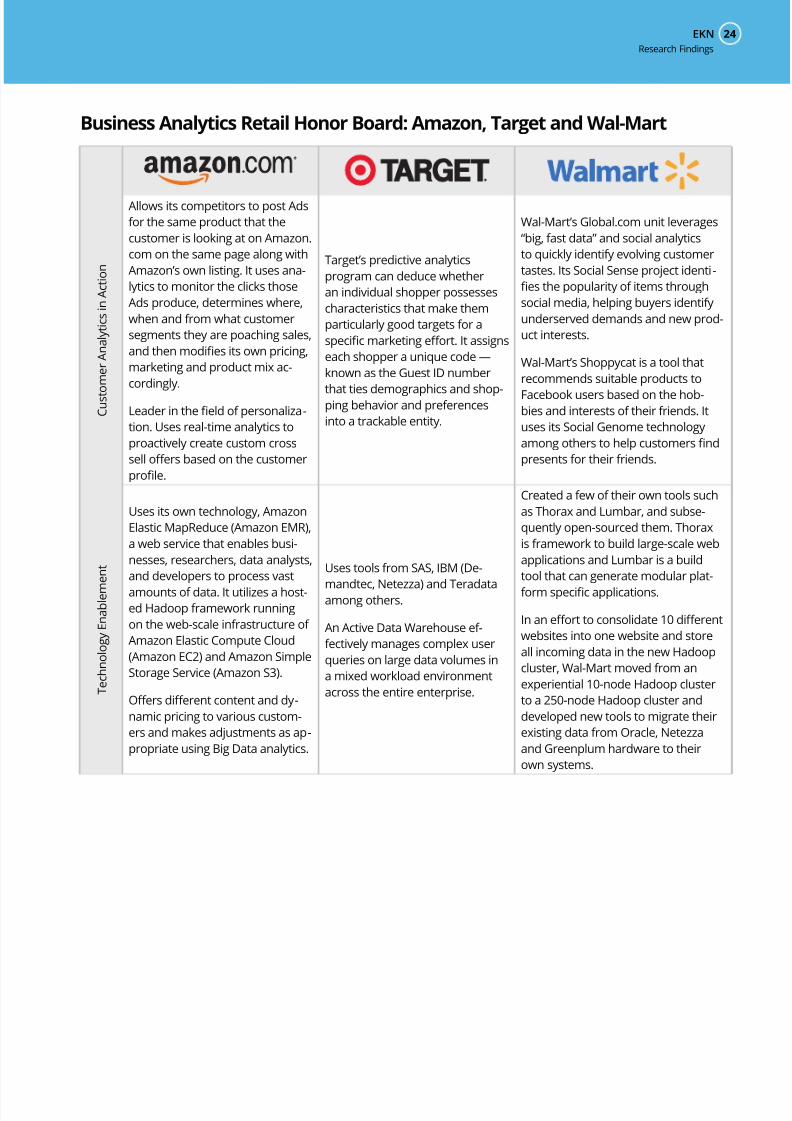
EKN 24
Business Analytics Retail Honor Board: Amazon, Target and Wal-Mart
C u s t o m e r A n a l y t i c s i n A c t i o n
Allows its competitors to post Ads
for the same product that the
customer is looking at on Amazon.
com on the same page along with
Amazon’s own listing. It uses ana-
lytics to monitor the clicks those
Ads produce, determines where,
when and from what customer
segments they are poaching sales,
and then modies its own pricing,
marketing and product mix ac-
cordingly.
Leader in the eld of personaliza-
tion. Uses real-time analytics to
proactively create custom cross
sell oers based on the customer
prole.
Target’s predictive analytics
program can deduce whether
an individual shopper possesses
characteristics that make them
particularly good targets for a
specic marketing eort. It assigns
each shopper a unique code —
known as the Guest ID number
that ties demographics and shop-
ping behavior and preferences
into a trackable entity.
Wal-Mart’s Global.com unit leverages
“big, fast data” and social analytics
to quickly identify evolving customer
tastes. Its Social Sense project identi-
es the popularity of items through
social media, helping buyers identify
underserved demands and new prod-
uct interests.
Wal-Mart’s Shoppycat is a tool that
recommends suitable products to
Facebook users based on the hob-
bies and interests of their friends. It
uses its Social Genome technology
among others to help customers nd
presents for their friends.
T e c h n o l o g y E n a b l e m e n t
Uses its own technology, Amazon
Elastic MapReduce (Amazon EMR),
a web service that enables busi-
nesses, researchers, data analysts,
and developers to process vast
amounts of data. It utilizes a host-
ed Hadoop framework running
on the web-scale infrastructure of
Amazon Elastic Compute Cloud
(Amazon EC2) and Amazon Simple
Storage Service (Amazon S3).
Oers dierent content and dy-
namic pricing to various custom-
ers and makes adjustments as ap-
propriate using Big Data analytics.
Uses tools from SAS, IBM (De-
mandtec, Netezza) and Teradata
among others.
An Active Data Warehouse ef-
fectively manages complex user
queries on large data volumes in
a mixed workload environment
across the entire enterprise.
Created a few of their own tools such
as Thorax and Lumbar, and subse-
quently open-sourced them. Thorax
is framework to build large-scale web
applications and Lumbar is a build
tool that can generate modular plat-
form specic applications.
In an eort to consolidate 10 dierent
websites into one website and store
all incoming data in the new Hadoop
cluster, Wal-Mart moved from an
experiential 10-node Hadoop cluster
to a 250-node Hadoop cluster and
developed new tools to migrate their
existing data from Oracle, Netezza
and Greenplum hardware to their
own systems.
Research Findings
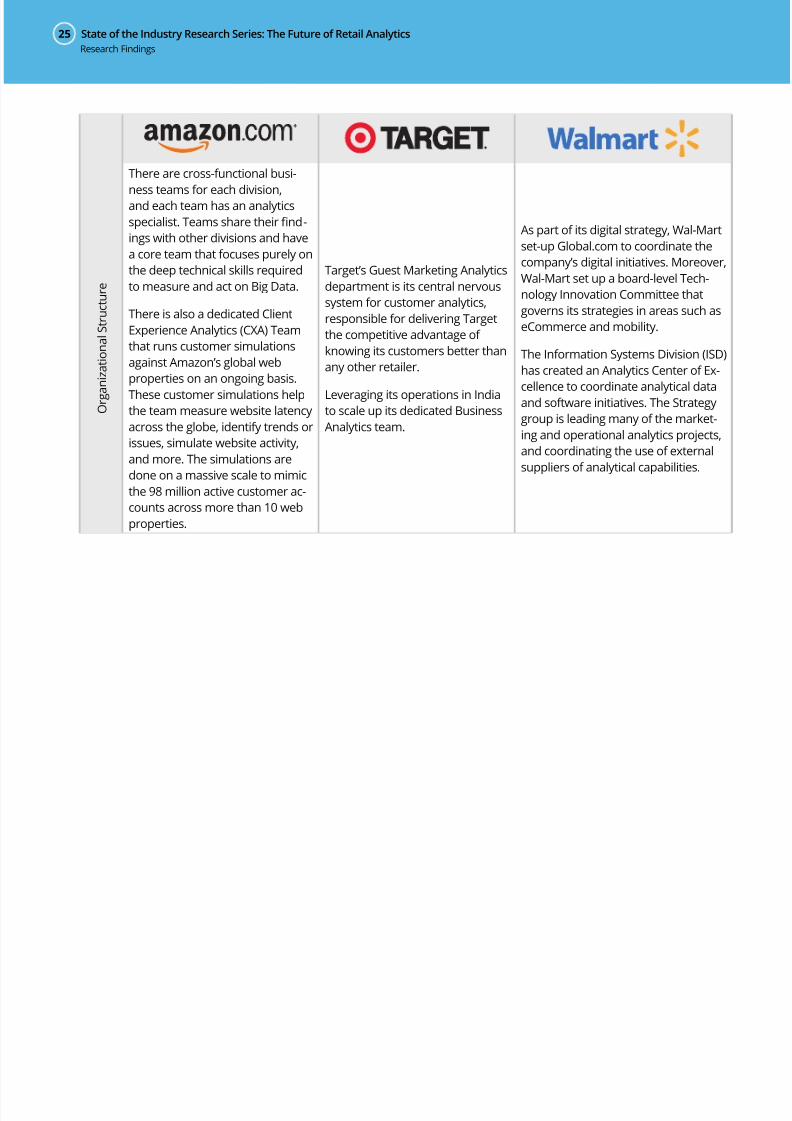
State of the Industry Research Series: The Future of Retail Analytics25
O r g a n i z a t i o n a l S t r u c t u r e
There are cross-functional busi-
ness teams for each division,
and each team has an analytics
specialist. Teams share their nd-
ings with other divisions and have
a core team that focuses purely on
the deep technical skills required
to measure and act on Big Data.
There is also a dedicated Client
Experience Analytics (CXA) Team
that runs customer simulations
against Amazon’s global web
properties on an ongoing basis.
These customer simulations help
the team measure website latency
across the globe, identify trends or
issues, simulate website activity,
and more. The simulations are
done on a massive scale to mimic
the 98 million active customer ac-
counts across more than 10 web
properties.
Target’s Guest Marketing Analytics
department is its central nervous
system for customer analytics,
responsible for delivering Target
the competitive advantage of
knowing its customers better than
any other retailer.
Leveraging its operations in India
to scale up its dedicated Business
Analytics team.
As part of its digital strategy, Wal-Mart
set-up Global.com to coordinate the
company’s digital initiatives. Moreover,
Wal-Mart set up a board-level Tech-
nology Innovation Committee that
governs its strategies in areas such as
eCommerce and mobility.
The Information Systems Division (ISD)
has created an Analytics Center of Ex-
cellence to coordinate analytical data
and software initiatives. The Strategy
group is leading many of the market-
ing and operational analytics projects,
and coordinating the use of external
suppliers of analytical capabilities.
Research Findings
EKN 26
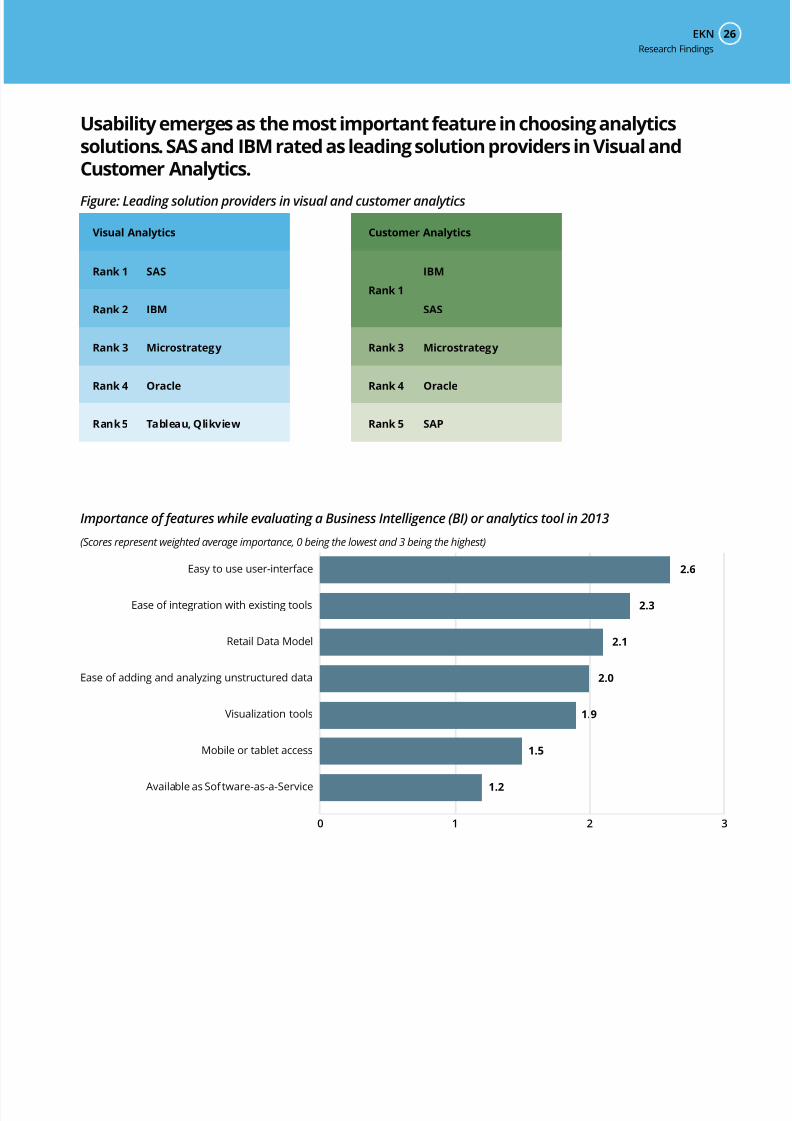
Usability emerges as the most important feature in choosing analyticssolutions. SAS and IBM rated as leading solution providers in Visual andCustomer Analytics.
Figure: Leading solution providers in visual and customer analytics
Visual Analytics
Rank 1 SAS
Rank 2 IBM
Rank 3 Microstrategy
Rank 4 Oracle
Rank 5 Tableau, Qlikview
Rank 1
IBM
SAS
Rank 3 Microstrategy
Rank 4 Oracle
Rank 5 SAP
Customer Analytics
Importance of features while evaluating a Business Intelligence (BI) or analytics tool in 2013
(Scores represent weighted average importance, 0 being the lowest and 3 being the highest)
Easy to use user-interface
Ease of integration with existing tools
Retail Data Model
Ease of adding and analyzing unstructured data
Visualization tools
Mobile or tablet access
Available as Software-as-a-Service
2.6
2.3
2.1
2.0
1.9
1.5
1.2
0 1 2 3
Research Findings
State of the Industry Research Series: The Future of Retail Analytics27
EKN’s survey asked retailers to choose the top 3 solution providers in two categories – Visual Analytics and
Customer Analytics. In both categories SAS and IBM ranked consistently as the top two providers, followed
by Microstrategy and Oracle. While SAP rounded out the top 5 in Customer Analytics, Qlikview and Tableau,
both relatively smaller providers, made the top 5 for Visual Analytics.
Tableau and Qlikview represent a newer breed of analytics solution providers, and their recognition in the
top 5 highlights the opportunity for smaller players to compete with the big boys in the analytics space.
The survey asked retailers what feature they would look for most in Business Intelligence or analytics tools
in 2013:
• An easy to use interface ranked the highest, with an overwhelming 95% rating it most important or
very important. This is where EKN nds some of the newer tools and solution providers to have an
advantage over enterprise grade solutions. Enterprise tools will need to invest in providing a simi-
larly user-friendly experience to maintain their leadership position. The availability of a visualization
tool as part of the solution was rated as very important by 78% of respondents.
• Retailers also rated a set of data operations related features as being important – ease of integra-
tion with existing tools, retail data model, and the ability to add and analyze unstructured data eas-
ily. The data integration and ability to add unstructured data speaks to retailers’ plans to integrate
a variety of data sources.
• Mobile or tablet access was rated as somewhat important or unimportant by 54% of respondents.
Given that the biggest challenge retailers face is delivery of insights, EKN expected mobile access to
rank higher.
• 25% of respondents rated availability of the solution as a Software-as-a-Service as unimportant,
and an additional 43% rate it somewhat important. EKN recommends providers with SaaS oerings
focus on describing the value of their oering as compared to alternatives, rather than on the value
of a cloud-based deployment model in and of itself.
Research Findings
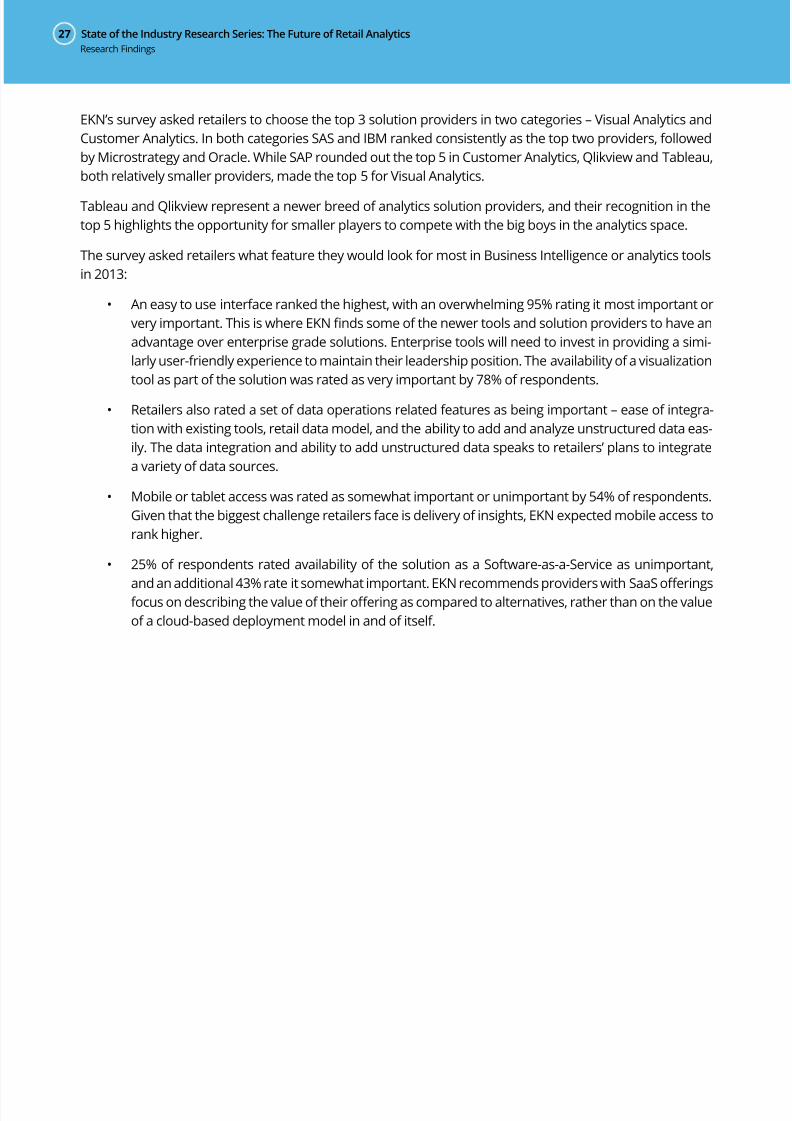
EKN 28
Omni-channel emerges as the business function with the highest potentialopportunity for analytics impact
Business functions which are leveraging analytics more strategically
(Scores represent weighted average ranking, 1 being the lowest and 5 being the highest)
Merchandising Marketing Supply Chain Customer Insights Multi-channel
1
2
3
4
5
3.6
3.1 3.12.9
2.4
Planned technology investments in analytics solutions in 2013, by business functions
(Scores represent weighted average ranking, 1 being the lowest and 5 being the highest)
1
2
3
4
5
3.23.1
3.02.9
2.8
Multi-channel Merchandising Marketing Customer Insights Supply Chain
Research Findings
State of the Industry Research Series: The Future of Retail Analytics29
Omni-channel retailing is the new normal of retail. With online and mobile sales growing faster than store
sales, consumer spending is shifting towards online or online-aided sales. Online, mobile and social chan-
nels also represent disciplines with the highest rate of growth of consumer-generated data.
Omni-channel analytics presents an opportunity for retailers to understand growing activity in this strategi-
cally important area of the business. They must do so by tapping into a growing mass of consumer data,
while at the same time integrating these relatively newer data sources with existing enterprise data.
No surprise then that Omni-channel ranks highest among business functions in terms of retailers’ planned
technology investments in analytics in 2013. Investments will focus on improving Omni-channel analytics
maturity, as among the various retail business functions, retailers rated it lowest in terms of leveraging
analytics strategically. 17% of respondents perform no analytics in the Omni-channel function, and a further
31% only conduct basic reporting.
Retailers need to move from eCommerce analytics to Omni-channel analytics, i.e. assessing the eective -
ness of channels in concert with each other rather than in silos, and identifying cross-channel, rather than
channel specic, consumer behavior trends and patterns.
In addition, at the lower end of the maturity spectrum retailers conduct basic operational analytics with goals
such as Search Engine Optimization (SEO). The future of Omni-channel analytics is in strategic and perfor-
mance metrics such as customer loyalty, customer value and channel performance.
Research Findings
EKN 30
Recommendations
= Short Term (0-6 months)
= Medium Term (6-12 months)
= Long Term (1-2 years)LT
ST
MT
State of the Industry Research Series: The Future of Retail Analytics31
Assess the maturity of your analytics capabilities across business func-tions. Benchmark yourself against the leaders
To improve analytics maturity retailers should start by benchmarking their current maturity against leading
retailers at an enterprise and functional level. This exercise will provide retailers the inputs they need to
build a customized development path towards higher analytics maturity.
This benchmarking should to be done across the following parameters (An excerpt from EKN’s Analytics
Maturity Assessment Framework)
• Analytics Strategy
• Data
• Software
• Structure
• Talent
• Algorithms
• Metrics
• Insights Delivery
And against the following groups
• Format based competitive Set
• Retail leaders (Wal-Mart, Target, Amazon, Netix, Tesco)
• Cross-industry leaders
Refer to EKN’s Analytics Maturity Assessment Framework (Appendix A) for a quick reference method for
retailers to benchmark where they stand. For detailed benchmarking and roadmap creation frameworks,
please contact EKN.
Usability, Big Data, Data Visualization and Data Management will drive thethe next analytics toolset.
The analytics toolset enabled by the Cloud and delivered as Software-as-a-Service will evolve at a brisk pace
and will be faster and cheaper than the current BI infrastructure retailers have in place. The improvement in
tools will outpace a retailer’s ability to take advantage of them.
EKN suggests retailers actively engage in exploring some of the newer technologies in order to provide the
right insights at the right time to their executives. EKN recommends focused proof of concepts that are quick
to execute.
A good place to start is Data Visualization software, which could work o your existing infrastructure; at a
higher level of maturity you should evaluate SaaS based Big Data tools. EKN recommends focused explora-
tory projects in the area of Omni-channel retail and customer insights.
For detailed use cases please refer to EKN’s State of the Industry Research on Big Data in Retail.
Recommendations
ST
ST
MT
EKN 32
A fundamental shift in organizational structure, skills and culture is re-quired. Retailers need to shed some of the art and embrace some of thescience.
Retailers will not be constrained in their ability to leverage analytics because of a lack of tools, budget or data.
Rather, it will be due to a siloed organizational structure and a lack of will to embrace a data driven culture.
• Executive Ownership: EKN believes it is a matter of time until retailers anoint a clear owner for
analytics and customer insights at the senior executive level (VP or C-Suite). Instituting such a posi-
tion is a step in the right direction for larger retailers looking to elevate the strategic importance
of analytics in their organizations. Smaller retailers should also dene the role, but may choose to
have an existing executive position take it on as additional responsibility. Irrespective of the title -
Chief Insights Ocer, EVP Insights, or Chief Analytics ocer - this executive needs to have oversight
of all tools, technologies and people related to analytics.
• Data Democratization: There needs to be a move away from the siloed, feudalistic model of ac-
cess to data, to a more democratic method. Access to most data (non-condential) along with basic
data analytics tools should be freely available to a larger cross-section of the enterprise, both in
terms of across functions and across designations. For retailers who already have a progressive
data access strategy, the next step should allow data and insights contribution. Collaboration best
practices have shown enterprise data is only made richer by allowing employees to contribute, and
customer insight should be no dierent. A further higher level of maturity would involve setting up
data-sharing and analytics sandboxes with key business partners, vendors, and even customers.
• Team Structure: EKN’s research shows that only 5% of retailers have their desired team structure
for analytics in place. Over the next few years retailers will evaluate dierent structures and models
to determine what works best for them. A few structures and models are described below.
° Department Centric: 71% of retailers currently have individual departments responsible for
their own analytics resources. This is an organic model where resources typically work with
someone in the IT team to get access to the data. An evolution of this model is when data is
freely available to individual departments and they use their own analytics tools. Consistent
with how the respondents in EKN’s survey voted, EKN views this structure as untenable in the
future state of retail analytics.
° IT Centric: 53% rely on the IT function primarily for analytics support. The genesis of this model
is easily understood - IT became a natural place for analytics given its access to the databases
and warehouses where data is stored, its familiarity with the tools that analyze the data, and
the analytical skills of its resource base. EKN sees this model evolving to a shared service model
led by a dedicated leader.
° Shared Service: 3 in 5 retailers EKN surveyed would like to move to a shared services model
for analytics, up from 1 in 5 today. This is a positive move forward and would enable retailers
to scale up their eorts in analytics. In EKN’s view the digital marketing and customer insights
departments would be amongst the rst to benet from such a setup.
Recommendations
State of the Industry Research Series: The Future of Retail Analytics33
° Hybrid: A Shared Service structure along with dedicated Centers of Excellence that have sub-
ject matter experts (SMEs) from key departments embedded in them. EKN views this as the
ideal structure for most retailers as incorporating domain-focused experience into the insights
generated and having tacit departmental buy-in provides them context-rich insight and the
ability to act quicker.
• Skills and roles
° Data Analyst: Base of the pyramid skill, required to give scale to the organization. This role
focuses a lot on the data preparation, execution of pre-determined analysis, basic reporting
and analytics. This role requires an undergraduate degree with a focus on math and analytics
(math, economics, operations, engineering).
° Statistician/Actuary: Higher up in the pyramid skill set that is focused on creating, running,
testing and rening advanced algorithms and models. This role should require a graduate level
degree.
° Data Scientist: An oft-quoted but ill-dened role. EKN views a data scientist as a seasoned
practitioner in the eld of business analytics who has a deep understanding and experience in
analytical techniques and their supporting technologies.
° Economist: A niche skill set that large retailers may tap into when trying to understand and
assess the impact of macroeconomic trends on their business.
° Social Scientist/Anthropologist: As customer insights become more important, and as
retailers try and enhance their ability to understand the social context and structure within
which a customer operates, EKN sees them leveraging this skill set either internally or exter-
nally as part of their analytics ecosystem.
• Training: Analytics training is needed across enterprise functions and levels. Without the right ana-
lytical resources and training, even the most advanced tools have no value. Invest in capability build-
ing across the board, from executive training to building a strong analytics team.
Retailers need to accelerate their eorts in analytics training; EKN recommends that a portion of
the HR Training budget be set aside for this from 2013 itself. An executive program needs to be put
together for the leadership team. The creation of an analytics services unit or Center Of Excellence
needs to be evaluated.
Recommendations
MT
EKN 34
Appendix A:EKN Analytics MaturityAssessment Framework(Excerpt)
EKN’s Analytics Maturity Assessment Framework, available to EKN Peer Forum subscribers, provides a tool
for retailers to assess their current state of analytics maturity and a roadmap to move to a higher level. Re-
tailers can get in touch with EKN for more information on the detailed framework
State of the Industry Research Series: The Future of Retail Analytics35
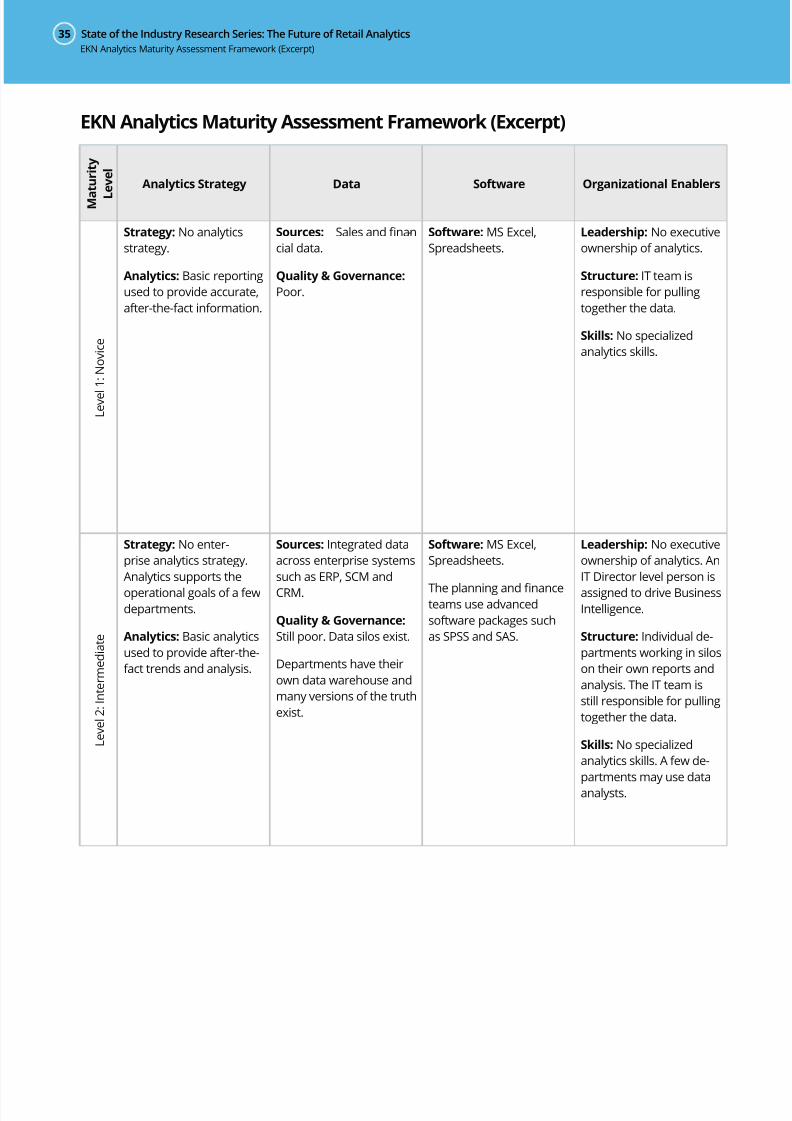
EKN Analytics Maturity Assessment Framework (Excerpt)
M a t u r i t y
L e v e l
Analytics Strategy Data Software Organizational Enablers
L e v e l 1 : N o v i c e
Strategy: No analytics
strategy.
Analytics: Basic reporting
used to provide accurate,
after-the-fact information.
Sources: Sales and nan-
cial data.
Quality & Governance:
Poor.
Software: MS Excel,
Spreadsheets.
Leadership: No executive
ownership of analytics.
Structure: IT team is
responsible for pulling
together the data.
Skills: No specialized
analytics skills.
L e v e l 2 : I n t e r m e d i a t e
Strategy: No enter-
prise analytics strategy.
Analytics supports the
operational goals of a few
departments.
Analytics: Basic analytics
used to provide after-the-
fact trends and analysis.
Sources: Integrated data
across enterprise systems
such as ERP, SCM and
CRM.
Quality & Governance:
Still poor. Data silos exist.
Departments have their
own data warehouse and
many versions of the truth
exist.
Software: MS Excel,
Spreadsheets.
The planning and nance
teams use advanced
software packages such
as SPSS and SAS.
Leadership: No executive
ownership of analytics. An
IT Director level person is
assigned to drive Business
Intelligence.
Structure: Individual de-
partments working in silos
on their own reports and
analysis. The IT team is
still responsible for pulling
together the data.
Skills: No specialized
analytics skills. A few de-
partments may use data
analysts.
EKN Analytics Maturity Assessment Framework (Excerpt)
EKN 36
M a t u r i t y
L e v e l
Analytics Strategy Data Software Organizational Enablers
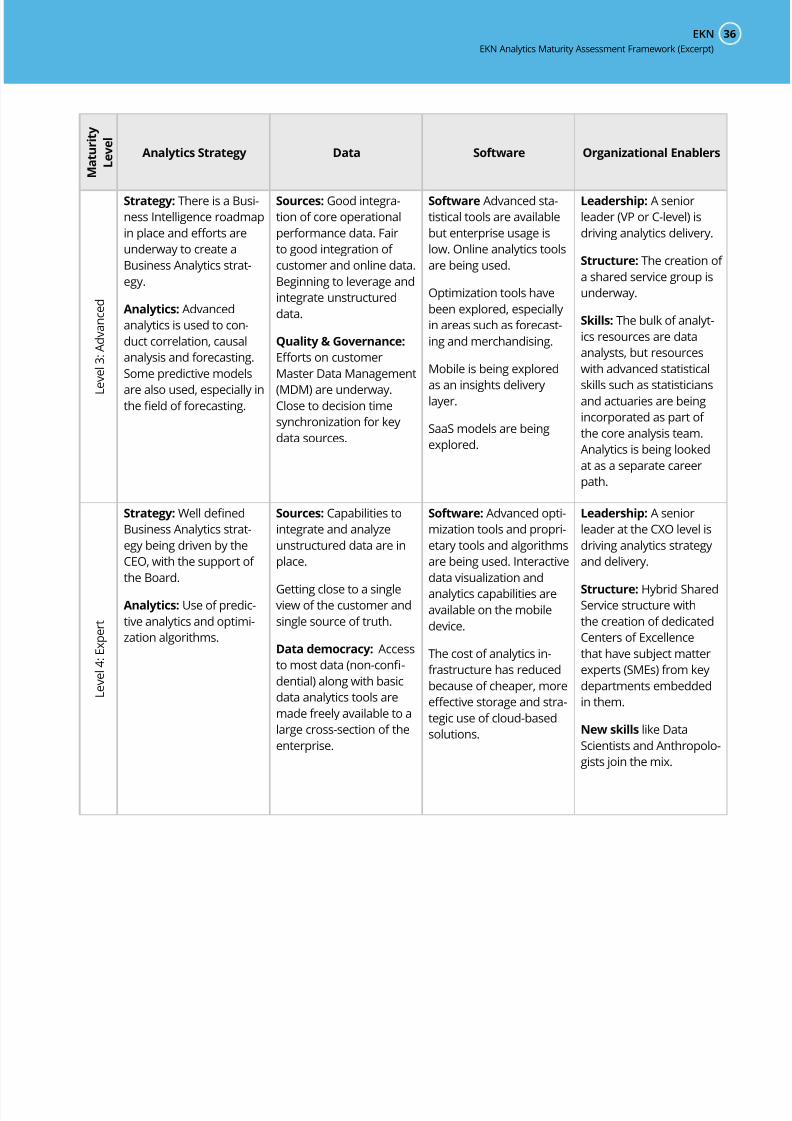
L e v e l 3 : A d v a n c e d
Strategy: There is a Busi-
ness Intelligence roadmap
in place and eorts are
underway to create a
Business Analytics strat-
egy.
Analytics: Advanced
analytics is used to con-
duct correlation, causal
analysis and forecasting.
Some predictive models
are also used, especially in
the eld of forecasting.
Sources: Good integra-
tion of core operational
performance data. Fair
to good integration of
customer and online data.
Beginning to leverage and
integrate unstructured
data.
Quality & Governance:
Eorts on customer
Master Data Management
(MDM) are underway.
Close to decision time
synchronization for key
data sources.
Software Advanced sta-
tistical tools are available
but enterprise usage is
low. Online analytics tools
are being used.
Optimization tools have
been explored, especially
in areas such as forecast-
ing and merchandising.
Mobile is being explored
as an insights delivery
layer.
SaaS models are being
explored.
Leadership: A senior
leader (VP or C-level) is
driving analytics delivery.
Structure: The creation of
a shared service group is
underway.
Skills: The bulk of analyt-
ics resources are data
analysts, but resources
with advanced statistical
skills such as statisticians
and actuaries are being
incorporated as part of
the core analysis team.
Analytics is being looked
at as a separate career
path.
L e v e l 4 : E x p e r t
Strategy: Well dened
Business Analytics strat-
egy being driven by the
CEO, with the support of
the Board.
Analytics: Use of predic-
tive analytics and optimi-
zation algorithms.
Sources: Capabilities to
integrate and analyze
unstructured data are in
place.
Getting close to a single
view of the customer and
single source of truth.
Data democracy: Access
to most data (non-con-
dential) along with basic
data analytics tools are
made freely available to a
large cross-section of the
enterprise.
Software: Advanced opti-
mization tools and propri-
etary tools and algorithms
are being used. Interactive
data visualization and
analytics capabilities are
available on the mobile
device.
The cost of analytics in-
frastructure has reduced
because of cheaper, more
eective storage and stra-
tegic use of cloud-based
solutions.
Leadership: A senior
leader at the CXO level is
driving analytics strategy
and delivery.
Structure: Hybrid Shared
Service structure with
the creation of dedicated
Centers of Excellence
that have subject matter
experts (SMEs) from key
departments embedded
in them.
New skills like Data
Scientists and Anthropolo-
gists join the mix.
EKN Analytics Maturity Assessment Framework (Excerpt)
State of the Industry Research Series: The Future of Retail Analytics37
Retail AnalyticsVendor Landscape
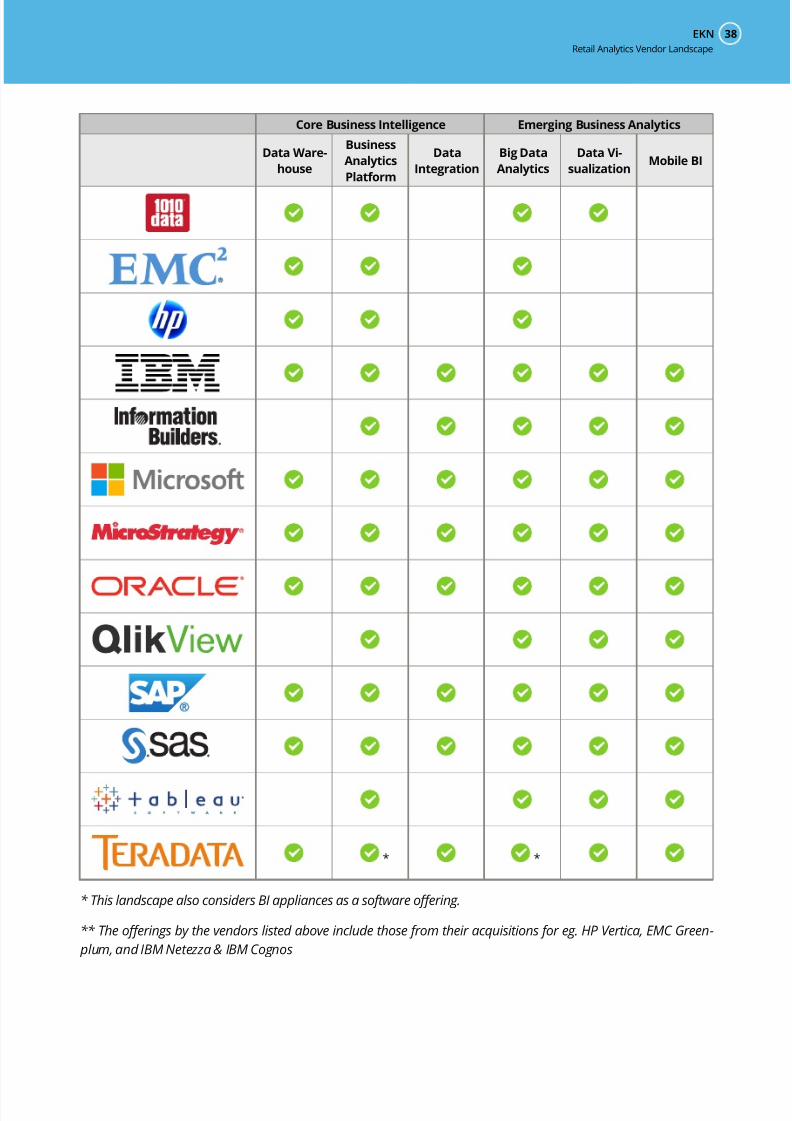
EKN 38
Core Business Intelligence Emerging Business Analytics
Data Ware-
house
Business
Analytics
Platform
Data
Integration
Big Data
Analytics
Data Vi-
sualizationMobile BI
* *
* This landscape also considers BI appliances as a software oering.
** The oerings by the vendors listed above include those from their acquisitions for eg. HP Vertica, EMC Green-
plum, and IBM Netezza & IBM Cognos
Retail Analytics Vendor Landscape
Premier Sponsor
About SASIn retail, where companies can go quickly from rags to riches – or riches to rags – the customer’s perception
of, and experience with, your brand is critical not only to staying in business, but growing your business as
well. SAS enables retailers across all segments – apparel, grocery, specialty, general merchandise, online and
hardlines – to uncover in-depth customer insights that you can use to delight customers by engaging them
in protable ways. With high-performance analytics at the core and backed by more than three decades of
retail experience, SAS solutions for retail enable you to nd new and better ways of doing business.
www.sas.com/retail
About EKN
Our research agenda is developed using inputs from the end user community and the end user community exten-
sively reviews the research before it is published. This ensures that we inject a healthy dose of pragmatism into the
research and recommendations. This includes input of what research topics to pursue, incorporating heavy practi-
tioner input – via interviews etc., and ensuring that the bend of research takeaways are oriented towards a real-world,
practical application of insights with community sign-o.
For more information, visit www.eknresearch.com
Email us at [email protected]
Copyright © 2013 EKN
Registered Oce: 4 Middlebury Blvd. Randolph, NJ 07869
Ph: (973) 607 1300
EKN is part of the Edgell Family
®
Disclaimer:
EKN does not make any warranties, express or implied, including, without limitation, those of merchantability and t-
ness for a particular purpose. The information and opinions in research reports constitute judgments as at the date
indicated and are subject to change without notice. The information provided is not intended as nancial or invest-
ment advice and should not be relied upon as such. The information is not a substitute for independent professional
advice before making any investment decisions.


![[Webinar] High Speed Retail Analytics](https://img.pdfslide.net/doc/110x75/55563360d8b42a5b528b50cb/webinar-high-speed-retail-analytics.jpg)