Embed Size (px)
Citation preview
8/6/2019 Retail Service Quality Scale Examining Applicability in a Transition Economy
http://slidepdf.com/reader/full/retail-service-quality-scale-examining-applicability-in-a-transition-economy 1/32
008-0148
Retail Service Quality Scale: Examining Applicability in a Transition Economy
Dr. Anupam Das
Bang College of Business
Kazakhstan Institute of Management, Economics, and Strategic Research (KIMEP)
2 Abai ave., Almaty 050010, Kazakhstan
Phone: +7 727 2704440 ext. 2161
E-mail: [email protected]
Dr. Gour C. Saha
Pearl School of Business
46, Institutional Area, Sector 32, Gurgaon - 122001, Haryana, India
Phone: +91 124 421-7517
E-mail: [email protected]
Nanda L. Banik
Department of Management in Business Administration
St. Theresa Inti College
1 Moo 6, Rangsit-Nakornnayok Road, Klong 14, Ongkarak, Thailand
Phone: +66 02 233 2455, 02 233 1506
E-mail: [email protected]
POMS 19th Annual Conference
La Jolla, California, U.S.A.
May 9 to May 12, 2008
8/6/2019 Retail Service Quality Scale Examining Applicability in a Transition Economy
http://slidepdf.com/reader/full/retail-service-quality-scale-examining-applicability-in-a-transition-economy 2/32
2
ABSTRACT
With the emergence of Western-style retailing in the Commonwealth of Independent States
(CIS), retail market structure has observed a significant change. Both the evolving demand of
customers and the intensified competition among the domestic and foreign companies have
created a pressure for the need of innovation of goods and services in the emerging market.
Measuring service quality has thus come in a way to examine the areas in which one has to
improve and compete successfully. This study evaluates applicability of a widely accepted
scale, Retail Service Quality Scale (RSQS) in Kazakhstan, a CIS country. Confirmatory factor
analyses of the component structures indicate good fit of the RSQS dimensions and the items.
The scale has the diagnostics ability to identify areas requiring strategic focus. Retailer of CIS
countries would be able to measure their service quality and identify areas for improvement.
Track: Service Operations
Keywords: Service Quality, Commonwealth of Independent States (CIS), Transition
Economy, Kazakhstan, Retail Service Quality Scale, Scale Validation, Component Structures.

8/6/2019 Retail Service Quality Scale Examining Applicability in a Transition Economy
http://slidepdf.com/reader/full/retail-service-quality-scale-examining-applicability-in-a-transition-economy 3/32
3
INTRODUCTION
Service quality is one of the most highly discussed and debated concept in the research
literature because of the difficulties in both defining it and measuring it with no overall
consensus emerging on either (Wisniewski, 2001; Schneider and White, 2004). The most
commonly used definition of service quality is the extent to which a service meets customers’
needs or expectations and it involves a comparison of customer expectations with customer
perceptions of actual service performance (Parasuraman et al., 1985, 1988; Lewis and
Mitchell, 1990). Companies need to provide services with such a quality that meet or exceed
customer expectations. Customers, satisfied with service quality are most likely to remain
loyal (Wong and Sohal, 2003). Service quality is considered as a vehicle to increase value for
the consumer and ensure consumer satisfaction (Sivadas and Baker-Prewitt, 2000). It also
helps positioning in a competitive environment (Mehta et al., 2000); and retention and
patronage (Yavas, et al., 1997). The same situation is also true for the customers of transition
economies. The countries in Commonwealth of Independent Countries (CIS) have moved or
are moving from a ‘command’ to a ‘market’ economy. The service sector in transition
economies was neglected during the Soviet era and has been growing rapidly from a low base.
One such economy is the former Soviet Republic of Kazakhstan, which has tremendous
economic growth since its independence in 1991 and many service providers from abroad
have entered or are entering to tap the increased disposable income of people (Low and
Freeman, 2007). Retail service is such a sector in Kazakhstan where many foreign companies
are already competing to acquire and retain higher market share. To satisfy the increasing
demand of the customers in Kazakhstan and in other transition economies, retailers need to
measure their service quality and identify appropriate areas for improvement. For measuring
retail service quality there are some scales available in the literature and Retail Service
Quality Scale (RSQS), developed by Dabholkar et al., (1996) is one of them which was tested
8/6/2019 Retail Service Quality Scale Examining Applicability in a Transition Economy
http://slidepdf.com/reader/full/retail-service-quality-scale-examining-applicability-in-a-transition-economy 4/32
4
in many developed and developing countries and found applicable in most of the countries.
However none of scales were tested in the context of a transitional economy. This research
evaluates the applicability of the RSQS scale for measuring retail service quality in the
context of department stores, discount stores and supermarkets in Kazakhstan. This research
measures the validity and reliability of the RSQS scale and finds it applicable in the context of
Kazakhstan and other transition economies.
THE RETAIL INDUSTRY IN KAZAKHSTAN AND OTHER CIS COUNTRIES
Kazakhstan is one of the Commonwealth of Independent States (CIS), a grouping of
independent states formerly part of Soviet Union (USSR), and is comprised of Armenia,
Azerbaijan, Belarus, Kazakhstan, Kyrgyzstan, Moldova, Republic of Georgia, Russian
Federation, Tajikistan, Turkmenistan, Ukraine, and Uzbekistan. Kazakhstan, located in
Central Asia, is the world’s ninth largest country with an area approximately 28 percent the
size of the USA but with only slightly more than 5 percent of the population (estimated in
July 2007 at 15,284,929 (CIA Factbook, February 2008). Kazakhstan's economy is larger than
those of all the other Central Asian states combined, largely due to the country's vast natural
resources and a recent history of political stability. As a contribution of its booming energy
sector, economic reform, good harvests, substantial shifting of assets into the private sector
and foreign investment, Kazakhstan enjoyed double-digit growth in 2000-01 and 8% or more
per year in 2002-07. Aided by strong growth and foreign exchange earnings, Kazakhstan
aspires to become a regional financial center and has created a banking system comparable to
those in Central Europe (CIA Factbook, February 2008). The increasing average income of
more than USD 11,000 per year, highest in CIS countries after Russia and increased
disposable income of citizens attracted foreign companies to sell their goods and services in
Kazakhstan. A number of departmental stores and discount stores have been opened as joint
8/6/2019 Retail Service Quality Scale Examining Applicability in a Transition Economy
http://slidepdf.com/reader/full/retail-service-quality-scale-examining-applicability-in-a-transition-economy 5/32
5
ventures/subsidiary between local investors and foreign retail chains named: Turkey’s
Migros, France’s Intergros, Germany’s Metro Cash & Carry. Other retain chains like Wal-
Mart, Kmart, Tesco are eying the opportunity to expand their business in Kazakhstan and in
other CIS countries. The retailing outlets in Kazakhstan and in other CIS countries can be
broadly structured as follows (Robinson, 1998).
Department stores: The concept of a department store is relatively new in this part of the
world. However due to the increased disposable income of people, department stores are
being popular to the people in these countries. Some of the retail grocery chains, named:
Ramstore, Gros, Interfood, City Center, City Plus, Skif, Cash & Carry, Smak, are some of the
most popular department stores in Kazakhstan. Most of the department stores are the joint
ventures of the Turkesh, British, European or American retailers. The sales volume in these
retail chains is about 25-30% of total retail market in Kazakhstan.
Kiosks: The kiosk is very much a part of the former Soviet retailing scene and they are to be
found everywhere in city centers and the suburbs as single kiosks, kiosks around open air
markets and whole streets of kiosks. The kiosks are privately owned and managed mostly by
the members of the family.
Street traders and markets: Besides the department stores and kiosks, formal markets do
exist to some extent and small markets exist around bus stations and at suburban road
junctions with the attendant kiosks and individual street traders. These street traders and
markets sell almost all merchandise according the demand of their customers.
8/6/2019 Retail Service Quality Scale Examining Applicability in a Transition Economy
http://slidepdf.com/reader/full/retail-service-quality-scale-examining-applicability-in-a-transition-economy 6/32
6
MEASURES OF SERVICE QUALITY
Measuring service quality is difficult due to its unique characteristics: Intangibility,
heterogeneity, inseparability and perishability (Bateson, 1995). Service quality is linked to the
concepts of perceptions and expectations (Parasuraman et al., 1985, 1988; Lewis and
Mitchell, 1990). Customers’ perceptions of service quality result from a comparison of their
before-service expectations with their actual-service experience. The service will be
considered excellent, if perceptions exceed expectations; it will be regarded as good or
adequate, if it only equals the expectations; the service will be classed as bad, poor or
deficient, if it does not meet them (Vázquez et al., 2001).
Based on this perspective, Parasuraman et al. (1988, 1991) developed a scale for measuring
service quality, which is mostly popular as SERVQUAL. This scale operationalizes service
quality by calculating the difference between expectations and perceptions, evaluating both in
relation to the 22 items that represent five service quality dimensions known as ‘tangibles’,
‘reliability’, ‘responsiveness’, ‘assurance’ and ‘empathy’. The SERVQUAL scale has been
tested and/or adapted in a great number of studies conducted in various service settings,
cultural contexts and geographic locations like the quality of service offered by a hospital
(Babakus and Mangold, 1989), a CPA firm (Bojanic, 1991), a dental school patient clinic,
business school placement center, tire store, and acute care hospital (Carman, 1990), pest
control, dry cleaning, and fast food (Cronin and Taylor, 1992), banking (Cronin and Taylor,
1992; Spreng and Singh, 1993; Sharma and Mehta, 2004) and discount and departmental
stores (Finn and Lamb, 1991; Teas, 1993; Dabholkar et al., 1996, Mehta et al., 2000, Vázquez
et al., 2001; Kim and Byoungho 2002). All these studies do not support the factor structure
proposed by Parasuraman et al. (1988). The universality of the scale and its dimensions has
also been the subject of criticisms (Lapierre et al., 1996) and it is suggested that they require
8/6/2019 Retail Service Quality Scale Examining Applicability in a Transition Economy
http://slidepdf.com/reader/full/retail-service-quality-scale-examining-applicability-in-a-transition-economy 7/32
8/6/2019 Retail Service Quality Scale Examining Applicability in a Transition Economy
http://slidepdf.com/reader/full/retail-service-quality-scale-examining-applicability-in-a-transition-economy 8/32
8
‘doing it right’; and the sub-dimensions of the basic dimension ‘personal interaction’ are:
‘inspiring confidence’ and ‘courteousness/helpful’. Three SERVQUAL tangible items are
used for measures of appearance.
Studies assessing the applicability of the RSQS have reported encouraging results. Dabholkar
et al. (1996) replicated their own study and found all the RSQS dimensions and sub-
dimensions to be valid in the U.S. Mehta et al. (2000) found the RSQS scale was superior
within the context of a ‘more goods and less services’ environment, i.e. a supermarket, while
SERVPERF was better for a retailing context where the service element becomes more
important, i.e. an electronic goods retailer. Kim and Jin (2002) report the RSQS a useful scale
for measuring service quality of discount stores across two different cultural contexts of U.S.
and South Korea, though they did not find distinct personal interaction and problem solving
dimensions or support for a distinct policy dimension. Boshoff and Terblanche (1997), in a
replication of the Dabholkar et al., (1996) study, report highly encouraging results for the
RSQS applicability in the context of department stores, specialty stores and hypermarkets in
South Africa. However, the applicability of the RSQS or other scales has never been tested in
the context of transition economies.
CONTEXT OF THIS STUDY
The retail sector in transition economies is experiencing a phenomenal growth comparing to
other sectors. As the numbers of retail outlets are increasing, customers’ expectations of
service quality are growing. So it is necessary to identify or develop a reliable and valid scale
to measure the retail service quality for the transition economies so that the retail service
providers can assess their level of service quality and identify the quality gaps for
improvements. This study tests the applicability of the RSQS in the context of Kazakhstan
8/6/2019 Retail Service Quality Scale Examining Applicability in a Transition Economy
http://slidepdf.com/reader/full/retail-service-quality-scale-examining-applicability-in-a-transition-economy 9/32
9
where large format retail stores were introduced and consequently has a greater degree of
stability in consumer expectations as compared to other CIS countries (Verme, 2006).
RESEARCH OBJECTIVES
The dimensions of service performance assessment are the outcome of research using factor
analysis (Finn, 2004). Initially, exploratory factor analysis (EFA) (e.g., Parasuraman et al.,
1988) has been used to identify the constructs. As many contributions to the service quality
literature using EFA have not recognized the problematic nature of its use, Some more recent
research has taken a more conceptually driven approach to the issue of dimensionality, and
used CFA to test as a priori specified factor structure, or even to compare the fit of first and
higher order factor models (e.g., Dabholkar et al., 1996; Brady and Cronin, 2001) (Finn,
2004). Assessing a service quality scale requires examining the model component structure
comprising the associations between overall service quality, the dimensions and the
subdimensions. The RSQS, a hierarchical model (Figure 1) proposed by Dabholkar et al.,
(1996) will be applicable in the Kazakhstan context if the dimensions and sub-dimensions are
reliable and valid in measuring retail service quality.
The objective of this research is to assess the applicability of the RSQS for measuring service
quality in Kazakhstan. This is achieved by examining the reliability, validity and component
structures of the RSQS. To assess the applicability of the RSQS both exploratory Factor
Analysis (EFA) and Confirmatory Factor Analyses (CFA) have been used. As the RSQS is a
third order factor model, the model has been tested in three stages – a test of the five basic
dimensions, a test of the second order factor, and the test of the subdimensions (Dabholkar et
al., 1996). These tests would reveal whether the RSQS structure was supported in part or
8/6/2019 Retail Service Quality Scale Examining Applicability in a Transition Economy
http://slidepdf.com/reader/full/retail-service-quality-scale-examining-applicability-in-a-transition-economy 10/32
10
whole in the context of Kazakhstan. The following four component structure models are
tested using CFA:
Model I (five basic dimensions of retail service quality as first-order factors): This model tests
whether the five basic dimensions namely ‘physical aspects’, ‘reliability’, ‘personal
interaction’, ‘problem solving’, and ‘policy’ are well supported as the descriptors of retail
service quality (Figure 2). At this stage the subdimensions are not tested. If an assessment of
this model yields positive results, then retailers in Kazakhstan and in other transition
economies can apply the same five dimensions to define strategic service focus areas.
Model II (retail service quality as a second-order factor of the five basic dimensions): This is
the basic retail service quality model which has resulted in RSQS being labeled as a five-
dimension scale (Figure 3). In this model the service quality construct is a second order factor
which comprises the five basic dimensions as first-order factors. If this model is supported,
one can conclude that customers in Kazakhstan and in other transition economies evaluate
retail service quality on the five basic dimensions but they also view overall retail service
quality as a higher order factor that captures a meaning common to all the dimensions.
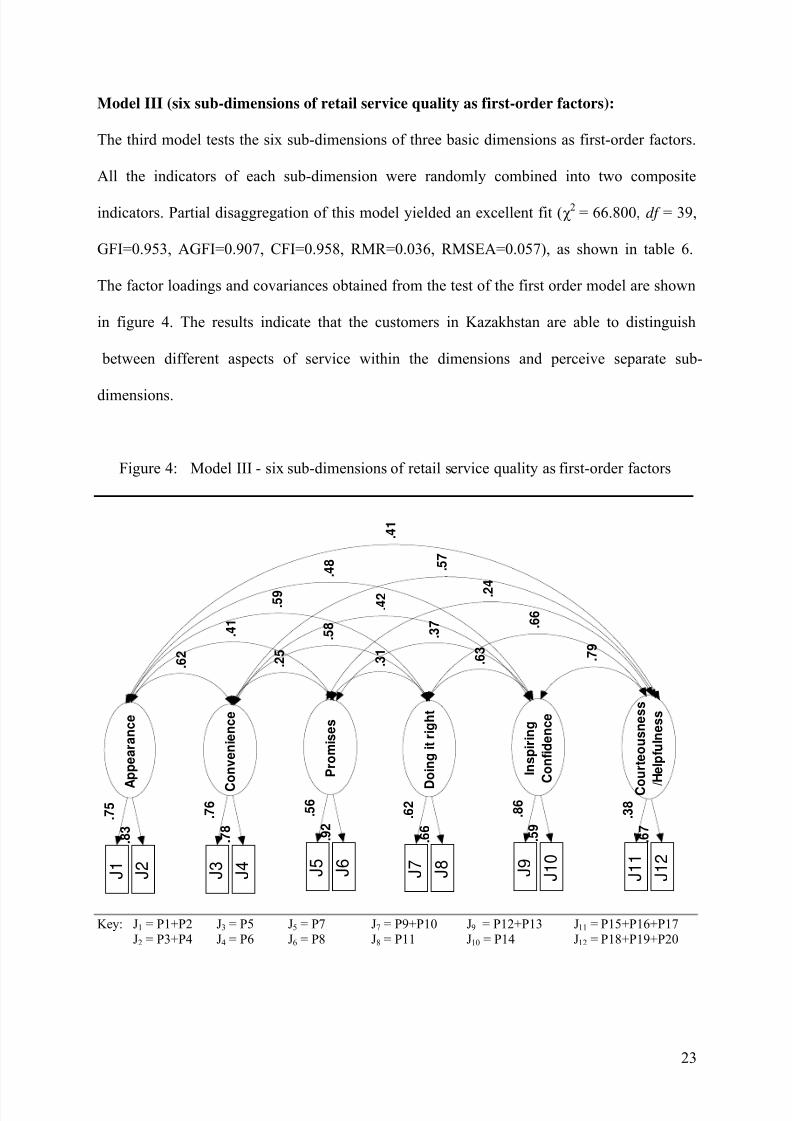
Model III (six sub-dimensions of retail service quality as first-order factors): The third model
tests the six sub-dimensions/first-order factors of three basic dimensions (Figure 4). This
model would examine if the shopper in Kazakhstan and in other transition economies is able
to distinguish between different aspects of service within the dimensions and perceives
separate sub-dimensions. If this is true, retailers will be able to better focus on specific service
aspects for ensuring and monitoring improvement in quality.
8/6/2019 Retail Service Quality Scale Examining Applicability in a Transition Economy
http://slidepdf.com/reader/full/retail-service-quality-scale-examining-applicability-in-a-transition-economy 11/32
11
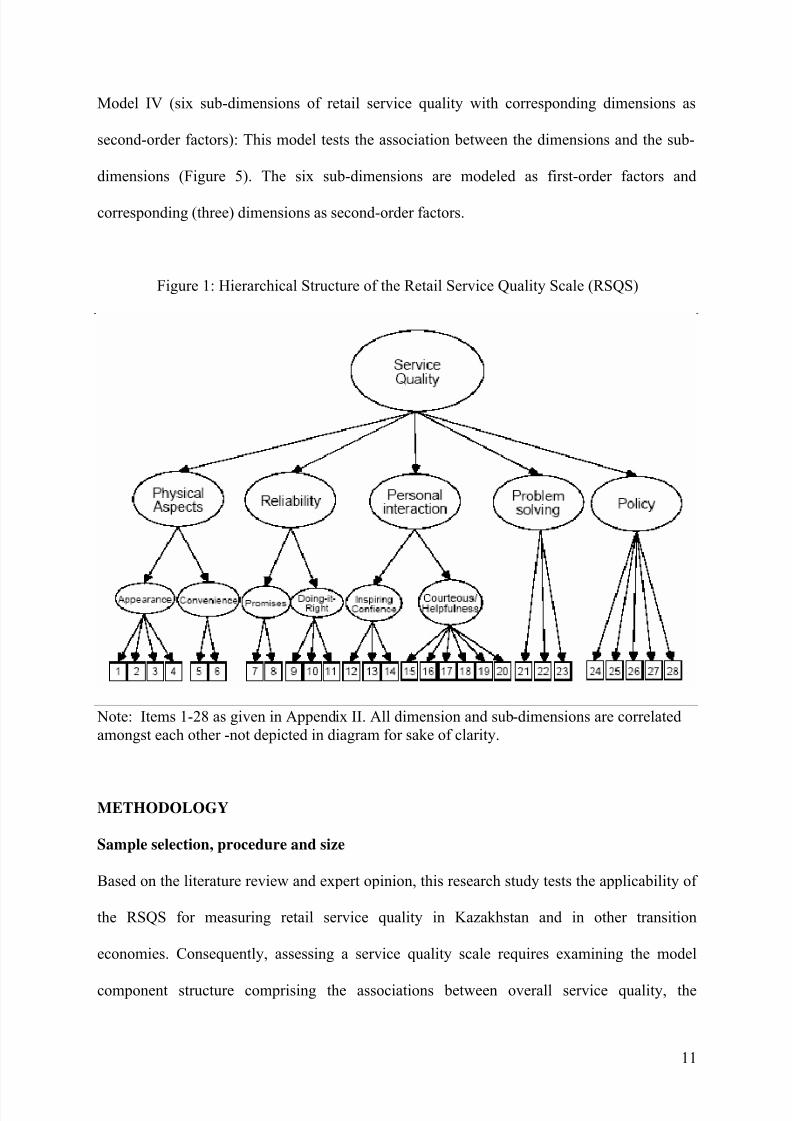
Model IV (six sub-dimensions of retail service quality with corresponding dimensions as
second-order factors): This model tests the association between the dimensions and the sub-
dimensions (Figure 5). The six sub-dimensions are modeled as first-order factors and
corresponding (three) dimensions as second-order factors.
Figure 1: Hierarchical Structure of the Retail Service Quality Scale (RSQS)
Note: Items 1-28 as given in Appendix II. All dimension and sub-dimensions are correlated
amongst each other -not depicted in diagram for sake of clarity.
METHODOLOGY
Sample selection, procedure and size
Based on the literature review and expert opinion, this research study tests the applicability of
the RSQS for measuring retail service quality in Kazakhstan and in other transition
economies. Consequently, assessing a service quality scale requires examining the model
component structure comprising the associations between overall service quality, the
8/6/2019 Retail Service Quality Scale Examining Applicability in a Transition Economy
http://slidepdf.com/reader/full/retail-service-quality-scale-examining-applicability-in-a-transition-economy 12/32
8/6/2019 Retail Service Quality Scale Examining Applicability in a Transition Economy
http://slidepdf.com/reader/full/retail-service-quality-scale-examining-applicability-in-a-transition-economy 13/32
13
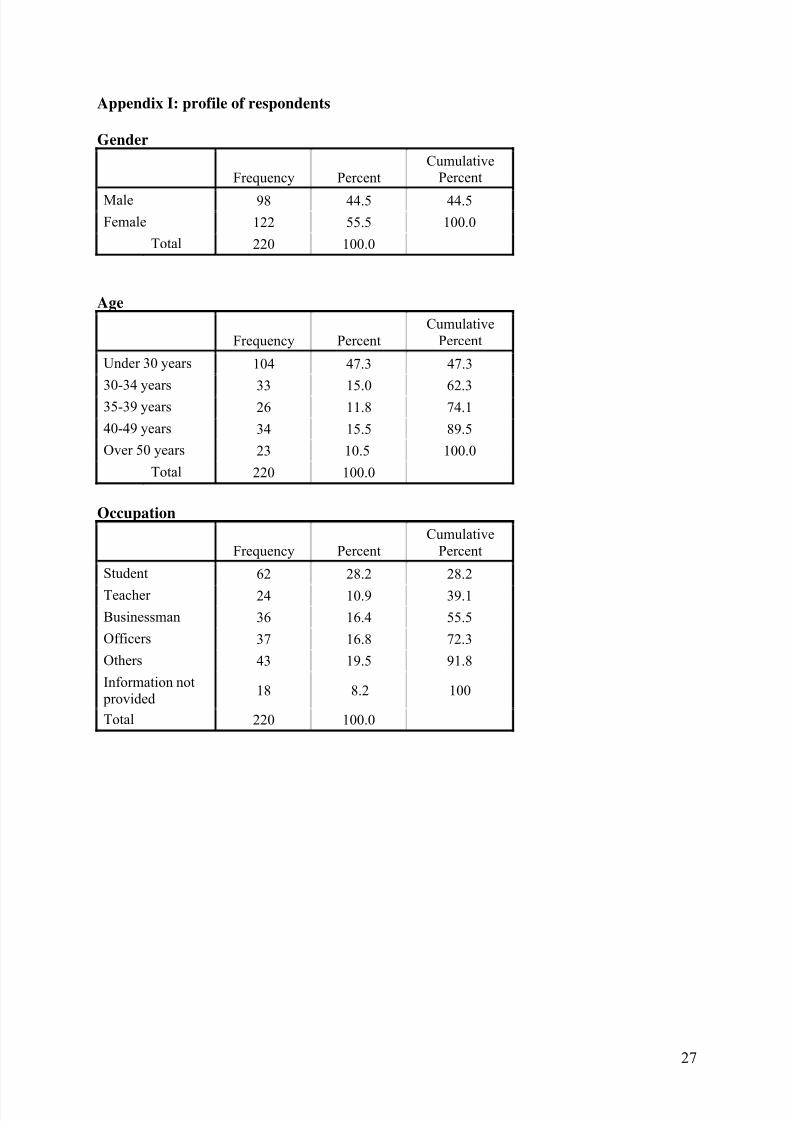
Assistants. The sample consisted of total 220 respondents was obtained. The profile of these
respondents is given in Appendix I.
Instrument
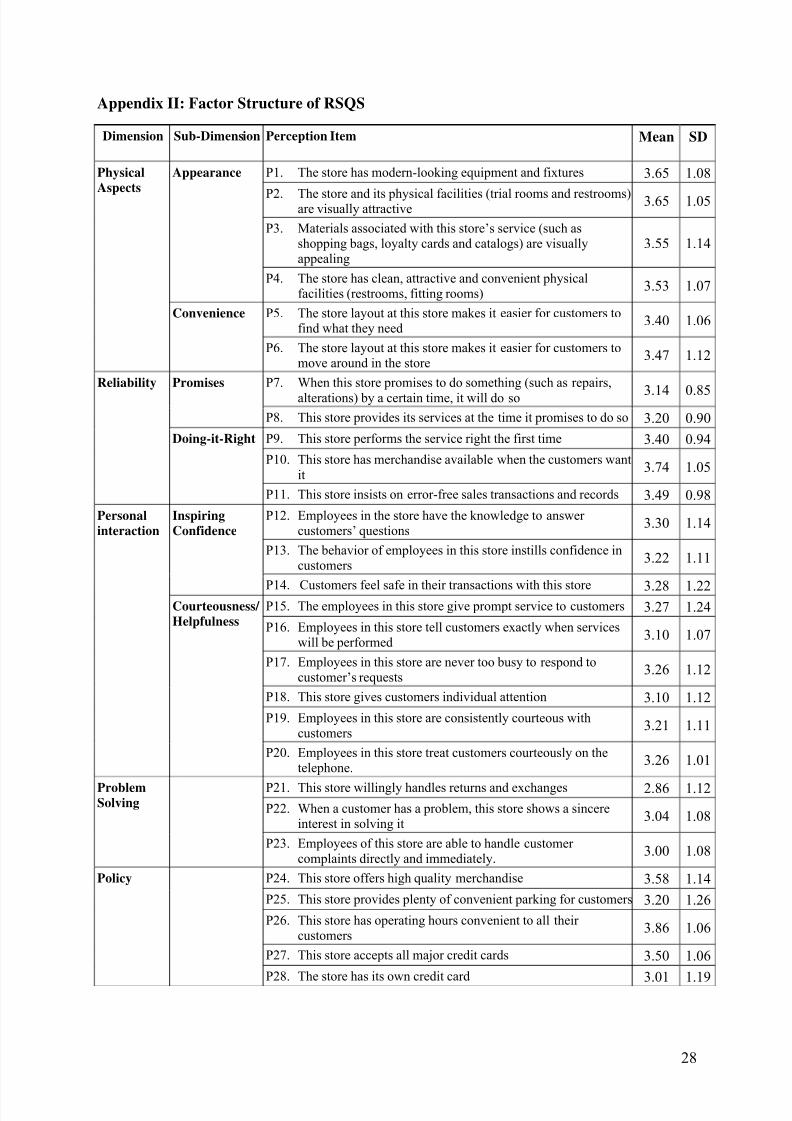
This research used similar procedure as Dabholkar et al., (1996) for examining face validity
of the items of RSQS. Opinion from three experts, an independent expert with extensive
academic and consulting experience in retailing; one retailer; and one senior executive of a
consumer goods manufacturer in Kazakhstan has been taken on the RSQS. Based on their
opinion some changes were made in wording of the instrument. All of the experts and the
researchers have agreed on the 28 items of RSQS (Appendix II). The questionnaire was
developed in English. As the questionnaire survey was targeted at the retail customers of
Kazakhstan and all people of Kazakhstan can speak, read or write in Russian, it was necessary
to translate the questionnaire into Russian by a translator experienced in translation in the
service quality management field. To reduce any translation bias, the Russian version of the
questionnaire was again translated into English by a fellow researcher who was undertaking
research in quality management. Finally, the English version of the questionnaire was made
available to reduce any confusion that might arise in the respondents.
The final instrument consisted of these 28 items and three additional items to assess the
predictive, convergent and discriminant validity of the retail service quality questionnaire.
These items are based on the study by Boshoff and Terblanche (1997). All items were
measured using a five point Likert scale, from ‘1-Strongly disagree’ to ‘5- Strongly agree’.
Partial disaggregation
To test the scale, confirmatory factor analysis with partial disaggregation was used (Bagozzi
and Heatherton, 1995; Dabholkar, et al., 1996). The traditional structural equations approach
8/6/2019 Retail Service Quality Scale Examining Applicability in a Transition Economy
http://slidepdf.com/reader/full/retail-service-quality-scale-examining-applicability-in-a-transition-economy 14/32
14
(or total disaggregation), which uses each item as a separate indicator of the relevant
construct, provides the most detailed level of analysis for construct testing, but in practice it
can be unwieldy because of likely high levels of random error in typical items and the many
parameters that must be estimated (Bagozzi and Heatherton, 1995; Dabholkar et al., 1996). In
contrast, total aggregation of items within dimensions does not offer much advantage over
traditional multivariate analysis, although it does provide fit indices. The partial
disaggregation technique is seen as a compromise between these two extremes. It allows
researchers to proceed with meaningful research by combining items into composites to
reduce higher levels of random error and yet it retains all the advantages of structural
equations, including accounting for measurement error, allowing for multiple,
multidimensional variables and testing for hierarchical factor structure (Dabholkar et al.,
1996). In this research partial disaggregation was accomplished by randomly aggregating
items that relate to a given construct so that there are two combined indicators instead of all
single-item indicators. Random combination of items is justified as all items or indicators
related to a latent variable should correspond in the same way to that latent variable; thus any
combination of these items should yield the same model fit (Dabholkar, et al., 1996).
EMPIRICAL ASSESSMENT OF THE CONSTRUCTS OF RSQS
A statistically reliable and valid scale of a construct can be applied by different
researchers/practitioners in different studies. Without assessing reliability and validity of
scale, analysis can possibly lead to incorrect inferences and misleading conclusions.
Reliability analysis
Reliability is concerned with the dependability, stability, predictability, consistency and
accuracy, and relates to the extent to which any measuring procedure yields the same results
8/6/2019 Retail Service Quality Scale Examining Applicability in a Transition Economy
http://slidepdf.com/reader/full/retail-service-quality-scale-examining-applicability-in-a-transition-economy 15/32
15
on repeated trials (Kerlinger, 1986). This research used the internal consistency method for
reliability estimation. Cronbach’s alpha computes internal consistency reliability among a
group of items combined to form a single scale. It can also be computed for any subset of
items. Nunnally (1978) advocates that new developed measures can be accepted with
Cronbach’s alpha of more than 0.60, otherwise 0.70 should be the threshold. The measure
with Cronbach’s alpha 0.80 or more is significant and highly reliable.
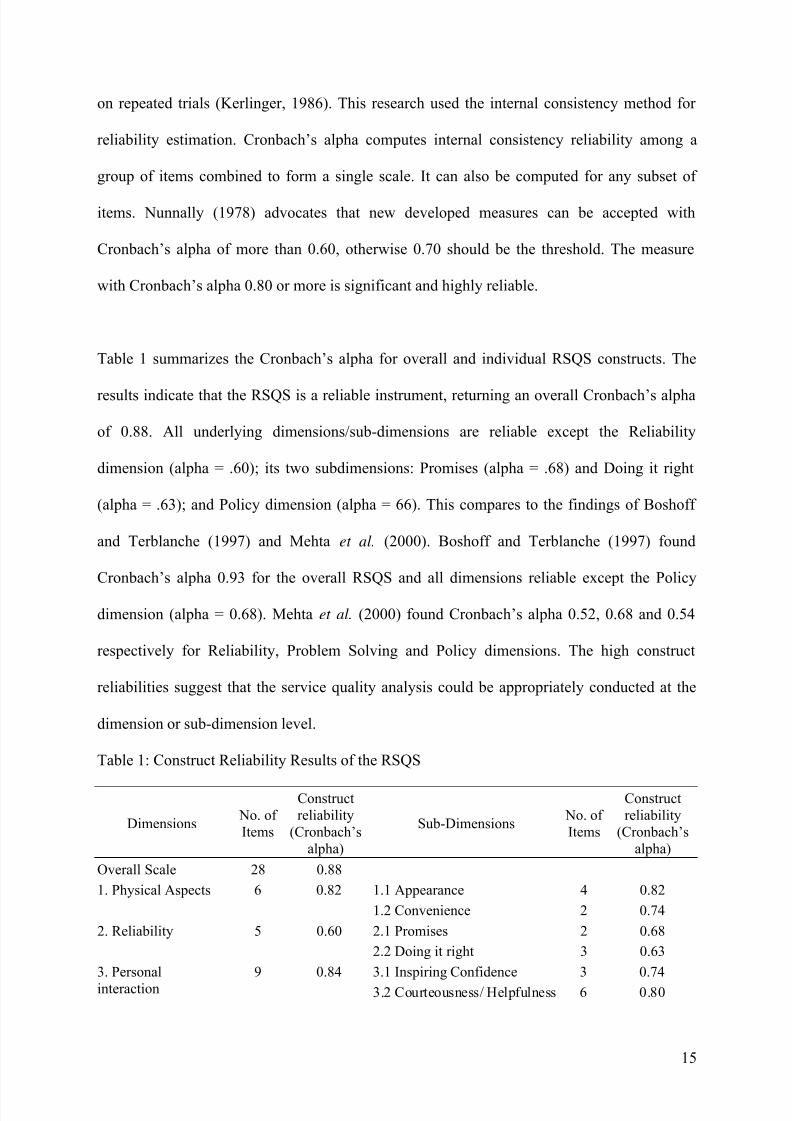
Table 1 summarizes the Cronbach’s alpha for overall and individual RSQS constructs. The
results indicate that the RSQS is a reliable instrument, returning an overall Cronbach’s alpha
of 0.88. All underlying dimensions/sub-dimensions are reliable except the Reliability
dimension (alpha = .60); its two subdimensions: Promises (alpha = .68) and Doing it right
(alpha = .63); and Policy dimension (alpha = 66). This compares to the findings of Boshoff
and Terblanche (1997) and Mehta et al. (2000). Boshoff and Terblanche (1997) found
Cronbach’s alpha 0.93 for the overall RSQS and all dimensions reliable except the Policy
dimension (alpha = 0.68). Mehta et al. (2000) found Cronbach’s alpha 0.52, 0.68 and 0.54
respectively for Reliability, Problem Solving and Policy dimensions. The high construct
reliabilities suggest that the service quality analysis could be appropriately conducted at the
dimension or sub-dimension level.
Table 1: Construct Reliability Results of the RSQS
Dimensions No. of
Items
Construct
reliability
(Cronbach’s
alpha)
Sub-Dimensions No. of
Items
Construct
reliability
(Cronbach’s
alpha)
Overall Scale 28 0.88
1.1 Appearance 4 0.821. Physical Aspects 6 0.82
1.2 Convenience 2 0.74
2.1 Promises 2 0.682. Reliability 5 0.60
2.2 Doing it right 3 0.63
3.1 Inspiring Confidence 3 0.743. Personal
interaction
9 0.84
3.2 Courteousness/ Helpfulness 6 0.80
8/6/2019 Retail Service Quality Scale Examining Applicability in a Transition Economy
http://slidepdf.com/reader/full/retail-service-quality-scale-examining-applicability-in-a-transition-economy 16/32
16
4. Problem Solving 3 0.71
5. Policy 5 0.66
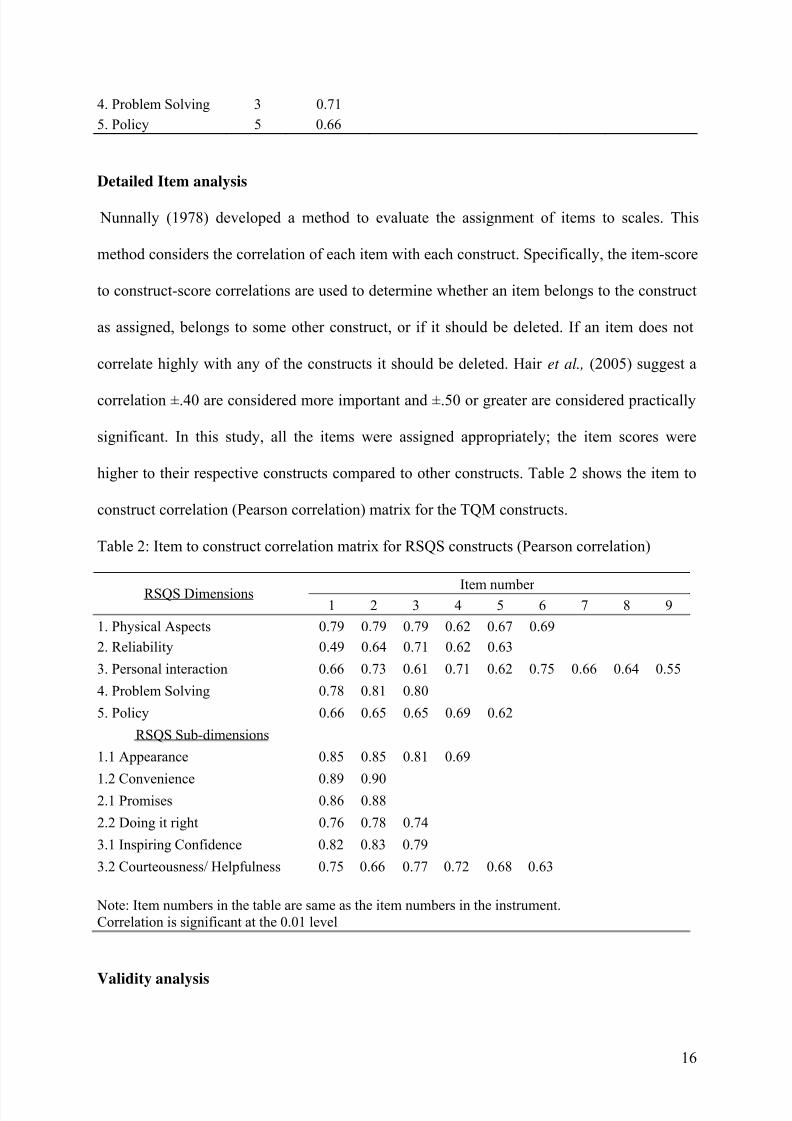
Detailed Item analysis
Nunnally (1978) developed a method to evaluate the assignment of items to scales. This
method considers the correlation of each item with each construct. Specifically, the item-score
to construct-score correlations are used to determine whether an item belongs to the construct
as assigned, belongs to some other construct, or if it should be deleted. If an item does not
correlate highly with any of the constructs it should be deleted. Hair et al., (2005) suggest a
correlation ±.40 are considered more important and ±.50 or greater are considered practically
significant. In this study, all the items were assigned appropriately; the item scores were
higher to their respective constructs compared to other constructs. Table 2 shows the item to
construct correlation (Pearson correlation) matrix for the TQM constructs.
Table 2: Item to construct correlation matrix for RSQS constructs (Pearson correlation)
Item number RSQS Dimensions1 2 3 4 5 6 7 8 9
1. Physical Aspects 0.79 0.79 0.79 0.62 0.67 0.69
2. Reliability 0.49 0.64 0.71 0.62 0.63
3. Personal interaction 0.66 0.73 0.61 0.71 0.62 0.75 0.66 0.64 0.55
4. Problem Solving 0.78 0.81 0.80
5. Policy 0.66 0.65 0.65 0.69 0.62
RSQS Sub-dimensions
1.1 Appearance 0.85 0.85 0.81 0.69
1.2 Convenience 0.89 0.902.1 Promises 0.86 0.88
2.2 Doing it right 0.76 0.78 0.74
3.1 Inspiring Confidence 0.82 0.83 0.79
3.2 Courteousness/ Helpfulness 0.75 0.66 0.77 0.72 0.68 0.63
Note: Item numbers in the table are same as the item numbers in the instrument.
Correlation is significant at the 0.01 level
Validity analysis
8/6/2019 Retail Service Quality Scale Examining Applicability in a Transition Economy
http://slidepdf.com/reader/full/retail-service-quality-scale-examining-applicability-in-a-transition-economy 17/32
17
Validity is concerned with how well the concept is defined by the measure(s), whereas
reliability relates to the consistency of the measure(s).
The constructs for RSQS should have content validity, as the measurement items were
developed based on both an extensive review of the literature and detailed evaluations by
academicians and practicing managers. Moreover, the pretest subjects indicated that the
content of each construct was well represented by the measurement items employed.
Convergent validity can be examined by the correlation of each item with their related
construct. The convergent validity of the RSQS scale tested from the correlation shown in the
Table 2. All the items loaded highly on the factors to which they are assigned. The
correlations of the items are low for the constructs other than their related construct. This
confirms the discriminant validity of the RSQS.
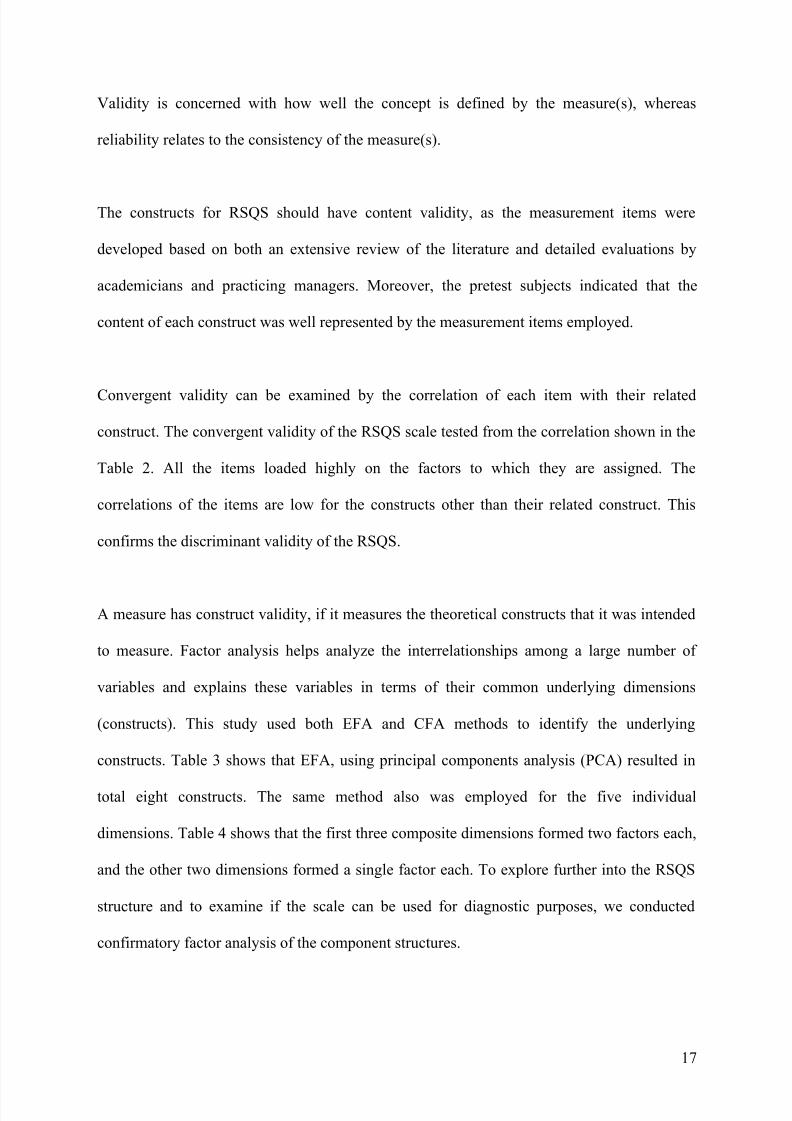
A measure has construct validity, if it measures the theoretical constructs that it was intended
to measure. Factor analysis helps analyze the interrelationships among a large number of
variables and explains these variables in terms of their common underlying dimensions
(constructs). This study used both EFA and CFA methods to identify the underlying
constructs. Table 3 shows that EFA, using principal components analysis (PCA) resulted in
total eight constructs. The same method also was employed for the five individual
dimensions. Table 4 shows that the first three composite dimensions formed two factors each,
and the other two dimensions formed a single factor each. To explore further into the RSQS
structure and to examine if the scale can be used for diagnostic purposes, we conducted
confirmatory factor analysis of the component structures.
8/6/2019 Retail Service Quality Scale Examining Applicability in a Transition Economy
http://slidepdf.com/reader/full/retail-service-quality-scale-examining-applicability-in-a-transition-economy 18/32
18
Table 3: Rotated Component Matrix for RSQS
Constructs
1 2 3 4 5 6 7 8
Physical Aspects, Appearance 1 0.81
Physical Aspects, Appearance 2 0.86
Physical Aspects, Appearance 3 0.69
Physical Aspects, Appearance 4 0.64
Physical Aspects, Convenience 1 0.72
Physical Aspects, Convenience 2 0.71
Reliability, Promises 1 0.84
Reliability, Promises 2 0.74
Reliability, Doing it right 1 0.67
Reliability, Doing it right 2 0.75
Reliability, Doing it right 3 0.46
Personal interaction Inspiring
Confidence 10.69
Personal interaction Inspiring
Confidence 20.42 0.60
Personal interaction Inspiring
Confidence 30.38 0.59
Personal interaction,
Courteousness/Helpfulness 10.64
Personal interaction,
Courteousness/Helpfulness 2
0.59
Personal interaction,
Courteousness/Helpfulness 30.67
Personal interaction,
Courteousness/Helpfulness 40.76
Personal interaction,
Courteousness/Helpfulness 50.60
Personal interaction,
Courteousness/Helpfulness 60.59 0.40
Problem Solving 1 0.77
Problem Solving 2 0.71
Problem Solving 3 0.67
Policy 1 0.58
Policy 2 0.58
Policy 3 0.69
Policy 4 0.67
Policy 5 0.52
Extraction Method: Principal Component Analysis.Rotation Method: Varimax with Kaiser Normalization.(Values less than 0.35 did not showed in the table)
8/6/2019 Retail Service Quality Scale Examining Applicability in a Transition Economy
http://slidepdf.com/reader/full/retail-service-quality-scale-examining-applicability-in-a-transition-economy 19/32
19
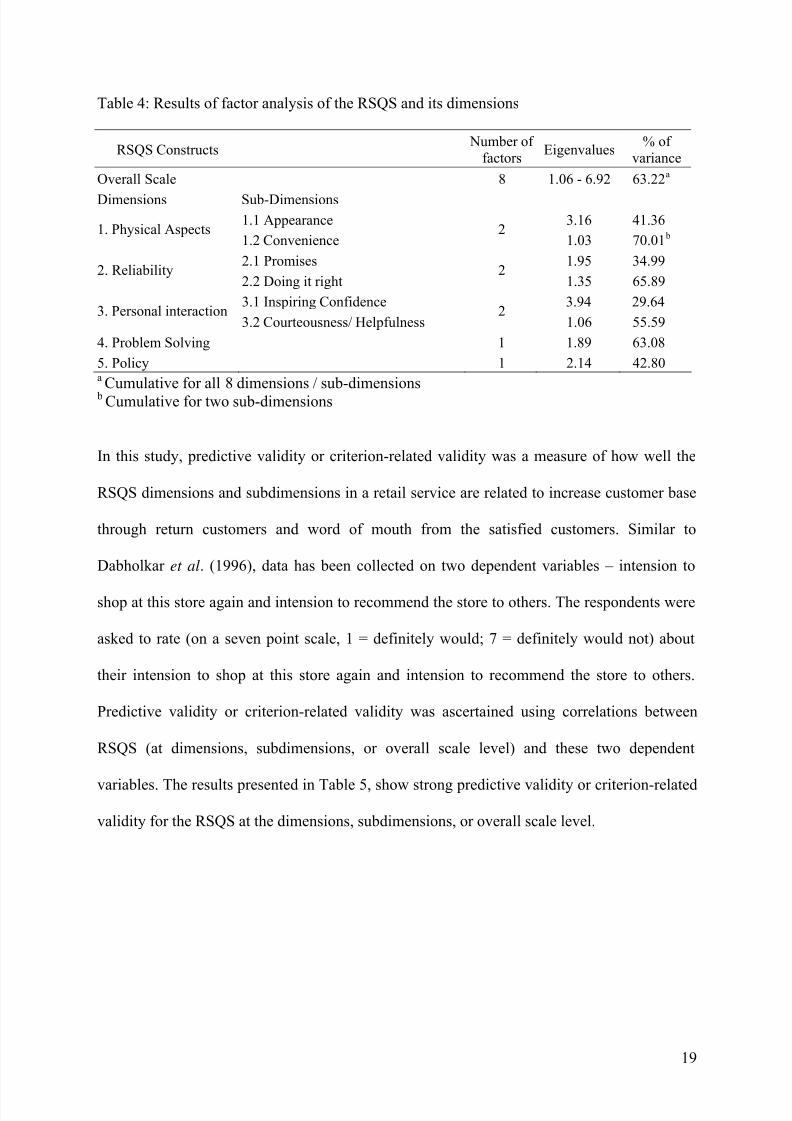
Table 4: Results of factor analysis of the RSQS and its dimensions
RSQS Constructs Number of
factorsEigenvalues
% of
variance
Overall Scale 8 1.06 - 6.92 63.22a
Dimensions Sub-Dimensions
1.1 Appearance 3.16 41.361. Physical Aspects
1.2 Convenience2
1.03 70.01 b
2.1 Promises 1.95 34.992. Reliability
2.2 Doing it right2
1.35 65.89
3.1 Inspiring Confidence 3.94 29.643. Personal interaction
3.2 Courteousness/ Helpfulness2
1.06 55.59
4. Problem Solving 1 1.89 63.08
5. Policy 1 2.14 42.80a Cumulative for all 8 dimensions / sub-dimensions b Cumulative for two sub-dimensions
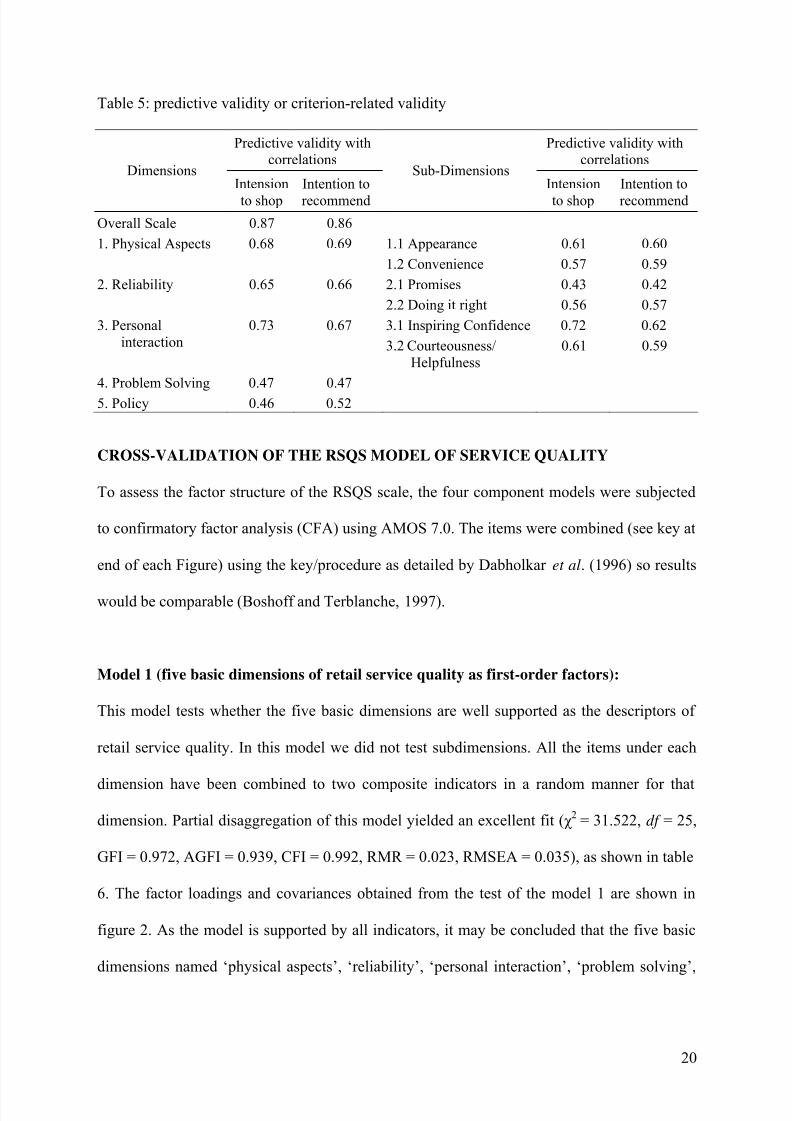
In this study, predictive validity or criterion-related validity was a measure of how well the
RSQS dimensions and subdimensions in a retail service are related to increase customer base
through return customers and word of mouth from the satisfied customers. Similar to
Dabholkar et al. (1996), data has been collected on two dependent variables – intension to
shop at this store again and intension to recommend the store to others. The respondents were
asked to rate (on a seven point scale, 1 = definitely would; 7 = definitely would not) about
their intension to shop at this store again and intension to recommend the store to others.
Predictive validity or criterion-related validity was ascertained using correlations between
RSQS (at dimensions, subdimensions, or overall scale level) and these two dependent
variables. The results presented in Table 5, show strong predictive validity or criterion-related
validity for the RSQS at the dimensions, subdimensions, or overall scale level.
8/6/2019 Retail Service Quality Scale Examining Applicability in a Transition Economy
http://slidepdf.com/reader/full/retail-service-quality-scale-examining-applicability-in-a-transition-economy 20/32
20
Table 5: predictive validity or criterion-related validity
Predictive validity with
correlations
Predictive validity with
correlationsDimensions
Intension
to shop
Intention to
recommend
Sub-DimensionsIntension
to shop
Intention to
recommend
Overall Scale 0.87 0.86
1.1 Appearance 0.61 0.601. Physical Aspects 0.68 0.69
1.2 Convenience 0.57 0.59
2.1 Promises 0.43 0.422. Reliability 0.65 0.66
2.2 Doing it right 0.56 0.57
3.1 Inspiring Confidence 0.72 0.623. Personal
interaction
0.73 0.67
3.2 Courteousness/
Helpfulness
0.61 0.59
4. Problem Solving 0.47 0.47
5. Policy 0.46 0.52
CROSS-VALIDATION OF THE RSQS MODEL OF SERVICE QUALITY
To assess the factor structure of the RSQS scale, the four component models were subjected
to confirmatory factor analysis (CFA) using AMOS 7.0. The items were combined (see key at
end of each Figure) using the key/procedure as detailed by Dabholkar et al. (1996) so results
would be comparable (Boshoff and Terblanche, 1997).
Model 1 (five basic dimensions of retail service quality as first-order factors):
This model tests whether the five basic dimensions are well supported as the descriptors of
retail service quality. In this model we did not test subdimensions. All the items under each
dimension have been combined to two composite indicators in a random manner for that
dimension. Partial disaggregation of this model yielded an excellent fit (χ 2 = 31.522, df = 25,
GFI = 0.972, AGFI = 0.939, CFI = 0.992, RMR = 0.023, RMSEA = 0.035), as shown in table
6. The factor loadings and covariances obtained from the test of the model 1 are shown in
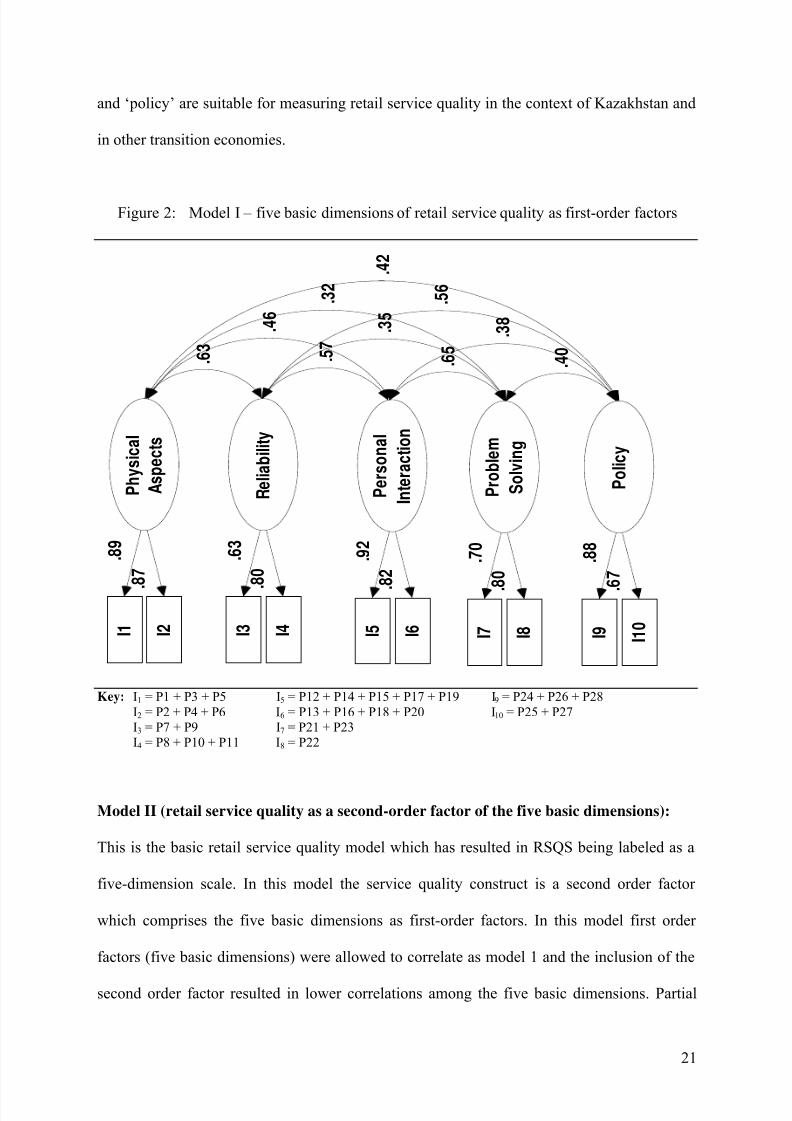
figure 2. As the model is supported by all indicators, it may be concluded that the five basic
dimensions named ‘physical aspects’, ‘reliability’, ‘personal interaction’, ‘problem solving’,
8/6/2019 Retail Service Quality Scale Examining Applicability in a Transition Economy
http://slidepdf.com/reader/full/retail-service-quality-scale-examining-applicability-in-a-transition-economy 21/32
21
and ‘policy’ are suitable for measuring retail service quality in the context of Kazakhstan and
in other transition economies.
Figure 2: Model I – five basic dimensions of retail service quality as first-order factors
Key: I1 = P1 + P3 + P5 I5 = P12 + P14 + P15 + P17 + P19 I9 = P24 + P26 + P28
I2 = P2 + P4 + P6 I6 = P13 + P16 + P18 + P20 I10 = P25 + P27
I3 = P7 + P9 I7 = P21 + P23I4 = P8 + P10 + P11 I8 = P22
Model II (retail service quality as a second-order factor of the five basic dimensions):
This is the basic retail service quality model which has resulted in RSQS being labeled as a
five-dimension scale. In this model the service quality construct is a second order factor
which comprises the five basic dimensions as first-order factors. In this model first order
factors (five basic dimensions) were allowed to correlate as model 1 and the inclusion of the
second order factor resulted in lower correlations among the five basic dimensions. Partial
P h y s i c a l
A s p e c t s
I 2
. 8 7
I 1
. 8 9
R e l i a b i l i t y
I 4 I 3
. 8 0
. 6 3
P e r s o n a l
I n t e r a c t i o n
I 6 I 5
.
8 2
. 9 2
P r o b l e m
S o l v i n g
I 8 I 7
. 8 0
. 7 0
P o l i c y
I 1 0
I 9
. 6 7
. 8 8
. 4 2
. 3 2
. 4 6
. 6 3
. 5 6
. 3 5
. 5 7
. 3 8
. 6 5
. 4 0

8/6/2019 Retail Service Quality Scale Examining Applicability in a Transition Economy
http://slidepdf.com/reader/full/retail-service-quality-scale-examining-applicability-in-a-transition-economy 22/32
22
disaggregation of this model yielded an excellent fit (χ 2 = 60.199, df = 30, GFI = 0.949, AGFI
= 0.907, CFI = 0.965, RMR = 0.042, RMSEA = 0.068), as shown in table 6. The factor
loadings and covariances obtained from the test of the second order model are shown in figure
3. The results indicate that the customers view overall retail service quality as a higher order
factor and evaluate it with five basic dimensions.
Figure 3: Model II -retail service quality as a second-order factor of the five basic dimensions
Physical
Aspects
I2
.88
I1
.88
Reliability
I4I3
.79.65
Personal
Interaction
I6I5
.82.92
Problem
Solving
I8I7
.88.63
Policy
I10I9
.66.88
Retail
Service
Quality
.73 .61.60.68 .82
Key: I1 = P1 + P3 + P5 I5 = P12 + P14 + P15 + P17 + P19 I9 = P24 + P26 + P28
I2 = P2 + P4 + P6 I6 = P13 + P16 + P18 + P20 I10 = P25 + P27
I3 = P7 + P9 I7 = P21 + P23I4 = P8 + P10 + P11 I8 = P22
Table 6: Summary results of Confirmatory factor analysis for the factor structure of the RSQS
χ 2 df p GFI AGFI CFI RMR RMSEA
Model 1 (five basic dimensions of retail
service quality as first-order factors)
31.52 25 .172 0.972 0.939 0.992 0.023 0.035
Model II (retail service quality as a
second-order factor of the five basic
dimensions)
60.20 30 0.001 0.949 0.907 0.965 0.042 0.068
Model III (six sub-dimensions of retail
service quality as first-order factors)
66.80 39 0.004 0.953 0.907 0.958 0.036 0.057
Model IV (six sub-dimensions of retail
service quality with corresponding
dimensions as second-order factors)
76.149 45 0.003 0.948 0.910 0.953 0.038 0.056
8/6/2019 Retail Service Quality Scale Examining Applicability in a Transition Economy
http://slidepdf.com/reader/full/retail-service-quality-scale-examining-applicability-in-a-transition-economy 23/32
8/6/2019 Retail Service Quality Scale Examining Applicability in a Transition Economy
http://slidepdf.com/reader/full/retail-service-quality-scale-examining-applicability-in-a-transition-economy 24/32
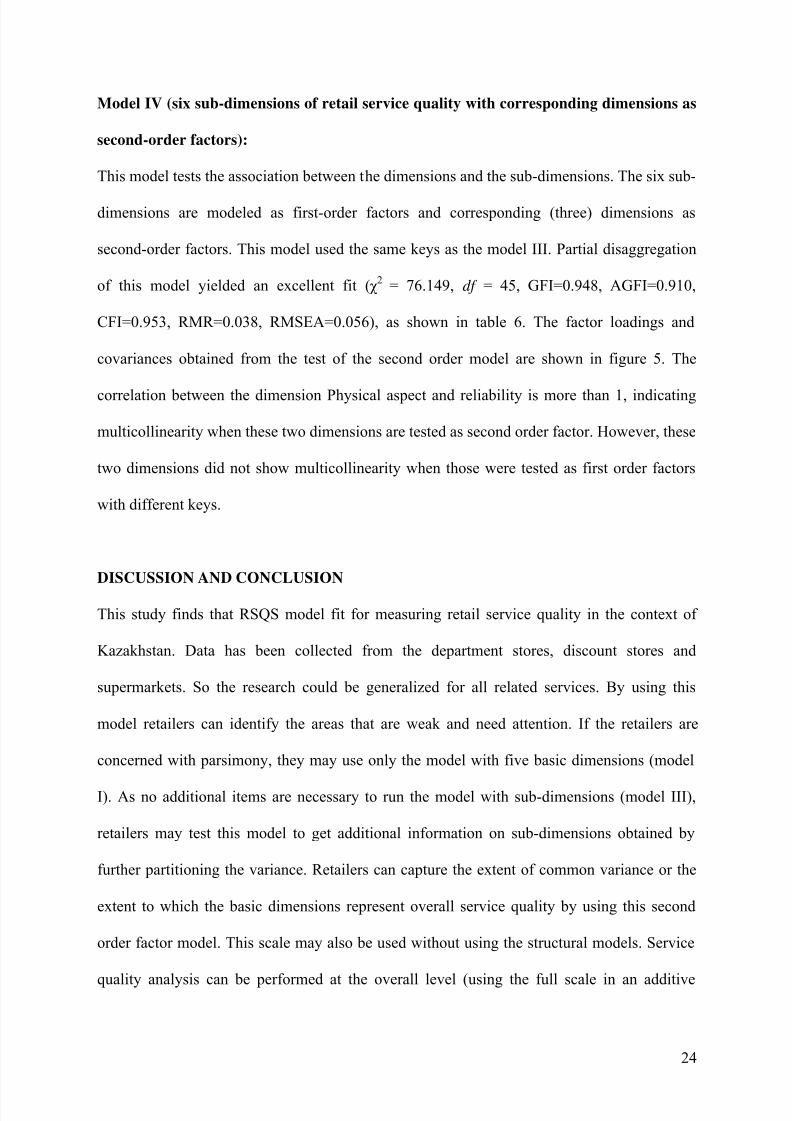
24
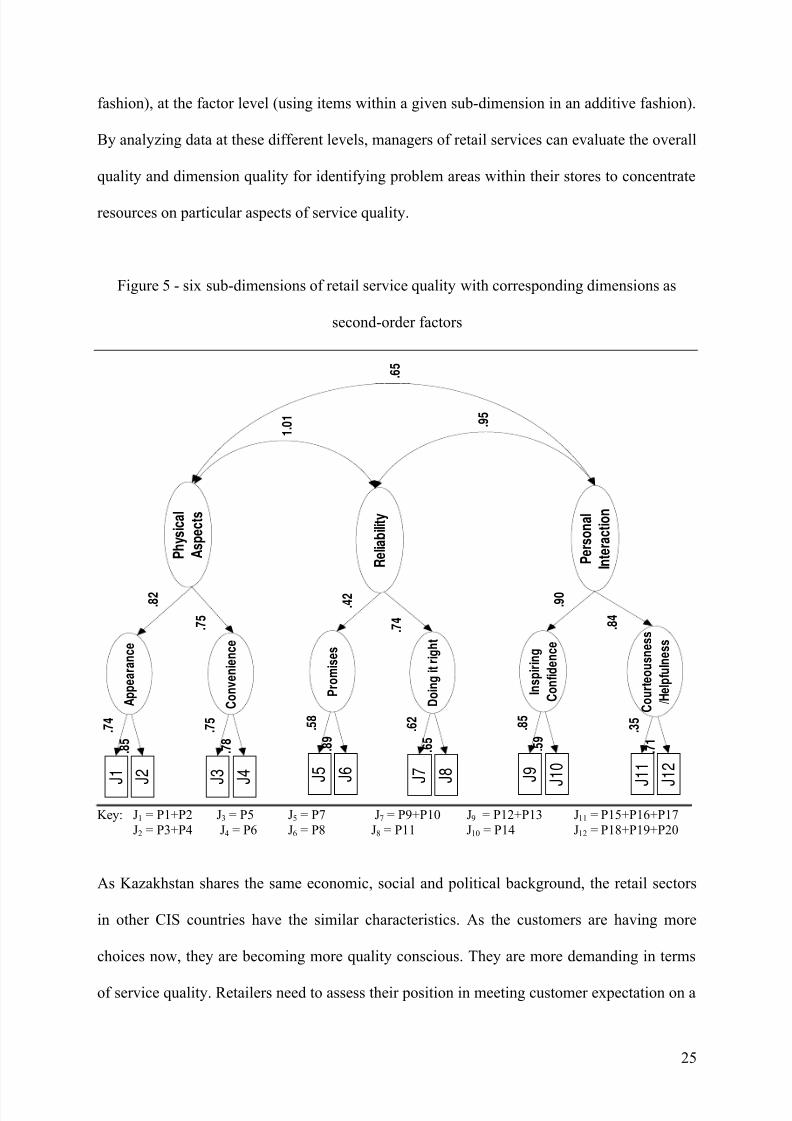
Model IV (six sub-dimensions of retail service quality with corresponding dimensions as
second-order factors):
This model tests the association between the dimensions and the sub-dimensions. The six sub-
dimensions are modeled as first-order factors and corresponding (three) dimensions as
second-order factors. This model used the same keys as the model III. Partial disaggregation
of this model yielded an excellent fit (χ 2 = 76.149, df = 45, GFI=0.948, AGFI=0.910,
CFI=0.953, RMR=0.038, RMSEA=0.056), as shown in table 6. The factor loadings and
covariances obtained from the test of the second order model are shown in figure 5. The
correlation between the dimension Physical aspect and reliability is more than 1, indicating
multicollinearity when these two dimensions are tested as second order factor. However, these
two dimensions did not show multicollinearity when those were tested as first order factors
with different keys.
DISCUSSION AND CONCLUSION
This study finds that RSQS model fit for measuring retail service quality in the context of
Kazakhstan. Data has been collected from the department stores, discount stores and
supermarkets. So the research could be generalized for all related services. By using this
model retailers can identify the areas that are weak and need attention. If the retailers are
concerned with parsimony, they may use only the model with five basic dimensions (model
I). As no additional items are necessary to run the model with sub-dimensions (model III),
retailers may test this model to get additional information on sub-dimensions obtained by
further partitioning the variance. Retailers can capture the extent of common variance or the
extent to which the basic dimensions represent overall service quality by using this second
order factor model. This scale may also be used without using the structural models. Service
quality analysis can be performed at the overall level (using the full scale in an additive
8/6/2019 Retail Service Quality Scale Examining Applicability in a Transition Economy
http://slidepdf.com/reader/full/retail-service-quality-scale-examining-applicability-in-a-transition-economy 25/32
25
fashion), at the factor level (using items within a given sub-dimension in an additive fashion).
By analyzing data at these different levels, managers of retail services can evaluate the overall
quality and dimension quality for identifying problem areas within their stores to concentrate
resources on particular aspects of service quality.
Figure 5 - six sub-dimensions of retail service quality with corresponding dimensions as
second-order factors
Key: J1 = P1+P2 J3 = P5 J5 = P7 J7 = P9+P10 J9 = P12+P13 J11 = P15+P16+P17J2 = P3+P4 J4 = P6 J6 = P8 J8 = P11 J10 = P14 J12 = P18+P19+P20
As Kazakhstan shares the same economic, social and political background, the retail sectors
in other CIS countries have the similar characteristics. As the customers are having more
choices now, they are becoming more quality conscious. They are more demanding in terms
of service quality. Retailers need to assess their position in meeting customer expectation on a
A p p e a r a n c e
J 2
. 8 5
J 1
. 7 4
C o n v e n i e n c e
J 4
J 3
. 7 8
. 7 5
P r o m i s e s
J 6
J 5
. 8 9
. 5 8
D o i n g i t r i g h t
J 8
J 7
. 6 5
. 6 2
I n s p i r i n g
C o n f i d e n c e
J 1 0
J 9
. 5 9
. 8 5
C o u r t e o u s n e s s
/ H e l p f u l n e s s
J 1 2
J 1 1
. 7 1
. 3 5
P h y s i c a l
A s p e c t s
. 8 2
. 7 5
R e l i a b i l i t y
P e r s o n a l
I n t e r a c t i o n
. 4 2
. 7 4
. 9 0
. 8 4
1 . 0 1
. 6 5
. 9 5

8/6/2019 Retail Service Quality Scale Examining Applicability in a Transition Economy
http://slidepdf.com/reader/full/retail-service-quality-scale-examining-applicability-in-a-transition-economy 26/32
26
regular basis. Retailers in other CIS countries may also use the RSQS for evaluating their
retail service quality and identify problem areas for improvement.
Retailers and researchers in other emerging countries in Asia may test the applicability of this
scale and compare results with the results of CIS countries.
8/6/2019 Retail Service Quality Scale Examining Applicability in a Transition Economy
http://slidepdf.com/reader/full/retail-service-quality-scale-examining-applicability-in-a-transition-economy 27/32
27
Appendix I: profile of respondents
Gender
Frequency Percent
Cumulative
Percent
Male 98 44.5 44.5
Female 122 55.5 100.0
Total 220 100.0
Age
Frequency Percent
Cumulative
Percent
Under 30 years 104 47.3 47.3
30-34 years33 15.0 62.3
35-39 years 26 11.8 74.1
40-49 years 34 15.5 89.5
Over 50 years 23 10.5 100.0
Total 220 100.0
Occupation
Frequency Percent
Cumulative
Percent
Student 62 28.2 28.2
Teacher 24 10.9 39.1
Businessman 36 16.4 55.5
Officers 37 16.8 72.3
Others 43 19.5 91.8
Information not
provided18 8.2 100
Total 220 100.0
8/6/2019 Retail Service Quality Scale Examining Applicability in a Transition Economy
http://slidepdf.com/reader/full/retail-service-quality-scale-examining-applicability-in-a-transition-economy 28/32
28
Appendix II: Factor Structure of RSQS
Dimension Sub-Dimension Perception Item Mean SD
P1. The store has modern-looking equipment and fixtures 3.65 1.08
P2. The store and its physical facilities (trial rooms and restrooms)are visually attractive
3.65 1.05
P3. Materials associated with this store’s service (such asshopping bags, loyalty cards and catalogs) are visuallyappealing
3.55 1.14
Appearance
P4. The store has clean, attractive and convenient physicalfacilities (restrooms, fitting rooms)
3.53 1.07
P5. The store layout at this store makes it easier for customers tofind what they need
3.40 1.06
Physical
Aspects
Convenience
P6. The store layout at this store makes it easier for customers tomove around in the store
3.47 1.12
P7. When this store promises to do something (such as repairs,
alterations) by a certain time, it will do so 3.14 0.85Promises
P8. This store provides its services at the time it promises to do so 3.20 0.90
P9. This store performs the service right the first time 3.40 0.94
P10. This store has merchandise available when the customers want
it3.74 1.05
Reliability
Doing-it-Right
P11. This store insists on error-free sales transactions and records 3.49 0.98
P12. Employees in the store have the knowledge to answer customers’ questions
3.30 1.14
P13. The behavior of employees in this store instills confidence incustomers
3.22 1.11
Inspiring
Confidence
P14.
Customers feel safe in their transactions with this store 3.28 1.22P15. The employees in this store give prompt service to customers 3.27 1.24
P16. Employees in this store tell customers exactly when serviceswill be performed
3.10 1.07
P17. Employees in this store are never too busy to respond tocustomer’s requests
3.26 1.12
P18. This store gives customers individual attention 3.10 1.12
P19. Employees in this store are consistently courteous withcustomers
3.21 1.11
Personal
interaction
Courteousness/
Helpfulness
P20. Employees in this store treat customers courteously on thetelephone.
3.26 1.01
P21. This store willingly handles returns and exchanges 2.86 1.12
P22. When a customer has a problem, this store shows a sincereinterest in solving it
3.04 1.08
ProblemSolving
P23. Employees of this store are able to handle customer complaints directly and immediately.
3.00 1.08
P24. This store offers high quality merchandise 3.58 1.14
P25. This store provides plenty of convenient parking for customers 3.20 1.26
P26. This store has operating hours convenient to all their customers
3.86 1.06
P27. This store accepts all major credit cards 3.50 1.06
Policy
P28.
The store has its own credit card 3.01 1.19
8/6/2019 Retail Service Quality Scale Examining Applicability in a Transition Economy
http://slidepdf.com/reader/full/retail-service-quality-scale-examining-applicability-in-a-transition-economy 29/32
8/6/2019 Retail Service Quality Scale Examining Applicability in a Transition Economy
http://slidepdf.com/reader/full/retail-service-quality-scale-examining-applicability-in-a-transition-economy 30/32
30
Dabholkar, Pratibha, Dayle Thorpe, Joseph Rentz. (1996). A Measure of Service Quality for
Retail Stores: Scale Development and Validation. Journal of the Academy of Marketing
Science, 24(1) 3-16.
Finn, David W. and Charles Lamb Jr., (1991). “An Evaluation of the SERVQUAL Scales in a
Retailing Setting,” Advances in Consumer Research, Vol. 18, No. 1, pp. 483-490.
Finn, Adam. (2004). A reassessment of the dimensionality of retail performance: a
multivariate generalizibility theory perspective. Journal of Retailing and Consumer
Services, 11 235–245.
Gagliano, K. B., J. Hathcote. (1994). Consumer Expectations and Perceptions of Service
Quality in Retail Apparel Specialty Stores. Journal of Services Marketing, 8(1) 60-69.
Hair, J.F., B. Black, B. Babin, R.E. Anderson, R.L. Tatham. (2005). Multivariate Data
Analysis. 6th ed., Prentics Hall, Upper Saddle River, New Jersey.
Kerlinger, F.N. (1986). Foundations of Behavioral Research, 3rd ed., Harcourt Brace
Jovanovich College Publisher, New York, NY.
Kim, Soyoung, Byoungho Jin. (2002). Validating the retail service quality scale for US and
Korean customers of discount stores: an exploratory study. Journal of Services
Marketing, 7(2) 223-237.
Lapierre, J., P. Filiatrault, J. Perrien. (1996). Research on service quality evaluation: evolution
and methodological issues. Journal of Retailing and Consumer Services, 3(2) 91-98.
Lewis, B.R., V.W. Mitchell. (1990). Defining and measuring the quality of customer service.
Marketing Intelligence & Planning, 8(6) 11-17.
Low, Patric, Ina Freeman. (2007). Fashion marketing to women in Kazakhstan. Journal of
Fashion Marketing and Management, 11(1) 41-55.
8/6/2019 Retail Service Quality Scale Examining Applicability in a Transition Economy
http://slidepdf.com/reader/full/retail-service-quality-scale-examining-applicability-in-a-transition-economy 31/32
31
Mehta, C. Subhash, Ashok Lalwani, Soon Li Han. (2000). Service quality in retailing: relative
efficiency of alternative measurement scales for different product-service environments.
International Journal of Retail & Distribution Management , 28(2) 62-72.
Nunnally, J. (1978). Psychometric Theory, McGraw-Hill, New York, NY.
Parasuraman, A., V.A. Zeithaml, L.L. Berry. (1985). A conceptual model of service quality
and its implication. Journal of Marketing, 49 41-50.
Parasuraman, A., V.A. Zeithaml, L.L. Berry. (1988). SERVQUAL: a multi-item scale for
measuring consumer perceptions of the service quality. Journal of Retailing, 64(1) 12-
40.
Parasuraman, A., V.A. Zeithaml, L.L. Berry. (1991). Refinement and reassessment of the
SERVQUAL scale. Journal of Retailing, 67(4) 420-50.
Robinson, Terry. (1998). The role of retailing in a Russian consumer society. European
Business Review, 98(5) 276–281.
Schneider, Benjanim, Susan White. (2004). Service Quality - Research Perspectives,
Foundations for Organizational Science, California, USQ: Sage Publications Inc.
Sharma, Alka, Versha Mehta. (2004). Service Quality in Financial Services – A case study of
Banking Services. Journal of Services Research, 4(2) 205-222.
Sivadas, Eugene, Jamie Baker-Prewitt. (2000). An examination of the relationship between
service quality, customer satisfaction, and store loyalty. International Journal of Retail
& Distribution Management , 28(2) 73-82.
Spreng, R.A., A.K. Singh. (1993). An empirical assessment of the SERVQUAL scale and the
relationship between service quality and satisfaction. in Cravens, D.W. and Dickson, P.
(Eds), Enhancing Knowledge Development in Marketing, American Marketing
Association, Chicago, IL, 1-6.
8/6/2019 Retail Service Quality Scale Examining Applicability in a Transition Economy
http://slidepdf.com/reader/full/retail-service-quality-scale-examining-applicability-in-a-transition-economy 32/32
Teas, R.K. (1993). Expectations, performance evaluation, and consumers' perceptions of
quality. Journal of Marketing, 57(2) 18-34.
Vazquez, Rodolfo, Ignacio A. Bosque, Ana M. Diaz, Agustin V. Ruiz. (2001). Service quality
in supermarket retailing: identifying critical service experiences. Journal of Retailing
and Consumer Services, 8 1-14.
Verme, Paolo. (2006). Pro-poor Growth during Exceptional Growth. Evidence from a
Transition Economy. The European Journal of Comparative Economics, 3(1) 3-14.
Wisniewski, M. (2001). Using SERVQUAL to assess customer satisfaction with public sector
services. Managing Service Quality, 11(6) 380-388.
Wong, Amy, Amrik Sohal. (2003). Service quality and customer loyalty perspectives on two
levels of retail relationships. Journal of Services Marketing, 17(5) 495-513.
Yavas, Ugur, Z. Bilgin, D. J. Shemwell. (1997). Service quality in the banking sector in an
emerging economy: A consumer survey. International Journal of Bank Marketing,
15(6) 217-223.