Embed Size (px)
Citation preview
RETENTION OF FREE LIQUIDS IN LANDFILLS UNDERGOING
VERTICAL EXPANSION
By Jorge G. Zornberg,1 Member, ASCE, Bruce L. Jernigan,2
Thierry R. Sanglerat,3 and Bradford H. Cooley,4 Associate Member, ASCE
ABSTRACT: This paper presents the results of an evaluation of the potential release of liquids stored within awaste mass undergoing compression due to a landfill vertical expansion. The mechanism of free liquid generationis initially evaluated and data interpretation methods are developed to estimate the maximum allowable wastethickness that a landfill could reach without releasing liquids stored within the waste. The proposed conceptualframework of free liquid generation is used to evaluate the environmental implications of the vertical expansionof an unlined case history landfill located in southern California. The moisture content of waste in southernCalifornia landfills is generally below field capacity. However, if the waste is compressed, its available moisture-holding capacity will decrease and its moisture content may eventually reach field capacity. Additional com-pression beyond this point will squeeze liquid from the waste. Laboratory testing and field characterizationprograms were undertaken to evaluate the field capacity, the in-situ moisture distribution, and the unit weightprofiles of the waste in the case history landfill. These experimental data were used to evaluate the ability ofthe landfill to continue to retain moisture after continued waste placement. The evaluation indicated that themoisture content of the waste will not reach its field capacity for the proposed final grading of the case historylandfill and, therefore, that the liquids should remain within the waste mass after the vertical expansion.
INTRODUCTION
The potential of a landfill to impact ground water is gen-erally evaluated using water balance or water budget tech-niques in which the generation of free liquid (water output) isestimated using precipitation information (water input) and ei-ther measured or estimated hydraulic properties. In this ap-proach, the hydraulic properties of the municipal solid waste(MSW) and cover soil remain constant during the analysis.The focus of the present paper is on the evaluation of thepotential generation of free liquid in landfills undergoing ver-tical expansion. Different from conventional water balanceanalyses, free liquid could be generated in this scenario dueto a decrease in the available moisture-holding capacity of thewaste, which is induced by reduction of the voids within thewaste rather than by infiltration of water into the system.
The field capacity of waste is the quantity of water per unitvolume that can be held within the refuse against the pull ofgravity. Consequently, free liquid will be generated when theamount of moisture within the waste exceeds the field capacity.The moisture content of waste in arid climates, such as insouthern California, is generally below field capacity. How-ever, if the waste is compressed, its available moisture-holdingcapacity will decrease and the moisture content of the wastemay eventually reach its field capacity. Further compressionbeyond this point will generate free liquid.
The current paper indicates (1) an analytical evaluation ofthe effect of confinement on the field capacity and in-situmoisture content of waste, as well as an evaluation of themechanism of free liquid generation that could be triggereddue to a landfill vertical expansion; (2) a presentation and dis-
1Asst. Prof., Univ. of Colorado at Boulder, Campus Box 428, Boulder,CO 80309.
2Divisional Vice Pres., Browning-Ferris Industries, Inc., P.O. Box3151, Houston, TX 77253.
3Prin., GeoSyntec Consultants, 2100 Main St., Ste. 150, HuntingtonBeach, CA 92648.
4Proj. Engr., GeoSyntec Consultants, 2100 Main St., Ste. 150,Huntington Beach, CA.
Note. Discussion open until December 1, 1999. To extend the closingdate one month, a written request must be filed with the ASCE Managerof Journals. The manuscript for this paper was submitted for review andpossible publication on December 1, 1997. This paper is part of the Jour-nal of Geotechnical and Geoenvironmental Engineering, Vol. 125, No.7, July, 1999. qASCE, ISSN 1090-0241/99/0007-0583–0594/$8.00 1$.50 per page. Paper No. 17076.
JOURNAL OF GEOTEC
FIG. 1. Volumetric Phase Relationships and Moisture Reten-tion Parameters in Porous Material
cussion of experimental results obtained from laboratory test-ing and field characterization programs undertaken to quantifythe field capacity, the in-situ moisture distribution, and the unitweight profiles of the waste in a southern California landfill;and (3) a case history, which presents the results of an inves-tigation performed to assess the ability of the existing wastein an unlined landfill undergoing vertical expansion to retainmoisture and, consequently, to avoid any impact in the groundwater. The methods and information presented herein allowestimation of the maximum allowable waste thickness (Hmax)that a landfill can reach without releasing liquids initiallystored within the waste mass.
FIELD CAPACITY OF MSW
Field capacity is the moisture content that a porous material(e.g., waste or soil cover) will store within its pores by cap-illary stress. Veihmeyer and Hendrickson (1931) introducedthe field capacity concept and defined it as ‘‘the amount ofwater held in the soil after the excess gravitational water hasdrained away and after the rate of downward movement ofwater has materially decreased.’’ For practical purposes, thisdefinition implies that if a quantity of water is added to aporous material already at its field capacity, an equal quantitywill drain out of it to restore moisture equilibrium.
Moisture retention parameters and relevant volumetric phaserelationships for a porous material are illustrated in Fig. 1.Besides field capacity, other moisture retention parameters arethe wilting point (lowest moisture content that can be achieved
HNICAL AND GEOENVIRONMENTAL ENGINEERING / JULY 1999 / 583
by plant transpiration) and the porosity (ratio between volumeof voids and total control volume, n = Vv /V). Always less than1.0 and greater than or equal to the field capacity, the porositycorresponds to the volumetric moisture content when the po-rous material is at saturation. The in-situ volumetric moisturecontent u is the ratio between the volume of liquid and thetotal control volume (u = Vw /V), and it typically ranges be-tween the field capacity and the wilting point of the porousmaterial. For an in-situ moisture content u, the additionalmoisture that the porous material can retain before free liquidis generated may be defined as the available moisture-holdingcapacity (i.e., the difference between the field capacity and thein-situ moisture content).
The moisture retention parameters and phase relationshipsin Fig. 1 are expressed using volumetric relationships. The useof volumetric relationships is the state of practice in agronomyand soil physics, and volumetric relationships have been usedin the hydrologic performance evaluation of landfills model(Schroeder et al. 1994). In geotechnical applications, however,the moisture content is commonly reported using gravimetricrelationships. The gravimetric moisture content, w, is definedas the ratio between the weight of water Ww and the weightof solids Ws in a control volume (w = Ww /Ws).
Useful relationships between gravimetric and volumetricmoisture contents (and moisture retention properties) that willbe used in the data analyses presented in this paper are asfollows:
u = g /g ?w (1)d w
g wtu = ? (2)
g 1 1 ww
u = (1 2 n) ?G ?w (3)s
where gd = bulk dry unit weight of the porous material; gw =unit weight of water; gt = total (wet) unit weight of the porousmaterial; and Gs = specific gravity of the solids.
The results of water balance analyses in MSW landfills aresensitive to the field capacity value selected for the waste.However, moisture retention properties of MSW are amongthe water balance components that are most difficult to defineor estimate. This is probably a consequence of the inherentdifficulty of laboratory testing of MSW, the lack of standard-ization in reported experimental results, and the dependenceof moisture retention properties on the composition and theunit weight of the waste. McBean et al. (1995) reported typical(volumetric) values of 55% for field capacity and 17% for thewilting point of MSW.
There is only limited information on the effect of confine-ment on the field capacity of waste. Blight et al. (1992) im-plemented a testing program to investigate this issue. As partof this experimental program, waste samples were inundatedwith water, allowed to drain for 24 h, and finally compressedunder increasing overburden pressures at which field capacitywas measured. Reported gravimetric field capacity values fromthis laboratory program ranged from 225% for fresh waste atlow confining pressures to approximately 55% for older wastescompressed to a unit weight of approximately 10 kN/m3. Typ-ical gravimetric field capacity values measured by Blight et al.(1992) as part of the field characterization of three landfillslocated in semi arid areas of South Africa ranged from 125%to 150%.
Experimental results were also reported by Fungaroli andSteiner (1979), who indicated that the volumetric field capacityincreases with the unit weight of the waste material (i.e., withthe reduction of the voids within the waste). The reported testresults showed, for example, that milling of waste increasesthe volumetric field capacity. For unmilled waste, the field
584 / JOURNAL OF GEOTECHNICAL AND GEOENVIRONMENTAL ENGIN
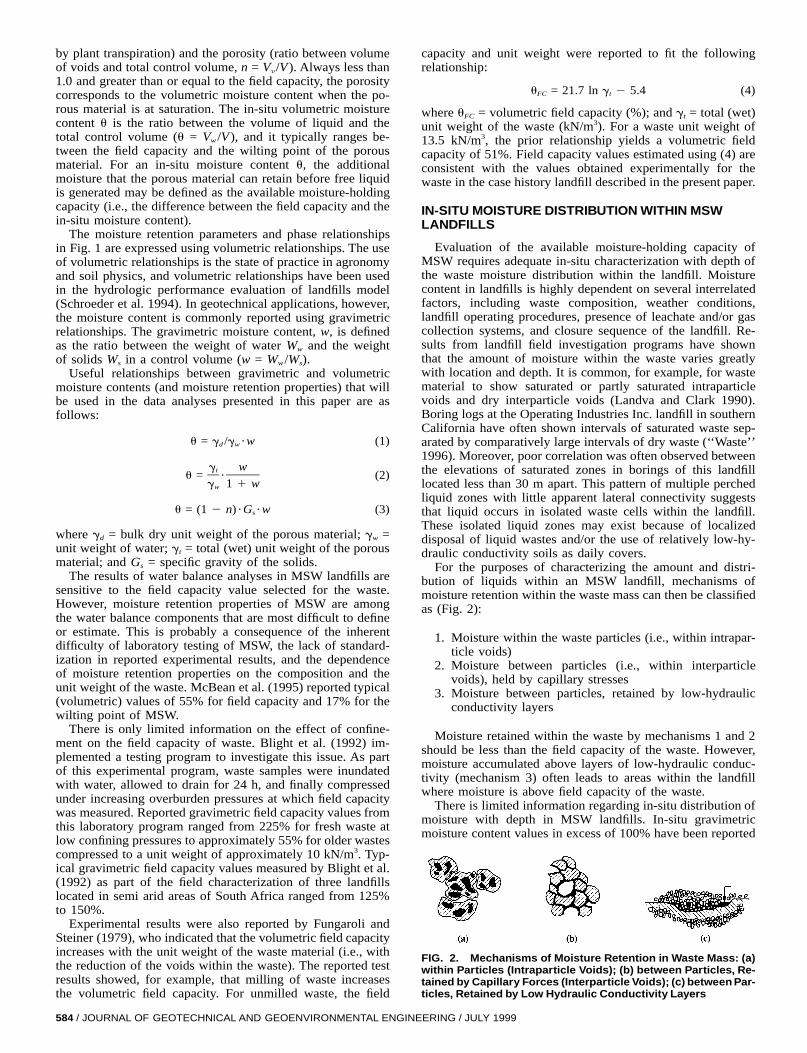
FIG. 2. Mechanisms of Moisture Retention in Waste Mass: (a)within Particles (Intraparticle Voids); (b) between Particles, Re-tained by Capillary Forces (Interparticle Voids); (c) between Par-ticles, Retained by Low Hydraulic Conductivity Layers
capacity and unit weight were reported to fit the followingrelationship:
u = 21.7 ln g 2 5.4 (4)FC t
where uFC = volumetric field capacity (%); and gt = total (wet)unit weight of the waste (kN/m3). For a waste unit weight of13.5 kN/m3, the prior relationship yields a volumetric fieldcapacity of 51%. Field capacity values estimated using (4) areconsistent with the values obtained experimentally for thewaste in the case history landfill described in the present paper.
IN-SITU MOISTURE DISTRIBUTION WITHIN MSWLANDFILLS
Evaluation of the available moisture-holding capacity ofMSW requires adequate in-situ characterization with depth ofthe waste moisture distribution within the landfill. Moisturecontent in landfills is highly dependent on several interrelatedfactors, including waste composition, weather conditions,landfill operating procedures, presence of leachate and/or gascollection systems, and closure sequence of the landfill. Re-sults from landfill field investigation programs have shownthat the amount of moisture within the waste varies greatlywith location and depth. It is common, for example, for wastematerial to show saturated or partly saturated intraparticlevoids and dry interparticle voids (Landva and Clark 1990).Boring logs at the Operating Industries Inc. landfill in southernCalifornia have often shown intervals of saturated waste sep-arated by comparatively large intervals of dry waste (‘‘Waste’’1996). Moreover, poor correlation was often observed betweenthe elevations of saturated zones in borings of this landfilllocated less than 30 m apart. This pattern of multiple perchedliquid zones with little apparent lateral connectivity suggeststhat liquid occurs in isolated waste cells within the landfill.These isolated liquid zones may exist because of localizeddisposal of liquid wastes and/or the use of relatively low-hy-draulic conductivity soils as daily covers.
For the purposes of characterizing the amount and distri-bution of liquids within an MSW landfill, mechanisms ofmoisture retention within the waste mass can then be classifiedas (Fig. 2):
1. Moisture within the waste particles (i.e., within intrapar-ticle voids)
2. Moisture between particles (i.e., within interparticlevoids), held by capillary stresses
3. Moisture between particles, retained by low-hydraulicconductivity layers
Moisture retained within the waste by mechanisms 1 and 2should be less than the field capacity of the waste. However,moisture accumulated above layers of low-hydraulic conduc-tivity (mechanism 3) often leads to areas within the landfillwhere moisture is above field capacity of the waste.
There is limited information regarding in-situ distribution ofmoisture with depth in MSW landfills. In-situ gravimetricmoisture content values in excess of 100% have been reported
EERING / JULY 1999
by Blight et al. (1992) for South African landfills located inarid regions. Measurements at the Pioneer Crossing Landfillin Pennsylvania (Gabr and Valero 1995) showed a trend ofincreasing gravimetric moisture content with depth, with val-ues ranging from 30% near the surface to 150% at a depth of20 m. However, the opposite trend of gravimetric moisturecontent with depth was reported for the Ano Liossa Landfillin Greece (Coumoulos et al. 1995), with values exceeding150% at shallow depths and moisture contents of approxi-mately 50% at a depth of 30 m. Results presented in the pres-ent paper from a field characterization program undertaken ata southern California landfill provide much needed additionalinformation on the distribution of moisture within MSW land-fills.
MECHANISM OF FREE LIQUID GENERATION DUE TOLANDFILL VERTICAL EXPANSION
The flow of moisture within MSW landfills is generallyevaluated using mass conservation principles by water balancetechniques. The water balance used for prediction of free liq-uid in landfills is generally stated as
Infiltration 2 evapotranspiration = change in liquid storage
1 liquid extraction 1 free liquid (5)
Infiltration is the difference between precipitation and sur-face water runoff. Evapotranspiration accounts for moistureloss by surface evaporation and plant transpiration. Change inliquid storage is the change in moisture either stored by cap-illary stresses within the waste and intermediate cover layers,or in transit under downward (gravity) or upward (evapotran-spirative) flow gradients. Liquid extraction is the removal ofmoisture by liquid and gas extraction systems and by bio-degradation processes within the waste. Finally, the free liquid(i.e., the unknown in the water balance equation) is the liquidexiting at or collected from the base of the landfill. Eq. (5) isgenerally applied to cases in which it is reasonable to assumethat waste properties will remain unchanged and, conse-quently, that free liquid generation will be governed by theamount of liquid infiltration into the system. The focus of thepresent paper, however, is on the evaluation of a scenario inwhich waste properties do change and the generation of freeliquid is caused by variations in the retention capacity of thewaste. In the situation under investigation, the waste mass un-dergoes compression and the infiltration, evapotranspiration,and liquid extraction components of the water balance problemcan be neglected. Consequently, (5) in this case is reduced to:
Change in liquid storage 1 free liquid = 0 (6)
Change in liquid storage of waste undergoing compressionmay occur not only due to a change in the void space withinthe landfill, but, possibly, also due to a change in the fieldcapacity of the waste due to the increased confinement.
The available moisture-holding capacity of waste will de-crease as the waste is compressed during a landfill verticalexpansion. Some studies have been performed on the effect ofcompression of MSW on landfill settlements (Sowers 1968,1973; Edil et al. 1990; Othman et al. 1995). However, thereis only limited information on the effect of compression ofMSW on the moisture retention properties (Fungaroli andSteiner 1979; Blight et al. 1992). Field and laboratory datagenerated for the case history landfill provide insight into theeffect of confinement on the field capacity of waste materials.
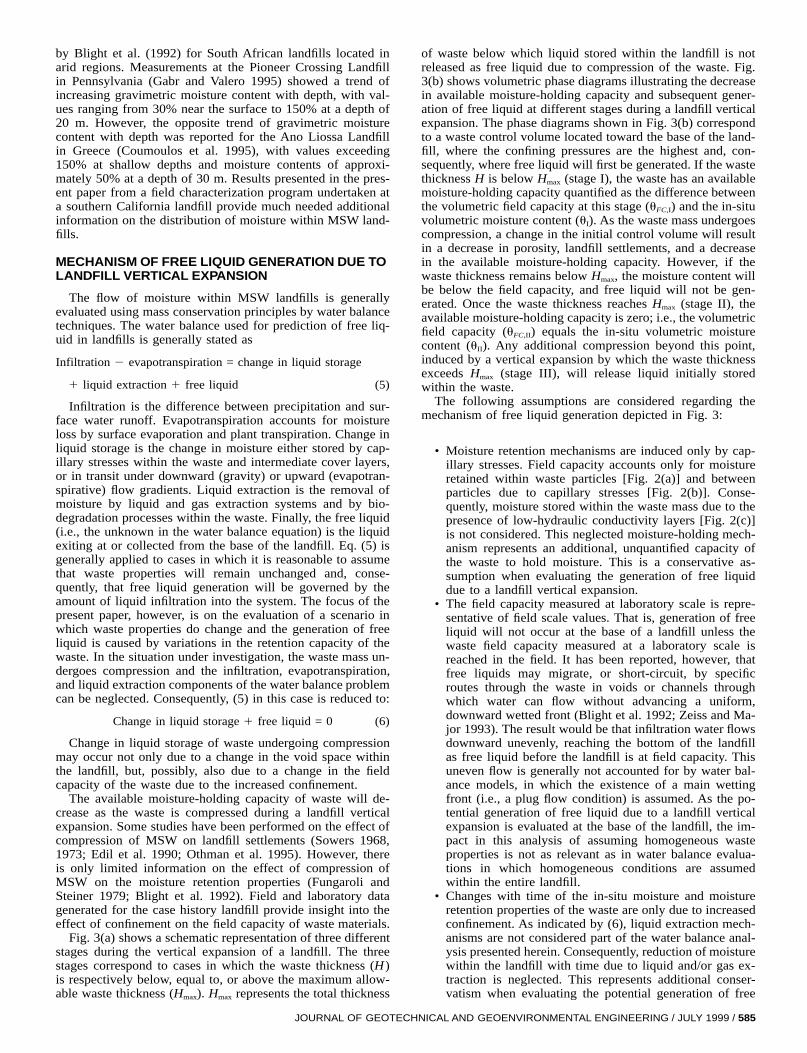
Fig. 3(a) shows a schematic representation of three differentstages during the vertical expansion of a landfill. The threestages correspond to cases in which the waste thickness (H)is respectively below, equal to, or above the maximum allow-able waste thickness (Hmax). Hmax represents the total thickness
JOURNAL OF GEOTECH
of waste below which liquid stored within the landfill is notreleased as free liquid due to compression of the waste. Fig.3(b) shows volumetric phase diagrams illustrating the decreasein available moisture-holding capacity and subsequent gener-ation of free liquid at different stages during a landfill verticalexpansion. The phase diagrams shown in Fig. 3(b) correspondto a waste control volume located toward the base of the land-fill, where the confining pressures are the highest and, con-sequently, where free liquid will first be generated. If the wastethickness H is below Hmax (stage I), the waste has an availablemoisture-holding capacity quantified as the difference betweenthe volumetric field capacity at this stage (uFC,I) and the in-situvolumetric moisture content (uI). As the waste mass undergoescompression, a change in the initial control volume will resultin a decrease in porosity, landfill settlements, and a decreasein the available moisture-holding capacity. However, if thewaste thickness remains below Hmax, the moisture content willbe below the field capacity, and free liquid will not be gen-erated. Once the waste thickness reaches Hmax (stage II), theavailable moisture-holding capacity is zero; i.e., the volumetricfield capacity (uFC,II) equals the in-situ volumetric moisturecontent (uII). Any additional compression beyond this point,induced by a vertical expansion by which the waste thicknessexceeds Hmax (stage III), will release liquid initially storedwithin the waste.
The following assumptions are considered regarding themechanism of free liquid generation depicted in Fig. 3:
• Moisture retention mechanisms are induced only by cap-illary stresses. Field capacity accounts only for moistureretained within waste particles [Fig. 2(a)] and betweenparticles due to capillary stresses [Fig. 2(b)]. Conse-quently, moisture stored within the waste mass due to thepresence of low-hydraulic conductivity layers [Fig. 2(c)]is not considered. This neglected moisture-holding mech-anism represents an additional, unquantified capacity ofthe waste to hold moisture. This is a conservative as-sumption when evaluating the generation of free liquiddue to a landfill vertical expansion.
• The field capacity measured at laboratory scale is repre-sentative of field scale values. That is, generation of freeliquid will not occur at the base of a landfill unless thewaste field capacity measured at a laboratory scale isreached in the field. It has been reported, however, thatfree liquids may migrate, or short-circuit, by specificroutes through the waste in voids or channels throughwhich water can flow without advancing a uniform,downward wetted front (Blight et al. 1992; Zeiss and Ma-jor 1993). The result would be that infiltration water flowsdownward unevenly, reaching the bottom of the landfillas free liquid before the landfill is at field capacity. Thisuneven flow is generally not accounted for by water bal-ance models, in which the existence of a main wettingfront (i.e., a plug flow condition) is assumed. As the po-tential generation of free liquid due to a landfill verticalexpansion is evaluated at the base of the landfill, the im-pact in this analysis of assuming homogeneous wasteproperties is not as relevant as in water balance evalua-tions in which homogeneous conditions are assumedwithin the entire landfill.
• Changes with time of the in-situ moisture and moistureretention properties of the waste are only due to increasedconfinement. As indicated by (6), liquid extraction mech-anisms are not considered part of the water balance anal-ysis presented herein. Consequently, reduction of moisturewithin the landfill with time due to liquid and/or gas ex-traction is neglected. This represents additional conser-vatism when evaluating the potential generation of free
NICAL AND GEOENVIRONMENTAL ENGINEERING / JULY 1999 / 585
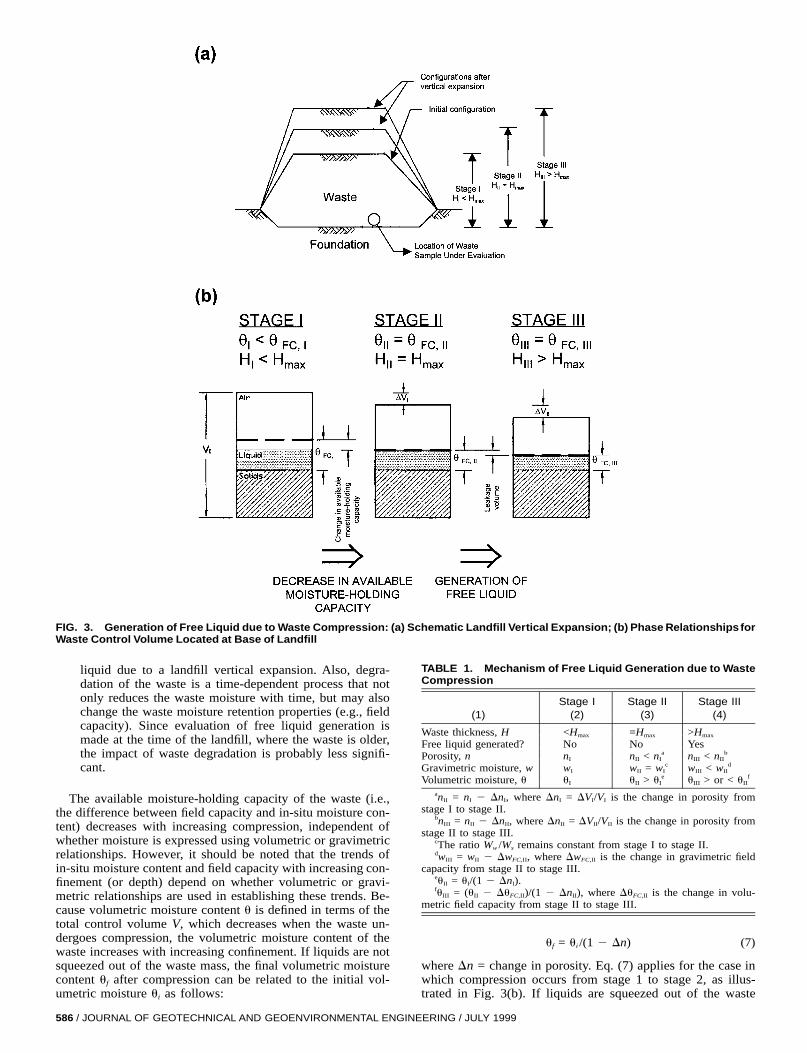
FIG. 3. Generation of Free Liquid due to Waste Compression: (a) Schematic Landfill Vertical Expansion; (b) Phase RelationshipsforWaste Control Volume Located at Base of Landfill
liquid due to a landfill vertical expansion. Also, degra-dation of the waste is a time-dependent process that notonly reduces the waste moisture with time, but may alsochange the waste moisture retention properties (e.g., fieldcapacity). Since evaluation of free liquid generation ismade at the time of the landfill, where the waste is older,the impact of waste degradation is probably less signifi-cant.
The available moisture-holding capacity of the waste (i.e.,the difference between field capacity and in-situ moisture con-tent) decreases with increasing compression, independent ofwhether moisture is expressed using volumetric or gravimetricrelationships. However, it should be noted that the trends ofin-situ moisture content and field capacity with increasing con-finement (or depth) depend on whether volumetric or gravi-metric relationships are used in establishing these trends. Be-cause volumetric moisture content u is defined in terms of thetotal control volume V, which decreases when the waste un-dergoes compression, the volumetric moisture content of thewaste increases with increasing confinement. If liquids are notsqueezed out of the waste mass, the final volumetric moisturecontent uf after compression can be related to the initial vol-umetric moisture ui as follows:
586 / JOURNAL OF GEOTECHNICAL AND GEOENVIRONMENTAL ENGIN
TABLE 1. Mechanism of Free Liquid Generation due to WasteCompression
(1)Stage I
(2)Stage II
(3)Stage III
(4)
Waste thickness, H <Hmax =Hmax >Hmax
Free liquid generated? No No YesPorosity, n nI nII < nI
a nIII < nIIb
Gravimetric moisture, w wI wII = wIc wIII < wII
d
Volumetric moisture, u uI uII > uIe uIII > or < uII
f
anII = nI 2 DnI, where DnI = DVI/VI is the change in porosity fromstage I to stage II.
bnIII = nII 2 DnII, where DnII = DVII/VII is the change in porosity fromstage II to stage III.
cThe ratio Ww /Ws remains constant from stage I to stage II.dwIII = wII 2 DwFC,II, where DwFC,II is the change in gravimetric field
capacity from stage II to stage III.euII = uI/(1 2 DnI).fuIII = (uII 2 DuFC,II)/(1 2 DnII), where DuFC,II is the change in volu-
metric field capacity from stage II to stage III.
u = u /(1 2 Dn) (7)f i
where Dn = change in porosity. Eq. (7) applies for the case inwhich compression occurs from stage 1 to stage 2, as illus-trated in Fig. 3(b). If liquids are squeezed out of the waste
EERING / JULY 1999
mass, as in the compression from stage 2 to stage 3, the finalmoisture uf will be below the value estimated by using (7).
On the other hand, since the gravimetric moisture contentis defined in terms of the weight of solids Ws, which remainsconstant while the waste undergoes compression, the gravi-metric moisture content of the waste does not change due tocompression of the waste if free liquid is not generated. In-stead, generation of free liquid due to compression of thewaste will result in a reduction of the gravimetric moisturecontent. Table 1 summarizes relevant information regardingthe moisture condition of a waste sample during the differentstages in the landfill vertical expansion illustrated in Fig. 3.
CASE HISTORY LANDFILL: FIELD ANDLABORATORY INVESTIGATION
General Description of Landfill
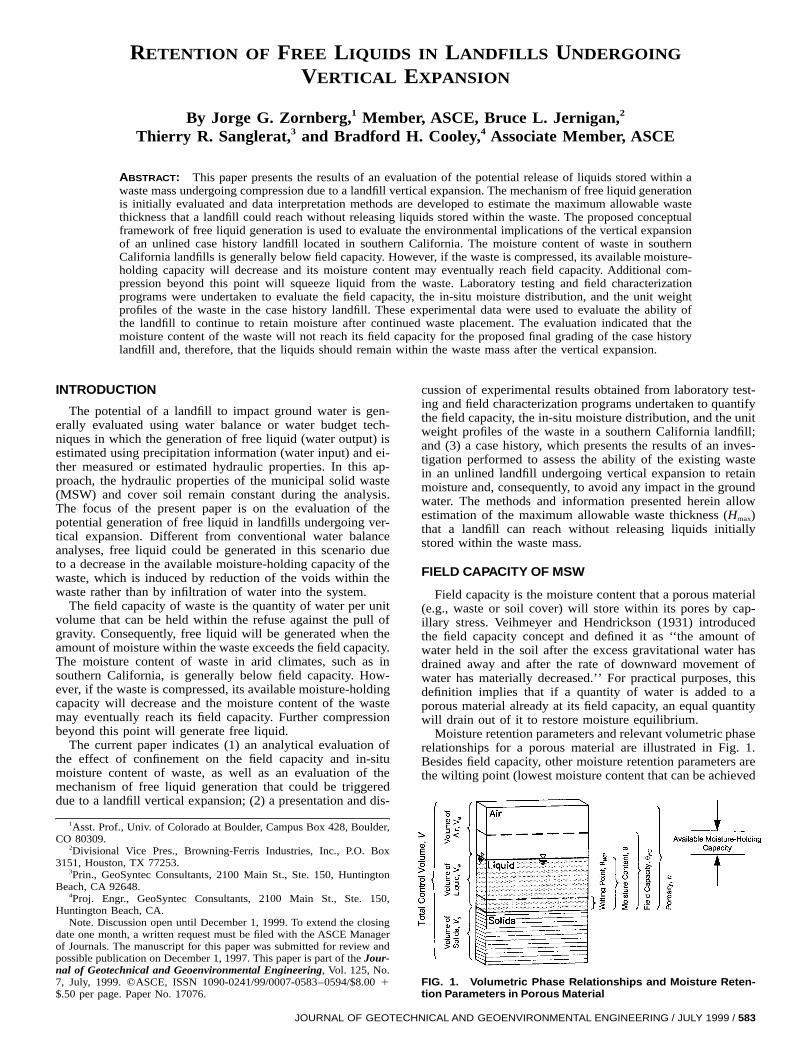
A case history is presented herein involving evaluation ofthe potential generation of free liquid due to a planned verticalexpansion of an existing unlined landfill. The evaluation con-siders the mechanism of free liquid generation described pre-viously and uses site-specific field capacity, in-situ moisturecontent, and total unit weight measurements of the waste ma-terial. The case history landfill is located in the San GabrielValley in Los Angeles County, California. The climate at thesite is semiarid, with yearly evapotranspiration greatly exceed-ing the average annual precipitation. As shown in Fig. 4, thelandfill is divided into two zones: Zone I, which is unlined andaccepts MSW; and Zone II, which is underlain by a multicom-ponent liner system and accepts inert waste. Liquids, sludges,or hazardous wastes have not been accepted at the landfill.
The topography of the site is the result of excavations from
JOURNAL OF GEOTEC
sand and gravel mining and landfill operations. The washingof the excavated materials during mining operations producedsilt with comparatively low-hydraulic conductivity that hasbeen hydraulically deposited in a series of ponds at the bottomof the excavation. The bottom 8–20 m of the landfill up to anelevation of 108 m (msl) is inert waste such as constructionand demolition debris. Nonhazardous MSW has been depos-ited from an elevation of 108 m to a current maximum ele-vation of 168 m. As part of a vertical expansion plan, wastewould be placed in Zone I of the landfill to final contours ata maximum elevation of 177 m. The waste has been placedin layers forming cells separated by daily cover soils, whichare generally imported soil or silt from the on-site silt sedimentponds. Liquid and gas extraction wells are currently in oper-ation at the landfill. The performance of the landfill is moni-tored by a series of ground water monitoring wells and gasmonitoring probes.
To characterize the geotechnical properties of the waste ma-terial at the site, laboratory testing and field characterizationprograms were implemented. As part of the field program,waste samples were recovered during the drilling and instal-lation of 20 new gas extraction wells into the landfill. Fig. 4shows the locations of the gas extraction wells from whichwaste material was sampled. In-situ unit weight measurementsof the waste were performed during the drilling of two of thedeeper gas extraction wells. Characterization tests were alsoperformed on the waste recovered from these borings. Thetests included measurement of moisture content, composition,and field capacity of the waste. Additionally, spectral analysisof surface wave (SASW) surveys (Kavazanjian et al. 1996)were performed at the landfill to measure the shear wave ve-locity and estimate the total unit weight profiles.
FIG. 4. Southern California Landfill
HNICAL AND GEOENVIRONMENTAL ENGINEERING / JULY 1999 / 587
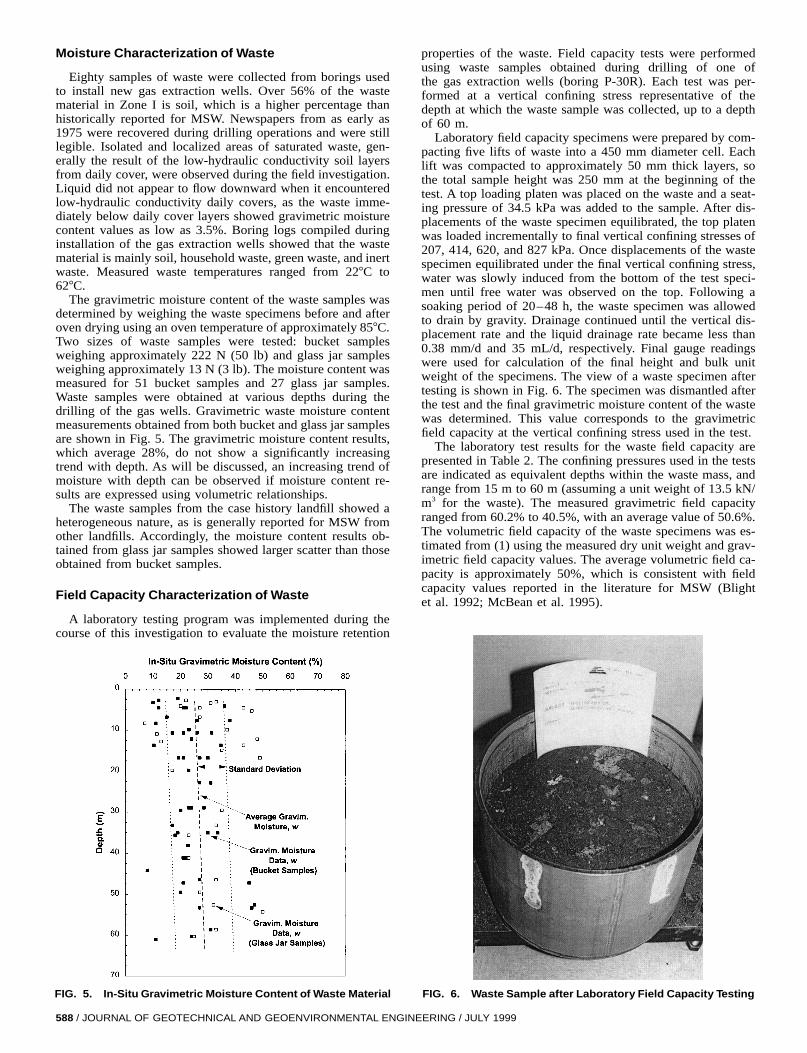
FIG. 5. In-Situ Gravimetric Moisture Content of Waste Material
Moisture Characterization of Waste
Eighty samples of waste were collected from borings usedto install new gas extraction wells. Over 56% of the wastematerial in Zone I is soil, which is a higher percentage thanhistorically reported for MSW. Newspapers from as early as1975 were recovered during drilling operations and were stilllegible. Isolated and localized areas of saturated waste, gen-erally the result of the low-hydraulic conductivity soil layersfrom daily cover, were observed during the field investigation.Liquid did not appear to flow downward when it encounteredlow-hydraulic conductivity daily covers, as the waste imme-diately below daily cover layers showed gravimetric moisturecontent values as low as 3.5%. Boring logs compiled duringinstallation of the gas extraction wells showed that the wastematerial is mainly soil, household waste, green waste, and inertwaste. Measured waste temperatures ranged from 227C to627C.
The gravimetric moisture content of the waste samples wasdetermined by weighing the waste specimens before and afteroven drying using an oven temperature of approximately 857C.Two sizes of waste samples were tested: bucket samplesweighing approximately 222 N (50 lb) and glass jar samplesweighing approximately 13 N (3 lb). The moisture content wasmeasured for 51 bucket samples and 27 glass jar samples.Waste samples were obtained at various depths during thedrilling of the gas wells. Gravimetric waste moisture contentmeasurements obtained from both bucket and glass jar samplesare shown in Fig. 5. The gravimetric moisture content results,which average 28%, do not show a significantly increasingtrend with depth. As will be discussed, an increasing trend ofmoisture with depth can be observed if moisture content re-sults are expressed using volumetric relationships.
The waste samples from the case history landfill showed aheterogeneous nature, as is generally reported for MSW fromother landfills. Accordingly, the moisture content results ob-tained from glass jar samples showed larger scatter than thoseobtained from bucket samples.
Field Capacity Characterization of Waste
A laboratory testing program was implemented during thecourse of this investigation to evaluate the moisture retention
588 / JOURNAL OF GEOTECHNICAL AND GEOENVIRONMENTAL ENGIN
FIG. 6. Waste Sample after Laboratory Field Capacity Testing
properties of the waste. Field capacity tests were performedusing waste samples obtained during drilling of one ofthe gas extraction wells (boring P-30R). Each test was per-formed at a vertical confining stress representative of thedepth at which the waste sample was collected, up to a depthof 60 m.
Laboratory field capacity specimens were prepared by com-pacting five lifts of waste into a 450 mm diameter cell. Eachlift was compacted to approximately 50 mm thick layers, sothe total sample height was 250 mm at the beginning of thetest. A top loading platen was placed on the waste and a seat-ing pressure of 34.5 kPa was added to the sample. After dis-placements of the waste specimen equilibrated, the top platenwas loaded incrementally to final vertical confining stresses of207, 414, 620, and 827 kPa. Once displacements of the wastespecimen equilibrated under the final vertical confining stress,water was slowly induced from the bottom of the test speci-men until free water was observed on the top. Following asoaking period of 20–48 h, the waste specimen was allowedto drain by gravity. Drainage continued until the vertical dis-placement rate and the liquid drainage rate became less than0.38 mm/d and 35 mL/d, respectively. Final gauge readingswere used for calculation of the final height and bulk unitweight of the specimens. The view of a waste specimen aftertesting is shown in Fig. 6. The specimen was dismantled afterthe test and the final gravimetric moisture content of the wastewas determined. This value corresponds to the gravimetricfield capacity at the vertical confining stress used in the test.
The laboratory test results for the waste field capacity arepresented in Table 2. The confining pressures used in the testsare indicated as equivalent depths within the waste mass, andrange from 15 m to 60 m (assuming a unit weight of 13.5 kN/m3 for the waste). The measured gravimetric field capacityranged from 60.2% to 40.5%, with an average value of 50.6%.The volumetric field capacity of the waste specimens was es-timated from (1) using the measured dry unit weight and grav-imetric field capacity values. The average volumetric field ca-pacity is approximately 50%, which is consistent with fieldcapacity values reported in the literature for MSW (Blightet al. 1992; McBean et al. 1995).
EERING / JULY 1999
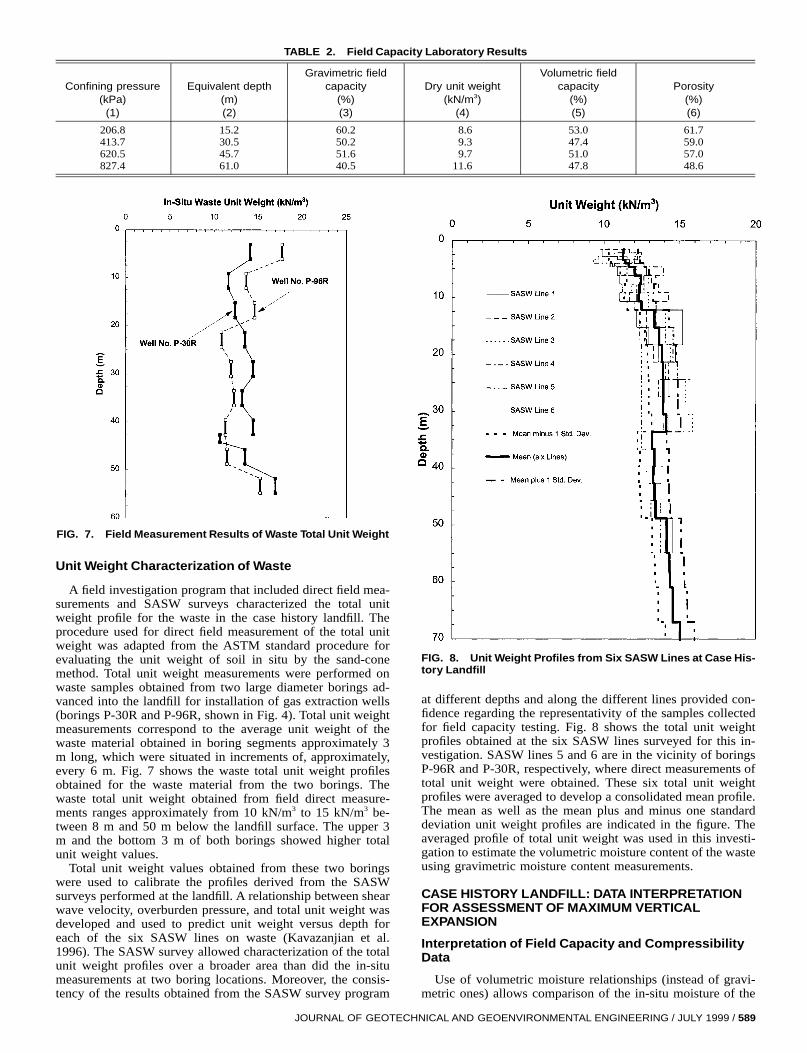
TABLE 2. Field Capacity Laboratory Results
Confining pressure(kPa)
(1)
Equivalent depth(m)(2)
Gravimetric fieldcapacity
(%)(3)
Dry unit weight(kN/m3)
(4)
Volumetric fieldcapacity
(%)(5)
Porosity(%)(6)
206.8413.7620.5827.4
15.230.545.761.0
60.250.251.640.5
8.69.39.7
11.6
53.047.451.047.8
61.759.057.048.6
FIG. 7. Field Measurement Results of Waste Total Unit Weight
Unit Weight Characterization of Waste
A field investigation program that included direct field mea-surements and SASW surveys characterized the total unitweight profile for the waste in the case history landfill. Theprocedure used for direct field measurement of the total unitweight was adapted from the ASTM standard procedure forevaluating the unit weight of soil in situ by the sand-conemethod. Total unit weight measurements were performed onwaste samples obtained from two large diameter borings ad-vanced into the landfill for installation of gas extraction wells(borings P-30R and P-96R, shown in Fig. 4). Total unit weightmeasurements correspond to the average unit weight of thewaste material obtained in boring segments approximately 3m long, which were situated in increments of, approximately,every 6 m. Fig. 7 shows the waste total unit weight profilesobtained for the waste material from the two borings. Thewaste total unit weight obtained from field direct measure-ments ranges approximately from 10 kN/m3 to 15 kN/m3 be-tween 8 m and 50 m below the landfill surface. The upper 3m and the bottom 3 m of both borings showed higher totalunit weight values.
Total unit weight values obtained from these two boringswere used to calibrate the profiles derived from the SASWsurveys performed at the landfill. A relationship between shearwave velocity, overburden pressure, and total unit weight wasdeveloped and used to predict unit weight versus depth foreach of the six SASW lines on waste (Kavazanjian et al.1996). The SASW survey allowed characterization of the totalunit weight profiles over a broader area than did the in-situmeasurements at two boring locations. Moreover, the consis-tency of the results obtained from the SASW survey program
JOURNAL OF GEOTEC
FIG. 8. Unit Weight Profiles from Six SASW Lines at Case His-tory Landfill
at different depths and along the different lines provided con-fidence regarding the representativity of the samples collectedfor field capacity testing. Fig. 8 shows the total unit weightprofiles obtained at the six SASW lines surveyed for this in-vestigation. SASW lines 5 and 6 are in the vicinity of boringsP-96R and P-30R, respectively, where direct measurements oftotal unit weight were obtained. These six total unit weightprofiles were averaged to develop a consolidated mean profile.The mean as well as the mean plus and minus one standarddeviation unit weight profiles are indicated in the figure. Theaveraged profile of total unit weight was used in this investi-gation to estimate the volumetric moisture content of the wasteusing gravimetric moisture content measurements.
CASE HISTORY LANDFILL: DATA INTERPRETATIONFOR ASSESSMENT OF MAXIMUM VERTICALEXPANSION
Interpretation of Field Capacity and CompressibilityData
Use of volumetric moisture relationships (instead of gravi-metric ones) allows comparison of the in-situ moisture of the
HNICAL AND GEOENVIRONMENTAL ENGINEERING / JULY 1999 / 589
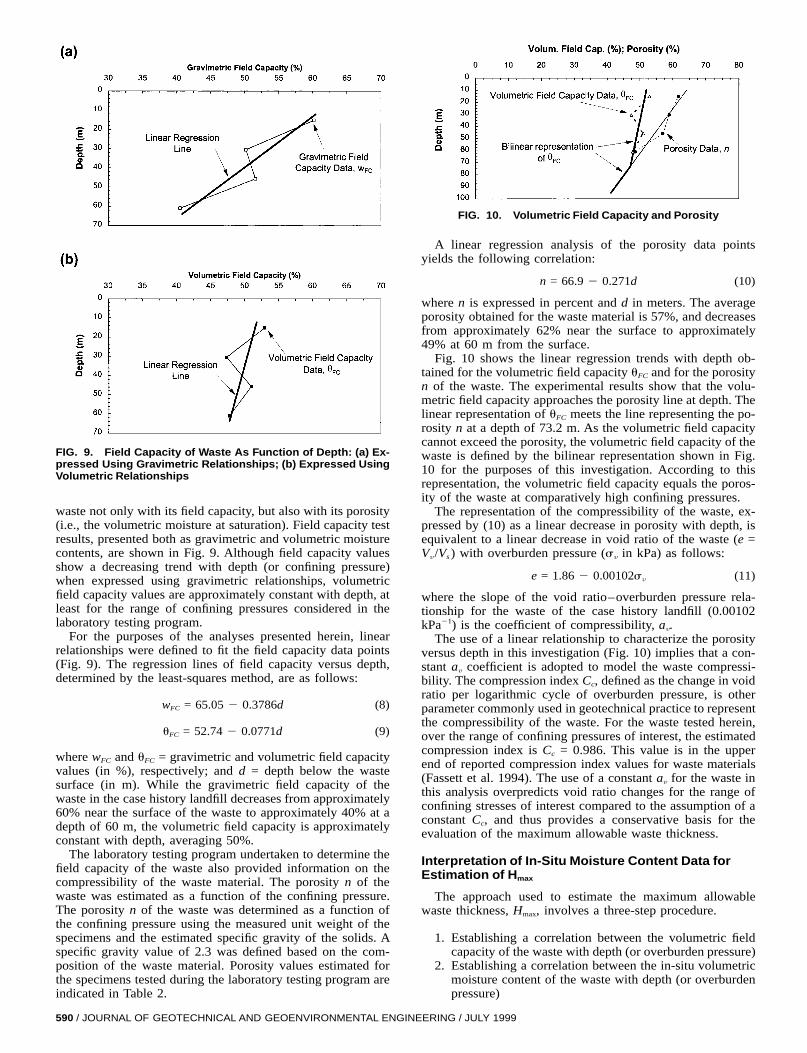
FIG. 9. Field Capacity of Waste As Function of Depth: (a) Ex-pressed Using Gravimetric Relationships; (b) Expressed UsingVolumetric Relationships
waste not only with its field capacity, but also with its porosity(i.e., the volumetric moisture at saturation). Field capacity testresults, presented both as gravimetric and volumetric moisturecontents, are shown in Fig. 9. Although field capacity valuesshow a decreasing trend with depth (or confining pressure)when expressed using gravimetric relationships, volumetricfield capacity values are approximately constant with depth, atleast for the range of confining pressures considered in thelaboratory testing program.
For the purposes of the analyses presented herein, linearrelationships were defined to fit the field capacity data points(Fig. 9). The regression lines of field capacity versus depth,determined by the least-squares method, are as follows:
w = 65.05 2 0.3786d (8)FC
u = 52.74 2 0.0771d (9)FC
where wFC and uFC = gravimetric and volumetric field capacityvalues (in %), respectively; and d = depth below the wastesurface (in m). While the gravimetric field capacity of thewaste in the case history landfill decreases from approximately60% near the surface of the waste to approximately 40% at adepth of 60 m, the volumetric field capacity is approximatelyconstant with depth, averaging 50%.
The laboratory testing program undertaken to determine thefield capacity of the waste also provided information on thecompressibility of the waste material. The porosity n of thewaste was estimated as a function of the confining pressure.The porosity n of the waste was determined as a function ofthe confining pressure using the measured unit weight of thespecimens and the estimated specific gravity of the solids. Aspecific gravity value of 2.3 was defined based on the com-position of the waste material. Porosity values estimated forthe specimens tested during the laboratory testing program areindicated in Table 2.
590 / JOURNAL OF GEOTECHNICAL AND GEOENVIRONMENTAL ENGIN
FIG. 10. Volumetric Field Capacity and Porosity
A linear regression analysis of the porosity data pointsyields the following correlation:
n = 66.9 2 0.271d (10)
where n is expressed in percent and d in meters. The averageporosity obtained for the waste material is 57%, and decreasesfrom approximately 62% near the surface to approximately49% at 60 m from the surface.
Fig. 10 shows the linear regression trends with depth ob-tained for the volumetric field capacity uFC and for the porosityn of the waste. The experimental results show that the volu-metric field capacity approaches the porosity line at depth. Thelinear representation of uFC meets the line representing the po-rosity n at a depth of 73.2 m. As the volumetric field capacitycannot exceed the porosity, the volumetric field capacity of thewaste is defined by the bilinear representation shown in Fig.10 for the purposes of this investigation. According to thisrepresentation, the volumetric field capacity equals the poros-ity of the waste at comparatively high confining pressures.
The representation of the compressibility of the waste, ex-pressed by (10) as a linear decrease in porosity with depth, isequivalent to a linear decrease in void ratio of the waste (e =Vv /Vs ) with overburden pressure (sv in kPa) as follows:
e = 1.86 2 0.00102s (11)v
where the slope of the void ratio–overburden pressure rela-tionship for the waste of the case history landfill (0.00102kPa21) is the coefficient of compressibility, av.
The use of a linear relationship to characterize the porosityversus depth in this investigation (Fig. 10) implies that a con-stant av coefficient is adopted to model the waste compressi-bility. The compression index Cc, defined as the change in voidratio per logarithmic cycle of overburden pressure, is otherparameter commonly used in geotechnical practice to representthe compressibility of the waste. For the waste tested herein,over the range of confining pressures of interest, the estimatedcompression index is Cc = 0.986. This value is in the upperend of reported compression index values for waste materials(Fassett et al. 1994). The use of a constant av for the waste inthis analysis overpredicts void ratio changes for the range ofconfining stresses of interest compared to the assumption of aconstant Cc, and thus provides a conservative basis for theevaluation of the maximum allowable waste thickness.
Interpretation of In-Situ Moisture Content Data forEstimation of Hmax
The approach used to estimate the maximum allowablewaste thickness, Hmax, involves a three-step procedure.
1. Establishing a correlation between the volumetric fieldcapacity of the waste with depth (or overburden pressure)
2. Establishing a correlation between the in-situ volumetricmoisture content of the waste with depth (or overburdenpressure)
EERING / JULY 1999
3. Determining the depth (or overburden pressure) at whichthe in-situ moisture content of the waste reaches its fieldcapacity, based on the correlations defined in steps 1 and2. This depth is Hmax.
A correlation of the volumetric field capacity with depth(step 1) was already established by the bilinear representationshown in Fig. 10. Correlations of the in-situ volumetric mois-ture content with depth (step 2) can be defined using availabledata for the waste material in the case history landfill. How-ever, different volumetric moisture content correlations (a totalof four) could be established in this investigation consideringdifferent sets of available data. These correlations were ob-tained by combining the following two selections of availableinformation:
• Type of data (and phase relationships) selected to definethe correlations. A correlation for the in-situ volumetricmoisture content with depth can be defined using thegravimetric moisture content measurements and phase re-lationships that use either the compressibility data fromthe laboratory testing program or the total unit weight datafrom the field characterization program.
• Size of the samples selected to define the correlations.Bucket samples and glass jar samples weighing 222 Nand 13 N, respectively, were collected in the field inves-tigation program to characterize the waste moisture con-tent. A correlation for the in-situ volumetric moisture con-tent can be defined using in-situ gravimetric moisturecontent measurements from the more representativebucket samples only or moisture measurements obtainedfrom all available samples (bucket and glass jar samples).
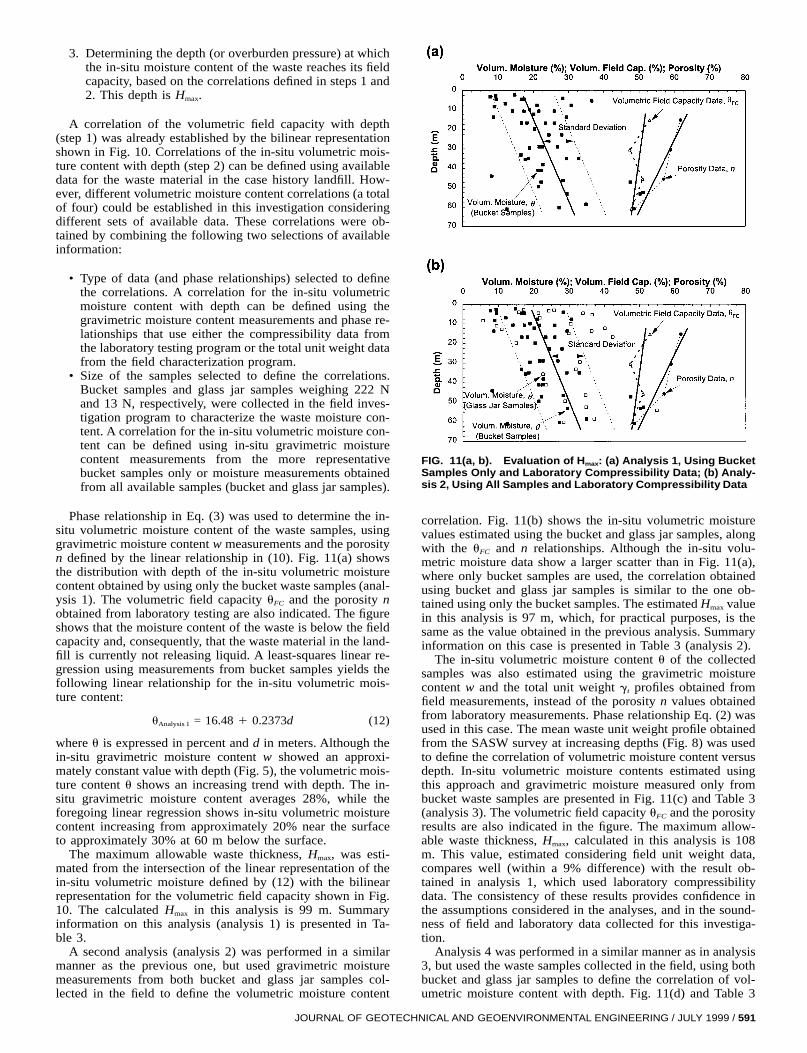
Phase relationship in Eq. (3) was used to determine the in-situ volumetric moisture content of the waste samples, usinggravimetric moisture content w measurements and the porosityn defined by the linear relationship in (10). Fig. 11(a) showsthe distribution with depth of the in-situ volumetric moisturecontent obtained by using only the bucket waste samples (anal-ysis 1). The volumetric field capacity uFC and the porosity nobtained from laboratory testing are also indicated. The figureshows that the moisture content of the waste is below the fieldcapacity and, consequently, that the waste material in the land-fill is currently not releasing liquid. A least-squares linear re-gression using measurements from bucket samples yields thefollowing linear relationship for the in-situ volumetric mois-ture content:
u = 16.48 1 0.2373d (12)Analysis 1
where u is expressed in percent and d in meters. Although thein-situ gravimetric moisture content w showed an approxi-mately constant value with depth (Fig. 5), the volumetric mois-ture content u shows an increasing trend with depth. The in-situ gravimetric moisture content averages 28%, while theforegoing linear regression shows in-situ volumetric moisturecontent increasing from approximately 20% near the surfaceto approximately 30% at 60 m below the surface.
The maximum allowable waste thickness, Hmax, was esti-mated from the intersection of the linear representation of thein-situ volumetric moisture defined by (12) with the bilinearrepresentation for the volumetric field capacity shown in Fig.10. The calculated Hmax in this analysis is 99 m. Summaryinformation on this analysis (analysis 1) is presented in Ta-ble 3.
A second analysis (analysis 2) was performed in a similarmanner as the previous one, but used gravimetric moisturemeasurements from both bucket and glass jar samples col-lected in the field to define the volumetric moisture content
JOURNAL OF GEOTEC
FIG. 11(a, b). Evaluation of Hmax: (a) Analysis 1, Using BucketSamples Only and Laboratory Compressibility Data; (b) Analy-sis 2, Using All Samples and Laboratory Compressibility Data
correlation. Fig. 11(b) shows the in-situ volumetric moisturevalues estimated using the bucket and glass jar samples, alongwith the uFC and n relationships. Although the in-situ volu-metric moisture data show a larger scatter than in Fig. 11(a),where only bucket samples are used, the correlation obtainedusing bucket and glass jar samples is similar to the one ob-tained using only the bucket samples. The estimated Hmax valuein this analysis is 97 m, which, for practical purposes, is thesame as the value obtained in the previous analysis. Summaryinformation on this case is presented in Table 3 (analysis 2).
The in-situ volumetric moisture content u of the collectedsamples was also estimated using the gravimetric moisturecontent w and the total unit weight gt profiles obtained fromfield measurements, instead of the porosity n values obtainedfrom laboratory measurements. Phase relationship Eq. (2) wasused in this case. The mean waste unit weight profile obtainedfrom the SASW survey at increasing depths (Fig. 8) was usedto define the correlation of volumetric moisture content versusdepth. In-situ volumetric moisture contents estimated usingthis approach and gravimetric moisture measured only frombucket waste samples are presented in Fig. 11(c) and Table 3(analysis 3). The volumetric field capacity uFC and the porosityresults are also indicated in the figure. The maximum allow-able waste thickness, Hmax, calculated in this analysis is 108m. This value, estimated considering field unit weight data,compares well (within a 9% difference) with the result ob-tained in analysis 1, which used laboratory compressibilitydata. The consistency of these results provides confidence inthe assumptions considered in the analyses, and in the sound-ness of field and laboratory data collected for this investiga-tion.
Analysis 4 was performed in a similar manner as in analysis3, but used the waste samples collected in the field, using bothbucket and glass jar samples to define the correlation of vol-umetric moisture content with depth. Fig. 11(d) and Table 3
HNICAL AND GEOENVIRONMENTAL ENGINEERING / JULY 1999 / 591
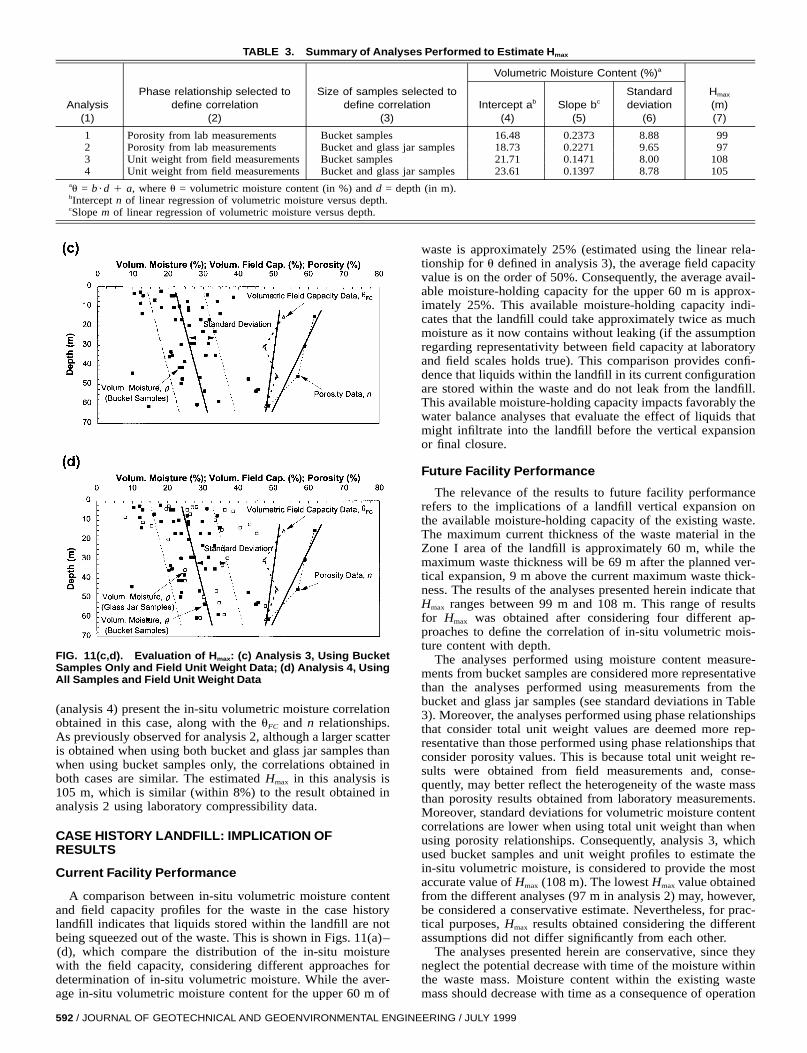
TABLE 3. Summary of Analyses Performed to Estimate Hmax
Analysis(1)
Phase relationship selected todefine correlation
(2)
Size of samples selected todefine correlation
(3)
Volumetric Moisture Content (%)a
Intercept ab
(4)Slope bc
(5)
Standarddeviation
(6)
Hmax
(m)(7)
1 Porosity from lab measurements Bucket samples 16.48 0.2373 8.88 992 Porosity from lab measurements Bucket and glass jar samples 18.73 0.2271 9.65 973 Unit weight from field measurements Bucket samples 21.71 0.1471 8.00 1084 Unit weight from field measurements Bucket and glass jar samples 23.61 0.1397 8.78 105
au = b ?d 1 a, where u = volumetric moisture content (in %) and d = depth (in m).bIntercept n of linear regression of volumetric moisture versus depth.cSlope m of linear regression of volumetric moisture versus depth.
FIG. 11(c,d). Evaluation of Hmax: (c) Analysis 3, Using BucketSamples Only and Field Unit Weight Data; (d) Analysis 4, UsingAll Samples and Field Unit Weight Data
(analysis 4) present the in-situ volumetric moisture correlationobtained in this case, along with the uFC and n relationships.As previously observed for analysis 2, although a larger scatteris obtained when using both bucket and glass jar samples thanwhen using bucket samples only, the correlations obtained inboth cases are similar. The estimated Hmax in this analysis is105 m, which is similar (within 8%) to the result obtained inanalysis 2 using laboratory compressibility data.
CASE HISTORY LANDFILL: IMPLICATION OFRESULTS
Current Facility Performance
A comparison between in-situ volumetric moisture contentand field capacity profiles for the waste in the case historylandfill indicates that liquids stored within the landfill are notbeing squeezed out of the waste. This is shown in Figs. 11(a)–(d), which compare the distribution of the in-situ moisturewith the field capacity, considering different approaches fordetermination of in-situ volumetric moisture. While the aver-age in-situ volumetric moisture content for the upper 60 m of
592 / JOURNAL OF GEOTECHNICAL AND GEOENVIRONMENTAL ENGIN
waste is approximately 25% (estimated using the linear rela-tionship for u defined in analysis 3), the average field capacityvalue is on the order of 50%. Consequently, the average avail-able moisture-holding capacity for the upper 60 m is approx-imately 25%. This available moisture-holding capacity indi-cates that the landfill could take approximately twice as muchmoisture as it now contains without leaking (if the assumptionregarding representativity between field capacity at laboratoryand field scales holds true). This comparison provides confi-dence that liquids within the landfill in its current configurationare stored within the waste and do not leak from the landfill.This available moisture-holding capacity impacts favorably thewater balance analyses that evaluate the effect of liquids thatmight infiltrate into the landfill before the vertical expansionor final closure.
Future Facility Performance
The relevance of the results to future facility performancerefers to the implications of a landfill vertical expansion onthe available moisture-holding capacity of the existing waste.The maximum current thickness of the waste material in theZone I area of the landfill is approximately 60 m, while themaximum waste thickness will be 69 m after the planned ver-tical expansion, 9 m above the current maximum waste thick-ness. The results of the analyses presented herein indicate thatHmax ranges between 99 m and 108 m. This range of resultsfor Hmax was obtained after considering four different ap-proaches to define the correlation of in-situ volumetric mois-ture content with depth.
The analyses performed using moisture content measure-ments from bucket samples are considered more representativethan the analyses performed using measurements from thebucket and glass jar samples (see standard deviations in Table3). Moreover, the analyses performed using phase relationshipsthat consider total unit weight values are deemed more rep-resentative than those performed using phase relationships thatconsider porosity values. This is because total unit weight re-sults were obtained from field measurements and, conse-quently, may better reflect the heterogeneity of the waste massthan porosity results obtained from laboratory measurements.Moreover, standard deviations for volumetric moisture contentcorrelations are lower when using total unit weight than whenusing porosity relationships. Consequently, analysis 3, whichused bucket samples and unit weight profiles to estimate thein-situ volumetric moisture, is considered to provide the mostaccurate value of Hmax (108 m). The lowest Hmax value obtainedfrom the different analyses (97 m in analysis 2) may, however,be considered a conservative estimate. Nevertheless, for prac-tical purposes, Hmax results obtained considering the differentassumptions did not differ significantly from each other.
The analyses presented herein are conservative, since theyneglect the potential decrease with time of the moisture withinthe waste mass. Moisture content within the existing wastemass should decrease with time as a consequence of operation
EERING / JULY 1999
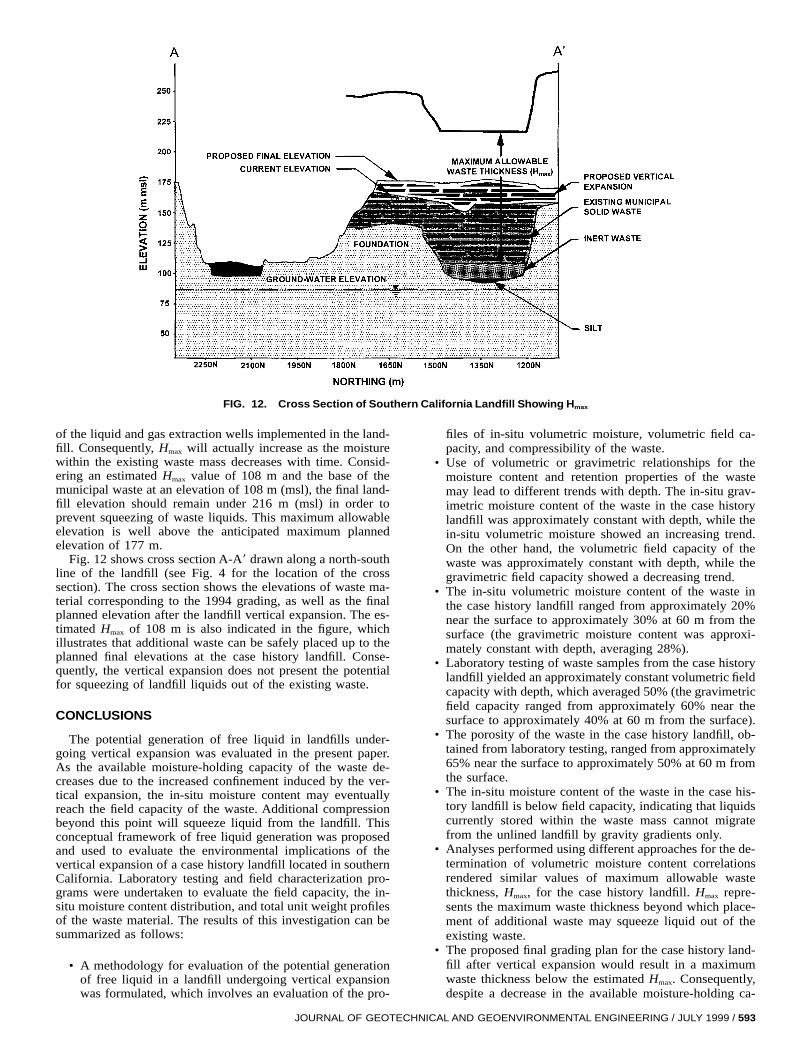
FIG. 12. Cross Section of Southern California Landfill Showing Hmax
of the liquid and gas extraction wells implemented in the land-fill. Consequently, Hmax will actually increase as the moisturewithin the existing waste mass decreases with time. Consid-ering an estimated Hmax value of 108 m and the base of themunicipal waste at an elevation of 108 m (msl), the final land-fill elevation should remain under 216 m (msl) in order toprevent squeezing of waste liquids. This maximum allowableelevation is well above the anticipated maximum plannedelevation of 177 m.
Fig. 12 shows cross section A-A9 drawn along a north-southline of the landfill (see Fig. 4 for the location of the crosssection). The cross section shows the elevations of waste ma-terial corresponding to the 1994 grading, as well as the finalplanned elevation after the landfill vertical expansion. The es-timated Hmax of 108 m is also indicated in the figure, whichillustrates that additional waste can be safely placed up to theplanned final elevations at the case history landfill. Conse-quently, the vertical expansion does not present the potentialfor squeezing of landfill liquids out of the existing waste.
CONCLUSIONS
The potential generation of free liquid in landfills under-going vertical expansion was evaluated in the present paper.As the available moisture-holding capacity of the waste de-creases due to the increased confinement induced by the ver-tical expansion, the in-situ moisture content may eventuallyreach the field capacity of the waste. Additional compressionbeyond this point will squeeze liquid from the landfill. Thisconceptual framework of free liquid generation was proposedand used to evaluate the environmental implications of thevertical expansion of a case history landfill located in southernCalifornia. Laboratory testing and field characterization pro-grams were undertaken to evaluate the field capacity, the in-situ moisture content distribution, and total unit weight profilesof the waste material. The results of this investigation can besummarized as follows:
• A methodology for evaluation of the potential generationof free liquid in a landfill undergoing vertical expansionwas formulated, which involves an evaluation of the pro-
JOURNAL OF GEOTECH
files of in-situ volumetric moisture, volumetric field ca-pacity, and compressibility of the waste.
• Use of volumetric or gravimetric relationships for themoisture content and retention properties of the wastemay lead to different trends with depth. The in-situ grav-imetric moisture content of the waste in the case historylandfill was approximately constant with depth, while thein-situ volumetric moisture showed an increasing trend.On the other hand, the volumetric field capacity of thewaste was approximately constant with depth, while thegravimetric field capacity showed a decreasing trend.
• The in-situ volumetric moisture content of the waste inthe case history landfill ranged from approximately 20%near the surface to approximately 30% at 60 m from thesurface (the gravimetric moisture content was approxi-mately constant with depth, averaging 28%).
• Laboratory testing of waste samples from the case historylandfill yielded an approximately constant volumetric fieldcapacity with depth, which averaged 50% (the gravimetricfield capacity ranged from approximately 60% near thesurface to approximately 40% at 60 m from the surface).
• The porosity of the waste in the case history landfill, ob-tained from laboratory testing, ranged from approximately65% near the surface to approximately 50% at 60 m fromthe surface.
• The in-situ moisture content of the waste in the case his-tory landfill is below field capacity, indicating that liquidscurrently stored within the waste mass cannot migratefrom the unlined landfill by gravity gradients only.
• Analyses performed using different approaches for the de-termination of volumetric moisture content correlationsrendered similar values of maximum allowable wastethickness, Hmax, for the case history landfill. Hmax repre-sents the maximum waste thickness beyond which place-ment of additional waste may squeeze liquid out of theexisting waste.
• The proposed final grading plan for the case history land-fill after vertical expansion would result in a maximumwaste thickness below the estimated Hmax. Consequently,despite a decrease in the available moisture-holding ca-
NICAL AND GEOENVIRONMENTAL ENGINEERING / JULY 1999 / 593
pacity of the waste, landfill liquids should remain storedwithin the waste after the vertical expansion.
ACKNOWLEDGMENTS
The work presented in the current paper was prompted by evaluationsof the retention of free liquids in landfills made by the writers. The sup-port of GeoSyntec Consultants is acknowledged. The writers are gratefulto Dr. R. D. Espinoza and Dr. E. Kavazanjian Jr. for their assistanceduring the investigation.
APPENDIX I. REFERENCES
Blight, G. E., Ball, J. M., and Blight, J. J. (1992). ‘‘Moisture and suctionin sanitary landfills in semiarid areas.’’ J. Envir. Engrg., ASCE, 118(6),865–877.
Coumoulos, D. G., Koryalos, T. P., Metaxa, J. L., and Gioka, D. A.(1995). ‘‘Geotechnical investigations at the main landfill of Athens.’’Proc., 5th Int. Landfill Symp., Sardinia, Italy, 2, 885–895.
Edil, T. B., Ranguette, V. J., and Wuellner, W. W. (1990). ‘‘Settlement ofmunicipal refuse.’’ Geotechnics of waste fills—Theory and practice;STP 1070, A. O. Landva and G. D. Knowles, eds., ASTM, West Con-shohoken, Pa., 225–239.
Fassett, J. B., Leonards, G. A., and Repetto, P. C. (1994). ‘‘Geotechnicalproperties of municipal solid wastes and their use in landfill design.’’Proc., Waste Tech ’94 Conf., National Solid Waste Management As-sociation, Charleston, S.C.
Fungaroli, A., and Steiner, R. (1979). ‘‘Investigation of sanitary landfillbehavior—Volume I.’’ Final Rep. EPA-600-2-79-053a, EnvironmentalProtection Agency, Washington, D.C.
Gabr, M. A., and Valero, S. N. (1995). ‘‘Geotechnical properties of mu-nicipal solid waste.’’ ASTM Geotech. Testing J., 18(2), 241–251.
Kavazanjian, E. Jr., Matasovic, N., Stokoe, K. H. II, and Bray, J. D.(1996). ‘‘In situ shear wave velocity of solid waste from surface wavemeasurements.’’ Proc., 2nd Int. Conf. on Envir. Geotechnics, A. A.Balkema, Rotterdam, 97–102.
Landva, A. O., and Clark, J. I. (1990). ‘‘Geotechnics of waste fills.’’Geotechnics of waste fill—Theory and practice; STP 1070, A. O.Landva and G. D. Knowles, eds., ASTM, West Conshohoken, Pa., 86–103.
McBean, E. A., Rovers, F. A., and Farquhar, G. J. (1995). Solid wastelandfill engineering and design. Prentice-Hall, Englewood Cliffs, N.J.
Othman, M. A., Bonaparte, R., Gross, B. A., and Schmertmann, G. R.(1995). ‘‘Design of MSW landfill final cover systems.’’ Landfill clo-sures environmental protection and land recovery. Geotech. Spec. Publ.53. ASCE, Reston, Va., 218–257.
Schroeder, P. R., Dozier, T. S., Zappi, P. A., McEnroe, B. M., Sjostrom,J. W., and Peyton, R. L. (1994). ‘‘The hydrologic evaluation of landfillperformance (HELP) model: Engineering documentation for version3.’’ EPA/600/R-94/168b. U.S. Environmental Protection Agency RiskReduction Engineering Laboratory, Cincinnati, Ohio.
594 / JOURNAL OF GEOTECHNICAL AND GEOENVIRONMENTAL ENGI
Sowers, G. F. (1968). ‘‘Foundation problems in sanitary land fill.’’ J.Sanitary Engrg. Div., ASCE, 94(1), 103–116.
Sowers, G. F. (1973). ‘‘Settlement of waste disposal fills.’’ Proc., 8th Int.Conf. on Soil. Mech. and Found. Engrg., Moscow, 207–210.
Veihmeyer, F. J., and Hendrickson, A. H. (1931). ‘‘The moisture equiv-alent as a measure of the field capacity of soils.’’ Soil Sci., 32, 181–194.
‘‘Waste mass characterization.’’ (1996). Rep. No. SWP-4 Prepared forNew Cure, Inc. by GeoSyntec Consultants, Operating Industries, Inc.Landfill, Monterey Park, Calif.
Zeiss, C., and Major, W. (1993). ‘‘Moisture flow through municipal solidwaste: Patterns and characteristics.’’ J. Envir. Sys., 22, 211–231.
APPENDIX II. NOTATION
The following symbols are used in this paper:
av = coefficient of compressibility (kPa21);Cc = compression index (dimensionless);d = depth (m);e = void ratio (dimensionless);
Gs = specific gravity of solids (dimensionless);H = waste thickness (m);
Hmax = maximum allowable waste thickness (m);n = porosity (%);
nI, nII, nIII = porosity at stages I, II, and III (Fig. 3) (%);V = total control volume (m3);Vs = volume of solids (m3);Vv = volume of voids (m3);Vw = volume of water (m3);Ws = weight of solids (N);Ww = weight of water (N);
w = gravimetric moisture content (%);wFC = gravimetric field capacity (%);
wI, wII, wIII = gravimetric moisture content at stages I, II, and III(Fig. 3) (%);
gd = dry unit weight of waste or soil (kN/m3);gt = total (wet) unit weight of waste or soil (kN/m3);gw = unit weight of water (kN/m3);Dn = change in porosity (%);
DwFC = change in gravimetric field capacity (%);DuFC = change in volumetric field capacity (%);
u = volumetric moisture content (%);uFC = volumetric field capacity (%);uWP = wilting point (%);
uI, uII, uIII = volumetric moisture content at stages I, II, and III(Fig. 3) (%); and
sv = vertical stress (kPa).
NEERING / JULY 1999