Embed Size (px)
Citation preview

The Cryosphere, 9, 1633–1648, 2015
www.the-cryosphere.net/9/1633/2015/
doi:10.5194/tc-9-1633-2015
© Author(s) 2015. CC Attribution 3.0 License.
Retrieving the paleoclimatic signal from the deeper part of the
EPICA Dome C ice core
J.-L. Tison1, M. de Angelis2, G. Littot3, E. Wolff3, H. Fischer4, M. Hansson5, M. Bigler4, R. Udisti6, A. Wegner7,
J. Jouzel8, B. Stenni9, S. Johnsen†,10, V. Masson-Delmotte8, A. Landais8, V. Lipenkov11, L. Loulergue2,
J.-M. Barnola†,2, J.-R. Petit2, B. Delmonte12, G. Dreyfus13, D. Dahl-Jensen10, G. Durand2, B. Bereiter4, A. Schilt4,
R. Spahni4, K. Pol3, R. Lorrain1, R. Souchez1, and D. Samyn14
1Laboratoire de Glaciologie, Université Libre de Bruxelles, CP 160/03, 50, av. F.D. Roosevelt, 1050-Bruxelles, Belgium2Laboratoire de Glaciologie et Géophysique de l’Environnement, 54, Rue Molière Domaine Universitaire
38402 Saint-Martin d’Hères, France3British Antarctic Survey, High Cross, Madingley Road, Cambridge CB3 OET, UK4Climate and Environmental Physics, Physics Institute & Oeschger Centre for Climate Change Research, University of Bern,
Sidlerstrasse 5, 3012 Bern, Switzerland5Department of Physical Geography and Quaternary Geology, Stockholm University, 106 91 Stockholm, Sweden6University of Florence. Chemistry Dept., via della Lastruccia, 3 – 50019 Sesto Fiorentino, Florence, Italy7Alfred Wegener Institute, Bremerhaven, Germany8Laboratoire des Sciences du Climat et de l’Environnement/Institut Pierre Simon Laplace, CEA-CNRS-UVSQ, CEA Saclay,
91191, Gif-sur-Yvette, France9Dipartimento di Scienze Ambientali, Informatica e Statistica, Università Ca Foscari, Venezia, Italy10Niels Bohr Institute, Juliane Maries Vej 30, 2100 Copenhagen, Denmark11Arctic and Antarctic Research Institute, 38 Bering Str., St. Petersburg, Russia12DISAT, Dept. of Earth and Environmental Sciences, University Milano Bicocca, Piazza della Scienza 1, 20126 Milano, Italy13Office of Policy and International Affairs, US Department of Energy, Washington, DC 20585, USA14Nagaoka University of Technology, 1603-1 Kamitomioka, Nagaoka, Niigata 940-2188, Japan†deceased
Correspondence to: J.-L. Tison ([email protected])
Received: 13 January 2015 – Published in The Cryosphere Discuss.: 28 January 2015
Revised: 1 July 2015 – Accepted: 13 July 2015 – Published: 20 August 2015
Abstract. An important share of paleoclimatic information
is buried within the lowermost layers of deep ice cores. Be-
cause improving our records further back in time is one of
the main challenges in the near future, it is essential to judge
how deep these records remain unaltered, since the proxim-
ity of the bedrock is likely to interfere both with the recorded
temporal sequence and the ice properties. In this paper, we
present a multiparametric study (δD-δ18Oice, δ18Oatm, total
air content, CO2, CH4, N2O, dust, high-resolution chem-
istry, ice texture) of the bottom 60 m of the EPICA (Euro-
pean Project for Ice Coring in Antarctica) Dome C ice core
from central Antarctica. These bottom layers were subdi-
vided into two distinct facies: the lower 12 m showing vis-
ible solid inclusions (basal dispersed ice facies) and the up-
per 48 m, which we will refer to as the “basal clean ice fa-
cies”. Some of the data are consistent with a pristine paleocli-
matic signal, others show clear anomalies. It is demonstrated
that neither large-scale bottom refreezing of subglacial wa-
ter, nor mixing (be it internal or with a local basal end
term from a previous/initial ice sheet configuration) can ex-
plain the observed bottom-ice properties. We focus on the
high-resolution chemical profiles and on the available re-
mote sensing data on the subglacial topography of the site
to propose a mechanism by which relative stretching of the
bottom-ice sheet layers is made possible, due to the progres-
sively confining effect of subglacial valley sides. This stress
Published by Copernicus Publications on behalf of the European Geosciences Union.
1634 J.-L. Tison et al.: Retrieving the paleoclimatic signal from the deeper part of the EPICA Dome C ice core
field change, combined with bottom-ice temperature close to
the pressure melting point, induces accelerated migration re-
crystallization, which results in spatial chemical sorting of
the impurities, depending on their state (dissolved vs. solid)
and if they are involved or not in salt formation. This chem-
ical sorting effect is responsible for the progressive build-up
of the visible solid aggregates that therefore mainly originate
“from within”, and not from incorporation processes of de-
bris from the ice sheet’s substrate. We further discuss how the
proposed mechanism is compatible with the other ice prop-
erties described. We conclude that the paleoclimatic signal is
only marginally affected in terms of global ice properties at
the bottom of EPICA Dome C, but that the timescale was
considerably distorted by mechanical stretching of MIS20
due to the increasing influence of the subglacial topography,
a process that might have started well above the bottom ice. A
clear paleoclimatic signal can therefore not be inferred from
the deeper part of the EPICA Dome C ice core. Our work
suggests that the existence of a flat monotonic ice–bedrock
interface, extending for several times the ice thickness, would
be a crucial factor in choosing a future “oldest ice” drilling
location in Antarctica.
1 Paleoclimatic signals in basal layers of deep ice cores
Deep ice cores retrieved from the two present-day major ice
sheets on Earth, Greenland in the north and Antarctica in the
south, delivered a wealth of unique paleoclimatic archives
over the last decades. These allowed reconstruction of global
climatic and environmental conditions over the last 800 000
years, including unprecedented records of cyclic changes in
the composition of greenhouse gases (CO2, CH4, N2O). An
important share of that paleoclimatic information is buried
within the lowermost sections of those deep ice cores, due to
the mechanical thinning of annual accumulation layers with
depth. Improving the records further back in time is there-
fore one of the main challenges of ice core science in the
near future (IPICS, 2009). A major concern in this regard is
to judge how far down we can trust the paleoclimatic sig-
nals stored within the ice, since the proximity of the bedrock
is likely to interfere both with the recorded temporal se-
quence and with the ice properties. This in turn is closely
linked to the thermal and hydrological regime at the bottom
of the ice sheet, as shown previously in the literature de-
scribing basal layers of deep ice cores (e.g. Goodwin, 1993;
Gow et al., 1979; Gow and Meese, 1996; Herron and Lang-
way, 1979; Jouzel et al., 1999; Koerner and Fisher, 1979;
Souchez, 1997; Souchez et al., 1993, 1995a, b, 2000a, 2002b,
2003, 2006, 1994, 1998; Tison et al., 1994, 1998, Weis et
al., 1997). In some cases, where the ice–bedrock interface is
clearly below the pressure-melting point (pmp) as, for exam-
ple, at the GRIP (−9 ◦C) or the Dye-3 (−12 ◦C) ice coring
sites in Greenland, single or multiple mixing events between
the present-day ice sheet ice and local ice remnants of pre-
vious (or even initial) ice sheet configurations are encoun-
tered (Souchez, 1997; Souchez et al., 1994, 1998, 2000b;
Verbeke et al., 2002). Where the ice–bedrock interface is at
the pmp, the meteoric ice has the potential to melt at a rate
that would depend on the heat budget at the ice–bedrock in-
terface (geothermal heat flux, internal friction and conduc-
tion through the overlying ice). In some cases, where the
subglacial topography allows it, like at the Antarctic Vos-
tok site, a subglacial lake will exist. Again, depending on
the heat budget but also on the subglacial lake water circu-
lation pattern, lake ice will form at the ice–water interface
in substantial amounts (e.g. Jouzel et al., 1999; Souchez et
al., 2000a 2002a, 2003). This ice, evidently, does not carry
paleoclimatic information. Furthermore, in the case of large
subglacial lakes (such as Lake Vostok) where the ice column
above can be considered in full hydrostatic equilibrium buoy-
ancy, re-grounding of the ice sheet on the lee side of the lake
will induce dynamical perturbations (such as folds), even in
the meteoric ice above, as demonstrated for MIS11 (Ray-
naud et al., 2005) and for the ice just above the accreted lake
ice (Souchez et al., 2002a, b, 2003). A less well-documented
case, however, is the one where no significant water body ex-
ists at the ice–bedrock interface. If only melting occurs at
the interface, with no water accumulation and no refreez-
ing (as, for example at the NGRIP site in Greenland), can
we then rely on the paleoclimatic information gathered in
the basal layers? The EPICA (European Project for Ice Cor-
ing in Antarctica) Dome C ice core potentially provides us
with an opportunity to investigate that specific case. In this
paper, we are using a multiparametric approach, combining
new and existing low-resolution (50 cm) data for the bottom
60 m of ice from the EDC (EPICA dome C) ice core with a
new high-resolution (1.5 to 8 cm) chemical data set in order
to better understand the processes at work and evaluate how
these might have altered the environmental archive.
2 The EPICA Dome C ice core
The Dome C deep ice core (EDC) is one of the two ice cores
drilled in the framework of the European Project for Ice Cor-
ing in Antarctica (EPICA). It is located at Concordia Sta-
tion (Dome C – 75◦06′04′′ S; 123◦20′52′′ E), about 1200 km
south of the French coastal station, Dumont d’Urville, and
720 km north-east of the Russian Vostok Station. Detailed
GPS surface topography and airborne radar surveys were
conducted in 1994–1995 in order to optimize the choice for
the drilling location (Remy and Tabacco, 2000; Tabacco et
al., 1998). These provided clear features of the bedrock and
surface topography, showing a set of north–south-trending
parallel valleys around 20 km wide and 200–400 m deep in
the bedrock, corresponding to smooth elongated undulations
a few metres high at the surface.
The Cryosphere, 9, 1633–1648, 2015 www.the-cryosphere.net/9/1633/2015/

J.-L. Tison et al.: Retrieving the paleoclimatic signal from the deeper part of the EPICA Dome C ice core 1635
A final drilling depth of 3259.72 m was reached in De-
cember 2004, about 15 m above the ice–bedrock interface
(to prevent from eventually making contact with subglacial
meltwaters). The ice temperature was −3 ◦C at 3235 m and
a simple extrapolation to the bottom indicates that the melt-
ing point should be reached at the interface (Lefebvre et al.,
2008). The top ca. 3200 m of the EDC ice core have already
been extensively studied and provided a full suite of climatic
and environmental data over the last 8 climatic cycles (e.g.
Delmonte et al., 2008; Durand et al., 2008; EPICA Commu-
nity members, 2004; Jouzel et al., 2007; Lambert et al., 2008;
Loulergue et al., 2008; Lüthi et al., 2008; Wolff et al., 2006).
Raisbeck et al. (2006) confirmed the old age of the deep EDC
ice by presenting evidence for enhanced 10Be deposition in
the ice at 3160–3170 m (corresponding to the 775–786 kyr
interval in the EDC2 timescale) consistent with the age and
duration of the Matuyama–Brunhes geomagnetic reversal. A
coherent interpretation of CO2 and CH4 profiles (Lüthi et al.,
2008; Loulergue et al., 2008) also established the presence
of Marine Ice Stages (MIS) 18 (ca. 739–767 kyr BP) and 19
(ca. 767–790 kyr BP). However, a detailed study of the iso-
topic composition of O2 and its relationship to daily North-
ern Hemisphere summer insolation and comparison to ma-
rine sediment records showed potentially anomalous flow in
the lowermost 500 m of the core with associated distortion
of the EDC2 timescale by a factor of up to 2. This led to
the construction of the new, currently used, EDC3 timescale
(Parrenin et al., 2007). Note that efforts are still ongoing to
refine this timescale, combining multi-site data sets and using
δ18Oatm and O2 /N2 as proxies for orbital tuning (Landais et
al., 2012; Bazin et al., 2013).
As described below, the bottom 60 m of the available core
acquired distinctive properties, as a result of processes driven
by the proximity of the ice–bedrock interface. We will there-
fore, in accordance with the previous literature (e.g. Knight,
1997; Hubbard et al., 2009) refer to it as “basal ice”. The
last 12 m of the available core show visible solid inclusions
(Fig. 1a), which are traditionally interpreted as a sign of in-
teractions with the bedrock. These inclusions are spherical in
shape, brownish to reddish in colour, and generally increase
both in size and density with increasing depth. They however
remain evenly distributed within the ice, therefore qualifying
as a “basal dispersed facies” in existing classifications (e.g.
Hubbard et al., 2009). Between 3248.30 m (first occurrence
of inclusion visible by eye) and 3252.15 m the inclusions are
only sparse (0 to 10 inclusions per 55 cm ice core length)
and less than 1 mm in diameter. In the lower 8 m, inclusions
get bigger (up to 3 mm in the last 50 cm sample) and reach
more than 20 individual inclusions per 50 cm ice core length.
In several cases, especially for the bigger inclusions, these
are “enclosed” in a whitish ovoid bubble-like feature (e.g.
upper left corner of Fig. 1a). Careful visual examination of
the texture of each individual inclusion suggests that these
generally consist of a large number of smaller aggregates al-
though individual particles also occur. In most cases, these
d
b
c
e
a
3248.30m1 cm
f
Figure 1. (a) visual appearance of the EDC basal ice in the lower
metres of the core (photo: D. Dahl-Jensen), (b) EDC δDice vs.
depth, (c) EDC δDice vs. age (EDC3 timescale extended to the basal
ice layers), (d) combined Vostok and EDC δ18Oatm vs. age (adapted
from Dreyfus et al., 2007), (e) δ18O vs. age for the benthic record
stack of Lisiecki and Raymo (2005), and (f) integrated summer in-
solation for various thresholds (τ ) at 30◦ N vs. age, as calculated
by Huybers (2006). For reasons described in the text, ice below
3189.45m depth is referred to as “clean ice facies” (blue squares)
and “dispersed ice facies” (red triangles) describes the ice below
3248.30 m, where solid inclusions are visible.
inclusions appear to be located at crystal boundaries. A de-
tailed study of the morphology, mineralogy and chemistry of
some of these individual inclusions is described elsewhere
(de Angelis et al., 2013). Finally, it should be kept in mind
that these characteristics are valid for ice collected between
6 and 15 m above the actual ice–bedrock interface. We do
not, unfortunately, have any information on the properties of
the ice below, the thickness of which was estimated using a
downhole seismometer (J. Schwander, personal communica-
tion, 2011). The upper 48 m of the basal ice sequence will
be referred to as the “basal clean ice facies” (i.e. devoid of
visible inclusions), also in line with previous work (Hubbard
et al., 2009).
www.the-cryosphere.net/9/1633/2015/ The Cryosphere, 9, 1633–1648, 2015
1636 J.-L. Tison et al.: Retrieving the paleoclimatic signal from the deeper part of the EPICA Dome C ice core
a b
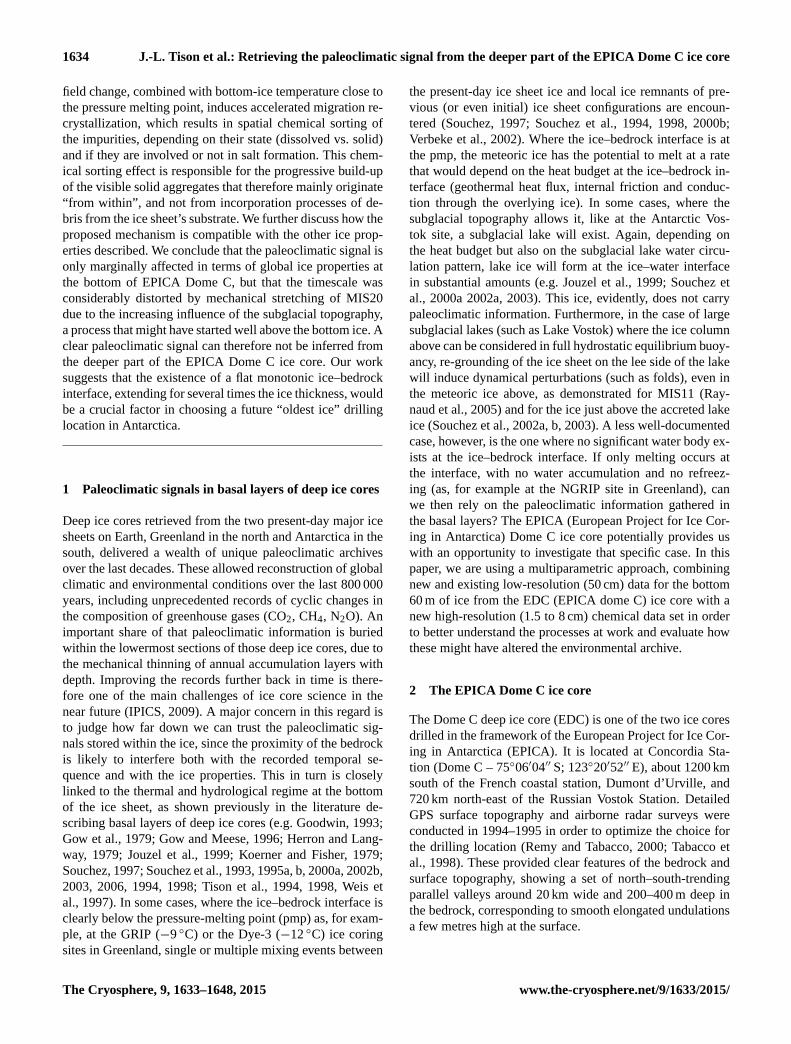
Figure 2. (a) δDice (‰) vs. δ18Oice (‰) and b) d (deuterium excess
‰) vs. δDice (‰) for the clean (open blue squares) and dispersed
(open red triangles) basal ice facies at EPICA Dome C, as compared
to the ice from the 0–140 ky interval (black dots, Stenni et al., 2010).
See text for details.
3 Material and methods
The dispersed facies of the basal ice of the EDC core shows
a relatively low debris content, compared to the other deep
ice coring sites described in previous studies (Camp Cen-
tury, GRIP, Dye-3, Vostok), and could therefore be processed
in continuity with the cutting scheme used for the EDC ice
above. The multi-parametric data set discussed in this pa-
per was therefore obtained applying analytical techniques de-
scribed in full in previous studies focusing on single parame-
ters. We are summarizing those in the Supplement, referring
to the appropriate previous literature for full details.
4 The basal ice properties: a multiparametric
approach
Figure 1b and c plot the full δD profile of the EPICA ice core,
vs. depth and age respectively (EDC3 timescale, Parrenin et
al., 2007). As stated above, we will use the “dispersed ice fa-
cies” terminology for the lower 12 m (red open triangles) and
qualify the 48 m above as the “clean ice facies” (blue open
squares); “basal ice” will refer to the whole 60 m sequence.
A combined Vostok-EDC δ18Oatm profile (isotopic compo-
sition of atmospheric oxygen in ice) vs. EDC3 timescale is
shown in Fig. 1d (adapted from Dreyfus et al., 2007; Petit et
al., 1999 for the ice above 3200 m). The δ18O benthic record
stack of Lisiecki and Raymo (2005) is also plotted as a ref-
erence in Fig. 1e. The co-isotopic properties of the EPICA
Dome C bottom ice (open squares for clean ice facies, open
triangles for dispersed ice facies) are described in Fig. 2a (δD
vs. δ18O) and b (dexcess vs. δD) and compared to those of
the ice from the last 140 ky (Stenni et al., 2010). Work in
progress on the co-isotopic properties of the older ice (down
to 3189.45 m) shows that the latter do not differ from the
trends seen in Fig. 2 (B. Stenni et al., unpublished data).
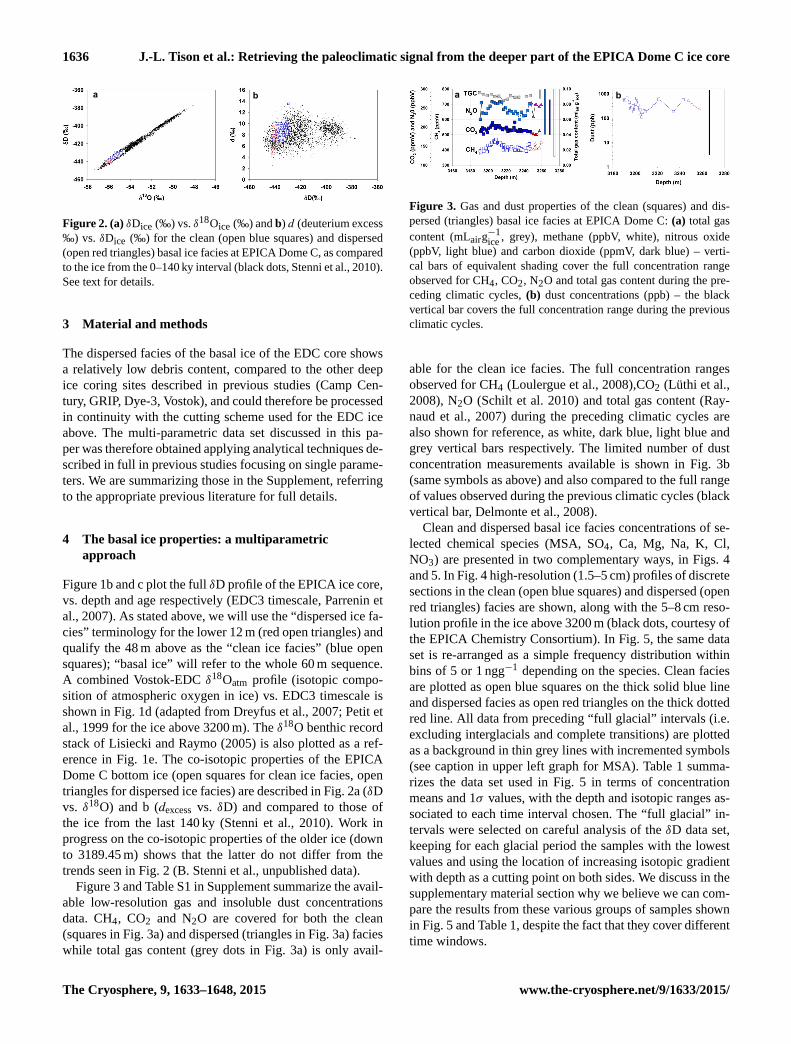
Figure 3 and Table S1 in Supplement summarize the avail-
able low-resolution gas and insoluble dust concentrations
data. CH4, CO2 and N2O are covered for both the clean
(squares in Fig. 3a) and dispersed (triangles in Fig. 3a) facies
while total gas content (grey dots in Fig. 3a) is only avail-
ba
Figure 3. Gas and dust properties of the clean (squares) and dis-
persed (triangles) basal ice facies at EPICA Dome C: (a) total gas
content (mLairg−1ice
, grey), methane (ppbV, white), nitrous oxide
(ppbV, light blue) and carbon dioxide (ppmV, dark blue) – verti-
cal bars of equivalent shading cover the full concentration range
observed for CH4, CO2, N2O and total gas content during the pre-
ceding climatic cycles, (b) dust concentrations (ppb) – the black
vertical bar covers the full concentration range during the previous
climatic cycles.
able for the clean ice facies. The full concentration ranges
observed for CH4 (Loulergue et al., 2008),CO2 (Lüthi et al.,
2008), N2O (Schilt et al. 2010) and total gas content (Ray-
naud et al., 2007) during the preceding climatic cycles are
also shown for reference, as white, dark blue, light blue and
grey vertical bars respectively. The limited number of dust
concentration measurements available is shown in Fig. 3b
(same symbols as above) and also compared to the full range
of values observed during the previous climatic cycles (black
vertical bar, Delmonte et al., 2008).
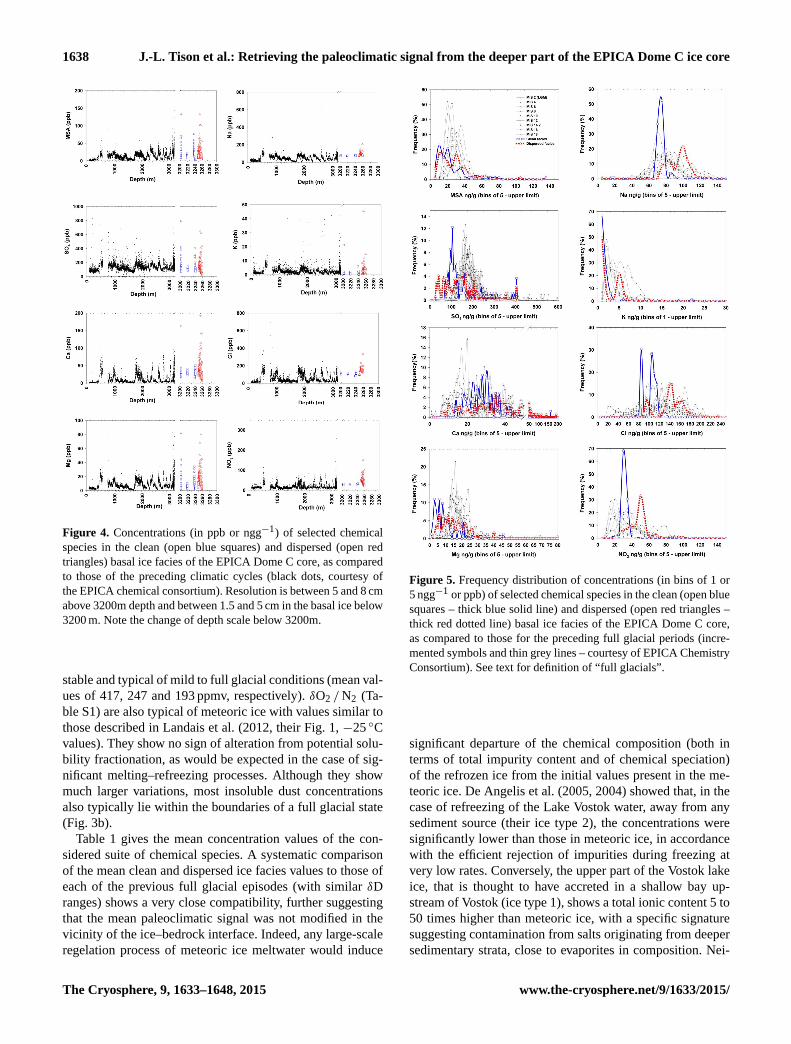
Clean and dispersed basal ice facies concentrations of se-
lected chemical species (MSA, SO4, Ca, Mg, Na, K, Cl,
NO3) are presented in two complementary ways, in Figs. 4
and 5. In Fig. 4 high-resolution (1.5–5 cm) profiles of discrete
sections in the clean (open blue squares) and dispersed (open
red triangles) facies are shown, along with the 5–8 cm reso-
lution profile in the ice above 3200 m (black dots, courtesy of
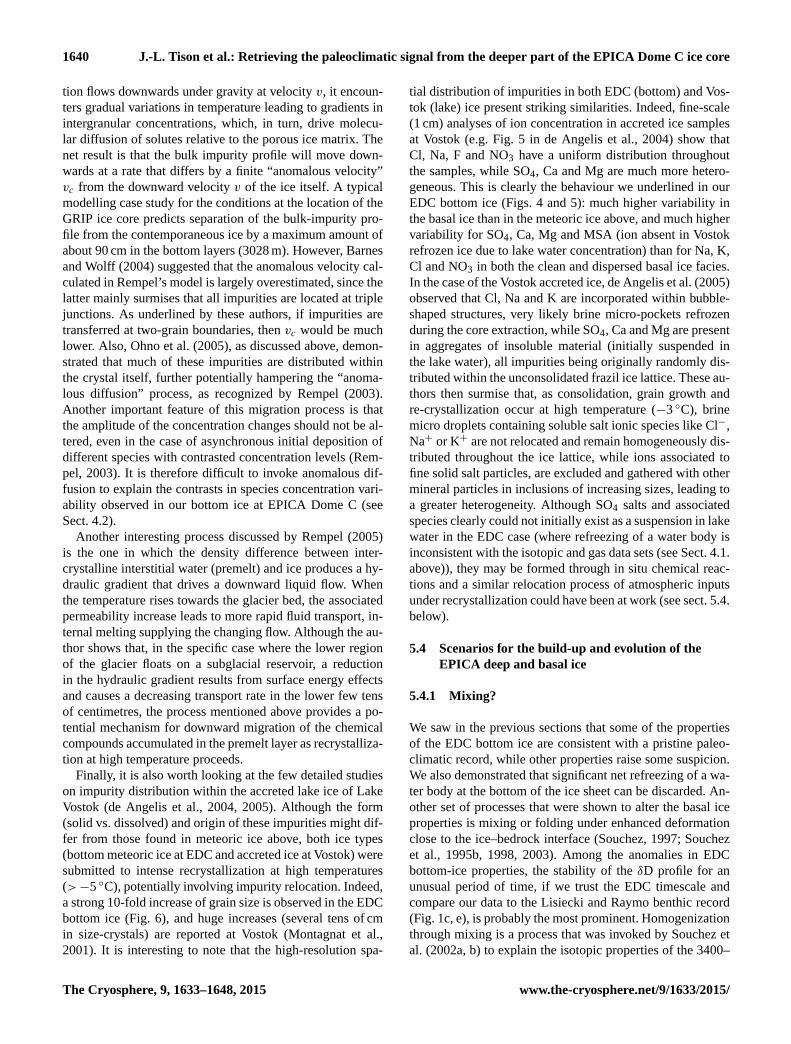
the EPICA Chemistry Consortium). In Fig. 5, the same data
set is re-arranged as a simple frequency distribution within
bins of 5 or 1 ngg−1 depending on the species. Clean facies
are plotted as open blue squares on the thick solid blue line
and dispersed facies as open red triangles on the thick dotted
red line. All data from preceding “full glacial” intervals (i.e.
excluding interglacials and complete transitions) are plotted
as a background in thin grey lines with incremented symbols
(see caption in upper left graph for MSA). Table 1 summa-
rizes the data set used in Fig. 5 in terms of concentration
means and 1σ values, with the depth and isotopic ranges as-
sociated to each time interval chosen. The “full glacial” in-
tervals were selected on careful analysis of the δD data set,
keeping for each glacial period the samples with the lowest
values and using the location of increasing isotopic gradient
with depth as a cutting point on both sides. We discuss in the
supplementary material section why we believe we can com-
pare the results from these various groups of samples shown
in Fig. 5 and Table 1, despite the fact that they cover different
time windows.
The Cryosphere, 9, 1633–1648, 2015 www.the-cryosphere.net/9/1633/2015/

J.-L. Tison et al.: Retrieving the paleoclimatic signal from the deeper part of the EPICA Dome C ice core 1637
Table 1. Mean concentration and 1σ values (ngg−1 or ppb) for selected chemical species in the clean and dispersed basal ice facies of the
EPICA Dome C ice core, as compared to those of the previous full glacial periods (see text for details). Depth (m) and δD (‰) ranges are
given for each time interval considered.
Glacial Depth range (m) Isotopic range (δD ‰) MSA (ngg−1) SO4 (ngg−1) Ca (ngg−1) Mg (ngg−1)
min max mean σ mean σ mean σ mean σ
MIS 2 507.7 583.5 −449.3 −432.8 18.24 7.00 213.78 85.15 43.27 14.89 19.31 4.08
MIS 4 1007.6 1042.2 −446.4 −430.5 20.94 4.00 194.80 52.52 30.85 10.96 14.28 3.84
MIS 6 1801.8 1997.0 −447.1 −419.8 18.60 5.00 170.01 51.73 23.60 12.25 13.54 4.04
MIS 8 2320.0 2398.6 −444.5 −421.5 27.90 6.13 192.05 50.92 23.37 12.98 14.92 4.28
MIS 10 2599.9 2650.0 −445.0 −425.1 26.77 7.88 183.55 43.56 22.92 9.84 14.92 3.86
MIS 12 2783.2 2794.9 −440.9 −422.5 23.44 5.04 187.36 45.54 43.47 19.09 19.82 5.50
MIS 14.2 2915.7 2919.9 −436.4 −429.3 23.75 6.37 162.06 21.72 20.46 6.19 15.80 2.75
MIS 16 3037.6 3039.8 −441.0 −412.3 32.61 6.95 167.86 39.55 36.09 17.21 16.37 5.84
MIS 18 3137.8 3153.1 −441.4 −423.7 36.40 23.47 195.35 139.18 31.26 19.76 20.03 25.47
Clean Facies 3201.0 3248.0 −442.5 −427.7 21.50 20.32 150.39 107.98 29.53 16.87 11.49 12.48
Dispersed Facies 3248.0 3259.3 −443.2 −436.7 25.27 18.43 139.58 91.46 42.10 29.44 16.25 11.23
Glacial Depth range (m) Isotopic range (δD ‰) Na (ngg−1) Cl (ngg−1) NO3 (ngg−1) K (ngg−1)
min max mean σ mean σ mean σ mean σ
MIS 2 507.7 583.5 −449.3 −432.8 97.37 17.54 160.68 48.64 40.93 16.01 7.45 1.89
MIS 4 1007.6 1042.2 −446.4 −430.5 79.81 17.75 129.89 25.25 29.38 12.41 4.91 2.34
MIS 6 1801.8 1997.0 −447.1 −419.8 71.57 16.65 107.56 40.45 24.72 12.63 3.74 2.36
MIS 8 2320.0 2398.6 −444.5 −421.5 76.76 35.00 112.06 38.05 26.24 17.20 3.84 5.24
MIS 10 2599.9 2650.0 −445.0 −425.1 77.80 32.30 112.76 61.56 30.21 19.92 5.77 9.76
MIS 12 2783.2 2794.9 −440.9 −422.5 72.70 19.82 138.46 34.04 48.69 22.43 3.93 3.32
MIS 14.2 2915.7 2919.9 −436.4 −429.3 70.88 15.13 110.46 21.66 34.33 17.31 3.16 5.70
MIS 16 3037.6 3039.8 −441.0 −412.3 78.23 12.32 111.67 21.46 32.89 11.94 3.07 4.96
MIS 18 3137.8 3153.1 −441.4 −423.7 80.44 13.94 114.44 31.38 26.28 13.95 3.26 3.98
Clean Facies 3201.0 3248.0 −442.5 −427.7 71.78 3.79 99.91 13.39 29.03 2.42 1.94 2.40
Dispersed Facies 3248.0 3259.3 −443.2 −436.7 93.16 15.43 141.68 30.42 46.26 15.37 2.68 4.17
Finally, Fig. 6 plots the mean equivalent crystal radii for
the deep and basal ice, as obtained from preliminary mea-
surements in the field, and compare those to measurements
using automatic ice texture analyzers as described in Durand
et al. (2009). Reliable measurement of crystals radii in the
bottom ice using automatic techniques is hampered by the
very large increase of crystal sizes, often spanning several in-
dividual thin sections. Only “unconventional” measurements
such as, e.g. sonic logging (still in development) might allow
us to document these properties further in the future.
5 Discussion
5.1 Indicators of an “undisturbed” paleoclimatic
record
In this first section of the discussion, we will demonstrate
that some of the clean and dispersed basal ice facies prop-
erties appear coherent with a climatic signature unmodified
by large-scale refreezing processes. As shown in Fig. 1b,
c both the clean and dispersed ice facies display δD val-
ues typical of a mild to cold glacial period, with respective
ranges of −427.7 to −442.5 and −436.7 to −443.2 ‰ (Ta-
ble 1), as would be expected for MIS 20 based on more re-
cent glacials. In the co-isotopic δD-δ18O diagram of Fig. 2a,
all samples align well with those from the previous climatic
cycles, with a slope of 8.5, close to the value of 8.2 for the
samples above 3200 m, i.e. in accordance with a meteoric
water line. This is very different from the refrozen Vostok
lake ice, where the samples were shown to be clearly lo-
cated on a freezing slope of 4.9, only slightly higher than
the theoretical slope calculated from the estimated lake wa-
ter isotopic value (Souchez et al., 2002a). Also, the dexcess
values shown in Fig. 2b are within the range of those ob-
served in the more recent glacials, while refreezing processes
are known to lower the deuterium excess values (Souchez et
al., 2002a; Souchez and Lorrain, 1991). These are first argu-
ments to preclude large-scale refreezing as a plausible pro-
cess for the bottom-ice formation.
The gas properties of the bottom ice are probably even
more indicative of a true climatic signature (Fig. 3a). The
total gas content is very stable with a mean value at
0.088 mLair g−1ice , which is identical to the one obtained for the
whole 0–400 ky interval further up in the core (Raynaud et
al., 2007). CH4, N2O and CO2 concentrations are also quite
www.the-cryosphere.net/9/1633/2015/ The Cryosphere, 9, 1633–1648, 2015
1638 J.-L. Tison et al.: Retrieving the paleoclimatic signal from the deeper part of the EPICA Dome C ice core
Figure 4
Figure 4. Concentrations (in ppb or ngg−1) of selected chemical
species in the clean (open blue squares) and dispersed (open red
triangles) basal ice facies of the EPICA Dome C core, as compared
to those of the preceding climatic cycles (black dots, courtesy of
the EPICA chemical consortium). Resolution is between 5 and 8 cm
above 3200m depth and between 1.5 and 5 cm in the basal ice below
3200 m. Note the change of depth scale below 3200m.
stable and typical of mild to full glacial conditions (mean val-
ues of 417, 247 and 193 ppmv, respectively). δO2 /N2 (Ta-
ble S1) are also typical of meteoric ice with values similar to
those described in Landais et al. (2012, their Fig. 1, −25 ◦C
values). They show no sign of alteration from potential solu-
bility fractionation, as would be expected in the case of sig-
nificant melting–refreezing processes. Although they show
much larger variations, most insoluble dust concentrations
also typically lie within the boundaries of a full glacial state
(Fig. 3b).
Table 1 gives the mean concentration values of the con-
sidered suite of chemical species. A systematic comparison
of the mean clean and dispersed ice facies values to those of
each of the previous full glacial episodes (with similar δD
ranges) shows a very close compatibility, further suggesting
that the mean paleoclimatic signal was not modified in the
vicinity of the ice–bedrock interface. Indeed, any large-scale
regelation process of meteoric ice meltwater would induce
Figure 5. Frequency distribution of concentrations (in bins of 1 or
5 ngg−1 or ppb) of selected chemical species in the clean (open blue
squares – thick blue solid line) and dispersed (open red triangles –
thick red dotted line) basal ice facies of the EPICA Dome C core,
as compared to those for the preceding full glacial periods (incre-
mented symbols and thin grey lines – courtesy of EPICA Chemistry
Consortium). See text for definition of “full glacials”.
significant departure of the chemical composition (both in
terms of total impurity content and of chemical speciation)
of the refrozen ice from the initial values present in the me-
teoric ice. De Angelis et al. (2005, 2004) showed that, in the
case of refreezing of the Lake Vostok water, away from any
sediment source (their ice type 2), the concentrations were
significantly lower than those in meteoric ice, in accordance
with the efficient rejection of impurities during freezing at
very low rates. Conversely, the upper part of the Vostok lake
ice, that is thought to have accreted in a shallow bay up-
stream of Vostok (ice type 1), shows a total ionic content 5 to
50 times higher than meteoric ice, with a specific signature
suggesting contamination from salts originating from deeper
sedimentary strata, close to evaporites in composition. Nei-
The Cryosphere, 9, 1633–1648, 2015 www.the-cryosphere.net/9/1633/2015/

J.-L. Tison et al.: Retrieving the paleoclimatic signal from the deeper part of the EPICA Dome C ice core 1639
0 500 1000 1500 2000 2500 30001
10
100
R (
mm
)
Depth (m)
Figure 6. Mean equivalent crystals radii in the basal ice layers of the
EPICA Dome C ice core, as compared to measurements in ice above
3200m depth from Durand et al. (2007). Basal ice measurements
are preliminary results obtained using the linear intercept technique
“on site”, while the data from above 3200m were obtained using
automatic ice texture analyzers (AITAs – Wang and Azuma, 1999;
Russell-Head and Wilson, 2001; Wilen et al., 2003).
ther of these two signatures are seen in the EDC bottom-ice
samples.
5.2 Indicators of a “disturbed” paleoclimatic record
There are however some features of the bottom ice that raise
questions about its paleoclimatic significance. First of all, as
stated above, the presence of visible-solid inclusion aggre-
gates in the lower 12 m could be the result of incorporation
processes of sedimentary material at the ice–bedrock inter-
face (Boulton, 1996, 1979; Cuffey et al., 2000; Gow et al.,
1979; Gow and Meese, 1996; Herron and Langway, 1979;
Holdsworth, 1974; Iverson, 1993; Iverson and Semmens,
1995; Knight, 1997; Koerner and Fisher, 1979; Souchez et
al., 1988, 2000b; Tison and Lorrain, 1987; Tison et al., 1993,
1989). Then, a comparison of Fig. 1c and e reveals a strong
discrepancy between the EDC δD record and the benthic
record stack of Lisiecki and Raimo (2005) prior to 800 ky,
with the lack of MIS21 in the EDC profile, which, instead,
displays an unusually long glacial period. Furthermore, the
δ18Oatm profile of Fig. 1d is also somewhat peculiar in two
ways: first it is extremely stable in the bottom ice despite
known large fluctuations in the precession and ice volume at
the time, to which the δ18Oatm was shown to be very sensitive
(Bender, 2002; Dreyfus et al., 2007; Landais et al., 2010),
and, second, it displays values continuously close to 0 ‰,
which is generally (but not strictly) more typical of full inter-
glacial rather than full glacial conditions.
Finally, although generally coherent with the previous cli-
matic cycles in terms of mean concentration values, individ-
ual chemical species can be considered to be two groups with
specific and contrasted chemical distribution (Figs. 4 and 5,
Table 1). MSA, SO4, Ca and Mg, on the one hand, clearly
show increased variability, both in the clean and dispersed ice
facies (see left column of Fig. 4 and 1σ values in Table 1), a
trend that seems to initiate in MIS18 already. The frequency
distributions in Fig. 5 confirm this variability as compared to
previous glacials, with a tendency of both skewing towards
lower values for MSA, SO4 or Mg and showing outliers at
higher concentration, especially in the clean ice facies. On
the other hand, Na, K, Cl, and NO3 behave noticeably dif-
ferently in the clean ice and in the dispersed ice facies (right
column in Fig. 4). The clean ice facies (solid line) shows very
low variability and narrow frequency peaks in the graphs of
Fig. 5, while the dispersed ice facies (dotted line) behaves
similarly to the previous glacial, but with a tendency of skew-
ing towards the higher range of concentrations.
5.3 Distribution and relocation of dissolved and solid
impurities within ice cores
Ohno et al. (2005) discussed the location and chemical forms
of water-soluble salts in ice cores. Initially entrapped in-
between the snow grains that will evolve into firn and then
ice under increasing metamorphism, these impurities could
therefore be found either within the ice crystals themselves,
or within the unfrozen liquid that separates the grain bound-
aries as a result of “premelting” (Rempel et al., 2001, 2002;
Wettlaufer, 1999), be it veins, nodes or triple junctions. A
common view amongst glaciologists is that because those
impurities produce strain-energy within ice grains and be-
cause trace acids must exist as acid solutions given their
very low eutectic point, they will progressively be forced into
grain boundaries as grain growth and recrystallization occur
(Glen et al., 1977; Rempel, 2003; Rempel et al., 2001, 2002;
Wettlaufer, 1999). Although most of the sulfur atoms appear
as sulfuric acid in Antarctic ice (samples were observed at
triple junctions of grain boundaries in the early days of scan-
ning electron measurements in ice (Mulvaney et al., 1988)),
there has been growing evidence that sulfur compounds also
exist as sulfate trapped as inclusions within grains (e.g. Baker
and Cullen, 2003). Ohno et al. (2005), using micro-Raman
spectroscopy, underline that at shallow depth (185 m) in the
Dome Fuji ice core, the fraction of SO2−4 existing as salts
within the micro-inclusions exceeded 50 % of the total SO2−4 .
Similar fraction values between 30 and 60 % were found for
Na+, Ca2+ and Mg2+ in discrete samples spanning the 5.6
to 87.8 ky BP interval.
Relocation of impurities under increasing recrystallization
is likely to become important in the deeper part of meteoric
ice cores, where the ice temperature gets closer to the pres-
sure melting point (pmp) and the temperature gradient gen-
erally increases. One of those relocation processes that has
been intensively discussed in the recent years is the mech-
anism often referred to as “anomalous diffusion” (Rempel,
2003; Rempel et al., 2001, 2002). In this process, it is sur-
mised that, as grains slowly grow and recrystallize within ice
sheets, most of the impurity molecules are preferentially ex-
cluded from the solid grains and enriched in the melt. As
the polycrystalline mixture of ice and premelt liquid solu-
www.the-cryosphere.net/9/1633/2015/ The Cryosphere, 9, 1633–1648, 2015
1640 J.-L. Tison et al.: Retrieving the paleoclimatic signal from the deeper part of the EPICA Dome C ice core
tion flows downwards under gravity at velocity v, it encoun-
ters gradual variations in temperature leading to gradients in
intergranular concentrations, which, in turn, drive molecu-
lar diffusion of solutes relative to the porous ice matrix. The
net result is that the bulk impurity profile will move down-
wards at a rate that differs by a finite “anomalous velocity”
vc from the downward velocity v of the ice itself. A typical
modelling case study for the conditions at the location of the
GRIP ice core predicts separation of the bulk-impurity pro-
file from the contemporaneous ice by a maximum amount of
about 90 cm in the bottom layers (3028 m). However, Barnes
and Wolff (2004) suggested that the anomalous velocity cal-
culated in Rempel’s model is largely overestimated, since the
latter mainly surmises that all impurities are located at triple
junctions. As underlined by these authors, if impurities are
transferred at two-grain boundaries, then vc would be much
lower. Also, Ohno et al. (2005), as discussed above, demon-
strated that much of these impurities are distributed within
the crystal itself, further potentially hampering the “anoma-
lous diffusion” process, as recognized by Rempel (2003).
Another important feature of this migration process is that
the amplitude of the concentration changes should not be al-
tered, even in the case of asynchronous initial deposition of
different species with contrasted concentration levels (Rem-
pel, 2003). It is therefore difficult to invoke anomalous dif-
fusion to explain the contrasts in species concentration vari-
ability observed in our bottom ice at EPICA Dome C (see
Sect. 4.2).
Another interesting process discussed by Rempel (2005)
is the one in which the density difference between inter-
crystalline interstitial water (premelt) and ice produces a hy-
draulic gradient that drives a downward liquid flow. When
the temperature rises towards the glacier bed, the associated
permeability increase leads to more rapid fluid transport, in-
ternal melting supplying the changing flow. Although the au-
thor shows that, in the specific case where the lower region
of the glacier floats on a subglacial reservoir, a reduction
in the hydraulic gradient results from surface energy effects
and causes a decreasing transport rate in the lower few tens
of centimetres, the process mentioned above provides a po-
tential mechanism for downward migration of the chemical
compounds accumulated in the premelt layer as recrystalliza-
tion at high temperature proceeds.
Finally, it is also worth looking at the few detailed studies
on impurity distribution within the accreted lake ice of Lake
Vostok (de Angelis et al., 2004, 2005). Although the form
(solid vs. dissolved) and origin of these impurities might dif-
fer from those found in meteoric ice above, both ice types
(bottom meteoric ice at EDC and accreted ice at Vostok) were
submitted to intense recrystallization at high temperatures
(>−5 ◦C), potentially involving impurity relocation. Indeed,
a strong 10-fold increase of grain size is observed in the EDC
bottom ice (Fig. 6), and huge increases (several tens of cm
in size-crystals) are reported at Vostok (Montagnat et al.,
2001). It is interesting to note that the high-resolution spa-
tial distribution of impurities in both EDC (bottom) and Vos-
tok (lake) ice present striking similarities. Indeed, fine-scale
(1 cm) analyses of ion concentration in accreted ice samples
at Vostok (e.g. Fig. 5 in de Angelis et al., 2004) show that
Cl, Na, F and NO3 have a uniform distribution throughout
the samples, while SO4, Ca and Mg are much more hetero-
geneous. This is clearly the behaviour we underlined in our
EDC bottom ice (Figs. 4 and 5): much higher variability in
the basal ice than in the meteoric ice above, and much higher
variability for SO4, Ca, Mg and MSA (ion absent in Vostok
refrozen ice due to lake water concentration) than for Na, K,
Cl and NO3 in both the clean and dispersed basal ice facies.
In the case of the Vostok accreted ice, de Angelis et al. (2005)
observed that Cl, Na and K are incorporated within bubble-
shaped structures, very likely brine micro-pockets refrozen
during the core extraction, while SO4, Ca and Mg are present
in aggregates of insoluble material (initially suspended in
the lake water), all impurities being originally randomly dis-
tributed within the unconsolidated frazil ice lattice. These au-
thors then surmise that, as consolidation, grain growth and
re-crystallization occur at high temperature (−3 ◦C), brine
micro droplets containing soluble salt ionic species like Cl−,
Na+ or K+ are not relocated and remain homogeneously dis-
tributed throughout the ice lattice, while ions associated to
fine solid salt particles, are excluded and gathered with other
mineral particles in inclusions of increasing sizes, leading to
a greater heterogeneity. Although SO4 salts and associated
species clearly could not initially exist as a suspension in lake
water in the EDC case (where refreezing of a water body is
inconsistent with the isotopic and gas data sets (see Sect. 4.1.
above)), they may be formed through in situ chemical reac-
tions and a similar relocation process of atmospheric inputs
under recrystallization could have been at work (see sect. 5.4.
below).
5.4 Scenarios for the build-up and evolution of the
EPICA deep and basal ice
5.4.1 Mixing?
We saw in the previous sections that some of the properties
of the EDC bottom ice are consistent with a pristine paleo-
climatic record, while other properties raise some suspicion.
We also demonstrated that significant net refreezing of a wa-
ter body at the bottom of the ice sheet can be discarded. An-
other set of processes that were shown to alter the basal ice
properties is mixing or folding under enhanced deformation
close to the ice–bedrock interface (Souchez, 1997; Souchez
et al., 1995b, 1998, 2003). Among the anomalies in EDC
bottom-ice properties, the stability of the δD profile for an
unusual period of time, if we trust the EDC timescale and
compare our data to the Lisiecki and Raymo benthic record
(Fig. 1c, e), is probably the most prominent. Homogenization
through mixing is a process that was invoked by Souchez et
al. (2002a, b) to explain the isotopic properties of the 3400–
The Cryosphere, 9, 1633–1648, 2015 www.the-cryosphere.net/9/1633/2015/

J.-L. Tison et al.: Retrieving the paleoclimatic signal from the deeper part of the EPICA Dome C ice core 1641
3538 m Vostok depth interval, just above the meteoric-lake–
ice interface. They indeed show that the δD values are there
bracketed in a tight range corresponding to mean values be-
tween glacial and interglacial, and that the deuterium excess
variability is also strongly reduced. This was supported by
the ionic signature showing a narrow range of concentrations
corresponding to ice formed under mild glacial conditions.
If this was the case for the EDC bottom ice, we should ex-
pect (from the comparison of Fig. 1c and e) that the bottom
ice shows mean isotopic values between those of MIS20 and
MIS21 in Fig. 2b. However, the bottom ice is truly of glacial
signature. Also, samples from the basal ice span the whole
glacial deuterium excess range.
Mixing with a local isotopic end member inherited from a
previous or initial ice sheet configuration is also unlikely. It
was only described for basal ice condition largely below the
pmp (see Sect. 1) and generally showed contrasting proper-
ties between the present-day ice sheet ice and the local end
member, with a whole range of intermediate values in the
mixing zone.
5.4.2 Stretching?
If mixing is therefore improbable at EDC, another mechani-
cal way of explaining the abnormal length of MIS20 is rela-
tive vertical stretching under changing stress conditions, i.e.
alteration of the stratigraphic timescale. Although, given the
location chosen for the EPICA Dome C drilling, stress con-
ditions should be (and are) essentially those of vertical uni-
axial compression, Durand et al. (2008) indicate that the fab-
rics in layers of larger mean crystal sizes (about 6 mm) be-
low 2850 m show signs of dispersion of the strong single
maximum (which is the rule below 1500 m depth) along a
weak vertical girdle. These changes might be the sign of
evolving stress conditions near the bottom of the ice sheet,
and were recently interpreted so, to explain anomalous flow
below 2700 m (Dreyfus et al., 2007) and reworking of sul-
phate spikes below 2800 m under increased recrystallization
(Traversi et al., 2006, 2009).
As seen on the large-scale map of the bedrock elevation
in the vicinity of the EDC drilling site (Remy and Tobacco,
2000, their Fig. 4), the ice core bottom location sits at ca.
70 m above sea level, on the eastern flank (200–400 m a.s.l.
ridge) of a major S–N trending subglacial valley, with a
400 m a.s.l. ridge 15 km across, on the western flank of the
valley. The bottom of the central part of the valley is at ca.
50 m below sea level. The next 400 m deep subglacial valley
lies about 20 km further to the east.
In Fig. 7, we schematically show what might be the impact
of a confining bedrock topography consisting of elongated
valleys about 20 km wide and 200–400 m deep (Rémy and
Tabacco, 2000) on the stress field and the ice fabric in the
bottom ice of EPICA DC. As the ice sinks passed the crests
of the subglacial valleys, lateral compression on the sides of
the valley will progressively combine with the vertical uni-
��������
��
��
������������� �
�������������������������� �
�������
������
����� �����
Figure 7. Schematic illustration of the hypothesized impact of the
confining bedrock topography (bedrock valleys about 20 km wide
and 200–400 m deep – from Remy and Tabacco, 2000) on the stress
regime, layer thickness and ice fabric patterns in the bottom ice
of EPICA Dome C. Vertical stretching is accommodated by basal
melting and/or along sub-glacial valley flow. For clarity, this illus-
tration enhances the process so that absolute annual layer thickness
increases downwards. A milder effect would only result in a de-
crease of the thinning rate (see text for details).
axial compression. The resulting stress field will therefore
transition from uniaxial vertical compression to longitudinal
extension, as illustrated by the 3-D arrows in the central part
of the drawing of Fig. 7. The associated change in fabrics
will be from a vertical single maximum to a vertical girdle
fabric, in a plane parallel to the subglacial valley sides. This
new pattern might be the one already suggested in the dis-
cretely changing fabrics described by Durand et al. (2008)
below 2800 m. Because the principal stress transverse to the
subglacial valley slowly shifts from extensional to compres-
sive, the result could be a relative vertical stretching of in-
dividual accumulation layers, depending on the intensity of
the principal extension along the valley axis. It is however
not possible, with the data at hand, to demonstrate whether
this relative vertical stretching results in an absolute increase
of annual layer thickness (as shown in Fig. 7) or if it only
results in a decrease of the thinning rate. In this configura-
tion, one must of course consider a 3-D geometry, in which
the vertically stretched ice can be moved away from the drill
location. Part of it can be melted at the ice–bedrock interface
where the ice is at the pressure-melting point, and the over-
deepening of the longitudinal valleys seen in Fig. 3 of Rémy
and Tobacco (2000) could also provide an escape route for
the ice.
5.4.3 Enhanced recrystallization and small-scale
chemical sorting
In the dynamic context described above (Set. 5.4.2), and re-
lying on our multiparametric results, we can now propose a
www.the-cryosphere.net/9/1633/2015/ The Cryosphere, 9, 1633–1648, 2015

1642 J.-L. Tison et al.: Retrieving the paleoclimatic signal from the deeper part of the EPICA Dome C ice core
��������
�����
��������
�����
� ������������������
������������������
�����������������
������������ ������������������ �����������
����������������������
������ �!�������
������������!�������������" �����#����������$%&
����'����'���������(��)����*��)���*��)���*��+++,
-,
��)���)��)�*��+++, -
��)�.)��)��*��+++
����������������
�� ���/�������
/������0���� �����
���� �0� !�
�� �����
1�� ������������� ��/�������)
��2�0���� �����
���������������2�����
��/������������
3�"�����) �� ���������� �� ��������/�������������
�������������!���������� ����2�������� ��
�����'��
������������������������������������������ ����������
Figure 8. Sketch of potential chemical sorting effects during enhanced migration recrystallization processes under a changing stress field,
close to the pressure melting point, in the clean and dispersed basal ice facies of EPICA Dome C. Processes in italic/dotted arrows are
hypothetical (see text for details).
plausible scenario for the evolution of the properties of our
clean and dispersed basal ice facies at EPICA Dome C, as
illustrated in Fig. 8. A changing stress field and the high
temperatures, close to the pmp, will trigger sustained migra-
tion recrystallization within the bottom layers. Mean crys-
tal size values (up to more than 10 cm) plotted in Fig. 6 are
undisputable proof that recrystallization is indeed very ac-
tive there. This process will tend to relocate the impurities
at grain boundaries and contribute to the build-up of aggre-
gates. Note that Raisbeck et al. (2006) already invoked the
formation of aggregates to explain abnormal spikes in 10Be
in the basal ice. Increasing water content in the premelt layer
might also slowly initiate downward density-driven migra-
tion of the water and of some of the associated impurities.
This however, as our data set shows, will only be revealed in
a high resolution chemistry approach, since it will not signif-
icantly affect the mean concentration values for a given cli-
matic period, but more the frequency distribution within the
observed concentration range. It will also behave differently,
depending on the species. Detailed SEM (scanning electron
microscope) and XRF (X-ray fluorescence) micro-probe ele-
mental analyses of individual aggregates inside the EDC dis-
persed basal ice facies are described elsewhere and provide
further insights in the potential processes at work and envi-
ronmental implications (de Angelis et al., 2013). They reveal
that CaCO3 and CaSO4 are common within these aggregates.
These compounds could then be either newly precipitated
salts (as observed concentrations are compatible with satura-
tion for, e.g. CaSO4 given estimated vein sizes at those am-
bient temperatures) or pre-existing solid particles, that were
initially present inside the crystals (Ohno et al., 2005). SO4,
Ca, Mg and MSA (which can also be associated with salts,
Ohno et al., 2005) mean concentrations in the clean and the
dispersed basal ice facies will therefore remain within the
range of other glacials, but their spatial distribution at the
high-resolution scale of sampling will show much greater
variability than in meteoric ice as shown above (Figs. 4, 5
and 8, right column).
As discussed above, the other group of species (Na, Cl, K,
NO3) shows two important features in the frequency distri-
bution of Fig. 5 (right column): (a) although the whole data
set is spanning the range of the previous glacials, the con-
centration mode is lower for the clean ice facies and higher
for the dispersed ice facies and (b) the frequency distribu-
tion in the basal ice facies is generally single-modal and nar-
row, while it is bi-modal in the dispersed ice facies with
the first mode in the basal ice facies range and the second
mode skewed towards the high side of the range observed
in other glacials. The contrast in concentration level between
the clean ice facies and the dispersed ice facies could simply
reflect the slightly colder conditions (thus higher impurity
content) at the time the ice of the dispersed basal facies was
formed at the surface of the ice sheet, as suggested by the
lower δD values compared to the clean ice facies(Fig. 1b).
Although this contrast is less obvious for the first group of
chemical compounds, it might have been over-written by in-
voked aggregation and new in situ precipitation processes.
Alternatively, the observed contrast in behaviour of Na, Cl,
K, NO3 between the clean and dispersed ice facies might re-
flect the signature of the premelt migration process as theo-
retically proposed by Rempel (2005). These species would
indeed remain in the dissolved state within the premelt layer,
and eventually partly and more easily migrate downwards,
resulting in the left skewing mode in the clean ice facies
The Cryosphere, 9, 1633–1648, 2015 www.the-cryosphere.net/9/1633/2015/

J.-L. Tison et al.: Retrieving the paleoclimatic signal from the deeper part of the EPICA Dome C ice core 1643
and the bimodal distribution in the dispersed ice facies (low
concentration mode corresponding to the remaining fraction
in crystals as salts micro-inclusions and high concentration
mode to the fraction that migrated in the premelt). Note that
the process of upward pulling of liquid from the underlying
reservoir discussed by Rempel (2005), if it exists, provides a
means to prevent expulsion of the premelt from the basal ice,
and therefore preservation of this bi-modal frequency distri-
bution. Basal melting would potentially counteract this ef-
fect but the two basal ice facies would then migrate upwards
into the ice column. Unfortunately, as underlined before, the
available data set is missing the lower 6–15 m of the basal
ice section to the ice–bedrock interface, where further argu-
ments might have been found to (in-) validate this premelt
migration hypothesis.
The large inclusions visible in the bottom 12 metres of
basal ice are principally located at grain boundaries. Theo-
retical considerations from Alley et al. (1986, Eq. 21) sug-
gest a high velocity ice grain boundary migration regime with
decoupling of the grain boundaries from the particle aggre-
gates because of their relatively large sizes and very low vol-
ume fraction. However, as underlined by these authors, this is
probably no more valid for the “warm” (EDC bottom) ice, in
a full migration recrystallization process, where the increased
water content in the vein network will favour Ostwald ripen-
ing as the temperature of the ice-impurity system rises above
the melting point of the impure grain boundaries. Another
feature to consider here is that the particle aggregates might
also behave very differently from single particles in terms of
drag force on the grain boundaries. Also, as discussed in de
Angelis et al. (2013), the significant contribution of organic
compounds (such as exopolymeric substances – EPS) to the
impurity load might also strongly affect the inclusion/grain
boundary geometrical relationships.
5.4.4 Water isotopes, gases and dust
We focused until now on a plausible explanation for the pe-
culiarities of the chemical signature of our two basal ice fa-
cies at EDC. How do the water isotopes signature, gas and
dust properties fit into the proposed mechanism? Although
the water co-isotopic signature of our basal ice facies does
not show large-scale signs of modification, the recent work
of Pol et al. (2010) suggests that it might not be the case at
the crystal size scale, thereby providing some independent
support to the interpretation of our chemical data set. These
authors indeed used high-resolution (cm scale) δD measure-
ments to depict abnormal isotopic diffusion which they at-
tributed to water circulation at grain boundaries (premelt) for
large crystals which spent more than 200 000 years at tem-
peratures>−10 ◦C. The diffusion length diagnosed from the
data is about twice as large (40 cm) as expected from solid
state diffusion in ice, and it is also suggested that the process
might start as early as in MIS 11 (Pol et al., 2011).
Why would the relocation process invoked for the chemi-
cal impurities not show up in the total air content or the CH4
and CO2 concentrations? First of all, it should be noted that
the resolution of our gas data sets is much lower than the
one we achieved for the chemical species. Also, one should
remember that the gas molecules are exclusively present as
clathrates at these depths and little is known on the be-
haviour of those during small-scale phase changes under
large overburden pressures. If the glacial MIS20 “stretch-
ing” hypothesis is valid, it is not surprising to observe a sta-
ble δ18Oatm signal. Landais and Dreyfus (2010) provide an
in depth analysis of the potential drivers for the millennial
and orbital variations of δ18Oatm and show the strong impact
of Northern Hemisphere monsoon activity on the observed
values, in response to precessional and millennial shifts of
the Intertropical Convergence Zone (ITCZ). Intervals where
δ18Oatm is close to 0 ‰ correspond in that context to episodes
where precession favours warm Northern Hemisphere sum-
mers with a strong East-Asian monsoon. In Fig. 1f, we plot-
ted the values for the integrated summer insolation at 30◦ N,
for various thresholds τ , as calculated by Huybers (2006).
This integrated summer insolation can be defined as the sum
of the diurnal average insolation on days exceeding a spec-
ified flux threshold (τ ). As can be seen from the compari-
son between Fig. 1f and d, high values of δ18Oatm concur
with high integrated summer insolation associated with very
high diurnal average insolation thresholds ( e.g. for τ = 450
(green curve) to 500 (red curve) Watt m−2 in Fig. 1f), which
is the case for our basal ice sequence. This relationship in en-
larged in Fig. 9a, where one can clearly see that maxima in
δ18Oatm are well coupled to maxima in integrated summer in-
solation (to the exception of a missing peak around 750 ky). It
can also be suggested that larger δ18O amplitudes correspond
to larger summer insolation values and vice versa, with a
threshold around roughly 2 GJ. In Fig. 9a we attempted to use
the synchronicity of small-scale oscillations of the δ18Oatm
signal (however well above the precision of measurements
−0.015 ‰), to the summer insolation one (tie points 1 and
2 in Fig. 9a) to derive the amount of stretching of the basal
ice sequence. This produces a factor of about 2, which al-
lowed us to reconstruct a new timescale for the basal ice, as-
suming linear stretching also applying to the bottom ice, for
which δ18Oatm are not available. Unfortunately, this does not
resolve the discrepancy with the Lisiecki and Raymo curve
(Fig. 9b), and suggests that the amount of stretching is prob-
ably much larger, with an initial time frame for the basal ice
of only about 10 000 years. To build our 60 m of basal ice se-
quence in ca. 10 000 years would require an “in situ” annual
layer thickness of 6 mm, which is 10 times the value observed
during the previous glacial, following the recently published
AICC2012 climate record (Bazin et al., 2013, Supplement).
This seems too extreme, and suggests stretching might have
been supplemented by other processes such as dynamical
thickening in the lee of bedrock obstacles or stacking up of
several glacials, with missing interglacials. The latter is how-
www.the-cryosphere.net/9/1633/2015/ The Cryosphere, 9, 1633–1648, 2015
1644 J.-L. Tison et al.: Retrieving the paleoclimatic signal from the deeper part of the EPICA Dome C ice core
1
1 2
2
a
b
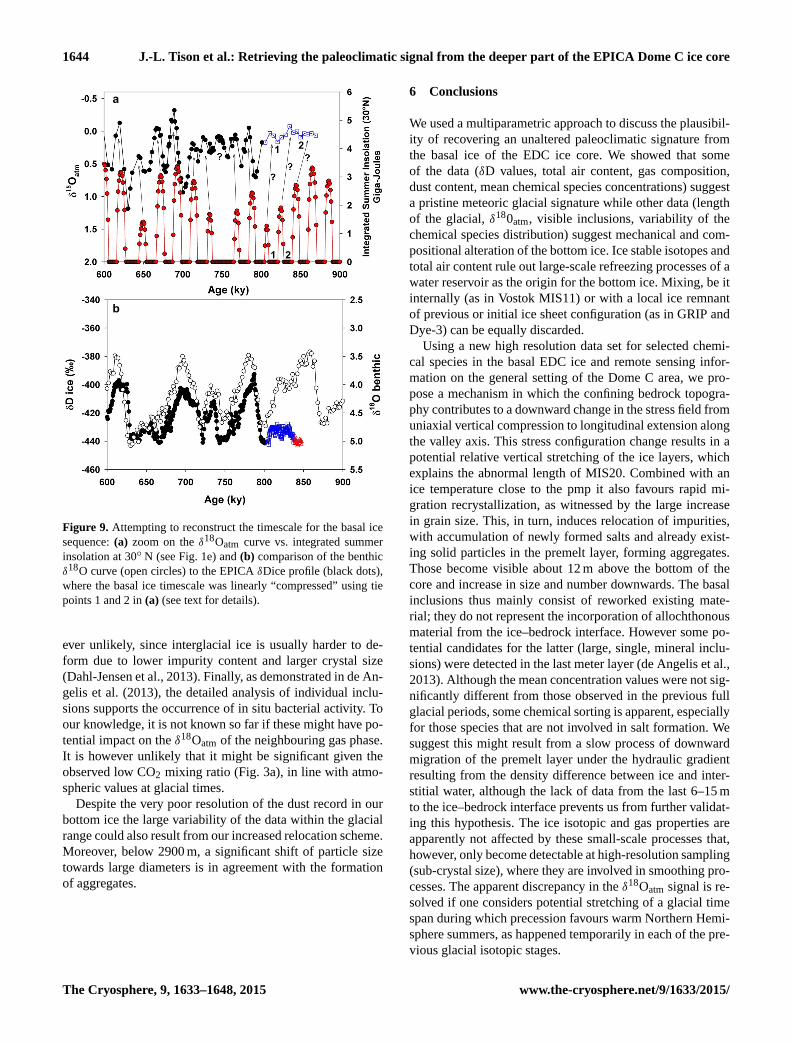
Figure 9. Attempting to reconstruct the timescale for the basal ice
sequence: (a) zoom on the δ18Oatm curve vs. integrated summer
insolation at 30◦ N (see Fig. 1e) and (b) comparison of the benthic
δ18O curve (open circles) to the EPICA δDice profile (black dots),
where the basal ice timescale was linearly “compressed” using tie
points 1 and 2 in (a) (see text for details).
ever unlikely, since interglacial ice is usually harder to de-
form due to lower impurity content and larger crystal size
(Dahl-Jensen et al., 2013). Finally, as demonstrated in de An-
gelis et al. (2013), the detailed analysis of individual inclu-
sions supports the occurrence of in situ bacterial activity. To
our knowledge, it is not known so far if these might have po-
tential impact on the δ18Oatm of the neighbouring gas phase.
It is however unlikely that it might be significant given the
observed low CO2 mixing ratio (Fig. 3a), in line with atmo-
spheric values at glacial times.
Despite the very poor resolution of the dust record in our
bottom ice the large variability of the data within the glacial
range could also result from our increased relocation scheme.
Moreover, below 2900 m, a significant shift of particle size
towards large diameters is in agreement with the formation
of aggregates.
6 Conclusions
We used a multiparametric approach to discuss the plausibil-
ity of recovering an unaltered paleoclimatic signature from
the basal ice of the EDC ice core. We showed that some
of the data (δD values, total air content, gas composition,
dust content, mean chemical species concentrations) suggest
a pristine meteoric glacial signature while other data (length
of the glacial, δ180atm, visible inclusions, variability of the
chemical species distribution) suggest mechanical and com-
positional alteration of the bottom ice. Ice stable isotopes and
total air content rule out large-scale refreezing processes of a
water reservoir as the origin for the bottom ice. Mixing, be it
internally (as in Vostok MIS11) or with a local ice remnant
of previous or initial ice sheet configuration (as in GRIP and
Dye-3) can be equally discarded.
Using a new high resolution data set for selected chemi-
cal species in the basal EDC ice and remote sensing infor-
mation on the general setting of the Dome C area, we pro-
pose a mechanism in which the confining bedrock topogra-
phy contributes to a downward change in the stress field from
uniaxial vertical compression to longitudinal extension along
the valley axis. This stress configuration change results in a
potential relative vertical stretching of the ice layers, which
explains the abnormal length of MIS20. Combined with an
ice temperature close to the pmp it also favours rapid mi-
gration recrystallization, as witnessed by the large increase
in grain size. This, in turn, induces relocation of impurities,
with accumulation of newly formed salts and already exist-
ing solid particles in the premelt layer, forming aggregates.
Those become visible about 12 m above the bottom of the
core and increase in size and number downwards. The basal
inclusions thus mainly consist of reworked existing mate-
rial; they do not represent the incorporation of allochthonous
material from the ice–bedrock interface. However some po-
tential candidates for the latter (large, single, mineral inclu-
sions) were detected in the last meter layer (de Angelis et al.,
2013). Although the mean concentration values were not sig-
nificantly different from those observed in the previous full
glacial periods, some chemical sorting is apparent, especially
for those species that are not involved in salt formation. We
suggest this might result from a slow process of downward
migration of the premelt layer under the hydraulic gradient
resulting from the density difference between ice and inter-
stitial water, although the lack of data from the last 6–15 m
to the ice–bedrock interface prevents us from further validat-
ing this hypothesis. The ice isotopic and gas properties are
apparently not affected by these small-scale processes that,
however, only become detectable at high-resolution sampling
(sub-crystal size), where they are involved in smoothing pro-
cesses. The apparent discrepancy in the δ18Oatm signal is re-
solved if one considers potential stretching of a glacial time
span during which precession favours warm Northern Hemi-
sphere summers, as happened temporarily in each of the pre-
vious glacial isotopic stages.
The Cryosphere, 9, 1633–1648, 2015 www.the-cryosphere.net/9/1633/2015/

J.-L. Tison et al.: Retrieving the paleoclimatic signal from the deeper part of the EPICA Dome C ice core 1645
We conclude that the paleoclimatic signal is only
marginally affected in terms of global ice properties at the
bottom of EPICA Dome C, but that the timescale was con-
siderably distorted by mechanical stretching due to the in-
creasing influence of the subglacial topography. It is inter-
esting to note that MIS18 already shows signs of isotopic
smoothing, chemical relocation and increased variability for
the species involved in salt formation (MSA, SO4, Mg and, in
a lesser extent Ca), before the timescale (EDC3) got signifi-
cantly distorted. Along the same line the anomalous flow de-
tected below 2700m, that led to the change from the EDC2 to
the EDC3 timescale, might already find its roots in this sub-
glacial topography distortion, although possible changes in
the Dome position with time need also to be considered (e.g.
Urbini et al., 2008). Many interior ice divides are indeed mi-
grating today, and this could also be the case for the EDC lo-
cation. Given the rough bed topography, it takes a migration
of only a few ice thicknesses to change the bedrock elevation
by ca. 200 m. The basal ice may therefore have experienced
vertical stretching due to flow from the bedrock ridge to the
current valley position, with recent migration of the divide at
the top. Today, lively discussions exist and preliminary ac-
tions are undertaken within the ice core community to select
a suitable location for a new deep drilling targeting the “old-
est ice” (above 1 million years old, IPICS, 2009). Our work
shows that the location of the EDC ice core on the flank of a
valley-type subglacial topography has considerably affected
the inference of deep timescales. We conclude that the re-
trieving of reliable paleoclimatic signals down to a few me-
tres from the ice–bedrock interface would probably be think-
able on a flat monotonic bedrock, for distances several times
the local ice thickness, although small-scale reworking of
some of the proxies should be expected. It is however not
clear yet why the gas content and composition is so well pre-
served at EDC, and not at other deep basal ice location. The
presence of a liquid water layer at the interface might partly
explain that discrepancy, although this could not be verified
here.
Future work on the EPICA DC bottom ice will involve
high resolution gas measurements in selected areas and an
in-depth analysis of the crystallographic properties below
3200 m. Hopefully, these will allow us to validate and refine
the general mechanism discussed here.
The Supplement related to this article is available online
at doi:10.5194/tc-9-1633-2015-supplement.
Acknowledgements. This work is a contribution to the European
Project for Ice Coring in Antarctica (EPICA), a joint Euro-
pean Science Foundation/European Commission (EC) scientific
programme, funded by the EU (EPICA-MIS) and by national
contributions from Belgium, Denmark, France, Germany, Italy, The
Netherlands, Norway, Sweden, Switzerland and the UK. The main
logistic support at Dome C was provided by IPEV and PNRA. The
authors wish to warmly thank B. Hubbard and two anonymous
referees for their constructive comments on the “Discussion”
version of this manuscript, and D. Raynaud and F. Parrenin for
valuable discussions.
Edited by: M. Schneebeli
References
Alley, R. B., Perepezko, J. H., and Bentley, C. R.: Grain growth in
polar ice, I. Theory, J. Glaciol., 32, 415–424, 1986.
Baker, I. and Cullen, D.: SEM/EDS observations of impurities in
polar ice: artefacts or not?, J. Glaciol., 49, 184–190, 2003.
Bazin, L., Landais, A., Lemieux-Dudon, B., Toyé Mahamadou
Kele, H., Veres, D., Parrenin, F., Martinerie, P., Ritz, C., Capron,
E., Lipenkov, V., Loutre, M.-F., Raynaud, D., Vinther, B., Svens-
son, A., Rasmussen, S. O., Severi, M., Blunier, T., Leuenberger,
M., Fischer, H., Masson-Delmotte, V., Chappellaz, J., and Wolff,
E.: An optimized multi-proxy, multi-site Antarctic ice and gas or-
bital chronology (AICC2012): 120–800 ka, Clim. Past, 9, 1715–
1731, doi:10.5194/cp-9-1715-2013, 2013.
Bender, M. L.: Orbital tuning chronology for the Vostok climate
record supported by trapped gas composition, Earth Planet. Sci.
Lett., 204, 275–289, 2002.
Boulton, G. S.: Processes of erosion on different substrata, J.
Glaciol., 23, 15–38, 1979.
Boulton, G. S.: Theory of glacial erosion, transport and deposition
as consequence of subglacial sediment deformation, J. Glaciol.,
42, 43–62, 1996.
Cuffey, K., Conway, H., Gades, A., Hallet, B., Lorrain, R., Sever-
inghaus, J. P., Steig, E., Vaughn, B., and White, J.: Entrainment
at cold glacier beds, Geology, 28, 351–354, 2000.
Dahl-Jensen, D., Albert, M. R., Aldahan, A., Azuma, N., Balslev-
Clausen, D., Baumgartner, M., Berggren, A.-M., Bigler, M.,
Binder, T., Blunier, T., Bourgeois, J. C., Brook, E. J., Buchardt,
S. L., Buizert, C., Capron, E., Chappellaz, J., Chung, J., Clausen,
H. B., Cvijanovic, I., Davies, S. M., Ditlevsen, P., Eicher, O.,
Fischer, H., Fisher, D. a., Fleet, L. G., Gfeller, G., Gkinis, V.,
Gogineni, S., Goto-Azuma, K., Grinsted, A., Gudlaugsdottir, H.,
Guillevic, M., Hansen, S. B., Hansson, M., Hirabayashi, M.,
Hong, S., Hur, S. D., Huybrechts, P., Hvidberg, C. S., Iizuka,
Y., Jenk, T., Johnsen, S. J., Jones, T. R., Jouzel, J., Karlsson,
N. B., Kawamura, K., Keegan, K., Kettner, E., Kipfstuhl, S.,
Kjær, H. a., Koutnik, M., Kuramoto, T., Köhler, P., Laepple,
T., Landais, A., Langen, P. L., Larsen, L. B., Leuenberger, D.,
Leuenberger, M., Leuschen, C., Li, J., Lipenkov, V., Martinerie,
P., Maselli, O. J., Masson-Delmotte, V., McConnell, J. R., Miller,
H., Mini, O., Miyamoto, A., Montagnat-Rentier, M., Mulvaney,
R., Muscheler, R., Orsi, a. J., Paden, J., Panton, C., Pattyn, F., Pe-
tit, J.-R., Pol, K., Popp, T., Possnert, G., Prié, F., Prokopiou, M.,
Quiquet, A., Rasmussen, S. O., Raynaud, D., Ren, J., Reutenauer,
C., Ritz, C., Röckmann, T., Rosen, J. L., Rubino, M., Rybak, O.,
Samyn, D., Sapart, C. J., Schilt, A., Schmidt, a. M. Z., Schwan-
der, J., Schüpbach, S., Seierstad, I., Severinghaus, J. P., Sheldon,
S., Simonsen, S. B., Sjolte, J., Solgaard, A. M., Sowers, T., Sper-
lich, P., Steen-Larsen, H. C., Steffen, K., Steffensen, J.-P., Stein-
www.the-cryosphere.net/9/1633/2015/ The Cryosphere, 9, 1633–1648, 2015

1646 J.-L. Tison et al.: Retrieving the paleoclimatic signal from the deeper part of the EPICA Dome C ice core
hage, D., Stocker, T. F., Stowasser, C., Sturlvik, A. S., Sturges, W.
T., Sveinbjörnsdottir, A., Svensson, A., Tison, J.-L., Uetake, J.,
Vallelonga, P., Van der Wal, R. S. W., van der Well, G., Vaughn,
B. H., Vinther, B., Waddington, E., Wegner, A., Weikusat, I.,
White, J. W. C., Wilhems, F., Winstrup, M., Witrant, E., Wolff,
E. W., Xiao, C., and Zheng, J.: Eemian interglacial reconstructed
from a Greenland folded ice core, Nature, 493, 489–494, 2013.
de Angelis, M., Petit, J.-R., Savarino, J., Souchez, R., and
Thiemens, M. H.: Contributions of an ancient evaporitic-type
reservoir to subglacial Lake Vostok chemistry, Earth Planet. Sci.
Lett., 222, 751–765, 2004.
de Angelis, M., Morel-Fourcade, M.-C. B., J.-M., Susini, J., and
Duval, P.: Brine micro-droplets and solid inclusions in accreted
ice from Lake Vostok (East Antarctica), Geophys. Res. Lett., 32,
L12501, doi:10.1029/2005GL022460, 2005.
de Angelis, M., Tison, J.-L., Morel-Fourcade, M.-C., and Susini,
J.: Micro-investigation of EPICA Dome C bottom ice: Evidence
of long term in situ processes involving acid-salt interactions,
mineral dust and organic matter, Quaternary Sci. Rev., 78, 248–
265, 2013.
Delmonte, B., Andersson, P. S., Haqnsson, M., Schöberg, H., Pe-
tit, J.-R., Basile-Doelsch, I., and Maggi, V.: Aeolian dust in
East Antarctica (EPICA-Dome C and Vostok): Provenance dur-
ing glacial ages over the last 800 kyr, Geophys. Res. Lett., 35,
L07703, doi:10.1029/2008GRL033382, 2008.
Dreyfus, G. B., Parrenin, F., Lemieux-Dudon, B., Durand, G.,
Masson-Delmotte, V., Jouzel, J., Barnola, J.-M., Panno, L.,
Spahni, R., Tisserand, A., Siegenthaler, U., and Leuenberger,
M.: Anomalous flow below 2700 m in the EPICA Dome C ice
core detected using d18O of atmospheric oxygen measurements,
Clim. Past, 3, 341–353, doi:10.5194/cp-3-341-2007, 2007.
Durand, G., Svensson, A., Persson, A., Gagliardini, O., Gillet-
Chaulet, F., Sjolte, J., Montagnat, M., and Dahl-Jensen, D.: Evo-
lution of the texture along the EPICA Dome C ice core, Proceed-
ings of the 2nd International Workshop on Physics of Ice Core
records (PICR-2), Hokkaido University, Sapporo, Japan, Insti-
tute of Low Temperature Science, 2009.
EPICA_Community_members: Eight glacial cycles from an
Antarctic ice core, Nature, 429, 623–628, 2004.
Glen, J. W., Homer, D. R., and Paren, J. G.: Water at grain bound-
aries: its role in the purification of temperate glacier ice, Int. As-
soc. Hydrogeol., 118, 263–271, 1977.
Goodwin, I. D.: Basal ice accretion and debris entrainment within
the coastal ice margin, Law Dome, Antarctica, J. Glaciol., 39,
157–166, 1993.
Gow, A. J. and Meese, D. A.: Nature of basal debris in the GISP2
and Byrd ice cores and its relevance to bed processes, Ann.
Glaciol., 22, 134–140, 1996.
Gow, A. J., Epstein, S., and Sheehy, W.: On the origin of stratified
debris in ice cores from the bottom of the Antarctic Ice Sheet, J.
Glaciol., 23, 185–192, 1979.
Herron, S. and Langway, C.: The debris-laden ice at the bottom of
the Greenland ice-sheet, J. Glaciol., 23, 193–207, 1979.
Holdsworth, G.: Meserve Glacier, Wright Valley, Antarctica – part
I: Basal processes, no. 37, Institute of Polar Studies, The Ohio
State University Research Foundation, Columbus, 1974.
Hubbard, B., Cook, S., and Coulson, H.: Basal ice facies: a review
and unifying approach, Quat. Sc. Rev., 28, 1956–1969, 2009.
Huybers, P.: Early Pleistocene glacial cycles and the integrated sum-
mer insolation forcing, Science, 313, 508–511, 2006.
International Partnerships in Ice Core Sciences: IPICS White pa-
pers, www.pages-igbp.org/ipics/whitepapers.html, 2009.
Iverson, N. R.: Regelation of ice through debris at glacier beds: Im-
plications for sediment transport, Geology, 21, 559–562, 1993.
Iverson, N. R. and Semmens, D.: Intrusion of ice into porous media
by regelation: A mechanism of sediment entrainment by glaciers,
J. Geophys. Res., 100, 10219–10230, 1995.
Jouzel, J., Petit, J. R., Souchez, R., Barkov, N., Lipenkov, V., Ray-
naud, D., Stievenard, M., Vassiliev, N., Verbeke, V., and Vimeux,
F.: More than 200 meters of lake ice above subglacial lake Vos-
tok, Antarctica, Science, 286, 2138–2141, 1999.
Jouzel, J., Masson-Delmotte, V., Cattani, O., Dreyfus, G., Falourd,
S., Hoffmann, G., Minster, B., Nouet, J., Barnola, J.M., Chap-
pelaz, J., Fischer, H., Gallet, J.C., Johnsen, S., Leuenberger, M.,
Loulergue, L., Luethi, D., Oerter, H., Parrenin, F., Raisbeck, G.,
Raynaud, D., Schilt, A., Schwander, J., Selmo, E., Souchez, R.,
Spahni, R., Stauffer, B., Steffensen, J.-P., Stenni, B., Stocker,
T.F., Tison, J.-L., Werner, M., and Wolff, E. W.: Orbital and Mil-
lennial Antarctic Climate Variability over the Past 800 000 Years,
Science, 317, 5839, doi:10.1126/science.1141038, 2007.
Knight, P. G.: The basal ice layer of glaciers and ice sheets, Quat.
Sci. Rev., 16, 975–993, 1997.
Koerner, R. M. and Fisher, D. A.: Discontinuous flow, ice texture,
and dirt content in the basal layers of the Devon Island Ice Cap,
J. Glaciol., 23, 209–221, 1979.
Lambert, F., Delmonte, B., Petit, J.-R., Bigler, M., Kaufmann, P.
R., Hutterli, M. A., Stocker, T. F., Ruth, U., Steffensen, J. P.,
and Maggi, V.: Dust-Climate couplings over the past 800 000
years from the EPICA Dome C ice core, Nature, 452, 616–619,
doi:10.1038/nature06763, 2008.
Landais, A., Dreyfus, G., Capron, E., Masson-Delmotte, V.,
Sanchez-Goni, M. F., Desprat, S., Hoffmann, G., Jouzel J.,
Leuenberger, M., and Johnsen, S.: What drives the millennial and
orbital variations of δ18Oatm?, Quateranry Sci. Rev., 29, 235–
246, 2010.
Landais, A., Dreyfus, G., Capron, E., Pol, K., Loutre, M. F., Ray-
naud, D., Lipenkov, V. Y., Arnaud, L., Masson-Delmotte, V.,
Paillard, D., Jouzel, J., and Leuenberger, M.: Towards orbital dat-
ing of the EPICA Dome C ice core using δO2 /N2, Clim. Past,
8, 191–203, doi:10.5194/cp-8-191-2012, 2012.
Lefebvre, E., Ritz, C., Legrésy, B., and Possenti, P.: New tempera-
ture profile measurement in the EPICA Dome C borehole, Geo-
physical Research Abstracts, EGU General Assembly 2008, 13–
18 April 2008, European Geophysical Union, 2008.
Lisiecki, L. E. and Raymo, M. E.: A Pliocene-Pleistocene stack of
57 globally distributed benthic δ18O records, Paleoceanography,
20, PA1003, doi:10.1029/2004PA001071, 2005.
Loulergue, L., Schilt, A., Spahni, R., Masson-Delmonte, V., Blu-
nier, T., Lemieux, B., Barnola, J.-M., Raynaud, D., Stocker, T. F.,
and Chappelaz, J.: Orbital and millennial-scale features of atmo-
spheric CH4 over the past 800 000 years, Nature, 453, 383–386,
doi:10.1038/nature06950, 2008.
Lüthi, D., Le Floch, M., Bereiter, B., Blunier, T., Barnola, J.-M.,
Siegenthaler, U., Raynaud, D., Jouzel, J., Fischer, H., Kawamura,
K., and Stocker, T. F.: High-resolution carbon dioxide concentra-
tion record 650 000–800 000 years before present, Nature, 453,
379–382, doi:10.1038/nature06949, 2008.
The Cryosphere, 9, 1633–1648, 2015 www.the-cryosphere.net/9/1633/2015/

J.-L. Tison et al.: Retrieving the paleoclimatic signal from the deeper part of the EPICA Dome C ice core 1647
Montagnat, M., Duval, P., Bastie, P., Hamelin, B., de Angelis, M.,
Petit, J. R., and Lipenkov, V. Y.: High crystalline quality of large
single crystals of subglacial ice above Lake Vostok (Antarctica)
revealed by hard X-ray diffraction, C.R. Acad. Sc. Paris, Série
IIa Sciences de la Terre et des Planètes, 333, 419–425, 2001.
Mulvaney, R., Wolff, E.W., and Oates, K.: Sulphuric acid at grain
boundaries in Antarctic ice, Nature, 331, 247–249, 1988.
Ohno, H., Igarashi, M., and Hondoh, T.: Salt inclusions in polar ice
cores: Location and chemical form of water-soluble impurities,
Earth Planet. Sci. Lett., 232, 171–178, 2005.
Parrenin, F., Barnola, J. M., Beer, J., Blunier, T., Castellano, E.,
Chappellaz, J. A., Dreyfus, G., Fisher, H., Fujita, S., Jouzel,
J., Kawamura, K., Lemieux-Dudon, B., Masson-Delmotte, V.,
Narasi, B.M., Petit, J.-R., Raisbeck, J., Raynaud, D., Ruth, U.,
Schwander, J., Severi, M., Spahni, R., Steffensen, J. P., Svens-
son, A. M., Udisti, R., Waelbroek, C., and Wolff, E. W.: The
EDC chronology for the EPICA Dome C ice core, Clim. Past,
3, 485–497, doi:10.5194/cp-3-485-2007, 2007.
Petit, J., Jouzel, J., Raynaud, D., Barkov, N., Barnola, J.M., Basile,
I., Bender, M., Chappellaz, J., Davis, M., Delaygue, G., Del-
motte, M., Kotlyakov, V., Legrand, M., Lipenkov, V., Lorius, C.,
Pépin, L., Ritz, C., Saltzman, E., and Stievenard, M.: Climate and
atmospheric history of the past 420 000 years from the Vostok ice
core, Antarctica, Nature, 399, 429–436, 1999.
Pol, K., Masson-Delmotte, V., Johnsen, S., Bigler, M., Cattani, O.,
Durand, G., Falourd, S., Jouzel, J., Minster, B., Parrenin, F., Ritz,
C., Steen-Larsen, H. C., and Stenni, B.: New MIS 19 EPICA
Dome C high resolution deuterium data: Hints for a problematic
preservation of climate variability at sub-millennial scale in the
“oldest ice”, Earth Planet. Sci. Lett., 298, 1/2, 95–103, 2010.
Pol, K., Debret, M., Masson-Delmotte, V., Capron, E., Cattani, O.,
Dreyfus, G., Falourd, S., Johnsen, S., Jouzel, J., Landais, A.,
Minster, B., and Stenni, B.: Links between MIS 11 millennial
to sub-millennial climate variability and long term trends as re-
vealed by new high resolution EPICA Dome C deuterium data
– A comparison with the Holocene, Clim. Past, 7, 437–450,
doi:10.5194/cp-7-437-2011, 2011.
Raisbeck, G. M., Yiou, F., Cattani, O., and Jouzel, J.: 10Be evidence
for the Matuyama-Brunhes geomagnetic reversal in the EPICA
Dome C ice core, Nature, 444, 82–84, doi:10.1038/nature05266,
2006.
Raynaud D., Barnola, J.-M., R. Souchez, R. Lorrain, Petit J.-R., Du-
val P., and Lipenkov V.: The record for marine isotopic stage 11,
Nature, 436, 30–40, 2005.
Raynaud, D., Lipenkov, V., Lemieux-Dudon, B., Duval, P., Loutre,
M.-F., and Lhomme, N.: The local insulation signature of air con-
tent in Antarctic ice. A new step toward an absolute dating of ice
records, Earth Planet. Sci. Lett., 261, 337–349, 2007.
Rempel, A.: Englacial phase changes and intergranular flow above
subglacial lakes, Ann. Glaciol., 40, 191–194, 2005.
Rempel, A. W., Waddington, E. D., Wettlaufer, J. S., and Worster,
M. G.: Possible displacement of the climate signal in ancient ice
by premelting and anomalous diffusion, Nature, 411, 568–571,
2001.
Rempel, A. W., Wettlaufer, J. S., and Waddington, E. D.: Anoma-
lous diffusion of multiple impurity species: predicted implica-
tions for the ice core climate record, J. Geophys. Res., 107, 2330,
doi:10.1029/2002JB001857, 2002.
Rempel, A. W.: Segregation, transport and interaction of climate
proxies in polycrystalline ice, Can. J. Phys., 81, 89–97, 2003.
Remy, F. and Tabacco, I. E.: Bedrock features and ice flow near the
EPICA ice core site (Dome C, Antarctica), Geophys. Res. Lett.,
27, 405–408, 2000.
Schilt, A., Baumgartner M., Blunier T., Schwander J., Spahni R.,
Fischer H., and Stocker, T. F.: Glacial-interglacial and millennial-
scale variations in the atmospheric nitrous oxide concentration
during the last 800 000 years, Quat. Sci. Rev., 29, 182–192,
doi:10.1016/j.quascirev.2009.03.011, 2010.
Souchez, R.: The build up of the ice sheet in Central Greenland, J.
Geophys. Res., 102, 26317–26323, 1997.
Souchez, R. and Lorrain, R.: Ice composition and glacier dynamics,
Heidelberg, Springer-Verlag, 0 387 52521 1, 207 pp., 1991.
Souchez, R., Lorrain, R., Tison, J.-L., and Jouzel, J.: Co-isotopic
signature of two mechanisms of basal-ice formation in Arctic
outlet glaciers, Ann. Glaciol., 10, 163–166, 1988.
Souchez, R., Lemmens, M., Tison, J.-L., Lorrain, R., and Janssens,
L.: Reconstruction of basal boundary conditions at the Greenland
Ice Sheet margin from gas composition in the ice, Earth Planet.
Sci. Lett., 118, 327–333, 1993.
Souchez, R., Tison, J. L., Lorrain, R., Janssens, L., Stievenard, M.,
Jouzel, J., Sveinbjörnsdottir, A., and Johnsen, S. J.: Stable iso-
topes in the basal silty ice preserved in the Greenland Ice Sheet
at Summit; Environmental implications, Geophys. Res. Lett., 21,
693–696, 1994.
Souchez, R., Janssens, L., Lemmens, M., and Stauffer, B.: Very low
oxygen concentration in basal ice from Summit, Central Green-
land, Geophys. Res. Lett., 22, 2001–2004, 1995a.
Souchez, R., Lemmens, M., and Chappellaz, J.: Flow-induced mix-
ing in the GRIP basal ice deduced from the CO2 and CH4
records, Geophys. Res. Lett., 22, 41–44, 1995b.
Souchez, R., Bouzette, A., Clausen, H., Johnsen, S., and Jouzel,
J.: A stacked mixing sequence at the base of the Dye 3 core,
Greenland, Geophys. Res. Lett., 25, 1943–1946, 1998.
Souchez, R., Petit, J. R., Tison, J. L., Jouzel, J., and Verbeke, V.: Ice
formation in subglacial Lake Vostok, Central Antarctica, Earth
Planet. Sci. Lett., 181, 529–538, 2000a.
Souchez, R., Vandenschrick, G., Lorrain, R., and Tison, J.-L.: Basal
ice formation and deformation in Central Greenland : a review
of existing and new ice core data, in: Deformation of Glacial
Materials, edited by: Maltman, A. J., Hubbard, B., and Hambrey,
M., Special Publication no. 176, 13–22, 2000b.
Souchez, R., Jean-Baptiste, R., Petit, J. R., Lipenkov, V., and Jouzel,
J.: What is the deepest part of the Vostok ice core telling us,?
Earth Sci. Rev., 60, 131–146, 2002a.
Souchez, R., Petit, J. R., Jouzel, J., Simões, J., de Angelis, M.,
Barkov, N., Stievenard, M., Vimeux, F., Sleewaegen, S., and Lor-
rain, R.: Highly deformed basal ice in the Vostok core, Antarc-
tica, Geophys. Res. Lett., 29, 4041–4044, 2002b.
Souchez, R., Petit, J.-R., Jouzel, J., de Angelis, M., and Tison, J. L.:
Reassessing Lake Vostok’s behaviour from existing and new ice
core data, Earth Planet. Sci. Lett., 217, 163–170, 2003.
Souchez, R., Jouzel, J., Landais, A., Chapellaz, J., Lorrain, R., and
Tison, J.-L.: Gas isotopes in ice reveal a vegetated central Green-
land during ice sheet invasion, Geophys. Res. Lett., 33, L24503,
doi:10.1029/2006GL028424, 2006.
Stenni, B., Masson-Delmotte, V., Selmo, E., Oerter, H., Meyer, H.,
Rothilsberger, R., Jouzel, J., Cattani, O., Falourd, S., Fisher, H.,
www.the-cryosphere.net/9/1633/2015/ The Cryosphere, 9, 1633–1648, 2015

1648 J.-L. Tison et al.: Retrieving the paleoclimatic signal from the deeper part of the EPICA Dome C ice core
Hoffmann, G., Iacumin, P., Johnsen, S., Minster, B., and Udisti,
R.: The deuterium excess records of EPICA Dome C and Dron-
ning Maud Land ice cores (East Antarctica), Quat. Sci. Rev., 29,
146–159, 2010.
Tabacco, I.E., Passerini A., Corbelli, F., and Gorman, M.: Deter-
mination of the surface and bed topography at Dome C, East
Antarctica, J. Glaciol., 44, 185–191, 1998.
Tison, J.-L. and Lorrain, R.: A mechanism of basal ice layer forma-
tion involving major ice-fabrics changes, J. Glaciol., 33, 47–50,
1987.
Tison, J.-L., Souchez, R., and Lorrain, R.: On the incorporation
of unconsolidated sediments in basal ice: present-day examples,
Zeit, Geomorphology, 72, 173–183, 1989.
Tison, J.-L., Petit, J. R., Barnola, J. M., and Mahaney, W. C.: Debris
entrainment at the ice-bedrock interface in sub-freezing temper-
ature conditions (Adélie Land, Antarctica), J. Glaciol., 39, 303–
315, 1993.
Tison, J.-L., Thorsteinsson, T., Lorrain, R., and Kipfstuhl, J.: Origin
and development of textures and fabrics in basal ice at Summit,
Central Greenland, Earth Planet. Sci. Lett., 125, 421–437, 1994.
Tison, J.-L., Souchez, R., Wolff, E. W., Moore, J. C., Legrand, M.
R., and de Angelis, M.: Is a periglacial biota responsible for en-
hanced dielectric response in basal ice from the Greenland Ice
Core Project ice core?, J. Geophys. Res., 103, 18885–18894,
1998.
Traversi, R., Becagli, S., Castellano, E., Marino, F., Severi, M., Ud-
isti, R., Kaufmann, P., Lambert, F., Stauffer, B., Hansson, M.,
Petit, J. R., Ruth, U., Raisbeck, G., and Wolff, E. W.: Chemi-
cal characterization of peculiar ice layers at the bottom of the
EPICA-DC ice core, Geophysical Research Abstracts, 8, 07199,
European Geosciences Union General Assembly 2006, 02-07
April 2006, EGU, 2006.
Traversi, R., Becagli, S., Castellano, E., Marino, F., Rugi, F., Sev-
eri, M., de Angelis, M., Fisher, H., Hansson, M., Steffensen, J.
P., Wolff, E. W., and Udisti, R.: Sulfate spikes at the bottom of
the EDC core: evidence of glaciological artefacts, Environ. Sci.
Technol., 43, 8737–8743, 2009.
Urbini, S., Frezzotti, M., Gandolfi, S., Vincent, C., Scarchilli, C.,
Vittuari, L., and Fily, M.: Historical behaviour of Dome C and
Talos Dome (East Antarctica) as investigated by snow accumu-
lation and ice velocity measurements, Glob. Planet. Change, 60,
576–588, 2008.
Verbeke, V., Lorrain, R., Johnsen, S. J., and Tison, J.-L.: A multiple-
step deformation history of basal ice from the Dye3 (Greenland)
core: new insights from the CO2 and CH4 content, Ann. Glaciol.,
35, 231–236, 2002.
Weis, D., Demaiffe, D., Souchez, R., Gow, A. J., and Meese, D. A.:
Nd, Sr and Pb isotopic compositions of basal material in Central
Greenland: inferences for ice sheet development, Earth Planet.
Sci. Lett., 150, 161–169, 1997.
Wettlaufer, J. S.: Impurity effects in the Premelting of ice, Phys.
Rev. Lett., 82, 2516–2519, 1999.
Wolff, E. W., Fisher, H., Fundel, F., Ruth, U., Twarloh, B., Littot, G.
C., Mulvaney, R., Röthlisberger, R., de Angelis, M., Boutron, C.
F., Hansson, M., Jonsell, U., Hutterli, M. A., Lambert, F., Kauf-
mann, P., Stauffer, B., Stocker, T. F., Steffensen, J. P., Bigler,
M., Siggaard-Andersen, M. L., Udisti, R., Becagli, S., Castel-
lano, E., Severi, M., Wagenbach, D., Barbante, C., Gabrielli, P.,
and Gaspari, V.: Southern Ocean sea-ice extent, productivity and
iron flux over the past eight glacial cycles, Nature, 440, 491–496,
doi:10.1038/nature04614, 2006.
The Cryosphere, 9, 1633–1648, 2015 www.the-cryosphere.net/9/1633/2015/