Embed Size (px)
Citation preview

Return on Capital Employed
Review of 2015 Returns of the NZ Listed Sector and NZ
Crown Entities
June 2016

2015 Return on Capital Employed
1 | P a g e
Contents
Foreword 2
Executive Summary 3
Top Performers 4
Distribution of Results 5
Markets 6
International Comparison 7
Crown Entities 8
Non-Listed Companies 9
Sector Performance 10
ROCE Application: Retail Fuel Sector Performance 11
Individual Entities 12
About Armillary Private Capital 16
Sources of Data 16
Appendix 1 – Detailed Results 17
Appendix 2 – ROCE Explained 23
Disclaimer
The information contained in this report has been prepared by Armillary Private Capital ('Armillary'). While the intention is to provide accurate
information based on historical performance and market information, Armillary accepts no liability for any errors or inaccuracies in this report. The
reader is advised to perform their own research to confirm the accuracy of the information contained in this report before relying on it for any
investment decision making. This report has been prepared as a 'class service' as defined by the Financial Advisers Act and is general in nature.

2015 Return on Capital Employed
2 | P a g e
Foreword
We are delighted to bring you the fifth Armillary Private Capital Return on Capital Employed (ROCE) report. This year the total number of entities in
our data set of NZX, NZAX, NXT, Unlisted and selected Crown entities is one less than last year, at 160. We have also included a confidential
sample of 118 non-listed companies to be compared to the overall dataset, although we have not identified these entities individually.
The ROCE methodology we use in this report was developed by Du Pont Corporation and therefore is not proprietary to us, although we are
proponents. As it is simple to apply, anyone who understands the methodology can use it. We regularly use this methodology as a tool in our
client engagements and in our financial training curriculum.
A benefit of the ROCE methodology is that the performance of an entity can be broken down into its components of profitability and activity, for
deeper analysis. Profitability, as measured by EBIT margin, provides an indication of operational efficiency; activity, as measured by asset turn-
over, provides an indication of balance-sheet efficiency. A full explanation of ROCE is included in Appendix 2.
This year’s report includes an overview of the major sectors in the economy to demonstrate the effect that differences in business models has had
in the subsequent profitability, activity and overall ROCE performance. Our sector spotlight this year is on the NZ retail fuel sector, which has been
a sector of discussion recently due to the fall in global oil prices, increases in importer retail margin and, most recently, the acquisition of Caltex by
Z Energy.
We continue to advocate the ROCE methodology in our work with businesses as a simple to use and easily understood tool for measuring
business performance, identifying improvement strategies, creating incentive remuneration programs, and for testing budgets and forecasts,
especially those applied in valuations. We also see the data and results in this report as providing useful benchmarks for business performance in
the New Zealand market.
We trust that the insights contained in this report provide value to investors, business owners and managers alike.
David Wallace
Joint Managing Director

2015 Return on Capital Employed
3 | P a g e
Executive Summary
This year’s ROCE review of the 2015 financial results included 119
companies with primary listings on the NZX, 18 NZAX listed companies, 2
NXT listed companies, 12 companies from Unlisted, and nine Crown
Entities. This has resulted in a total sample size of 160 firms for 2015, which
is one less than our analysis for 2014. For this report we have grouped the
NZAX and NXT companies.
In addition to our sample of listed and Crown entities, we have included
a sample of 118 privately held companies. These have been reviewed
separately from, and compared to the main sample.
- The median performance across all NZ Markets (including the
Crown Entities) has remained steady at 6.2% over the last two
years. This is less than common estimates of the market weighted
average cost of capital for NZX listed companies of between 8%
and 9%.
- Finzsoft Solutions was the top performer in 2015 with a ROCE of 84.4%, reflecting high levels of operational leverage and profitability.
- The IT and consumer discretionary sectors continue to make up the majority of the top 10 performers. The industrials sector as a whole was
the best performing sector. However, interestingly the IT sector performed poorly overall, with the lowest median 2015 ROCE of all sectors.
This indicates a high variability of performance within this sector.
- The median ROCE of NZX50 constituent companies (2015: 6.5%) came out slightly below companies in comparable international indices in
Europe (2015: 6.7%). Companies in comparable Australian and US indices (S&P ASX200 and S&P 500) significantly outperformed New
Zealand in 2015, with median ROCE’s of 10.4% and 13% respectively. This is similar to the previous year.
- For the Crown Entities, the 2015 median ROCE was 4.3% (up from 2.5% in 2014), with Airways Corporations again recording the best
performance from that group, achieving a ROCE of 20.3%.
6.3%6.1%
6.6%6.2% 6.2%
0%
1%
2%
3%
4%
5%
6%
7%
2011 2012 2013 2014 2015
ROCE
Year
Median ROCE (All NZ Markets)
2015 Return on Capital Employed
4 | P a g e
Top Performers
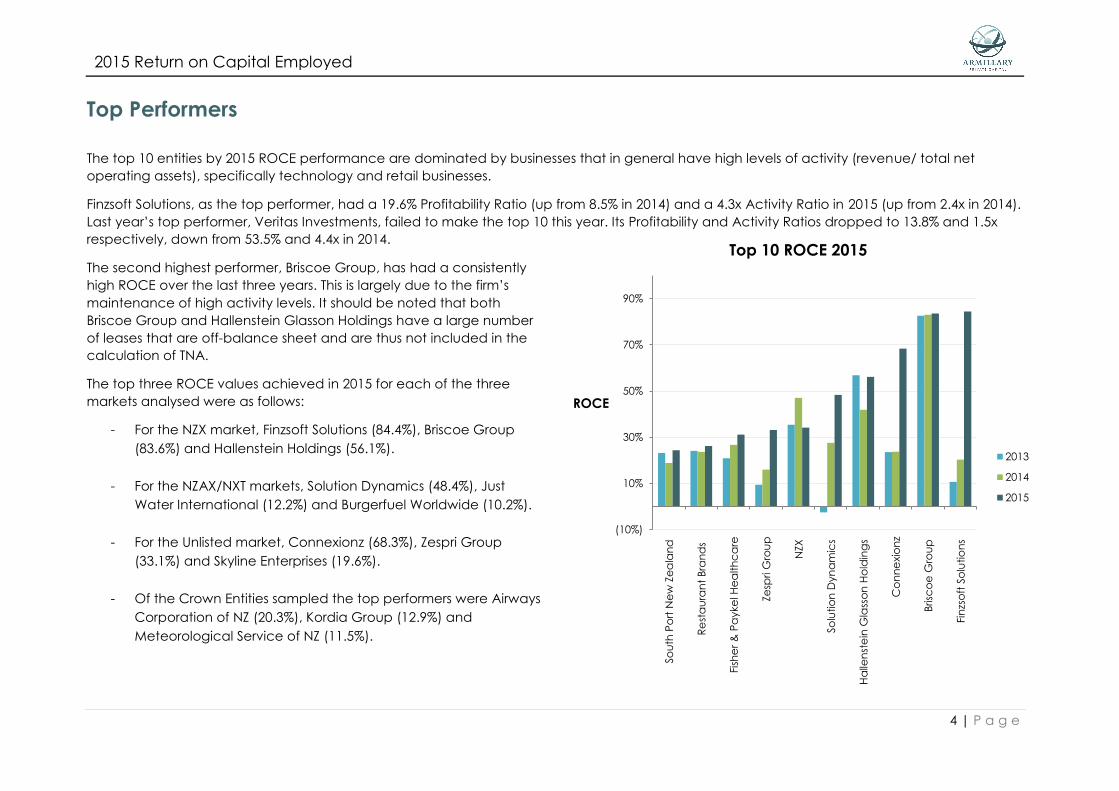
The top 10 entities by 2015 ROCE performance are dominated by businesses that in general have high levels of activity (revenue/ total net
operating assets), specifically technology and retail businesses.
Finzsoft Solutions, as the top performer, had a 19.6% Profitability Ratio (up from 8.5% in 2014) and a 4.3x Activity Ratio in 2015 (up from 2.4x in 2014).
Last year’s top performer, Veritas Investments, failed to make the top 10 this year. Its Profitability and Activity Ratios dropped to 13.8% and 1.5x
respectively, down from 53.5% and 4.4x in 2014.
The second highest performer, Briscoe Group, has had a consistently
high ROCE over the last three years. This is largely due to the firm’s
maintenance of high activity levels. It should be noted that both
Briscoe Group and Hallenstein Glasson Holdings have a large number
of leases that are off-balance sheet and are thus not included in the
calculation of TNA.
The top three ROCE values achieved in 2015 for each of the three
markets analysed were as follows:
- For the NZX market, Finzsoft Solutions (84.4%), Briscoe Group
(83.6%) and Hallenstein Holdings (56.1%).
- For the NZAX/NXT markets, Solution Dynamics (48.4%), Just
Water International (12.2%) and Burgerfuel Worldwide (10.2%).
- For the Unlisted market, Connexionz (68.3%), Zespri Group
(33.1%) and Skyline Enterprises (19.6%).
- Of the Crown Entities sampled the top performers were Airways
Corporation of NZ (20.3%), Kordia Group (12.9%) and
Meteorological Service of NZ (11.5%).
(10%)
10%
30%
50%
70%
90%
So
uth
Po
rt N
ew
Ze
ala
nd
Re
sta
ura
nt
Bra
nd
s
Fish
er
& P
ayke
l He
alth
ca
re
Ze
spri G
rou
p
NZX
So
lutio
n D
yn
am
ics
Ha
llen
ste
in G
lass
on
Ho
ldin
gs
Co
nn
exio
nz
Brisc
oe
Gro
up
Fin
zso
ft S
olu
tio
ns
ROCE
Top 10 ROCE 2015
2013
2014
2015
2015 Return on Capital Employed
5 | P a g e
Distribution of Results
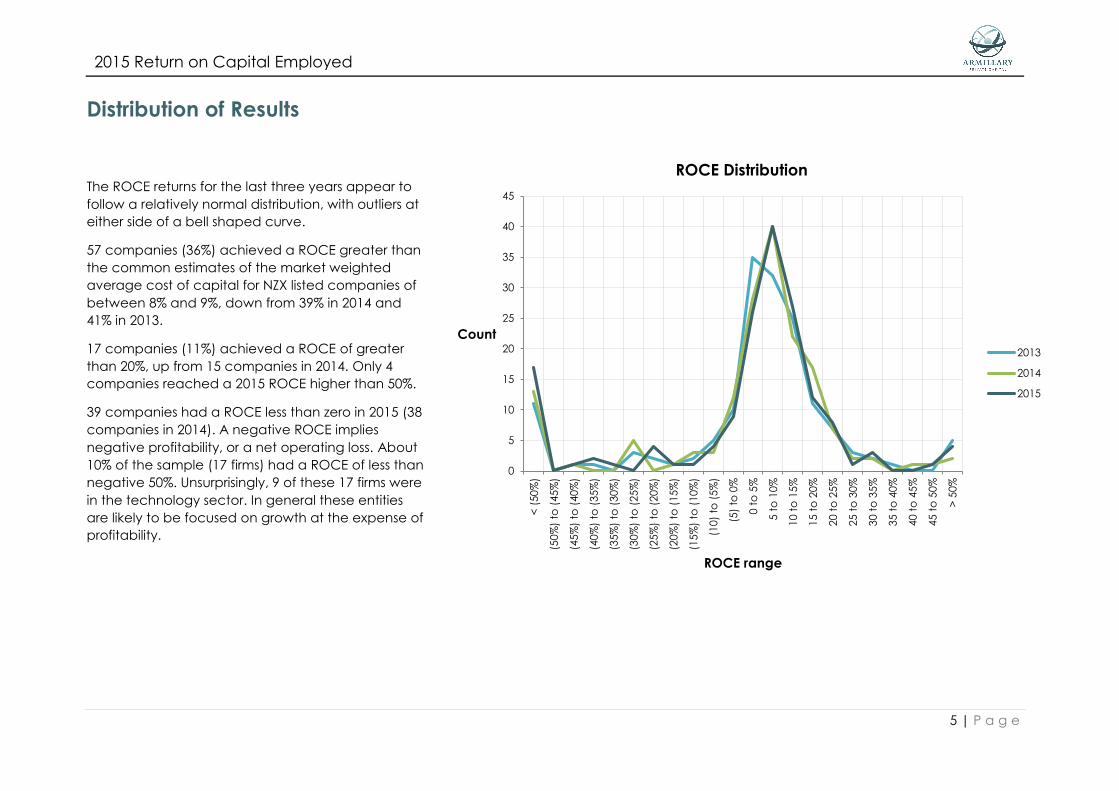
The ROCE returns for the last three years appear to
follow a relatively normal distribution, with outliers at
either side of a bell shaped curve.
57 companies (36%) achieved a ROCE greater than
the common estimates of the market weighted
average cost of capital for NZX listed companies of
between 8% and 9%, down from 39% in 2014 and
41% in 2013.
17 companies (11%) achieved a ROCE of greater
than 20%, up from 15 companies in 2014. Only 4
companies reached a 2015 ROCE higher than 50%.
39 companies had a ROCE less than zero in 2015 (38
companies in 2014). A negative ROCE implies
negative profitability, or a net operating loss. About
10% of the sample (17 firms) had a ROCE of less than
negative 50%. Unsurprisingly, 9 of these 17 firms were
in the technology sector. In general these entities
are likely to be focused on growth at the expense of
profitability.
0
5
10
15
20
25
30
35
40
45
< (
50
%)
(50%
) to
(4
5%
)
(45%
) to
(4
0%
)
(40%
) to
(3
5%
)
(35%
) to
(3
0%
)
(30%
) to
(2
5%
)
(25%
) to
(2
0%
)
(20%
) to
(1
5%
)
(15%
) to
(1
0%
)
(10)
to (
5%
)
(5)
to 0
%
0 t
o 5
%
5 t
o 1
0%
10 t
o 1
5%
15 t
o 2
0%
20 t
o 2
5%
25 t
o 3
0%
30 t
o 3
5%
35 t
o 4
0%
40 t
o 4
5%
45 t
o 5
0%
> 5
0%
Count
ROCE range
ROCE Distribution
2013
2014
2015
2015 Return on Capital Employed
6 | P a g e
Market
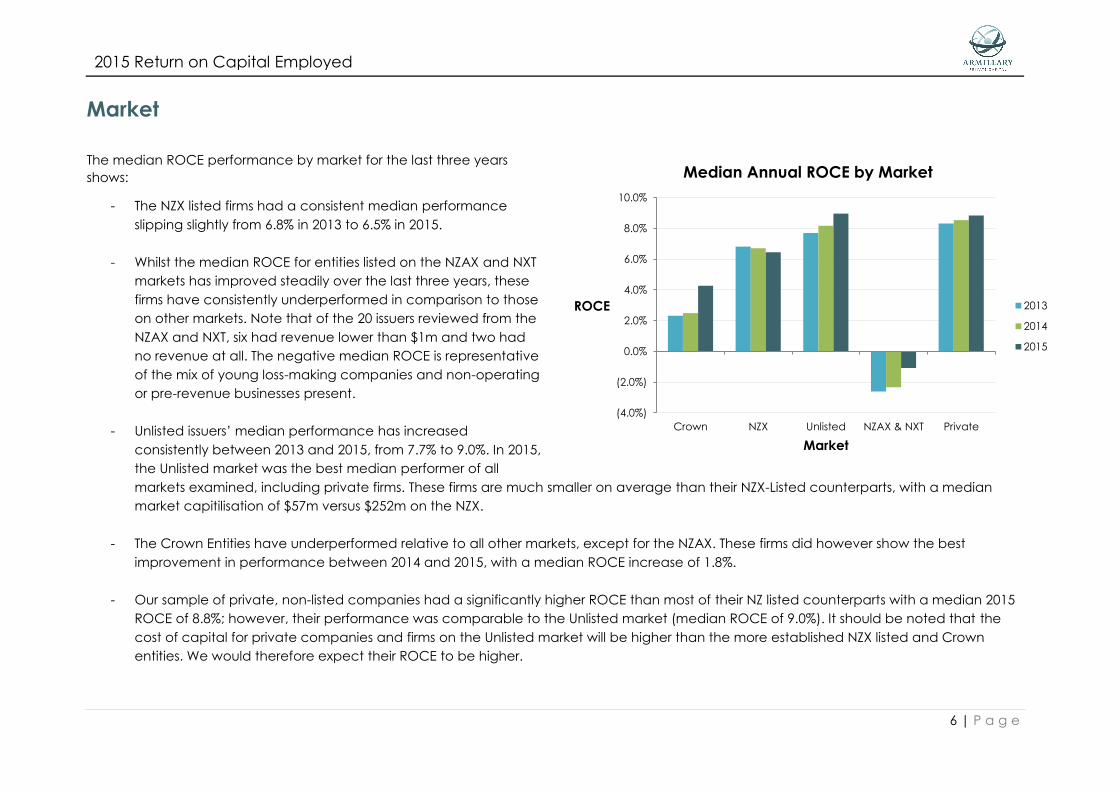
The median ROCE performance by market for the last three years
shows:
- The NZX listed firms had a consistent median performance
slipping slightly from 6.8% in 2013 to 6.5% in 2015.
- Whilst the median ROCE for entities listed on the NZAX and NXT
markets has improved steadily over the last three years, these
firms have consistently underperformed in comparison to those
on other markets. Note that of the 20 issuers reviewed from the
NZAX and NXT, six had revenue lower than $1m and two had
no revenue at all. The negative median ROCE is representative
of the mix of young loss-making companies and non-operating
or pre-revenue businesses present.
- Unlisted issuers’ median performance has increased
consistently between 2013 and 2015, from 7.7% to 9.0%. In 2015,
the Unlisted market was the best median performer of all
markets examined, including private firms. These firms are much smaller on average than their NZX-Listed counterparts, with a median
market capitilisation of $57m versus $252m on the NZX.
- The Crown Entities have underperformed relative to all other markets, except for the NZAX. These firms did however show the best
improvement in performance between 2014 and 2015, with a median ROCE increase of 1.8%.
- Our sample of private, non-listed companies had a significantly higher ROCE than most of their NZ listed counterparts with a median 2015
ROCE of 8.8%; however, their performance was comparable to the Unlisted market (median ROCE of 9.0%). It should be noted that the
cost of capital for private companies and firms on the Unlisted market will be higher than the more established NZX listed and Crown
entities. We would therefore expect their ROCE to be higher.
(4.0%)
(2.0%)
0.0%
2.0%
4.0%
6.0%
8.0%
10.0%
Crown NZX Unlisted NZAX & NXT Private
ROCE
Market
Median Annual ROCE by Market
2013
2014
2015

2015 Return on Capital Employed
7 | P a g e
International Comparison
In order to benchmark New Zealand’s performance, we have also reviewed the performance of companies in the European, Australian and US
markets, as selected by the EURO STOXX 50, S&P/ASX 200 and S&P 500 indices respectively. For comparability, we have isolated the performance
of the NZX50 index constituents from that of the entire group of NZX listed entities.
- The NZX50 index group of companies had a significantly higher median
performance than the overall NZX main board in 2013 and 2014 (1.4%
and 1.7% higher respectively). However, in 2015 the median ROCE for
NZX50 firms dropped to 6.5%, which is the same as that of the main
board. The NZX50 companies represent more than 85% of the NZ listed
equity market capitalisation.
- The EURO STOXX 50 index covers 50 blue-chip stocks from 12 Eurozone
countries. It represents more than 50% of the entire free-float market
capitalisation of all Eurozone listed equities. This index’s performance
was comparable to the NZX and NZX50 in 2015 (median ROCE of 6.7%),
however it was outperformed by the NZX50 in previous years.
- The S&P/ASX 200 index is recognised as the institutional investable
benchmark in Australia. The index covers approximately 80% of the equity market capitalisation in Australia. Median ROCE performance improved
significantly in 2015, increasing from 8.5% to 10.4%, and was noticably higher than that of the NZX and European companies. However, despite this overall
improvement, the median ROCE for Australian energy and mining companies declined significantly between 2014 and 2015, from 7.5% to 1.9%. The
increase in median ROCE was largely driven by a significant performance improvement in the IT, consumer staples and industrials sectors.
- THE S&P 500 index captures approximately 80% of the total US listed equity market capitalisation. The companies in this index have consistently produced
a significantly higher ROCE than the other markets examined. It is also the only index in the sample that has presented a steady improvement of median
ROCE between 2013 and 2015, increasing from 12.1% in 2013 to 13.3% in 2015.
- Note that the average cost of capital in the comparison markets will vary from that of New Zealand. In general, companies in the comparison indices
tend to be larger and the cost of debt in each of the markets is currently lower, therefore they will have a lower cost of capital.
0.0%
2.0%
4.0%
6.0%
8.0%
10.0%
12.0%
14.0%
16.0%
NZX EUROSTOXX NZX50 AUS S&P200 USA S&P500
ROCE
Market
Median Annual ROCE Internationally
2013
2014
2015

2015 Return on Capital Employed
8 | P a g e
Crown Entities
The nine Crown Entities in our analysis have been
selected as they are generally considered among the
most commercially run entities in the Crown’s portfolio.
The overall performance of the Crown Entities
improved significantly in 2015, with median ROCE
increasing from 2.5% (2014) to 4.3% (2015). Despite this
improvement, crown-owned firms delivered
performance results below the median levels of publicly
listed and privately held entities in general.
- Four of the nine Crown Entities reported
improved ROCE in 2015 compared to 2014.
- Airways Corporation recorded the best
performance, improving from its 2014 ROCE of
15.2% to 20.3% in 2015. This improvement was
wholly driven by an increase its profitability ratio
(from 10.7% to 15.4%). In fact, the firm’s activity
levels decreased slightly, from 1.42 to 1.32.
- Kordia Group regained its position in the top
three performers with a 2015 ROCE of 12.9%. The
company’s low 2014 ROCE of negative 6.1%
was the result of its operating loss.
(10%)
(5%)
0%
5%
10%
15%
20%
25%
30%
Ne
w Z
ea
lan
d R
ailw
ay C
orp
ora
tio
ns
Lan
dc
orp
Fa
rmin
g
Ne
w Z
ea
lan
d P
ost
Kiw
ira
il H
old
ing
s
Pu
blic
Tru
st
Tra
nsp
ow
er
Ne
w Z
ea
lan
d
Me
teo
rog
ica
l Se
rvic
e o
f N
Z
Ko
rdia
Gro
up
Airw
ays
Co
rpo
ratio
n o
f N
Z
ROCE
Crown Entities
2013
2014
2015

2015 Return on Capital Employed
9 | P a g e
Non-Listed Companies
Due to our change in data providers, we now have a much more comprehensive sample of 118 private, non-listed companies (only 44 firms were examined in
last year’s report). These 118 companies are reviewed to see how they compare with their listed peers. The larger sample size will improve the statistical power of
our analysis. However, it should be noted that we are not making any definitive conclusions
regarding the nature of private companies in New Zealand, especially at the sector level
wherein the sample sizes are very small.
Of the sample of non-listed companies, 25 are involved in the industrials sector, 22 in consumer
staples, 20 in consumer discretionary, 16 in financials and 12 in utilities. The rest are thinly spread
over the other sectors.
Analysis
- The distribution of ROCE for the non-listed companies is similar to that of the NZ listed
firms; however, the NZ listed firms present more extreme outliers (ROCEs of less than
negative 50%).
- All companies in the top quartile achieved a ROCE of greater than 17.5%, while those in
the lowest quartile were all lower than 3.2%. This compares to an upper and lower
quartile cut-off of 12.9% and 0.0% respectively for listed NZ firms.
- Interestingly, the two best performing sectors for non-listed companies in 2015 were two of
the worst performing NZ listed sectors (Energy and IT). Median 2015 ROCEs in these sectors
for non-listed firms were 31% and 13% respectively, compared to 4% and negative 3% for
NZ listed firms.
Although the median ROCE is higher than that reported for the NZ listed sector, ROCE needs to be
judged against the weighted average cost of capital of the entity. In the case of these typically
non-listed companies, the capital weighting will typically be biased towards equity rather than
debt. In addition to equity being more expensive than debt in general, the cost of equity for
private companies is significantly higher than that of listed companies due to investors requiring a
premium for higher risk. For example, higher risk relates to smaller sized, less mature firms potentially
with less depth and/or quality of management, lower quality of information disclosure and lack of
liquidity or marketability of the equity holding. Therefore the 2015 median ROCE of 8.8% would
suggest that the majority of the private companies reviewed are not generating a return above
their weighted average cost of capital, which for public companies is around 8%-9%.
05
1015202530354045
< (
50
%)
(50%
) to
(45%
)
(45%
) to
(40%
)
(40%
) to
(35%
)
(35%
) to
(30%
)
(30%
) to
(25%
)
(25%
) to
(20%
)
(20%
) to
(15%
)
(15%
) to
(10%
)
(10)
to (
5%
)
(5)
to 0
%
0 t
o 5
%
5 t
o 1
0%
10
to
15
%
15
to
20
%
20
to
25
%
25
to
30
%
30
to
35
%
35
to
40
%
40
to
45
%
45
to
50
%
> 5
0%
Co
un
t
ROCE Range
ROCE Distribution, Non-Listed Companies
2013
2014
2015
NZ Listed
2015
(5%)
0%
5%
10%
15%
20%
25%
30%
35%
2015 Median ROCE Comparison by Sector -
Listed and Non-listed Entities
Median 2015 ROCE - Non-listed Median 2015 ROCE - Listed
2015 Return on Capital Employed
10 | P a g e
Sector Performance
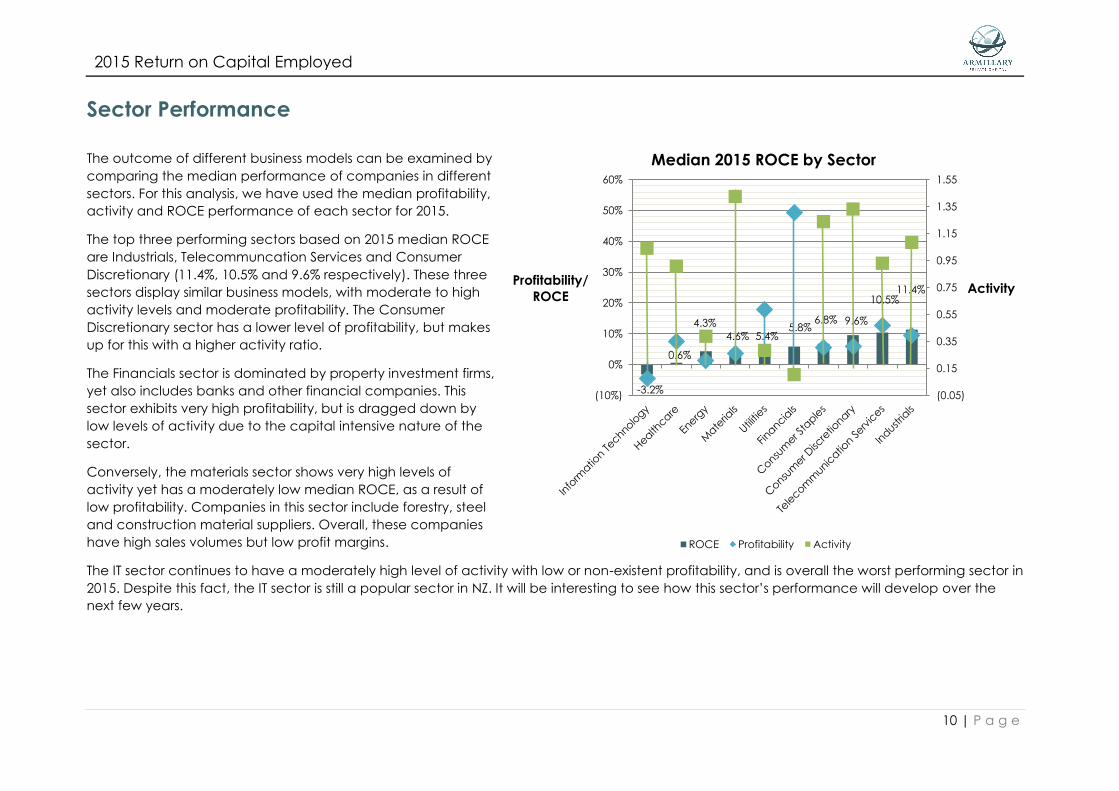
The outcome of different business models can be examined by
comparing the median performance of companies in different
sectors. For this analysis, we have used the median profitability,
activity and ROCE performance of each sector for 2015.
The top three performing sectors based on 2015 median ROCE
are Industrials, Telecommuncation Services and Consumer
Discretionary (11.4%, 10.5% and 9.6% respectively). These three
sectors display similar business models, with moderate to high
activity levels and moderate profitability. The Consumer
Discretionary sector has a lower level of profitability, but makes
up for this with a higher activity ratio.
The Financials sector is dominated by property investment firms,
yet also includes banks and other financial companies. This
sector exhibits very high profitability, but is dragged down by
low levels of activity due to the capital intensive nature of the
sector.
Conversely, the materials sector shows very high levels of
activity yet has a moderately low median ROCE, as a result of
low profitability. Companies in this sector include forestry, steel
and construction material suppliers. Overall, these companies
have high sales volumes but low profit margins.
The IT sector continues to have a moderately high level of activity with low or non-existent profitability, and is overall the worst performing sector in
2015. Despite this fact, the IT sector is still a popular sector in NZ. It will be interesting to see how this sector’s performance will develop over the
next few years.
-3.2%
0.6%
4.3%
4.6% 5.4%5.8%
6.8% 9.6%
10.5%11.4%
(0.05)
0.15
0.35
0.55
0.75
0.95
1.15
1.35
1.55
(10%)
0%
10%
20%
30%
40%
50%
60%
ActivityProfitability/
ROCE
Median 2015 ROCE by Sector
ROCE Profitability Activity

2015 Return on Capital Employed
11 | P a g e
ROCE Application: Retail Fuel Company Performance
This year we have chosen to examine the performance three NZ fuel retailers: BP NZ
Holdings, ExxonMobil NZ, and Z Energy.
The retail fuel sector has been a sector of interest recently in New Zealand as recent
information from the Ministry of Business and Innovation (MBIE) have shown a steady
upwards trend in retailers' gross margins between 2011 and 2016 (from about 15c per litre
to about 27c).
Fuel companies have argued that they need a bigger retail margin because they’re
investing more in their retail outlets. If this were the case, we would expect to see a
decrease in the activity ratio due to an increase in Total Net Asset), offset by an increase
in profitability from the higher margin. In fact, the opposite appears to be the case – BP NZ
Holdings is the only company which has shown an increase in TNA between 2013 and
2015.
Overall, BP NZ Holdings has been the best performer since 2011 with a profitability ratio
between 10% and 13%. However, after 2012 steady decreases and activity levels have
dragged the company’s ROCE downwards.
ExxonMobil NZ has shown no real change in profitability, however an increase in activity has
bolstered the firm’s ROCE performance. In 2015, ExxonMobil NZ overtook BP as the top
performer based on ROCE (33%).
Z Energy has exhibited a significant decrease in ROCE since 2011. The drastic drop in activity
levels in 2012 is due to a significant increase in TNA. Since then, the decline in ROCE has
resulted from a decrease in profitability*. It will be interesting to see how the firm’s
performance changes following the acquisition of Caltex from Chevron (in June 2016).
5
10
15
20
25
30
35
2011 2012 2013 2014 2015 2016
NZ c
en
ts p
er lit
re
Week ending Friday
Weekly average regular petrol importer
margin
Petrol importer margin NZc.p.l Petrol margin trend NZc.p.l *
0%
10%
20%
30%
40%
50%
60%
70%
2011 2012 2013 2014 2015
ROCE
BP New
Zealand
Holdings
Limited
ExxonMobil
New Zealand
Limited
Z Energy
Limited
Source: Ministry of Business Innovation and Employment -2016
* Profitability figures are based on traditional EBIT. Z
Energy’s annual report uses “replacement cost EBIT”,
which it considers better reflects the underlying
business performance.

2015 Return on Capital Employed
12 | P a g e
Individual Entities
The following four charts show the individual ROCE performance for each of the 160 listed and Crown Entities reviewed in 2015. Note that for the
purposes of presenting this chart, entities with ROCE greater than 75% have been capped at 75% as they are relative outliers.
The 40 entities in the top quartile are dominated by the industrials, consumer staples and consumer discretionary sectors, which combined make
up 65% of the quartile. Notably, nearly 40% of firms in both the consumer discretionary and industrials sectors fall in this top quartile. Top quartile
ROCE performance ranges from 12.9% to 84.4%.
0%
10%
20%
30%
40%
50%
60%
70%
Ko
rdia
Gro
up
Me
thv
en
Ra
ng
atira
AW
F M
ad
iso
n G
rou
p
De
leg
at
Gro
up
Me
tro
Pe
rfo
rma
nc
e G
lass
He
llab
y H
old
ing
s
The
Co
lon
ial M
oto
r C
om
pa
ny
Ste
el &
Tu
be
Ho
ldin
gs
Tra
de
ME G
rou
p
Ma
rlin
Glo
ba
l
Mic
ha
el H
ill In
tern
atio
na
l
Sky N
etw
ork
Te
lev
isio
n
PG
G W
rig
hts
on
Ma
infr
eig
ht
Trilo
gy In
tern
atio
na
l
Op
us
Inte
rna
tio
na
l Co
nsu
lta
nts
The
Ne
w Z
ea
lan
d R
efin
ing
Co
mp
an
y
Alli
ed
Fa
rme
rs
Sp
ark
Skylin
e E
nte
rprise
s
Ge
ntr
ac
k G
rou
p
Ske
lleru
p H
old
ing
s
Ve
rita
s In
ve
stm
en
ts
Airw
ays
Co
rpo
ratio
n o
f N
Z
Fre
igh
twa
ys
CD
L In
ve
stm
en
ts N
Z
Vis
ta G
rou
p In
tern
atio
na
l
Gre
en
Cro
ss H
ea
lth
Sc
ale
s C
orp
ora
tio
n
So
uth
Po
rt N
ew
Ze
ala
nd
Re
sta
ura
nt
Bra
nd
s
Fish
er
& P
ayke
l He
alth
ca
re
Ze
spri G
rou
p
NZX
So
lutio
n D
yn
am
ics
Ha
llen
ste
in G
lass
on
Ho
ldin
gs
Co
nn
exio
nz
Brisc
oe
Gro
up
Fin
zso
ft S
olu
tio
ns
2015 ROCE - Top Quartile

2015 Return on Capital Employed
13 | P a g e
The 40 entities in the second quartile had 2015 ROCE’s ranging between 6.2% and 12.2%. At this level, we estimate that only half are trading at or
above their individual weighted average cost of capital, if only marginally.
0%
2%
4%
6%
8%
10%
12%
14%
Se
eka
Kiw
ifru
it In
du
strie
s
Str
ide
Pro
pe
rty
Ten
on
Pre
cin
ct
Pro
pe
rtie
s
Tru
stP
ow
er
Arg
osy
Pro
pe
rty
Ma
rsd
en
Ma
ritim
e H
old
ing
s
Ve
cto
r
Sa
nfo
rd
T&G
Glo
ba
l
Ab
an
o H
ea
lth
ca
re G
rou
p
Vita
l He
alth
ca
re P
rop
ert
y T
rust
The
Po
rt o
f Ta
ura
ng
a
Teg
el F
oo
ds
Intu
eri E
du
ca
tio
n G
rou
p
Tra
nsp
ow
er
Ne
w Z
ea
lan
d
Kin
gfish
Liv
est
oc
k Im
pro
ve
me
nt
Co
rpo
ratio
n
Ch
oru
s
Co
mv
ita
Ph
arm
aze
n
Mill
en
niu
m &
Co
pth
orn
e H
ote
ls N
Z
En
prise
Gro
up
Ka
thm
an
du
Ho
ldin
gs
G3
Gro
up
Pro
ten
Air N
ew
Ze
ala
nd
Bu
rge
r Fu
el W
orld
wid
e
Ba
rra
mu
nd
i
Sm
art
Pa
y H
old
ing
s
Tou
rism
Ho
ldin
gs
Fle
tch
er
Bu
ildin
g
The
Wa
reh
ou
se G
rou
p
Me
teo
rog
ica
l Se
rvic
e o
f N
Z
Sc
ott
Te
ch
no
log
y
Airw
ork
Ho
ldin
gs
Silv
er
Fern
Fa
rms
EB
OS G
rou
p
Nu
ple
x In
du
strie
s
Just
Wa
ter
Inte
rna
tio
na
l
2015 ROCE - Second Quartile
2015 Return on Capital Employed
14 | P a g e
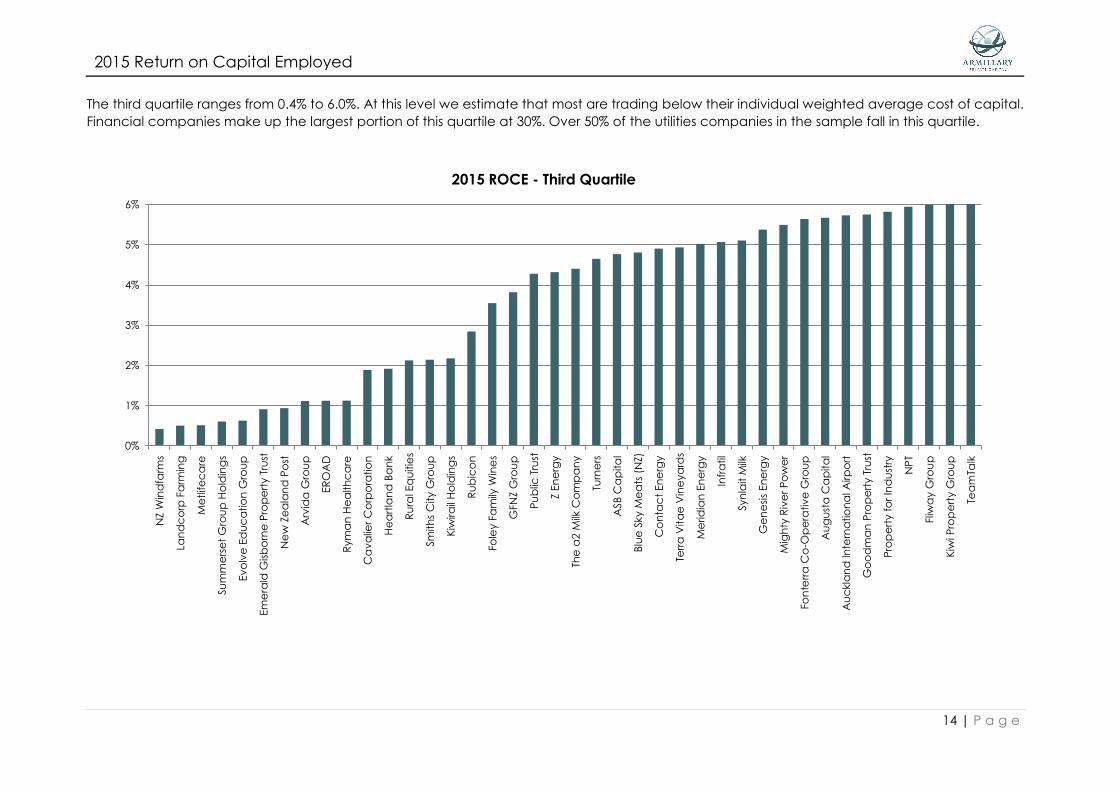
The third quartile ranges from 0.4% to 6.0%. At this level we estimate that most are trading below their individual weighted average cost of capital.
Financial companies make up the largest portion of this quartile at 30%. Over 50% of the utilities companies in the sample fall in this quartile.
0%
1%
2%
3%
4%
5%
6%
NZ W
ind
farm
s
Lan
dc
orp
Fa
rmin
g
Me
tlife
ca
re
Su
mm
ers
et
Gro
up
Ho
ldin
gs
Ev
olv
e E
du
ca
tio
n G
rou
p
Em
era
ld G
isb
orn
e P
rop
ert
y T
rust
Ne
w Z
ea
lan
d P
ost
Arv
ida
Gro
up
ER
OA
D
Rym
an
He
alth
ca
re
Ca
va
lier
Co
rpo
ratio
n
He
art
lan
d B
an
k
Ru
ral E
qu
itie
s
Sm
ith
s C
ity G
rou
p
Kiw
ira
il H
old
ing
s
Ru
bic
on
Fole
y F
am
ily W
ine
s
GFN
Z G
rou
p
Pu
blic
Tru
st
Z E
ne
rgy
The
a2
Milk
Co
mp
an
y
Turn
ers
ASB
Ca
pita
l
Blu
e S
ky M
ea
ts (
NZ)
Co
nta
ct
En
erg
y
Terr
a V
ita
e V
ine
ya
rds
Me
rid
ian
En
erg
y
Infr
atil
Syn
lait M
ilk
Ge
ne
sis
En
erg
y
Mig
hty
Riv
er
Po
we
r
Fon
terr
a C
o-O
pe
rativ
e G
rou
p
Au
gu
sta
Ca
pita
l
Au
ckla
nd
In
tern
atio
na
l Airp
ort
Go
od
ma
n P
rop
ert
y T
rust
Pro
pe
rty f
or
Ind
ust
ry
NP
T
Fliw
ay G
rou
p
Kiw
i Pro
pe
rty G
rou
p
Tea
mTa
lk
2015 ROCE - Third Quartile
2015 Return on Capital Employed
15 | P a g e
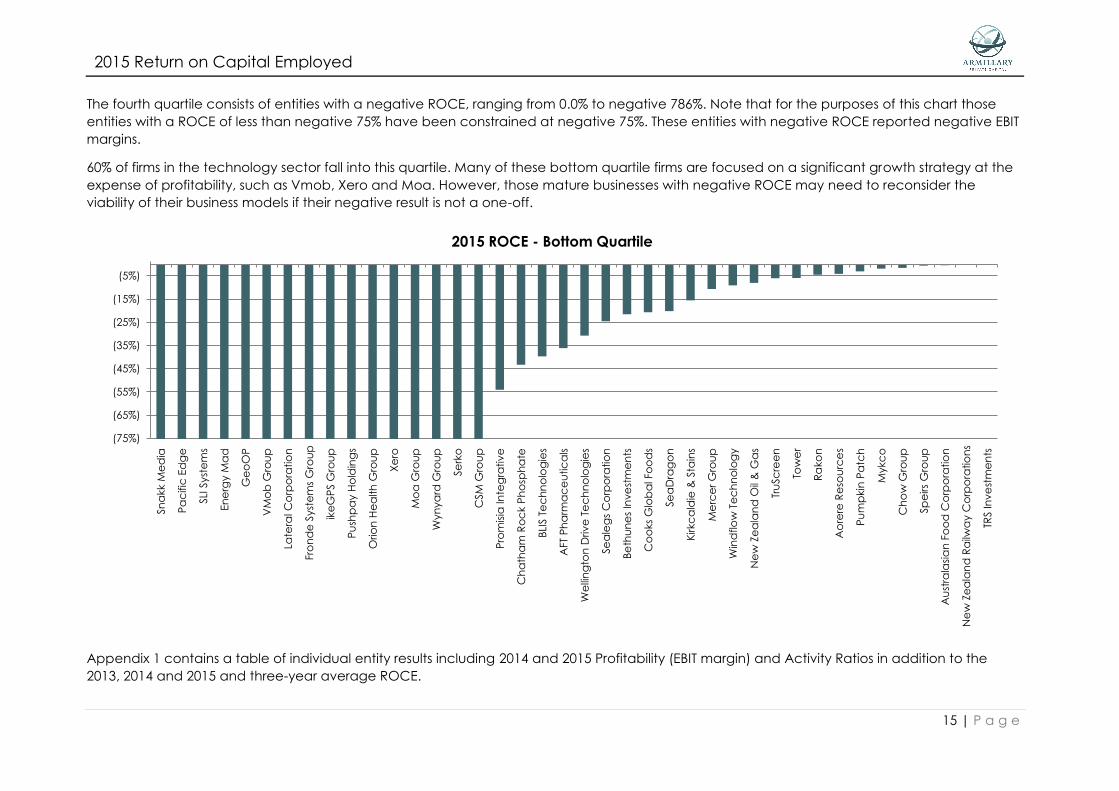
The fourth quartile consists of entities with a negative ROCE, ranging from 0.0% to negative 786%. Note that for the purposes of this chart those
entities with a ROCE of less than negative 75% have been constrained at negative 75%. These entities with negative ROCE reported negative EBIT
margins.
60% of firms in the technology sector fall into this quartile. Many of these bottom quartile firms are focused on a significant growth strategy at the
expense of profitability, such as Vmob, Xero and Moa. However, those mature businesses with negative ROCE may need to reconsider the
viability of their business models if their negative result is not a one-off.
Appendix 1 contains a table of individual entity results including 2014 and 2015 Profitability (EBIT margin) and Activity Ratios in addition to the
2013, 2014 and 2015 and three-year average ROCE.
(75%)
(65%)
(55%)
(45%)
(35%)
(25%)
(15%)
(5%)
Sn
akk M
ed
ia
Pa
cific
Ed
ge
SLI
Syst
em
s
En
erg
y M
ad
Ge
oO
P
VM
ob
Gro
up
Late
ral C
orp
ora
tio
n
Fro
nd
e S
yst
em
s G
rou
p
ike
GP
S G
rou
p
Pu
shp
ay H
old
ing
s
Orio
n H
ea
lth
Gro
up
Xe
ro
Mo
a G
rou
p
Wyn
ya
rd G
rou
p
Se
rko
CSM
Gro
up
Pro
mis
ia In
teg
rativ
e
Ch
ath
am
Ro
ck P
ho
sph
ate
BLI
S T
ec
hn
olo
gie
s
AFT
Ph
arm
ac
eu
tic
als
We
llin
gto
n D
riv
e T
ec
hn
olo
gie
s
Se
ale
gs
Co
rpo
ratio
n
Be
thu
ne
s In
ve
stm
en
ts
Co
oks
Glo
ba
l Fo
od
s
Se
aD
rag
on
Kirkc
ald
ie &
Sta
ins
Me
rce
r G
rou
p
Win
dflo
w T
ec
hn
olo
gy
Ne
w Z
ea
lan
d O
il &
Ga
s
Tru
Sc
ree
n
Tow
er
Ra
ko
n
Ao
rere
Re
sou
rce
s
Pu
mp
kin
Pa
tch
Mykc
o
Ch
ow
Gro
up
Sp
eirs
Gro
up
Au
stra
lasi
an
Fo
od
Co
rpo
ratio
n
Ne
w Z
ea
lan
d R
ailw
ay C
orp
ora
tio
ns
TRS In
ve
stm
en
ts
2015 ROCE - Bottom Quartile
2015 Return on Capital Employed
16 | P a g e
About Armillary Private Capital
Armillary Private Capital is an investment bank providing investment banking, advisory and asset management services focused on the New
Zealand capital markets. Our purpose is enabling success for businesses, business owners and investors.
Our approach is based on a combination of influences grounded in our culture, methodology and experiences. We have worked with a range
of New Zealand businesses through all stage of the business lifecycle from start-up to maturity. Be they private, listed or government-related, we
have seen and experienced the roller-coaster rides business owners and managers endure. These experiences allow us to quickly identify your
needs and find the right solution.
An important part of our approach is the use of proven financial tools and methodologies to provide a concise but comprehensive view of
business performance. A key methodology that underpins our work is the DuPont method. This powerful but highly practical method of analysis
allows us to develop a rapid understanding of the underlying performance of a business and to identify key business drivers. This disciplined
approach helps us with quality decision making in our work.
Armillary Private Capital is the manager of Efficient Market Services Limited, operator of the Unlisted market.
Sources of Data
The data for this analysis and report has been compiled by Armillary Private Capital from annual reports and data obtained through S&P Capital
IQ. We note that we are reliant on the categorisation used by S&P Capital IQ for this analysis and such categorisation might vary from the
categorisation we have applied to those companies for which we have sourced the data directly from their annual reports.

2015 Return on Capital Employed
17 | P a g e
Appendix 1 – Detailed Results
Market 2014 EBIT
Margin
2015 EBIT
Margin
2014
Activity
Ratio
2015
Activity
Ratio
ROCE
2013
ROCE
2014
ROCE
2015
3 Year
Average
ROCE
Abano Healthcare Group NZX 7.1% 7.6% 0.87 0.91 10.6% 6.1% 6.9% 7.9%
AFT Pharmaceuticals NZX 6.6% (10.6%) 3.18 3.41 18.0% 20.9% (36.1%) 0.9%
Air New Zealand NZX 7.5% 9.9% 1.10 1.02 7.5% 8.2% 10.1% 8.6%
Airways Corporation of NZ Crown 10.7% 15.4% 1.42 1.32 27.7% 15.2% 20.3% 21.1%
Airwork Holdings NZX 12.9% 16.5% 0.69 0.72 8.7% 8.8% 11.8% 9.8%
Allied Farmers NZX 9.2% 10.9% 1.15 1.74 0.7% 10.6% 18.9% 10.1%
Aorere Resources NZX (27.0%) (32.6%) 0.10 0.13 (6.1%) (2.7%) (4.2%) (4.3%)
Argosy Property NZX 71.3% 71.7% 0.09 0.09 6.6% 6.7% 6.5% 6.6%
Arvida Group NZX NA 19.2% 0.00 0.06 NA NA 1.1% 1.1%
ASB Capital NZX 100.0% 100.0% 0.04 0.05 3.8% 4.1% 4.8% 4.2%
Auckland International Airport NZX 61.8% 62.3% 0.10 0.09 6.4% 6.1% 5.7% 6.1%
Augusta Capital NZX 67.7% 40.2% 0.10 0.14 7.1% 7.0% 5.7% 6.6%
Australasian Food Corporation NZAX (139.2%) (275.9%) 0.01 0.00 (21.6%) (0.8%) (0.4%) (7.6%)
AWF Madison Group NZX 4.5% 5.0% 3.96 2.73 33.8% 18.0% 13.5% 21.8%
Barramundi NZX 188.1% 75.7% (0.02) 0.14 26.7% (4.6%) 10.7% 10.9%
Bethunes Investments NZX 18.1% (40.8%) 0.35 0.53 0.3% 6.3% (21.6%) (5.0%)
BLIS Technologies NZX (91.6%) (40.7%) 0.48 0.97 (27.1%) (44.0%) (39.7%) (36.9%)
Blue Sky Meats (NZ) Unlisted 3.1% 2.1% 2.40 2.29 (10.1%) 7.5% 4.8% 0.7%
Briscoe Group NZX 9.4% 10.2% 8.88 8.18 82.6% 83.0% 83.6% 83.1%
Burger Fuel Worldwide NZAX 3.0% 3.0% 3.70 3.38 52.1% 11.1% 10.2% 24.5%
Cavalier Corporation NZX 4.4% 1.2% 1.28 1.52 3.5% 5.7% 1.9% 3.7%
CDL Investments NZ NZX 43.5% 49.0% 0.48 0.43 20.7% 21.0% 21.0% 20.9%
Chatham Rock Phosphate NZAX NA NA 0.00 0.00 (2.7%) (1.9%) (43.3%) (15.9%)
Chorus NZX 30.9% 27.6% 0.34 0.29 12.4% 10.4% 8.0% 10.3%
Chow Group NZAX 69.7% (547.7%) 0.00 0.00 NA 0.0% (1.6%) (0.8%)
Comvita NZX 7.8% 7.6% 0.96 1.11 10.6% 7.5% 8.4% 8.8%

2015 Return on Capital Employed
18 | P a g e
Market 2014 EBIT
Margin
2015 EBIT
Margin
2014
Activity
Ratio
2015
Activity
Ratio
ROCE
2013
ROCE
2014
ROCE
2015
3 Year
Average
ROCE
Connexionz Unlisted 9.6% 23.3% 2.47 2.94 23.5% 23.7% 68.3% 38.5%
Contact Energy NZX 16.2% 13.1% 0.37 0.37 5.4% 6.0% 4.9% 5.4%
Cooks Global Foods NZAX (66.6%) (41.0%) 0.43 0.50 11.9% (28.4%) (20.7%) (12.4%)
CSM Group NZAX NA (883.8%) 0.00 0.09 (128.8%) (29.1%) (76.4%) (78.1%)
Delegat Group NZX 34.4% 28.6% 0.48 0.49 17.6% 16.6% 13.9% 16.0%
EBOS Group NZX 2.6% 2.8% 4.08 4.35 14.5% 10.8% 12.2% 12.5%
Emerald Gisborne Property Trust Unlisted 2.6% 4.3% 0.17 0.21 0.9% 0.4% 0.9% 0.7%
Energy Mad NZX (30.6%) (49.1%) 2.63 3.76 (41.7%) (80.4%) (184.6%) (102.3%)
Enprise Group NZAX (2.8%) 4.4% 2.73 1.95 (36.4%) (7.5%) 8.6% (11.8%)
EROAD NZX 10.7% 1.9% 0.50 0.58 (2.1%) 5.3% 1.1% 1.5%
Evolve Education Group NZX NA 2.8% 0.23 NA NA 0.6% 0.6%
Finzsoft Solutions NZX 8.5% 19.6% 2.39 4.31 10.6% 20.3% 84.4% 38.4%
Fisher & Paykel Healthcare NZX 23.0% 25.3% 1.16 1.23 20.9% 26.7% 31.1% 26.2%
Fletcher Building NZX 7.3% 7.2% 1.54 1.57 9.5% 11.2% 11.3% 10.7%
Fliway Group NZX 7.4% 4.1% 1.43 1.45 12.2% 10.6% 6.0% 9.6%
Foley Family Wines NZAX 19.9% 11.1% 0.29 0.32 4.9% 5.7% 3.6% 4.7%
Fonterra Co-Operative Group NZX 1.8% 4.2% 1.85 1.35 7.5% 3.3% 5.6% 5.5%
Freightways NZX 16.4% 16.9% 1.16 1.22 17.6% 19.0% 20.7% 19.1%
Fronde Systems Group Unlisted 0.7% (5.5%) 21.87 16.90 241.2% 15.0% (93.2%) 54.3%
G3 Group NXT 9.4% 8.7% 0.70 1.05 11.7% 6.6% 9.2% 9.2%
Genesis Energy NZX 8.4% 8.7% 0.53 0.62 4.9% 4.4% 5.4% 4.9%
Gentrack Group NZX 28.0% 28.9% 0.56 0.68 16.3% 15.7% 19.6% 17.2%
GeoOP NZAX (1282.6%) (501.7%) 0.16 0.37 (67.6%) (210.0%) (184.5%) (154.0%)
GFNZ Group NZAX (296.5%) 20.1% 0.05 0.19 0.2% (14.2%) 3.8% (3.4%)
Goodman Property Trust NZX 73.5% 76.2% 0.08 0.08 5.0% 5.7% 5.8% 5.5%
Green Cross Health NZX 10.1% 7.7% 3.29 2.97 33.8% 33.1% 22.8% 29.9%
Hallenstein Glasson Holdings NZX 9.3% 10.7% 4.50 5.24 56.8% 41.9% 56.1% 51.6%
Heartland Bank NZX 45.5% 49.3% 0.04 0.04 1.3% 2.0% 1.9% 1.7%
Hellaby Holdings NZX 5.7% 5.6% 2.52 2.54 12.5% 14.4% 14.2% 13.7%

2015 Return on Capital Employed
19 | P a g e
Market 2014 EBIT
Margin
2015 EBIT
Margin
2014
Activity
Ratio
2015
Activity
Ratio
ROCE
2013
ROCE
2014
ROCE
2015
3 Year
Average
ROCE
ikeGPS Group NZX (117.9%) (171.2%) 0.46 0.84 (23.4%) (54.2%) (144.6%) (74.1%)
Infratil NZX 18.0% 17.9% 0.28 0.28 6.5% 5.0% 5.1% 5.5%
Intueri Education Group NZX 15.0% 11.7% 0.64 0.63 1.0% 9.6% 7.4% 6.0%
Just Water International NZAX 13.3% 12.5% 0.72 0.98 13.8% 9.5% 12.2% 11.8%
Kathmandu Holdings NZX 16.0% 8.1% 1.13 1.10 18.7% 18.1% 8.9% 15.3%
Kingfish NZX 83.9% 78.5% 0.23 0.10 23.8% 19.0% 7.8% 16.9%
Kirkcaldie & Stains NZX 1.3% (13.7%) 0.47 1.14 (1.5%) 0.6% (15.6%) (5.5%)
Kiwi Property Group NZX 64.5% 68.2% 0.09 0.09 5.5% 6.0% 6.0% 5.8%
Kiwirail Holdings Crown 1.7% 2.3% 0.96 0.96 2.3% 1.6% 2.2% 2.0%
Kordia Group Crown (2.9%) 6.5% 2.10 2.00 12.0% (6.0%) 12.9% 6.3%
Landcorp Farming Crown 17.0% 3.9% 0.15 0.13 1.4% 2.5% 0.5% 1.5%
Lateral Corporation NZAX (1.7%) (277.4%) 1.61 0.60 (16.3%) (2.8%) (166.5%) (61.9%)
Livestock Improvement Corporation NZAX 12.0% 9.0% 0.90 0.87 13.2% 10.8% 7.8% 10.6%
Mainfreight NZX 6.1% 6.2% 2.89 2.82 16.6% 17.6% 17.6% 17.3%
Marlin Global NZX 80.2% 79.1% 0.18 0.18 12.2% 14.7% 14.6% 13.8%
Marsden Maritime Holdings NZX 75.7% 74.8% 0.08 0.09 5.7% 6.3% 6.5% 6.2%
Mercer Group NZX 0.0% (8.4%) 1.58 1.28 6.8% 0.1% (10.7%) (1.3%)
Meridian Energy NZX 14.5% 13.1% 0.34 0.38 4.6% 5.0% 5.0% 4.9%
Meteorogical Service of NZ Crown 11.1% 9.2% 1.32 1.25 14.1% 14.7% 11.5% 13.4%
Methven NZX 7.5% 9.1% 1.61 1.46 13.1% 12.1% 13.2% 12.8%
Metlifecare NZX 14.6% 10.9% 0.05 0.05 0.7% 0.7% 0.5% 0.6%
Metro Performance Glass NZX 14.1% 14.8% 0.91 0.94 9.9% 12.7% 14.0% 12.2%
Michael Hill International NZX 9.5% 9.0% 1.79 1.70 19.0% 16.9% 15.4% 17.1%
Mighty River Power NZX 20.1% 18.6% 0.30 0.30 4.1% 6.1% 5.5% 5.2%
Millennium & Copthorne Hotels NZ NZX 20.2% 29.2% 0.24 0.29 4.4% 4.9% 8.5% 5.9%
Moa Group NZX (119.2%) (89.7%) 1.18 1.23 (139.4%) (140.4%) (110.7%) (130.2%)
Mykco NZAX (2.3%) (3.5%) 0.47 0.55 6.9% (1.1%) (1.9%) 1.3%
New Zealand Oil & Gas NZX 24.5% (22.7%) 0.37 0.35 10.8% 9.1% (8.0%) 4.0%
New Zealand Post Crown 10.1% 9.8% 0.11 0.10 0.5% 1.1% 0.9% 0.8%
New Zealand Railway Corporations Crown (2341.9%) (1296.4%) 0.00 0.00 0.4% (0.0%) (0.0%) 0.1%

2015 Return on Capital Employed
20 | P a g e
Market 2014 EBIT
Margin
2015 EBIT
Margin
2014
Activity
Ratio
2015
Activity
Ratio
ROCE
2013
ROCE
2014
ROCE
2015
3 Year
Average
ROCE
NPT NZX 47.5% 57.4% 0.10 0.10 4.5% 4.8% 5.9% 5.1%
Nuplex Industries NZX 5.8% 6.8% 1.71 1.78 12.2% 10.0% 12.2% 11.5%
NZ Windfarms NZX (12.2%) 3.9% 0.10 0.11 (1.9%) (1.2%) 0.4% (0.9%)
NZX NZX 31.3% 28.5% 1.50 1.20 35.4% 47.0% 34.2% 38.9%
Opus International Consultants NZX 6.1% 6.7% 2.83 2.68 19.4% 17.2% 18.1% 18.3%
Orion Health Group NZX (0.5%) (32.9%) 4.22 4.16 (7.1%) (2.2%) (136.6%) (48.6%)
Pacific Edge NZX (1837.7%) (396.4%) 0.41 1.59 (749.9%) (756.0%) (628.8%) (711.6%)
PGG Wrightson NZX 3.9% 5.1% 3.18 3.07 6.6% 12.4% 15.7% 11.5%
Pharmazen Unlisted 2.8% 14.9% 0.60 0.57 8.8% 1.7% 8.5% 6.3%
Precinct Properties NZX 63.9% 65.2% 0.10 0.10 6.1% 6.3% 6.4% 6.3%
Promisia Integrative NZX (336.9%) (218.6%) 0.08 0.25 (28.2%) (27.7%) (54.0%) (36.7%)
Property for Industry NZX 86.4% 83.6% 0.07 0.07 6.6% 6.2% 5.8% 6.2%
Proten Unlisted 41.8% 44.0% 0.21 0.22 8.5% 8.8% 9.5% 8.9%
Public Trust Crown 31.0% 33.7% 0.11 0.13 2.3% 3.5% 4.3% 3.4%
Pumpkin Patch NZX (4.5%) (1.4%) 2.31 2.13 9.3% (10.4%) (3.0%) (1.4%)
Pushpay Holdings NZX (518.4%) (473.2%) 0.12 0.29 (144.9%) (62.3%) (136.9%) (114.7%)
Rakon NZX (14.7%) (3.2%) 1.05 1.42 (2.8%) (15.4%) (4.5%) (7.6%)
Rangatira Unlisted 57.5% 35.1% 0.56 0.39 6.9% 32.3% 13.5% 17.6%
Restaurant Brands NZX 8.1% 8.6% 2.93 3.04 24.1% 23.6% 26.2% 24.6%
Rubicon NZX 1.2% 2.5% 1.23 1.12 (0.4%) 1.4% 2.8% 1.3%
Rural Equities Unlisted 49.3% 43.5% 0.06 0.05 1.7% 3.1% 2.1% 2.3%
Ryman Healthcare NZX 18.9% 14.7% 0.08 0.08 2.0% 1.6% 1.1% 1.6%
Sanford NZX 12.5% 11.2% 0.60 0.60 2.9% 7.5% 6.7% 5.7%
Scales Corporation NZX 10.8% 16.1% 1.14 1.44 12.8% 12.3% 23.3% 16.1%
Scott Technology NZX 7.7% 10.3% 1.15 1.12 17.7% 8.9% 11.5% 12.7%
SeaDragon NZX (54.2%) (29.2%) 0.50 0.69 (6.9%) (27.0%) (20.2%) (18.0%)
Sealegs Corporation NZX (3.7%) (9.4%) 2.57 2.60 2.4% (9.5%) (24.6%) (10.5%)
Seeka Kiwifruit Industries NZX 3.7% 5.0% 1.36 1.24 4.7% 5.1% 6.2% 5.3%
Serko NZX (16.7%) (60.8%) 0.72 1.28 (14.6%) (12.0%) (77.6%) (34.7%)
2015 Return on Capital Employed
21 | P a g e
Market 2014 EBIT
Margin
2015 EBIT
Margin
2014
Activity
Ratio
2015
Activity
Ratio
ROCE
2013
ROCE
2014
ROCE
2015
3 Year
Average
ROCE
Silver Fern Farms Unlisted 1.4% 1.9% 3.42 6.30 (2.1%) 4.7% 12.1% 4.9%
Skellerup Holdings NZX 14.8% 14.5% 1.49 1.37 20.2% 21.9% 19.8% 20.6%
Sky Network Television NZX 28.6% 29.2% 0.52 0.53 12.2% 14.8% 15.5% 14.1%
Skyline Enterprises Unlisted 31.7% 35.2% 0.55 0.56 12.7% 17.4% 19.6% 16.5%
SLI Systems NZX (28.9%) (26.3%) 12.02 13.25 (790.3%) (347.6%) (348.9%) (495.6%)
SmartPay Holdings NZX 22.9% 19.8% 0.58 0.55 3.2% 13.2% 11.0% 9.1%
Smiths City Group NZX 2.5% 1.2% 1.78 1.82 2.9% 4.5% 2.1% 3.2%
Snakk Media NXT (30.4%) (45.5%) 23.25 17.27 (9843.3%) (705.6%) (786.0%) (3778.3%)
Solution Dynamics NZAX 4.8% 6.3% 5.73 7.65 (2.5%) 27.5% 48.4% 24.5%
South Port New Zealand NZX 31.1% 33.8% 0.61 0.72 23.2% 18.8% 24.3% 22.1%
Spark NZX 13.3% 14.8% 1.27 1.29 16.2% 16.9% 19.1% 17.4%
Speirs Group NZAX (1.8%) (0.2%) 1.88 2.51 (9.1%) (3.3%) (0.6%) (4.3%)
Steel & Tube Holdings NZX 6.0% 6.6% 2.18 2.18 12.0% 13.0% 14.5% 13.2%
Stride Property NZX 79.6% 84.5% 0.09 0.07 7.1% 6.9% 6.3% 6.8%
Summerset Group Holdings NZX 11.4% 10.5% 0.06 0.06 0.8% 0.7% 0.6% 0.7%
Synlait Milk NZX 9.4% 5.9% 1.49 0.86 8.0% 14.0% 5.1% 9.1%
T&G Global NZX 1.0% 4.1% 1.86 1.69 4.8% 1.8% 6.8% 4.5%
TeamTalk NZX 12.2% 10.6% 0.55 0.57 12.7% 6.7% 6.0% 8.5%
Tegel Foods NZX 4.8% 7.3% 0.85 1.00 4.4% 4.1% 7.3% 5.3%
Tenon NZX 2.0% 3.6% 1.92 1.75 0.4% 3.9% 6.4% 3.6%
Terra Vitae Vineyards Unlisted 43.8% 40.6% 0.13 0.12 4.0% 5.7% 4.9% 4.9%
The a2 Milk Company NZX 2.1% 1.4% 2.68 3.21 25.1% 5.6% 4.4% 11.7%
The Colonial Motor Company NZX 4.4% 3.8% 3.68 3.72 13.2% 16.1% 14.3% 14.5%
The New Zealand Refining Company NZX 6.5% 47.5% 0.23 0.39 (0.7%) 1.5% 18.4% 6.4%
The Port of Tauranga NZX 41.2% 40.7% 0.19 0.18 8.0% 7.9% 7.2% 7.7%
The Warehouse Group NZX 3.6% 3.3% 3.71 3.41 18.8% 13.5% 11.3% 14.5%
Tourism Holdings NZX 10.0% 13.5% 0.73 0.83 4.7% 7.3% 11.3% 7.7%
Tower NZX 13.4% (3.7%) 1.25 1.60 2.4% 16.7% (6.0%) 4.4%
Trade ME Group NZX 64.6% 60.1% 0.23 0.24 14.7% 14.6% 14.6% 14.6%
Transpower New Zealand Crown 53.7% 39.2% 0.19 0.19 8.8% 10.4% 7.6% 8.9%
2015 Return on Capital Employed
22 | P a g e
Market 2014 EBIT
Margin
2015 EBIT
Margin
2014
Activity
Ratio
2015
Activity
Ratio
ROCE
2013
ROCE
2014
ROCE
2015
3 Year
Average
ROCE
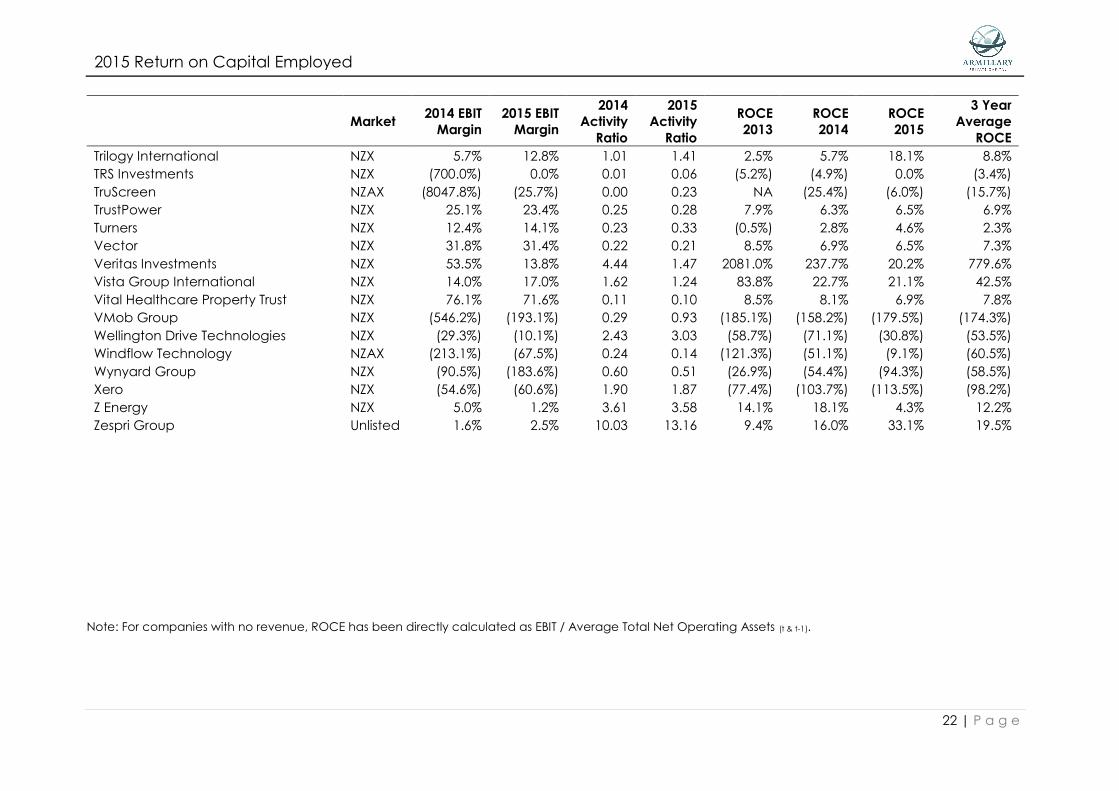
Trilogy International NZX 5.7% 12.8% 1.01 1.41 2.5% 5.7% 18.1% 8.8%
TRS Investments NZX (700.0%) 0.0% 0.01 0.06 (5.2%) (4.9%) 0.0% (3.4%)
TruScreen NZAX (8047.8%) (25.7%) 0.00 0.23 NA (25.4%) (6.0%) (15.7%)
TrustPower NZX 25.1% 23.4% 0.25 0.28 7.9% 6.3% 6.5% 6.9%
Turners NZX 12.4% 14.1% 0.23 0.33 (0.5%) 2.8% 4.6% 2.3%
Vector NZX 31.8% 31.4% 0.22 0.21 8.5% 6.9% 6.5% 7.3%
Veritas Investments NZX 53.5% 13.8% 4.44 1.47 2081.0% 237.7% 20.2% 779.6%
Vista Group International NZX 14.0% 17.0% 1.62 1.24 83.8% 22.7% 21.1% 42.5%
Vital Healthcare Property Trust NZX 76.1% 71.6% 0.11 0.10 8.5% 8.1% 6.9% 7.8%
VMob Group NZX (546.2%) (193.1%) 0.29 0.93 (185.1%) (158.2%) (179.5%) (174.3%)
Wellington Drive Technologies NZX (29.3%) (10.1%) 2.43 3.03 (58.7%) (71.1%) (30.8%) (53.5%)
Windflow Technology NZAX (213.1%) (67.5%) 0.24 0.14 (121.3%) (51.1%) (9.1%) (60.5%)
Wynyard Group NZX (90.5%) (183.6%) 0.60 0.51 (26.9%) (54.4%) (94.3%) (58.5%)
Xero NZX (54.6%) (60.6%) 1.90 1.87 (77.4%) (103.7%) (113.5%) (98.2%)
Z Energy NZX 5.0% 1.2% 3.61 3.58 14.1% 18.1% 4.3% 12.2%
Zespri Group Unlisted 1.6% 2.5% 10.03 13.16 9.4% 16.0% 33.1% 19.5%
Note: For companies with no revenue, ROCE has been directly calculated as EBIT / Average Total Net Operating Assets (t & t-1).

2015 Return on Capital Employed
23 | P a g e
Appendix 2 – ROCE explained
What is Return on Capital Employed and what does it show?
Return on Capital Employed (“ROCE”) is a measure of business effectiveness and capital efficiency. ROCE is a function of profitability, how much
profit a business generates before interest on debt and tax (EBIT) and activity, how much a business has invested in operating assets to generate
that level of profitability.
In the 1920’s Du Pont Corporation developed what is commonly known as Du Pont accounting and ROCE as a measure of business performance
to enable it to compare the performance of its many different business units. The Du Pont accounting method is a powerful and relatively simple
approach to determine the impact of management decisions on financial performance. The advantage of this method is that it provides a
consistent form of evaluation for a business to use when measuring performance.
At an individual business level ROCE:
allows comparison between business units of different size over time;
shows where to invest further and where to cut back;
shows whether it is worth borrowing further to invest;
shows if expectations of shareholders are being met;
indicates the maximum sustainable growth of a business; and
is used to track whether or not a project is performing according to plan.
ROCE can be used to test operational efficiency, balance sheet management efficiency and the adequacy of return on total capital employed
to make an assessment of a business’s performance.
ROCE can be used to help management improve both the profitability (EBIT) and balance sheet management. Improvements in these areas will
lead to improvements in the Return on Capital Employed.

2015 Return on Capital Employed
24 | P a g e
Calculating ROCE
It is important to note that some changes need to be made to traditional thinking to gain the benefits of this dynamic approach. To achieve this
there are two concepts that need to be considered:
Concepts
(i) The separation of funding from operating decisions
Consider the traditional formula for presenting financial statements.
EQUITY = (Current Assets + Cash - Current Liabilities) + Non-current Assets - Debt
In order to calculate ROCE, all forms of funding need to be removed from the right hand side of the equation. Total net assets should exclude
any external funding or debt thereby representing the true value of scarce resources employed in the business.
The financial analysis format can now be structured as follows.
DEBT - CASH + EQUITY = (Current Assets - Current Liabilities) + Non-Current Assets
TOTAL CAPITAL EMPLOYED (TCE) = TOTAL NET OPERATING ASSETS (TNA)
The movement in TNA reflects operating changes made to the employment of scarce resources, whilst Net Debt (debt – cash) and Equity
reflects how these changes are funded. It should be noted that where the directors of a business elect to retain minimum levels of cash this cash
should be included in TNA.
(ii) Balance sheet efficiency – ACTIVITY RATIO.
Definition: A measurement of how well the business manages its scarce resources
Formula: Revenue
Total Net Assets

2015 Return on Capital Employed
25 | P a g e
The Activity Ratio is a measure of how many times a business turns over its TNA in a financial year.
By way of example, an Activity Ratio of 2.5 means that for every $1 invested in TNA the business produces $2.50 in sales. It answers the question of
whether or not the net operating assets are being utilised efficiently in the production of income.
The activity drivers are:
Stock, Work in Progress, Inventory: the value of raw materials, work in progress and finished goods the business holds;
Trade Debtors: how much the business has locked up in sales revenues receivable;
Trade Creditors: how much the business owes to its suppliers for goods and services provided; and
Non-Current Assets: how much is invested in plant and equipment and intangible assets which are required to operate the business and
produce the goods sold.
Other current assets and liabilities such as prepayments and accruals are included in trade debtors and creditors.
Adjusting one or more of the activity drivers will increase or decrease the Activity Ratio and therefore improve or worsen ROCE.
(iii) Operational Efficiency – PROFITABILITY MARGIN.
Definition: A measurement of the Return on Sales purely from an operating perspective.
Formula: Earnings before interest & tax
Revenue
The above formula ignores the impact of funding and concentrates on the entity's ability to produce a return from revenue.
The four key profitability drivers are:
Price: how much a business receives for the goods it sells;

2015 Return on Capital Employed
26 | P a g e
Volume: how many goods the business sells;
Cost of Goods Sold: how much it costs the business to produce the goods it sells; and
Expenses: the overhead expenses of the business including depreciation.
Adjusting one or more of the profitability drivers will increase or decrease the Profitability Ratio and therefore improve or worsen ROCE.
(iv) Return on Capital Employed – ROCE
The link between the Balance Sheet and Profit & Loss is dynamically reflected in ROCE.
Definition: The percentage return yielded from the employment of scarce resources in the form of profit before interest and tax
Formula: EBIT
TNA
OR
Profitability x Activity
The interactive nature of this ratio is seen in the alternative formula as the product of Profitability and Activity. Operational and Balance Sheet
efficiency are brought to life in one single ratio. This should be the first area of review in the process of corporate performance assessment and it
should be determined as to whether or not ROCE is adequate and that of its components contribute to both the strengths and weaknesses of
the financial strategy.
2015 Return on Capital Employed
27 | P a g e
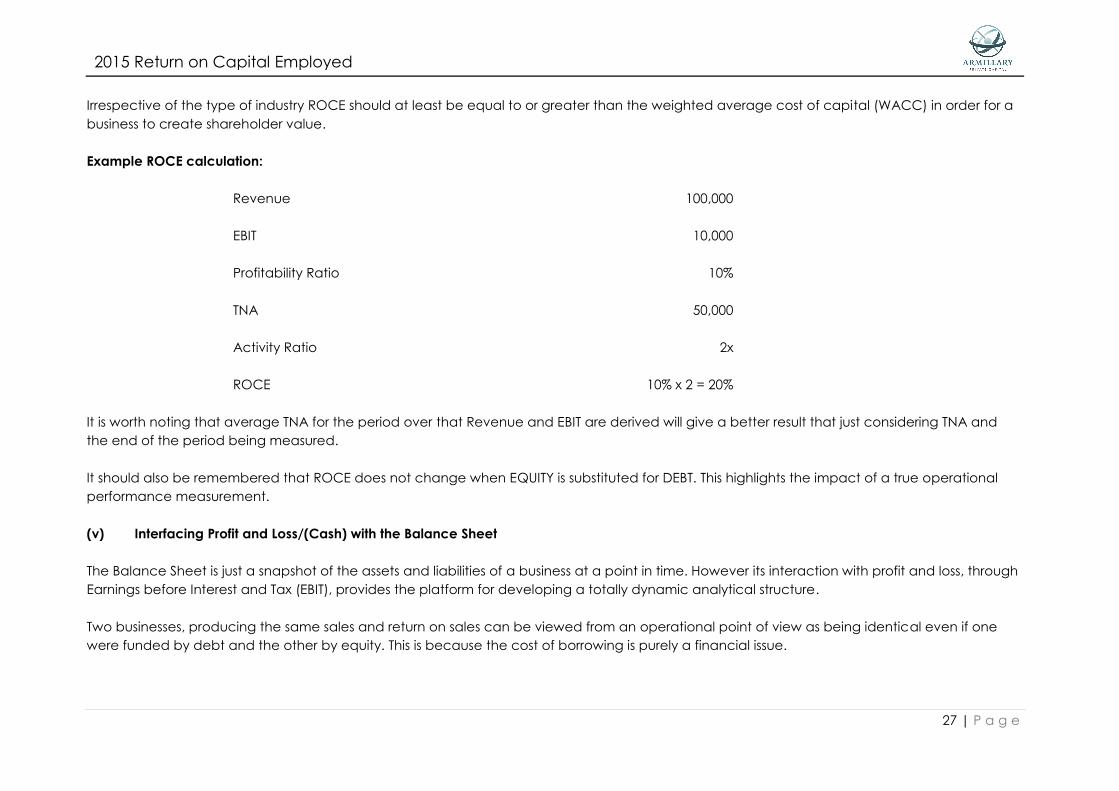
Irrespective of the type of industry ROCE should at least be equal to or greater than the weighted average cost of capital (WACC) in order for a
business to create shareholder value.
Example ROCE calculation:
Revenue 100,000
EBIT 10,000
Profitability Ratio 10%
TNA 50,000
Activity Ratio 2x
ROCE 10% x 2 = 20%
It is worth noting that average TNA for the period over that Revenue and EBIT are derived will give a better result that just considering TNA and
the end of the period being measured.
It should also be remembered that ROCE does not change when EQUITY is substituted for DEBT. This highlights the impact of a true operational
performance measurement.
(v) Interfacing Profit and Loss/(Cash) with the Balance Sheet
The Balance Sheet is just a snapshot of the assets and liabilities of a business at a point in time. However its interaction with profit and loss, through
Earnings before Interest and Tax (EBIT), provides the platform for developing a totally dynamic analytical structure.
Two businesses, producing the same sales and return on sales can be viewed from an operational point of view as being identical even if one
were funded by debt and the other by equity. This is because the cost of borrowing is purely a financial issue.

2015 Return on Capital Employed
28 | P a g e
ROCE Uses
ROCE can be used in many ways by organisations and management teams as a performance measure and as a tool when preparing budgets
and valuations.
One of these ways is that the management team may set ROCE goals for either the entire organisation or its sub-units and decision making in
respect of investing in new projects to ensure that the business is performing at a level that is greater than WACC.
ROCE is also able to be used to set up a performance remuneration plan for management and employees. As it is simple to calculate, ROCE
provides a transparent model for such programs.
Budgeting and Valuation
Businesses and analysts can often make an underlying error in budgeting or forecasting business performance that impacts a business valuation.
When undertaking a valuation the biggest error usually arises from utilising overly optimistic forecasts. Discount rates are generally less susceptible
to such errors.
Consider the following 4 charts that simplistically compare Profitability, Activity, Capex to Revenue and ROCE ratios for a mature business and a
growth business. The underlying issue is that most budgets for mature businesses more than often assume expanding profitability, increasing
activity, reducing levels of capital expenditure for every dollar of sales and therefore increasing ROCE. More often than not a mature business is
unlikely to see these improvements on an ongoing basis. While some improvement is always possible continuous expansion is unlikely to be
experienced on an ongoing basis and the art of getting the forecasts correct is in challenging such ongoing expansion assumptions.
Forecasts for growth businesses often have the opposite issues. It is rare to find a business in NZ that can achieve EBIT margins in excess of 20% on
an ongoing basis. At those levels competitors are likely to enter a market and customers generally start looking elsewhere or in-housing the
supply. Revenue growth will also demand additional lock up in working capital and additional fixed assets to support the growth. Therefore to
create robust forecasts for a growth business at some juncture these charts are likely to level out and this levelling is usually earlier than
anticipated generally because the business becomes loose with expenditure.
Taking into account the ratios in the chart helps to reduce the risk of making a budget or forecast error and therefore improves the quality of the
budget or forecast and by extension the quality of any valuation based off the same.

2015 Return on Capital Employed
29 | P a g e
0.0
1.0
2.0
3.0
4.0
1 2 3 4 5 6
Activity
Mature Growth
0%
1%
2%
3%
4%
5%
6%
1 2 3 4 5 6
Capex/Revenue
Mature Growth
0%
20%
40%
60%
80%
1 2 3 4 5 6
ROCE
Mature Growth
0%
5%
10%
15%
20%
25%
1 2 3 4 5 6
Profitability
Mature Growth
What is a “Good” ROCE
ROCE is a measure of a company’s profitability and its activity. Quite simply, a good ROCE is a level that exceeds the weighted average cost of
capital for the business. Where this is the case the business will be creating value for its shareholders.


![590. Mother of Perpetual Help School ... - DepEd Mandaluyong · PDF fileIncome Tax Return Certificate if Parents are employed] Certificate of Indigence if not employed With Community](https://img.pdfslide.net/doc/110x75/5aa1058e7f8b9a8e178ecf6a/590-mother-of-perpetual-help-school-deped-mandaluyong-tax-return-certificate.jpg)