Embed Size (px)
Citation preview
Building Radio frequency IDentification for the Global Environment
Returnable Transport Items: the market for EPCglobal applications
Authors: GS1 France and WP9 partners
11 July 2007 This work has been partly funded by the European Commission contract No: IST-2005-033546
About the BRIDGE Project: BRIDGE (Building Radio frequency IDentification for the Global Environment) is a 13 million Euro RFID project running over 3 years and partly funded (€7,5 million) by the European Union. The objective of the BRIDGE project is to research, develop and implement tools to enable the deployment of EPCglobal applications in Europe. Thirty interdisciplinary partners from 12 countries (Europe and Asia) are working together on : Hardware development, Serial Look-up Service, Serial-Level Supply Chain Control, Security; Anti-counterfeiting, Drug Pedigree, Supply Chain Management, Manufacturing Process, Reusable Asset Management, Products in Service, Item Level Tagging for non-food items as well as Dissemination tools, Education material and Policy recommendations. For more information on the BRIDGE project: www.bridge-project.eu This document: In the wide range of assets, work package 9 focuses on logistics assets also called "RTIs" or Returnable Transport Items. As stated in the ISO definition (see the glossary of terms for the complete definition and reference), RTIs are "…means to assemble goods for transportation, storage, handling and product protection in the supply chain which are returned for further usage…" The scope of this document is to describe the market and identify its weaknesses and strengths Disclaimer: This document results from work being done in the framework of the BRIDGE project. It does not represent an official deliverable formally approved by the European Commission. Copyright 2007 by GS1 France, GS1 Germany, Benedicta, COSG (Carrefour), All rights reserved. The information in this document is proprietary to these BRIDGE consortium members This document contains preliminary information and is not subject to any license agreement or any other agreement as between with respect to the above referenced consortium members. This document contains only intended strategies, developments, and/or functionalities and is not intended to be binding on any of the above referenced consortium members (either jointly or severally) with respect to any particular course of business, product strategy, and/or development of the above referenced consortium members. To the maximum extent allowed under applicable law, the above referenced consortium members assume no responsibility for errors or omissions in this document. The above referenced consortium members do not warrant the accuracy or completeness of the information, text, graphics, links, or other items contained within this material. This document is provided without a warranty of any kind, either express or implied, including but not limited to the implied warranties of merchantability, satisfactory quality, fitness for a particular purpose, or non-infringement. No licence to any underlying IPR is granted or to be implied from any use or reliance on the information contained within or accessed through this document. The above referenced consortium members shall have no liability for damages of any kind including without limitation direct, special, indirect, or consequential damages that may result from the use of these materials. This limitation shall not apply in cases of intentional or gross negligence. Because some jurisdictions do not allow the exclusion or limitation of liability for consequential or incidental damages, the above limitation may not apply to you. The statutory liability for personal injury and defective products is not affected. The above referenced consortium members have no control over the information that you may access through the use of hot links contained in these materials and does not endorse your use of third-party Web pages nor provide any warranty whatsoever relating to third-party Web pages.
BRIDGE – Building Radio frequency IDentification solutions for the Global Environment
3/49
1 INTRODUCTION ......................................................................................................................................... 4
2 ACKNOWLEDGEMENTS.......................................................................................................................... 5
3 EXECUTIVE SUMMARY............................................................................................................................ 6
3.1.1 Domain ............................................................................................................................................. 6
3.1.2 Objectives ........................................................................................................................................ 6
3.1.3 Context ............................................................................................................................................. 6
4 THE SURVEY .............................................................................................................................................. 7
4.1 HOW IT WAS CONDUCTED...................................................................................................................... 7
SEE THE QUESTIONNAIRES IN ANNEX A. ................................................................................................. 7
4.2 WHO REPLIED TO THE QUESTIONNAIRES? ............................................................................................ 7
4.2.1 Producers and manufacturers ...................................................................................................... 7
4.2.2 Pool operators................................................................................................................................. 9
4.3 THE FINDINGS OF THE SURVEY............................................................................................................ 10
4.3.1 Producers ...................................................................................................................................... 10
4.3.2 RTI pool operators........................................................................................................................ 15
5 PROCESS DESCRIPTIONS ................................................................................................................... 17
5.1 HOW TO READ A USE CASE DIAGRAM .................................................................................................. 17
5.2 HOW TO READ AN ACTIVITY DIAGRAM ................................................................................................. 17
5.3 POOLING MODEL.................................................................................................................................. 17
5.3.1 Use case diagram......................................................................................................................... 18
5.3.2 Activity diagram for Deliver Containers ..................................................................................... 19
5.3.3 Activity diagram for Deliver Containerised goods .................................................................... 21
5.3.4 Activity diagram for Return Goods ............................................................................................. 21
5.3.5 Activity diagram for Cross-docking ............................................................................................ 23
5.3.6 Activity diagram for Get Back the Empties ............................................................................... 25
5.4 EXCHANGE MODEL .............................................................................................................................. 32
5.4.1 Use case diagram......................................................................................................................... 32
5.4.2 Activity diagram for Exchange RTIs between producer and carrier...................................... 33
5.4.3 Activity diagrams for Exchange RTIs between carrier and goods recipient ........................ 34
6 STRENGTHS AND WEAKNESSES OF THE MODELS .................................................................... 38
6.1 POOLING MODEL.................................................................................................................................. 38
6.1.1 Weaknesses .................................................................................................................................. 38
6.1.2 Strengths........................................................................................................................................ 39
6.2 EXCHANGE MODEL .............................................................................................................................. 39
6.2.1 Weaknesses .................................................................................................................................. 39
6.2.2 Strengths........................................................................................................................................ 40
•••• CONCLUSION ........................................................................................................................................... 41
6.3 DOMAIN................................................................................................................................................ 41
6.4 OBJECTIVES......................................................................................................................................... 41
6.5 CONTEXT ............................................................................................................................................. 41
7 GLOSSARY OF TERMS.......................................................................................................................... 42
8 ANNEX A 1 PRODUCER QUESTIONNAIRE ...................................................................................... 43
9 ANNEX A2 POOL OPERATOR QUESTIONNAIRE ........................................................................... 46
BRIDGE – Building Radio frequency IDentification solutions for the Global Environment
4/49
1 Introduction Work package 9 addresses asset management and how EPCglobal applications can provide efficient tools to improve it. In the wide range of assets, work package 9 focuses on logistics assets also called "RTIs" or Returnable Transport Items. As stated in the ISO definition (see the glossary of terms for the complete definition and reference), RTIs are "…means to assemble goods for transportation, storage, handling and product protection in the supply chain which are returned for further usage…" Commonly used RTIs in the retail industry are pallets, crates, roll cages and dollies. Because the Work package 9 work group is mainly composed of French users, the group decided to target the type of assets that are mainly used in this country, namely pallets and crates. There are currently three processes for RTIs: 1. The supplier owns the RTIs and there are no special markings that make them specific to
the supplier nor the RTIs are made to fit defined products. For example, EURO pallets fall in this process. In that case, RTIs are exchanged one for one between all the actors of the supply chain.
2. The supplier owns the RTIs that are specific to the supplier of the contained goods. For
example, bottle crates bear the brand name of the product; crates are designed to carry a defined product. In this case, RTIs are to be returned to the supplier.
3. A pool operator owns the RTIs. A pool operator is a company that provides RTIs to
suppliers and make sure that the quality and quantity of these RTIs match the supplier requirements. The pooling process includes getting the RTIs back from the delivery location and reconditioning before new use.
The work group selected the first and the third processes since these are the most used. These processes are likely to be tested during the pilot phase as well. Moreover, the second process in which the supplier owns its specific RTIs can easily be derived from the pooling process since both processes are very similar. The scope of the first deliverable is to describe the market and identify its weaknesses and strengths. To achieve this scope, three actions were carried out:
• A market survey investigated the behaviour of industries regarding RTIs and provided figures and rates. A parallel survey targeted the pool operators.
• A working group defined the processes using UML use case and activity diagrams.
• The working group provided weaknesses and strengths.
BRIDGE – Building Radio frequency IDentification solutions for the Global Environment
5/49
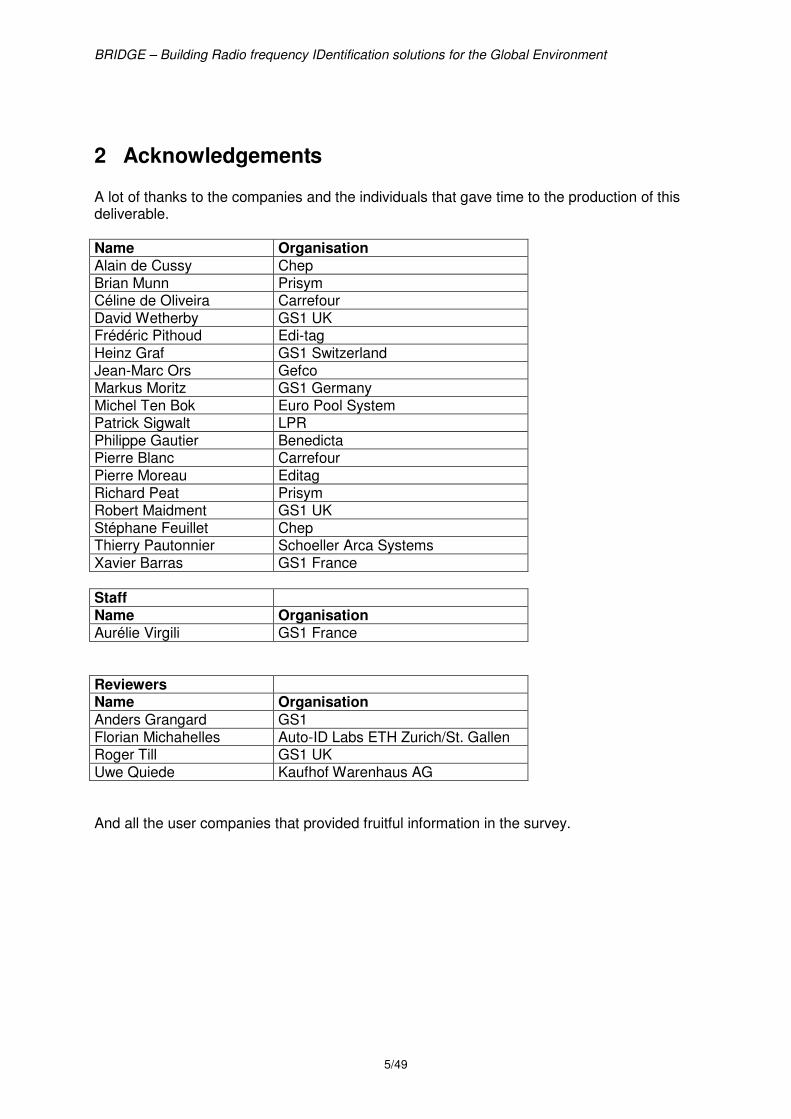
2 Acknowledgements A lot of thanks to the companies and the individuals that gave time to the production of this deliverable. Name Organisation Alain de Cussy Chep Brian Munn Prisym Céline de Oliveira Carrefour David Wetherby GS1 UK Frédéric Pithoud Edi-tag Heinz Graf GS1 Switzerland Jean-Marc Ors Gefco Markus Moritz GS1 Germany Michel Ten Bok Euro Pool System Patrick Sigwalt LPR Philippe Gautier Benedicta Pierre Blanc Carrefour Pierre Moreau Editag Richard Peat Prisym Robert Maidment GS1 UK Stéphane Feuillet Chep Thierry Pautonnier Schoeller Arca Systems Xavier Barras GS1 France Staff Name Organisation Aurélie Virgili GS1 France Reviewers Name Organisation
Anders Grangard GS1 Florian Michahelles Auto-ID Labs ETH Zurich/St. Gallen Roger Till GS1 UK Uwe Quiede Kaufhof Warenhaus AG And all the user companies that provided fruitful information in the survey.
BRIDGE – Building Radio frequency IDentification solutions for the Global Environment
6/49
3 Executive summary The first phase of Bridge project work package 9 has been designed to study the market for EpcGlobal applications in the area of Reusable Transport Items, known as RTIs. RTIs are items that are used to assemble goods for storage and transportation. They are meant to be used more than one time thus implying a cyclic system to make them available for loading again. Pallets and crates are good examples of RTIs. The first phase is very important to define these building stones of the project that the domain, the objectives and the context are. The building stones will be essential in the requirement gathering phase.
3.1.1 Domain
The project will focus on pallets and crates. The project will study the requirements and solutions for the pooling and the exchange models. The project will address the food and beverage sectors. The project will focus on the supply chain aspects of the models, that is to say information that is shared by partners.
3.1.2 Objectives
The system to be defined is a traceability system that will enable to locate RTIs and/or to have a better view on inventories. The project will:
• Provide a solution for RTI identification
• Provide a solution for data capture
• Provide a solution for data exchange.
3.1.3 Context
The project will be conducted in the context the European Regulation (EC) N. 1935/ 2004 on material and articles in contact with food obliges companies to trace materials that are in contact with food. Crates and their constitutive materials fall in this category. The regulation is applicable by 26th October 2006. Work in the project will be conducted under the standard umbrella of the EPCglobal working groups and especially the RTI working group.
BRIDGE – Building Radio frequency IDentification solutions for the Global Environment
7/49
4 The survey
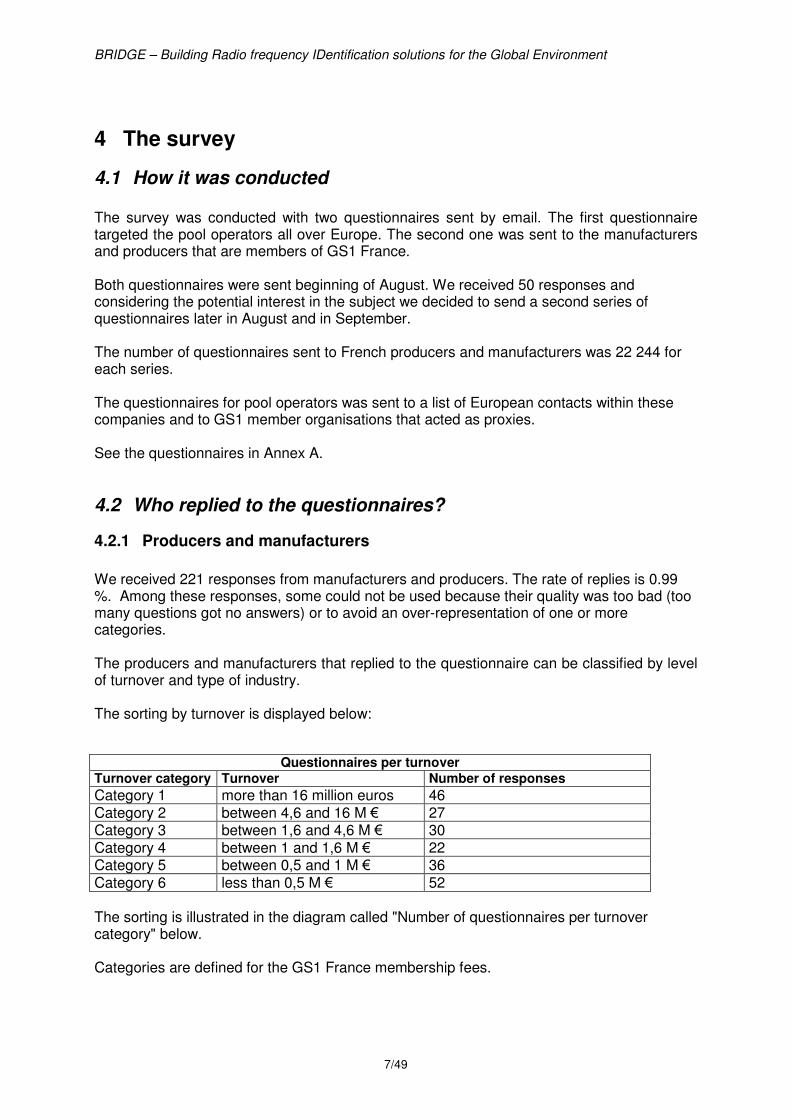
4.1 How it was conducted The survey was conducted with two questionnaires sent by email. The first questionnaire targeted the pool operators all over Europe. The second one was sent to the manufacturers and producers that are members of GS1 France. Both questionnaires were sent beginning of August. We received 50 responses and considering the potential interest in the subject we decided to send a second series of questionnaires later in August and in September. The number of questionnaires sent to French producers and manufacturers was 22 244 for each series. The questionnaires for pool operators was sent to a list of European contacts within these companies and to GS1 member organisations that acted as proxies. See the questionnaires in Annex A.
4.2 Who replied to the questionnaires?
4.2.1 Producers and manufacturers
We received 221 responses from manufacturers and producers. The rate of replies is 0.99 %. Among these responses, some could not be used because their quality was too bad (too many questions got no answers) or to avoid an over-representation of one or more categories. The producers and manufacturers that replied to the questionnaire can be classified by level of turnover and type of industry. The sorting by turnover is displayed below:
Questionnaires per turnover
Turnover category Turnover Number of responses
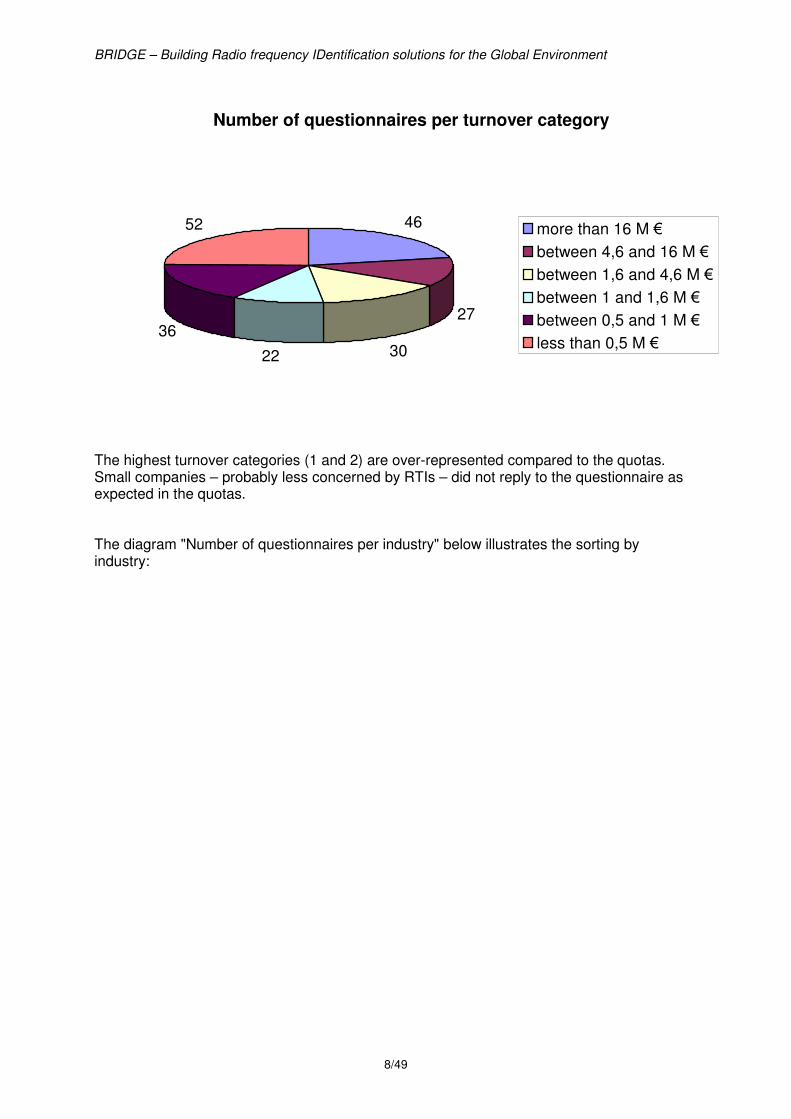
Category 1 more than 16 million euros 46 Category 2 between 4,6 and 16 M € 27 Category 3 between 1,6 and 4,6 M € 30 Category 4 between 1 and 1,6 M € 22 Category 5 between 0,5 and 1 M € 36 Category 6 less than 0,5 M € 52 The sorting is illustrated in the diagram called "Number of questionnaires per turnover category" below. Categories are defined for the GS1 France membership fees.
BRIDGE – Building Radio frequency IDentification solutions for the Global Environment
8/49
Number of questionnaires per turnover category
46
27
3022
36
52 more than 16 M €
between 4,6 and 16 M €
between 1,6 and 4,6 M €
between 1 and 1,6 M €
between 0,5 and 1 M €
less than 0,5 M €
The highest turnover categories (1 and 2) are over-represented compared to the quotas. Small companies – probably less concerned by RTIs – did not reply to the questionnaire as expected in the quotas. The diagram "Number of questionnaires per industry" below illustrates the sorting by industry:
BRIDGE – Building Radio frequency IDentification solutions for the Global Environment
9/49
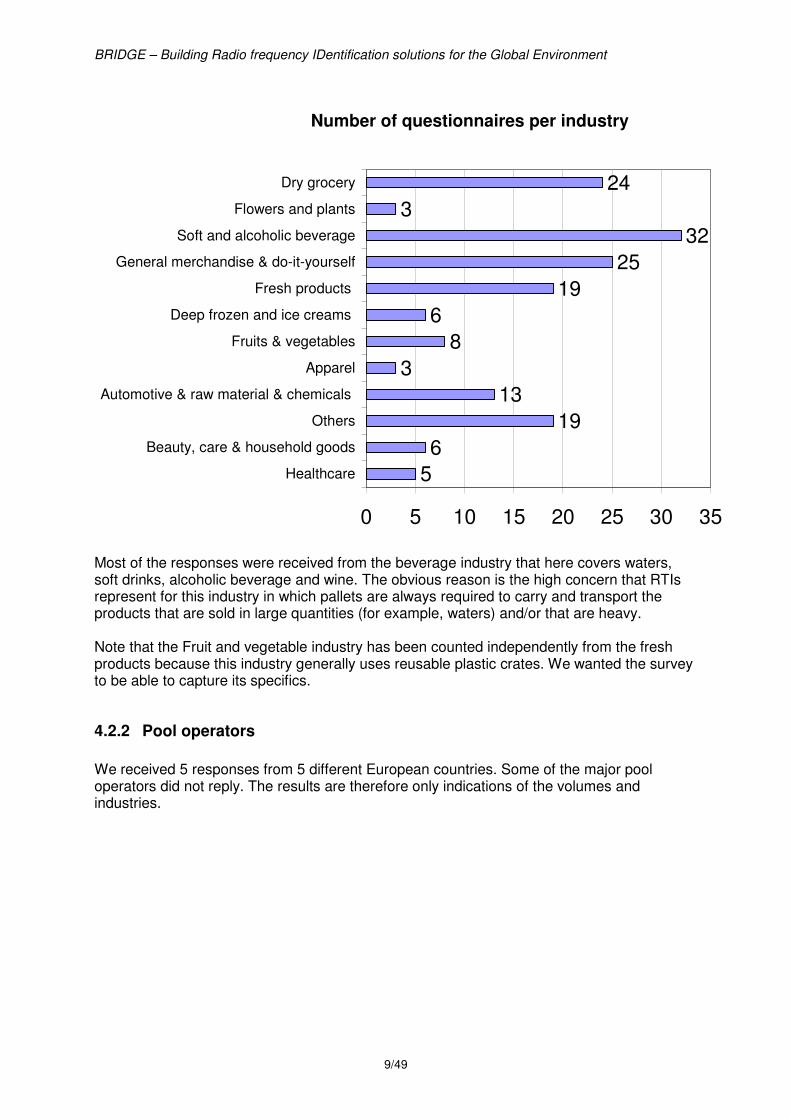
Number of questionnaires per industry
5
6
19
13
3
8
6
19
25
32
3
24
0 5 10 15 20 25 30 35
Healthcare
Beauty, care & household goods
Others
Automotive & raw material & chemicals
Apparel
Fruits & vegetables
Deep frozen and ice creams
Fresh products
General merchandise & do-it-yourself
Soft and alcoholic beverage
Flowers and plants
Dry grocery
Most of the responses were received from the beverage industry that here covers waters, soft drinks, alcoholic beverage and wine. The obvious reason is the high concern that RTIs represent for this industry in which pallets are always required to carry and transport the products that are sold in large quantities (for example, waters) and/or that are heavy. Note that the Fruit and vegetable industry has been counted independently from the fresh products because this industry generally uses reusable plastic crates. We wanted the survey to be able to capture its specifics.
4.2.2 Pool operators
We received 5 responses from 5 different European countries. Some of the major pool operators did not reply. The results are therefore only indications of the volumes and industries.
BRIDGE – Building Radio frequency IDentification solutions for the Global Environment
10/49
4.3 The findings of the survey
4.3.1 Producers
1.1.1.1 To use or not to use RTIs
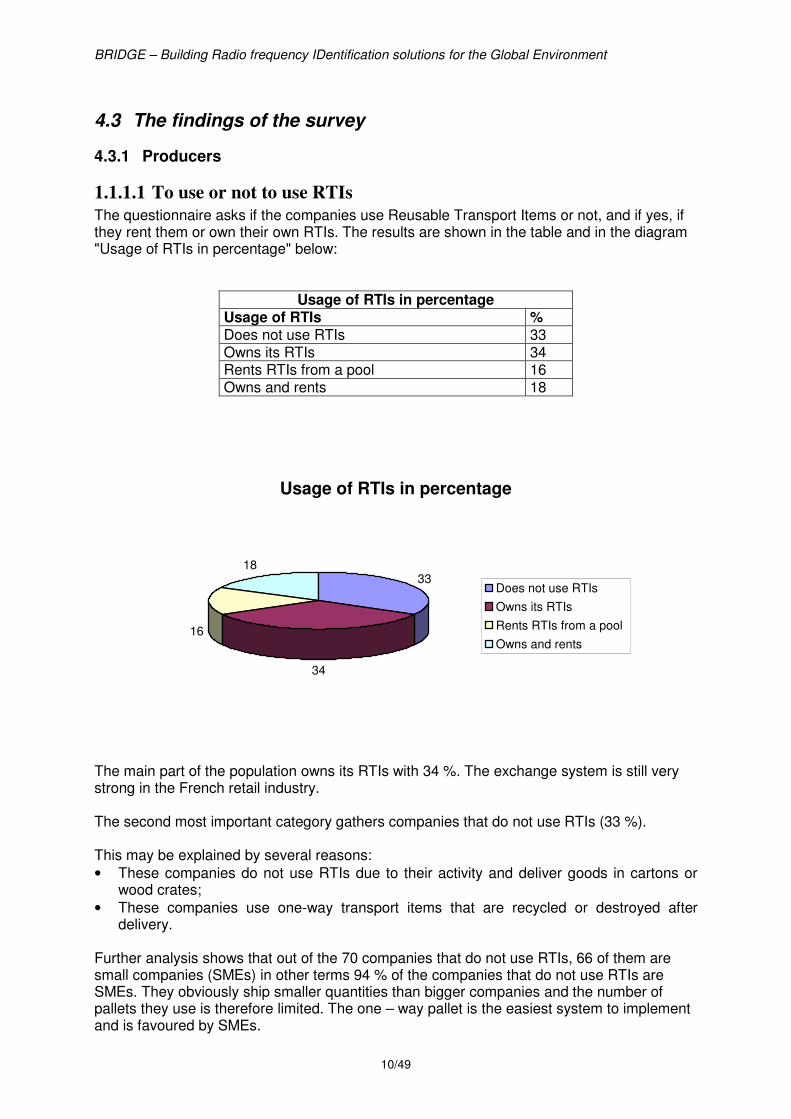
The questionnaire asks if the companies use Reusable Transport Items or not, and if yes, if they rent them or own their own RTIs. The results are shown in the table and in the diagram "Usage of RTIs in percentage" below:
Usage of RTIs in percentage Usage of RTIs % Does not use RTIs 33 Owns its RTIs 34 Rents RTIs from a pool 16 Owns and rents 18
Usage of RTIs in percentage
33
34
16
18
Does not use RTIs
Owns its RTIs
Rents RTIs from a pool
Owns and rents
The main part of the population owns its RTIs with 34 %. The exchange system is still very strong in the French retail industry. The second most important category gathers companies that do not use RTIs (33 %). This may be explained by several reasons:
• These companies do not use RTIs due to their activity and deliver goods in cartons or wood crates;
• These companies use one-way transport items that are recycled or destroyed after delivery.
Further analysis shows that out of the 70 companies that do not use RTIs, 66 of them are small companies (SMEs) in other terms 94 % of the companies that do not use RTIs are SMEs. They obviously ship smaller quantities than bigger companies and the number of pallets they use is therefore limited. The one – way pallet is the easiest system to implement and is favoured by SMEs.
BRIDGE – Building Radio frequency IDentification solutions for the Global Environment
11/49
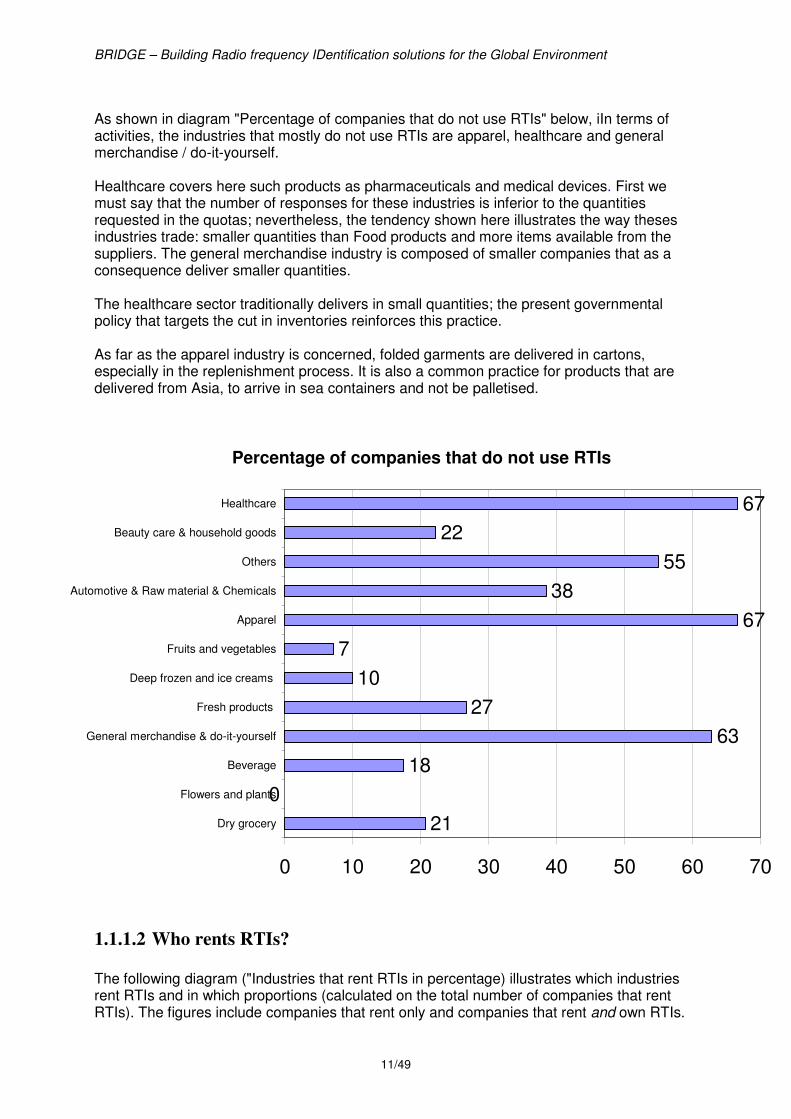
As shown in diagram "Percentage of companies that do not use RTIs" below, iIn terms of activities, the industries that mostly do not use RTIs are apparel, healthcare and general merchandise / do-it-yourself. Healthcare covers here such products as pharmaceuticals and medical devices. First we must say that the number of responses for these industries is inferior to the quantities requested in the quotas; nevertheless, the tendency shown here illustrates the way theses industries trade: smaller quantities than Food products and more items available from the suppliers. The general merchandise industry is composed of smaller companies that as a consequence deliver smaller quantities. The healthcare sector traditionally delivers in small quantities; the present governmental policy that targets the cut in inventories reinforces this practice. As far as the apparel industry is concerned, folded garments are delivered in cartons, especially in the replenishment process. It is also a common practice for products that are delivered from Asia, to arrive in sea containers and not be palletised.
Percentage of companies that do not use RTIs
21
0
18
63
27
10
7
67
38
55
22
67
0 10 20 30 40 50 60 70
Dry grocery
Flowers and plants
Beverage
General merchandise & do-it-yourself
Fresh products
Deep frozen and ice creams
Fruits and vegetables
Apparel
Automotive & Raw material & Chemicals
Others
Beauty care & household goods
Healthcare
1.1.1.2 Who rents RTIs?
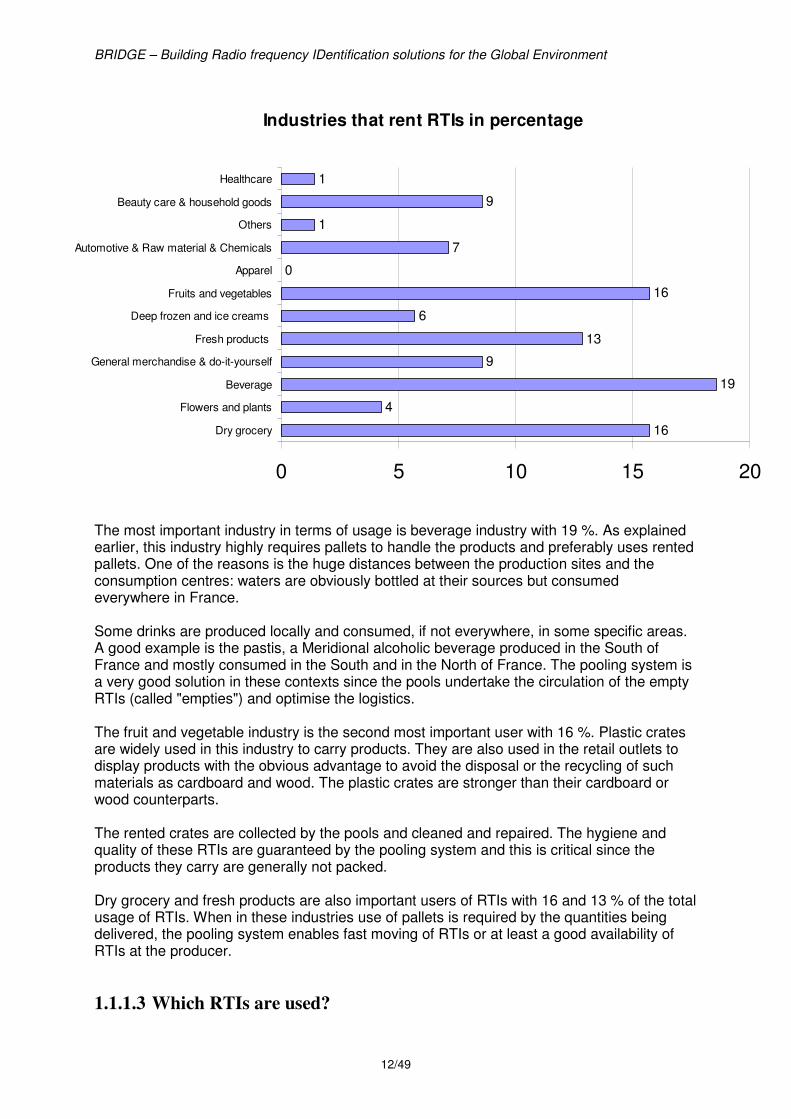
The following diagram ("Industries that rent RTIs in percentage) illustrates which industries rent RTIs and in which proportions (calculated on the total number of companies that rent RTIs). The figures include companies that rent only and companies that rent and own RTIs.
BRIDGE – Building Radio frequency IDentification solutions for the Global Environment
12/49
Industries that rent RTIs in percentage
16
4
19
9
13
6
16
0
7
1
9
1
0 5 10 15 20
Dry grocery
Flowers and plants
Beverage
General merchandise & do-it-yourself
Fresh products
Deep frozen and ice creams
Fruits and vegetables
Apparel
Automotive & Raw material & Chemicals
Others
Beauty care & household goods
Healthcare
The most important industry in terms of usage is beverage industry with 19 %. As explained earlier, this industry highly requires pallets to handle the products and preferably uses rented pallets. One of the reasons is the huge distances between the production sites and the consumption centres: waters are obviously bottled at their sources but consumed everywhere in France. Some drinks are produced locally and consumed, if not everywhere, in some specific areas. A good example is the pastis, a Meridional alcoholic beverage produced in the South of France and mostly consumed in the South and in the North of France. The pooling system is a very good solution in these contexts since the pools undertake the circulation of the empty RTIs (called "empties") and optimise the logistics. The fruit and vegetable industry is the second most important user with 16 %. Plastic crates are widely used in this industry to carry products. They are also used in the retail outlets to display products with the obvious advantage to avoid the disposal or the recycling of such materials as cardboard and wood. The plastic crates are stronger than their cardboard or wood counterparts. The rented crates are collected by the pools and cleaned and repaired. The hygiene and quality of these RTIs are guaranteed by the pooling system and this is critical since the products they carry are generally not packed. Dry grocery and fresh products are also important users of RTIs with 16 and 13 % of the total usage of RTIs. When in these industries use of pallets is required by the quantities being delivered, the pooling system enables fast moving of RTIs or at least a good availability of RTIs at the producer.
1.1.1.3 Which RTIs are used?

BRIDGE – Building Radio frequency IDentification solutions for the Global Environment
13/49
The questionnaire inquired about the types of RTIs that are used by companies. The first categorisation is about standard / non-standard RTIs. Non standard RTIs are RTIs that are specific to a product or to a company. Typical examples of product specific RTIs are crates that are used in the automotive industry to carry engines. Each engine being different, crates are specific to an engine. Another example – closer to the retail industry – is bottle crates marked with the brand name of the products. They are common in the beer and soft drink industries. Companies mainly use standard RTIs with 92 % of the replies. When they use non-standard RTIs they also use standard RTIs for different type of RTIs and/or for different processes (upstream processes versus toward retail processes). In terms of type of RTIs, pallets (any type and size) which are used by 60 % of the companies that declare that they use RTIs take the bigger part. Second come crates (again, any size and type) with 15 % of usage. Other types of RTIs that are used to a smaller extent are:
• Chemical containers
• Roll cages 2 sides
• Roll cages 4 sides One company from the meat industry indicated the usage of RTIs specific to this industry such as hooks to hold and carry carcasses. In the same industry, metal rolls are currently exchanged and special attention is given to these RTIs since their costs are high.
1.1.1.4 How are RTIs used?
1.1.1.4.1 Pallets
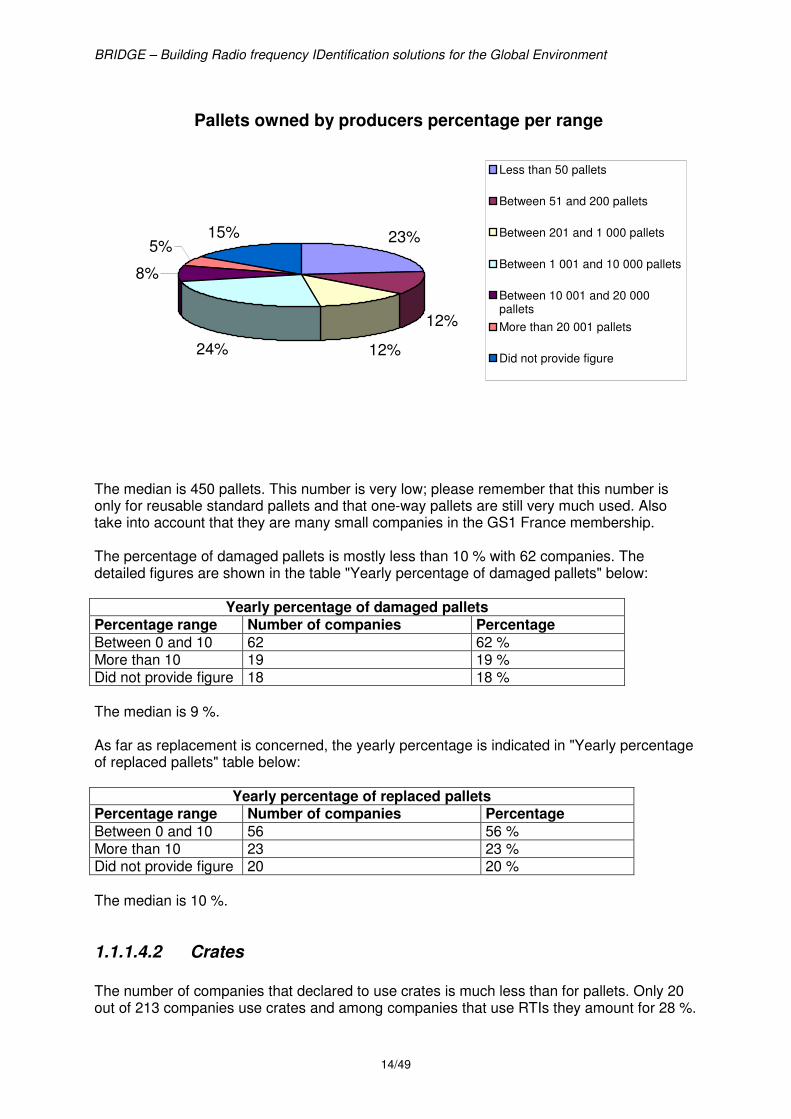
The number of standard reusable pallets owned by companies is off course very different from one company to another, depending on its size, sector and distribution networks. On the 99 companies that declared to use pallets we have sorted the numbers by ranges as shown in "Number of pallets owned by producers percentage per range" table and diagram.
Number of pallets owned by producers percentage per range Range Number of companies Percentage Less than 50 pallets 23 23 % Between 51 and 200 pallets 12 12 % Between 201 and 1 000 pallets 12 12 % Between 1 001 and 10 000 pallets 24 24 % Between 10 001 and 20 000 pallets 8 8 % More than 20 001 pallets 5 5 % Did not provide figure 15 15 %
BRIDGE – Building Radio frequency IDentification solutions for the Global Environment
14/49
Pallets owned by producers percentage per range
23%
12%
12%24%
8%
5%15%
Less than 50 pallets
Between 51 and 200 pallets
Between 201 and 1 000 pallets
Between 1 001 and 10 000 pallets
Between 10 001 and 20 000pallets
More than 20 001 pallets
Did not provide figure
The median is 450 pallets. This number is very low; please remember that this number is only for reusable standard pallets and that one-way pallets are still very much used. Also take into account that they are many small companies in the GS1 France membership. The percentage of damaged pallets is mostly less than 10 % with 62 companies. The detailed figures are shown in the table "Yearly percentage of damaged pallets" below:
Yearly percentage of damaged pallets Percentage range Number of companies Percentage
Between 0 and 10 62 62 % More than 10 19 19 % Did not provide figure 18 18 % The median is 9 %. As far as replacement is concerned, the yearly percentage is indicated in "Yearly percentage of replaced pallets" table below:
Yearly percentage of replaced pallets Percentage range Number of companies Percentage
Between 0 and 10 56 56 % More than 10 23 23 % Did not provide figure 20 20 % The median is 10 %.
1.1.1.4.2 Crates
The number of companies that declared to use crates is much less than for pallets. Only 20 out of 213 companies use crates and among companies that use RTIs they amount for 28 %.
BRIDGE – Building Radio frequency IDentification solutions for the Global Environment
15/49
These companies are mostly from the fruit and vegetable and fresh products industries. The number of crates crate users own is displayed in table "Number of crates owned by producers percentage per range":
Number of crates owned by producers percentage per range Range Number of companies Percentage Less than 200 10 50 % Between 201 and 40 000 10 50 % Did not provide figure 0 0 % The median is 225. The percentage of damaged crates spans between 0 and 70 %. The median is 3%. This rate is smaller than the pallet equivalent that amounts to 9%. Crates are stronger than pallets. The percentage of replaced crates ranges between 0 and 100 %. The median is 3.5 %. Here again, crates require less replacement than pallets, because they are stronger and are not subject to collision.
4.3.2 RTI pool operators
We have to remind that only five responses from pool operators were received. Moreover they were sent from 5 different European countries. As a consequence, it is impossible to compare the findings of the pool operators' survey with the producers' survey since only the French market provided information in the latter.
1.1.1.5 Industries
The industries in which pool operators trade the most are first fruits & vegetables, second fresh products and then dry grocery.
1.1.1.6 Type of RTIs
As for producers, standard RTIs represent the most important part of the market for pool operators. Pallets are the most common RTIs for pool operators since 4 out of 5 propose this type of RTIs to their clients. When cumulating all the pallets of these five companies, the number reaches 7 427 000. The total number of crates is 100 500 000.
1.1.1.7 RTIs Damaged and replaced
In the table below are shown the medians for the average year turnover (i.e. the average number of times a container is shipped and returned), the percentage of damaged RTIs and the percentage of replaced RTIs for pallets and for crates.
Medians for turnover, damages and replacement Turnover Damaged RTIs Replaced RTIs Pallets 3.15 3 % 4 %
BRIDGE – Building Radio frequency IDentification solutions for the Global Environment
16/49
Crates 14.7 1.45 % 2.45 % The – imperfect - comparison with the figures of the producer-owned RTIs tends to confirm the statement of section 6.1.2 about the better quality of pooled RTIs.
BRIDGE – Building Radio frequency IDentification solutions for the Global Environment
17/49
5 Process descriptions The objective of this section is to provide a description of the current processes. It includes definitions of the actors, activities and interactions between actors. It describes how the "as is" system works thus showing weaknesses and strengths. Last but not least, these descriptions will be used in the business requirement phase to define and document the to-be system. The process descriptions use the UML notation.
5.1 How to read a use case diagram A use case diagram shows the functionalities of a system. It also shows the relationship of "actors" to essential processes, as well as the relationships among different use cases (or functionality). A use case is a unit of functionality. An actor is a party or a system that interacts with the system. In the use case diagram, a use case is represented as an oval. An actor is shown as a stick person. Lines depict relationships between actors and use cases.
5.2 How to read an activity diagram An Activity diagram is used to model higher-level business processes as a sequence of activities and - sometimes – states. An Activity is modelled by drawing a rectangle with rounded edges, enclosing the activity's name. Activities can be connected to other activities through transition lines, or to decision points that connect to different activities guarded by conditions of the decision point. Activities that terminate the modelled process are connected to a termination. Activities can be grouped into swimlanes, which are used to indicate the object that actually performs the activity.
5.3 Pooling model As described in the introduction, the pooling model involves a pool operator which owns the RTIs. A pool operator is a company that provides RTIs to suppliers and make sure that the quality and quantity of these RTIs match the supplier's requirements. The pooling process includes getting the RTIs back from the delivery location and reconditioning before new use. In order to achieve this purpose, the process must:
• Give the pool operator visibility on the location of its RTIs in order to enable the RTI operator to get the RTIs back as quickly as possible and to meet its clients' demand.
• Enable the pool operator to control the quality of its RTIs Additionally, the process should enable
• The retailers to locate the items that are transported on the RTI;
BRIDGE – Building Radio frequency IDentification solutions for the Global Environment
18/49
• The retailers, producers and pool operators to provide a tool to improve internal inventory management especially in cross docking applications and when there are several locations.
The WP9 project targets to deliver tools that will increase the rotation of the RTIs, enable a more effective management, which could for example, fulfil high season demand and decrease the loss rate.
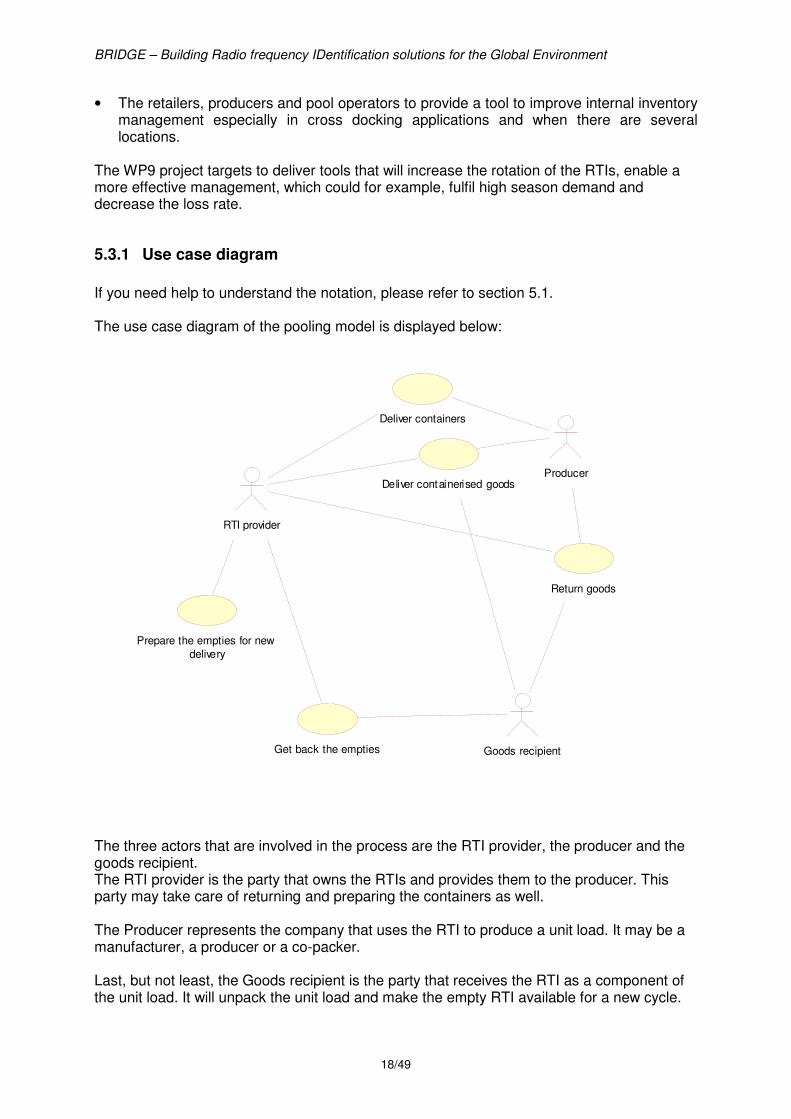
5.3.1 Use case diagram
If you need help to understand the notation, please refer to section 5.1. The use case diagram of the pooling model is displayed below:
Deliver containers
Get back the empties
Deliver containerised goods
Prepare the empties for new
delivery
Producer
Goods recipient
Return goods
RTI provider
The three actors that are involved in the process are the RTI provider, the producer and the goods recipient. The RTI provider is the party that owns the RTIs and provides them to the producer. This party may take care of returning and preparing the containers as well. The Producer represents the company that uses the RTI to produce a unit load. It may be a manufacturer, a producer or a co-packer. Last, but not least, the Goods recipient is the party that receives the RTI as a component of the unit load. It will unpack the unit load and make the empty RTI available for a new cycle.
BRIDGE – Building Radio frequency IDentification solutions for the Global Environment
19/49
The use case diagram describes the process whereby a RTI provider provides empty containers to a producer. These containers are used to ship goods to the goods recipient. The RTI provider then gets back the empty containers. They may be repaired and/or washed before being available for a new delivery to a producer. The detailed processes will be described below. The diagram does not include the definition and agreement on a contract and the description of the RTI specifications, both tasks defined as pre-conditions. The diagram does not include either the invoicing of the RTIs (defined as a post-condition). Although very interesting, the "prepare the empties for new delivery" use case is not further analysed in this document since it is seen more as a RTI provider internal process that has limited interest to the supply chain.
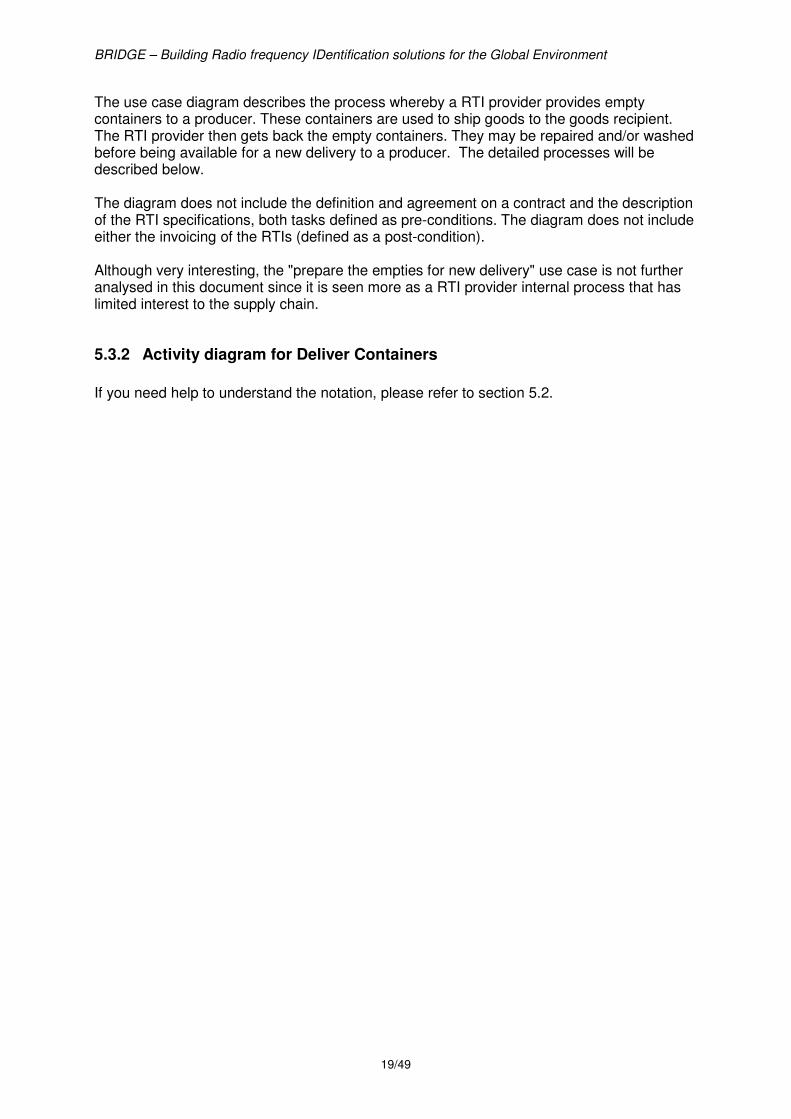
5.3.2 Activity diagram for Deliver Containers
If you need help to understand the notation, please refer to section 5.2.
BRIDGE – Building Radio frequency IDentification solutions for the Global Environment
20/49
Calculate needs
for containers
Place an order
Receive the
containers
Register RTI movement in RTI
management system
RTI available for use
Process the
order
Credit the producer
inventory
Delivery movement closed
Organise
transport
RTI providerProducer
BRIDGE – Building Radio frequency IDentification solutions for the Global Environment
21/49
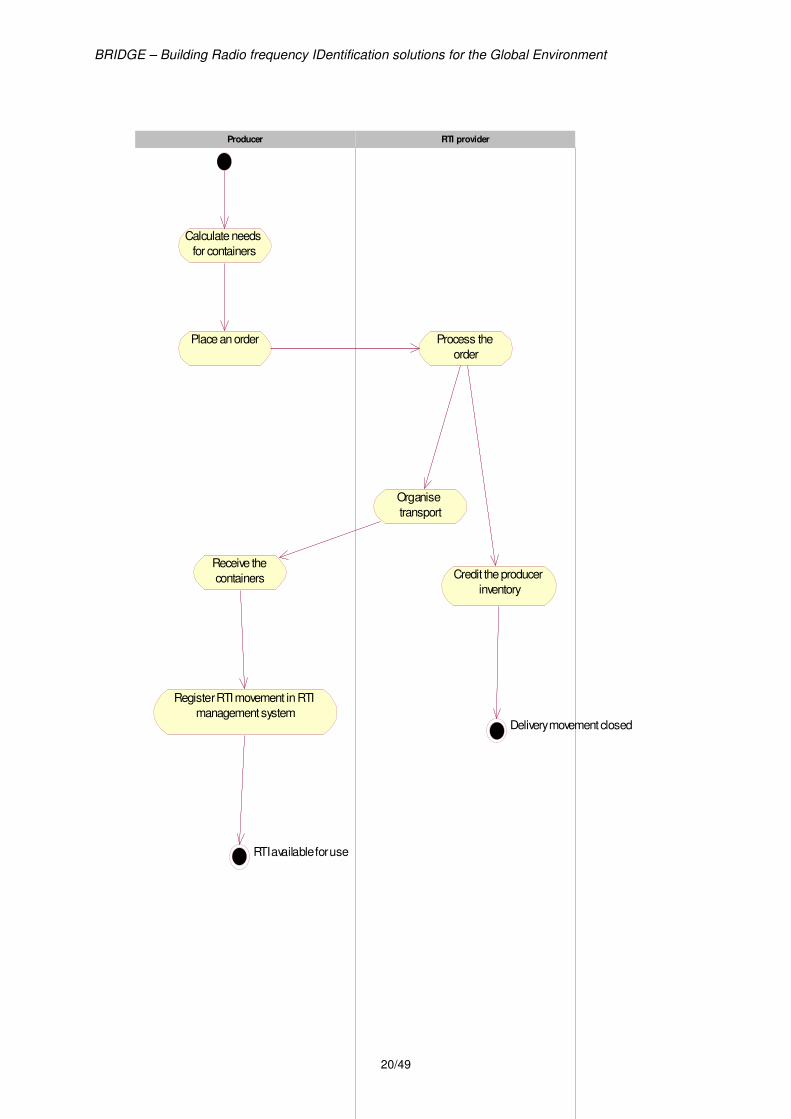
5.3.3 Activity diagram for Deliver Containerised goods
If you need help to understand the notation, please refer to section 5.2.
Debit producer
inventory
Credit goods
recipient inventory
Movement closed
Ship goods or prepare goods
for shipment
Notify outbound
movement
Purchase order received
Register reception
movement
Move to distribution
centre picking area
Is a cross-docking
movement?No
Process as cross-docking (Cf.
activity diagram)
Yes
Receive the unit
loads
Goods recipientProducerRTI provider
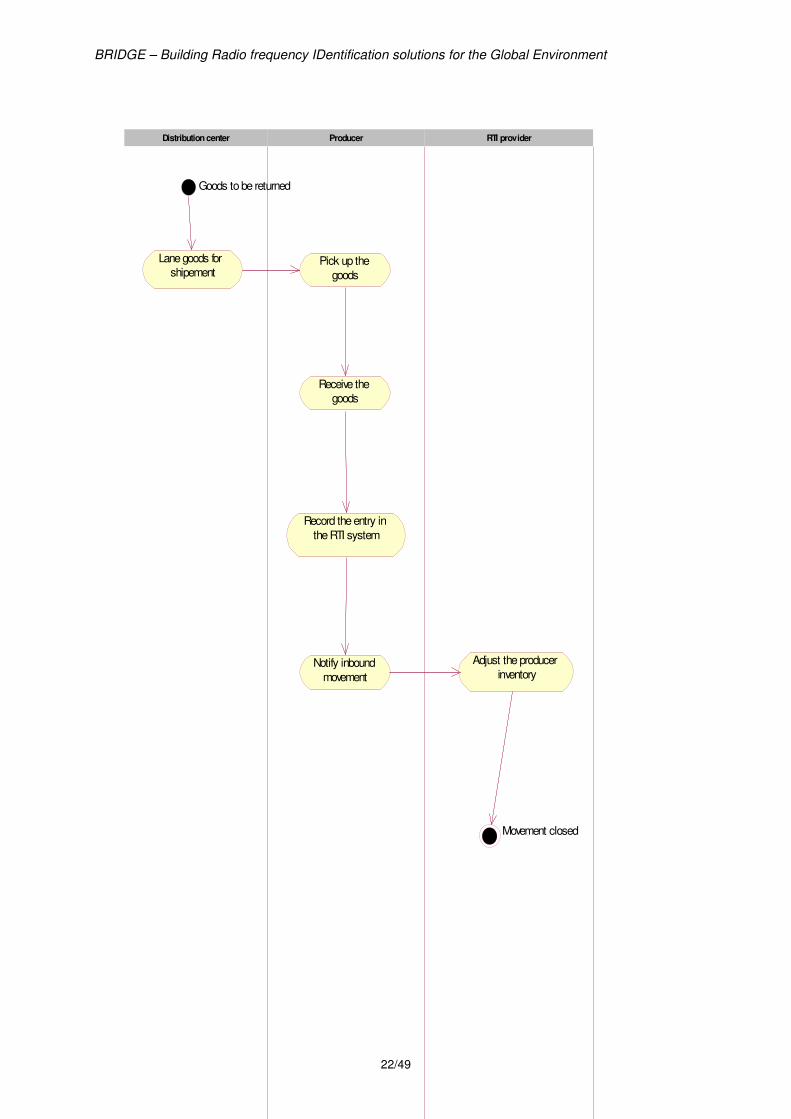
5.3.4 Activity diagram for Return Goods
When the goods recipient has received incorrect goods, they are sent back to the producer, except in the cross-docking process in which the products are accepted; the forecast and inventory are adjusted accordingly. If you need help to understand the notation, please refer to section 5.2.
BRIDGE – Building Radio frequency IDentification solutions for the Global Environment
22/49
Goods to be returned
Lane goods for
shipementPick up the
goods
Receive the
goods
Record the entry in
the RTI system
Notify inbound
movement
Adjust the producer
inventory
Movement closed
RTI providerProducerDistribution center
BRIDGE – Building Radio frequency IDentification solutions for the Global Environment
23/49
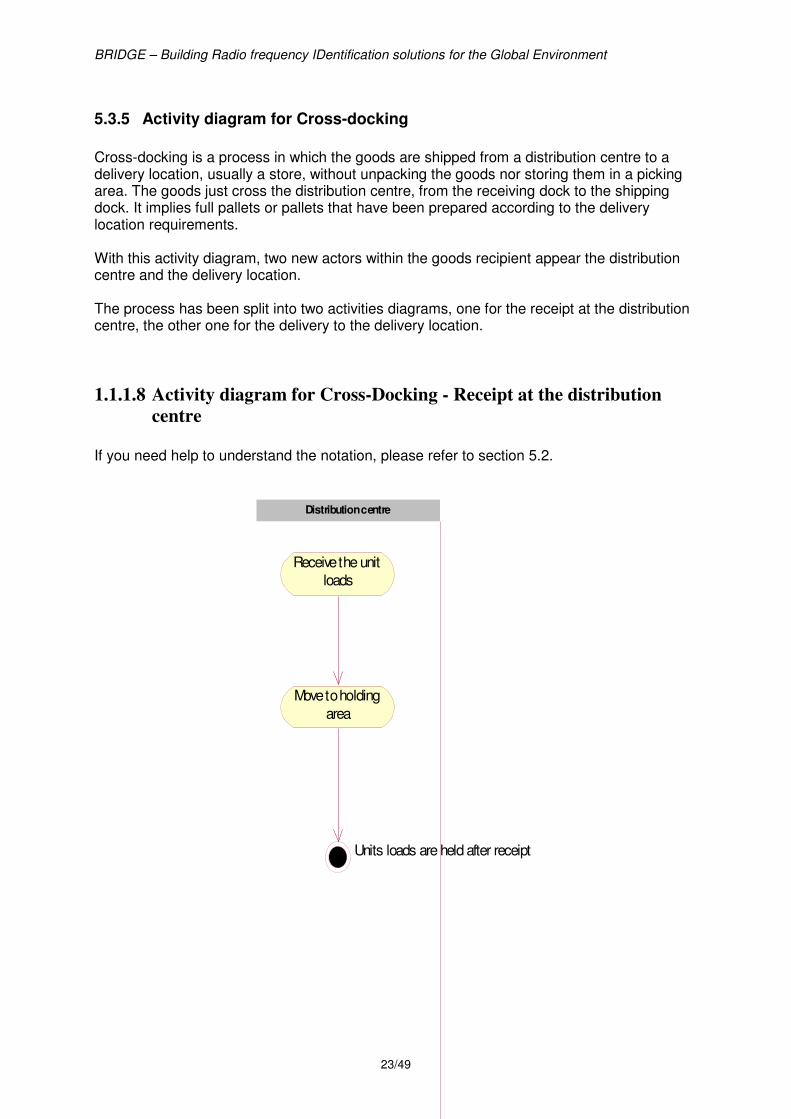
5.3.5 Activity diagram for Cross-docking
Cross-docking is a process in which the goods are shipped from a distribution centre to a delivery location, usually a store, without unpacking the goods nor storing them in a picking area. The goods just cross the distribution centre, from the receiving dock to the shipping dock. It implies full pallets or pallets that have been prepared according to the delivery location requirements. With this activity diagram, two new actors within the goods recipient appear the distribution centre and the delivery location. The process has been split into two activities diagrams, one for the receipt at the distribution centre, the other one for the delivery to the delivery location.
1.1.1.8 Activity diagram for Cross-Docking - Receipt at the distribution
centre
If you need help to understand the notation, please refer to section 5.2.
Receive the unit
loads
Move to holding
area
Units loads are held after receipt
Distribution centre

BRIDGE – Building Radio frequency IDentification solutions for the Global Environment
24/49
1.1.1.9 Activity diagram for Cross-Docking - delivery to the delivery
location
If you need help to understand the notation, please refer to section 5.2.
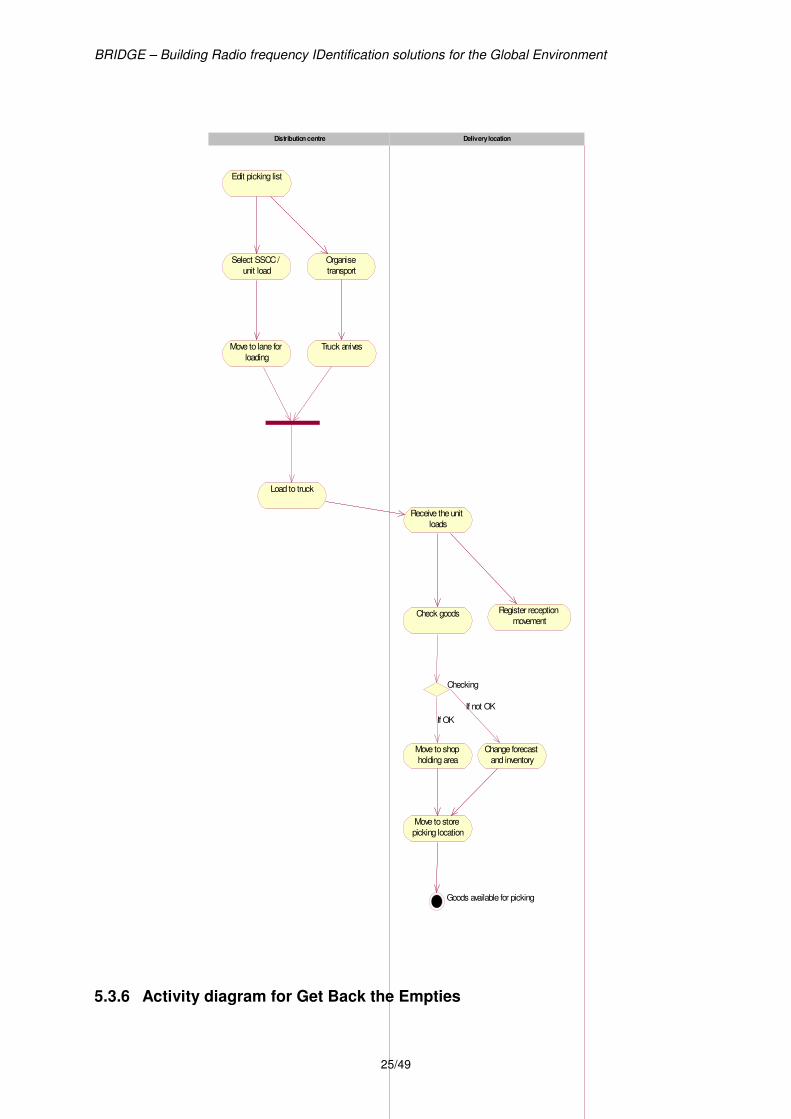
BRIDGE – Building Radio frequency IDentification solutions for the Global Environment
25/49
Edit picking list
Select SSCC /
unit load
Move to lane for
loading
Organise
transport
Truck arrives
Load to truck
Receive the unit
loads
Check goods
Checking
Change forecast
and inventory
If not OK
Move to shop
holding area
If OK
Move to store
picking location
Goods available for picking
Register reception
movement
Delivery locationDistribution centre
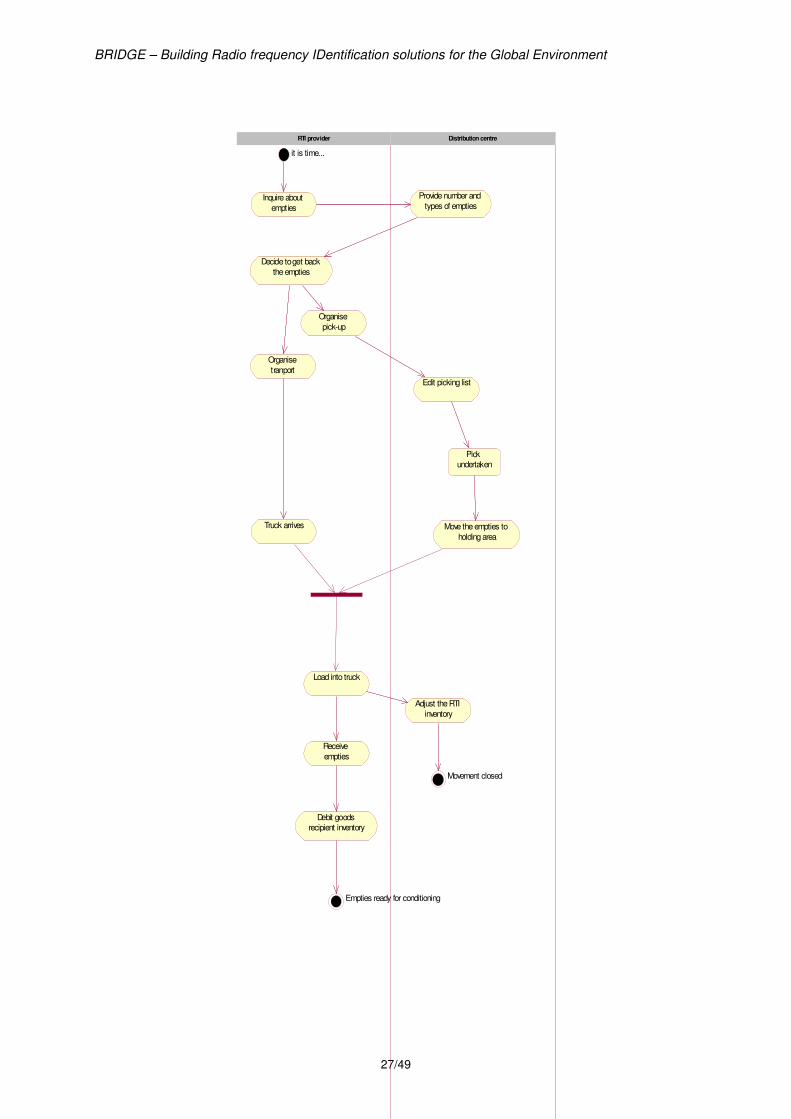
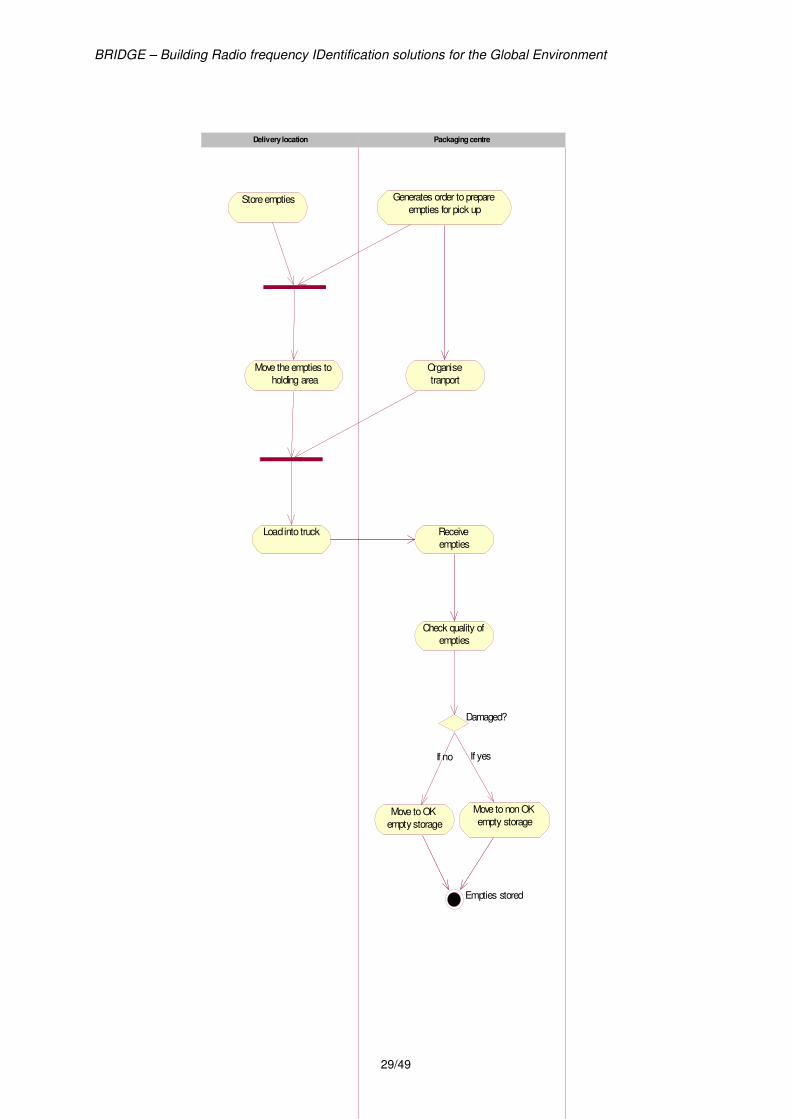
5.3.6 Activity diagram for Get Back the Empties
BRIDGE – Building Radio frequency IDentification solutions for the Global Environment
26/49
Get back the empties (empty RTIs) can be achieved with two different processes. In the first one, empties are collected from the distribution centre by the RTI provider. The distribution centre is the place where the empties are made available. In the second process, an actor within the goods recipient organisation – the packaging centre - collects the RTIs from the delivery locations in order to centralise them. The empties are stored at the packaging centre before being picked up by RTI providers or by carriers (see in 5.4). When delivery locations are involved in the process, the packaging centre collects all the RTIs from the delivery locations. The packaging centre is located at the same address as the distribution centre but is a different department.
1.1.1.10 Activity diagram for Empties back from distribution centre
If you need help to understand the notation, please refer to section 5.2.
BRIDGE – Building Radio frequency IDentification solutions for the Global Environment
27/49
Inquire about
empties
Receive
empties
Empties ready for conditioning
Debit goods
recipient inventory
it is time...
Organise
tranport
Decide to get back
the empties
Organise
pick-up
Truck arrives
Load into truck
Provide number and
types of empties
Edit picking list
Pick
undertaken
Move the empties to
holding area
Adjust the RTI
inventory
Movement closed
Distribution centreRTI provider

BRIDGE – Building Radio frequency IDentification solutions for the Global Environment
28/49
1.1.1.11 Activity diagram for Empties back to the packaging centre
If you need help to understand the notation, please refer to section 5.2.
BRIDGE – Building Radio frequency IDentification solutions for the Global Environment
29/49
Store empties
Move the empties to
holding area
Load into truck
Generates order to prepare
empties for pick up
Organise
tranport
Receive
empties
Check quality of
empties
Damaged?
Move to OK
empty storage
If no
Move to non OK
empty storage
If yes
Empties stored
Packaging centreDelivery location

BRIDGE – Building Radio frequency IDentification solutions for the Global Environment
30/49
1.1.1.12 Activity diagram for Empties back from the packaging centre
to the RTI provider
If you need help to understand the notation, please refer to section 5.2. The process is the same as the one that involves the distribution centre and the RTI provider.

BRIDGE – Building Radio frequency IDentification solutions for the Global Environment
31/49
Inquire about
empties
Receive
empties
Empties ready for conditioning
Debit goods
recipient inventory
it is time...
Organise
tranport
Decide to get back
the empties
Organise
pick-up
Truck arrives
Load into truck
Provide number and
types of empties
Edit picking list
Pick
undertaken
Move the empties to
holding area
Adjust the RTI
inventory
Movement closed
Distribution centreRTI provider
BRIDGE – Building Radio frequency IDentification solutions for the Global Environment
32/49
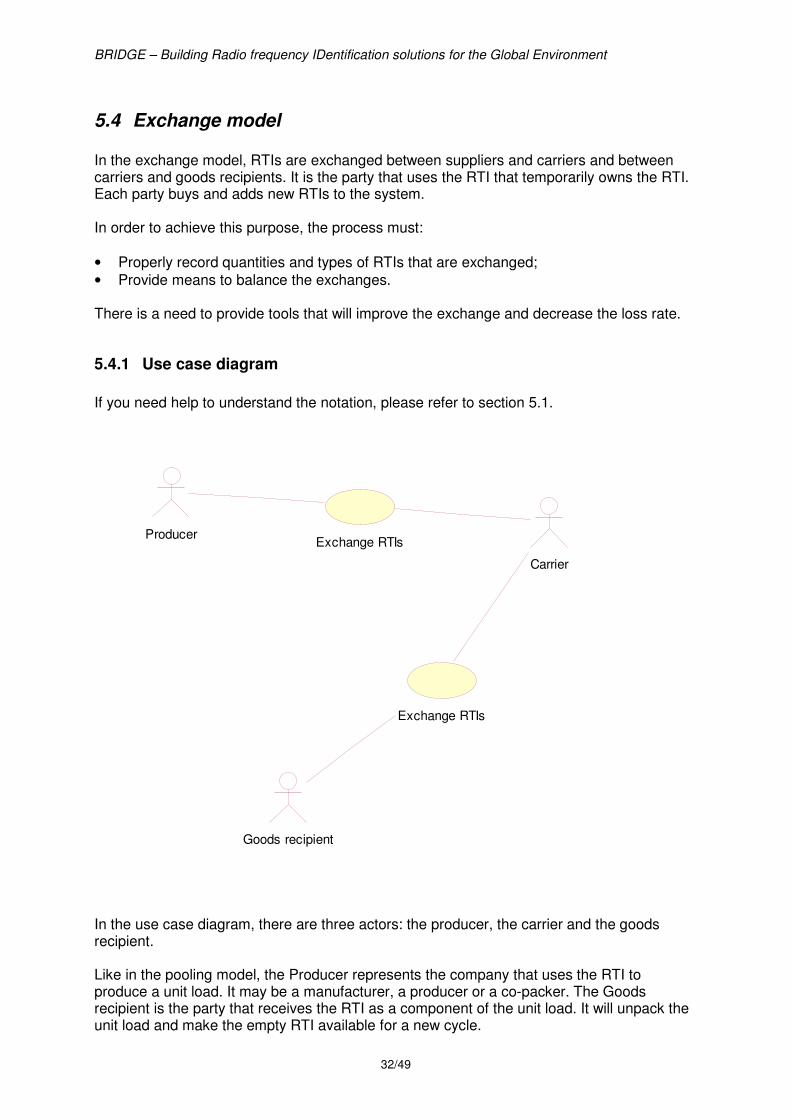
5.4 Exchange model In the exchange model, RTIs are exchanged between suppliers and carriers and between carriers and goods recipients. It is the party that uses the RTI that temporarily owns the RTI. Each party buys and adds new RTIs to the system. In order to achieve this purpose, the process must:
• Properly record quantities and types of RTIs that are exchanged;
• Provide means to balance the exchanges. There is a need to provide tools that will improve the exchange and decrease the loss rate.
5.4.1 Use case diagram
If you need help to understand the notation, please refer to section 5.1.
ProducerExchange RTIs
Carrier
Goods recipient
Exchange RTIs
In the use case diagram, there are three actors: the producer, the carrier and the goods recipient. Like in the pooling model, the Producer represents the company that uses the RTI to produce a unit load. It may be a manufacturer, a producer or a co-packer. The Goods recipient is the party that receives the RTI as a component of the unit load. It will unpack the unit load and make the empty RTI available for a new cycle.
BRIDGE – Building Radio frequency IDentification solutions for the Global Environment
33/49
The Carrier is the party that physically carries the goods to the Goods recipient. It is also responsible for the goods during transport. The use case diagram describes the process whereby a producer exchanges full RTIs against empty RTIs with a carrier. The carrier in his turn will exchange RTIs with the goods recipient. There is no pre-condition to these use cases. The post-condition is to balance the inventories between the producer and the carrier, either by providing RTIs or by paying RTIs.
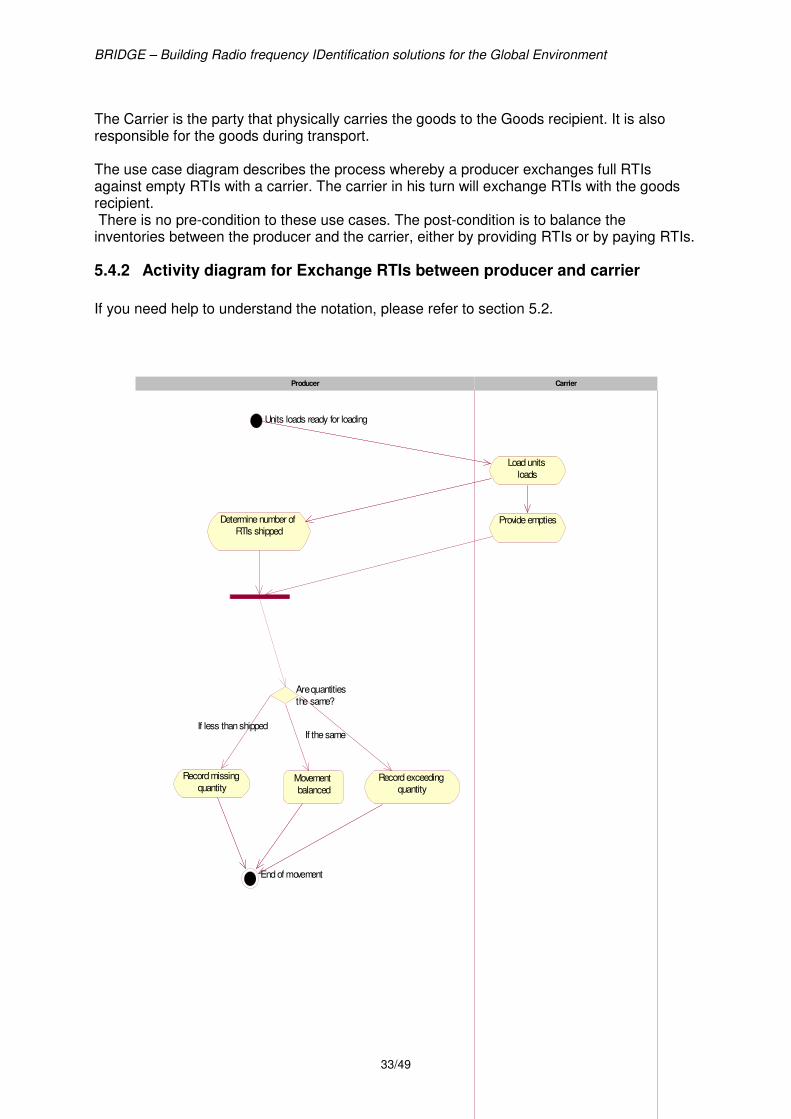
5.4.2 Activity diagram for Exchange RTIs between producer and carrier
If you need help to understand the notation, please refer to section 5.2.
Determine number of
RTIs shipped
Are quantities
the same?
Record missing
quantity
If less than shipped
Movement
balanced
If the same
End of movement
Units loads ready for loading
Record exceeding
quantity
Load units
loads
Provide empties
CarrierProducer
BRIDGE – Building Radio frequency IDentification solutions for the Global Environment
34/49
5.4.3 Activity diagrams for Exchange RTIs between carrier and goods recipient
This use case is divided into three activity diagrams since the physical exchange of the RTIs may be synchronous to the delivery of unit loads goods or be take place after delivery of unit loads. In that case, empty RTIs are retrieved at the packaging centre, a different location from where the goods are delivered.
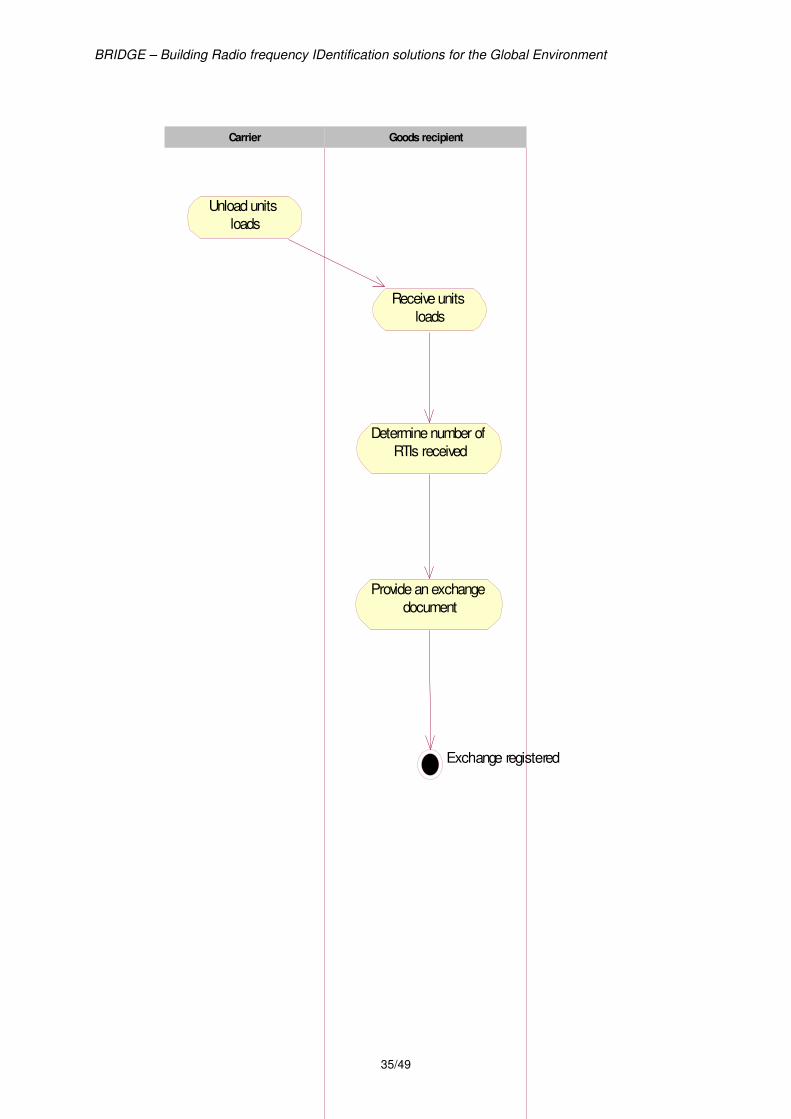
1.1.1.13 Carrier – Goods recipient exchange – asynchronous - Provide
and acknowledge number of RTIs
If you need help to understand the notation, please refer to section 5.2.
BRIDGE – Building Radio frequency IDentification solutions for the Global Environment
35/49
Unload units
loads
Receive units
loads
Determine number of
RTIs received
Provide an exchange
document
Exchange registered
Goods recipientCarrier
BRIDGE – Building Radio frequency IDentification solutions for the Global Environment
36/49
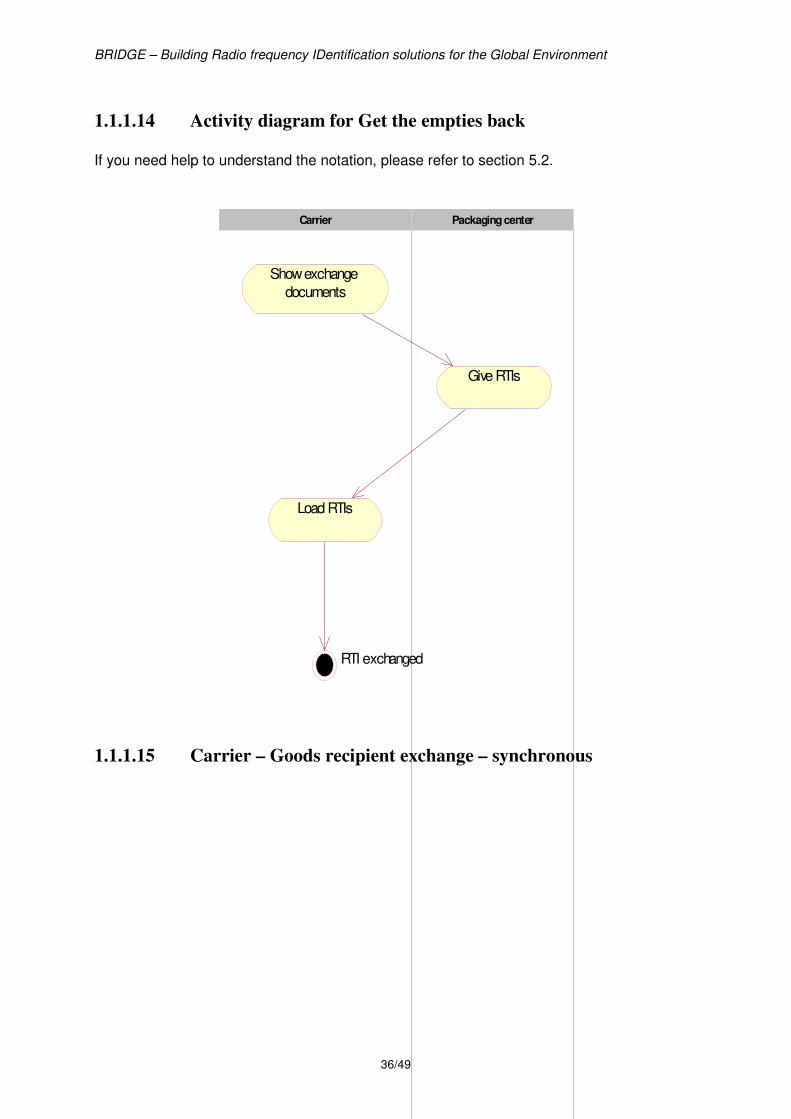
1.1.1.14 Activity diagram for Get the empties back
If you need help to understand the notation, please refer to section 5.2.
Show exchange
documents
Load RTIs
RTI exchanged
Give RTIs
Packaging centerCarrier
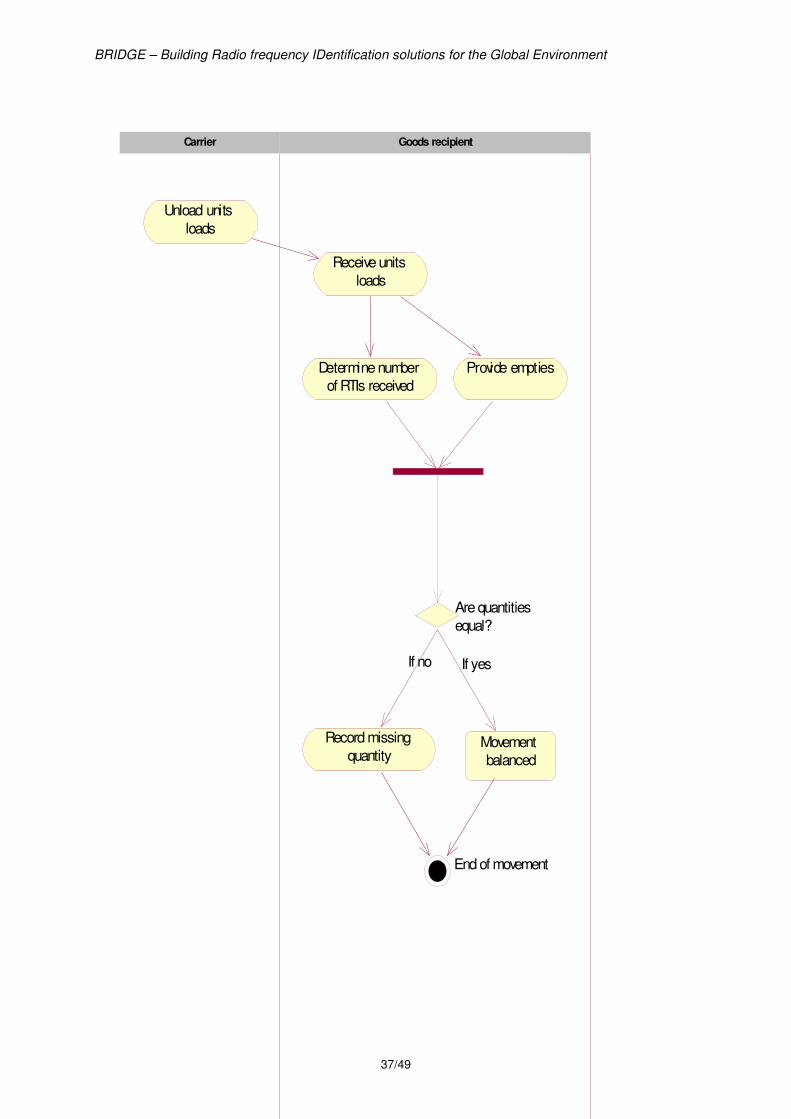
1.1.1.15 Carrier – Goods recipient exchange – synchronous
BRIDGE – Building Radio frequency IDentification solutions for the Global Environment
37/49
Unload units
loads
Determine number
of RTIs received
Receive units
loads
Provide empties
Are quantities
equal?
Record missing
quantity
If no
Movement
balanced
If yes
End of movement
Goods recipientCarrier

BRIDGE – Building Radio frequency IDentification solutions for the Global Environment
38/49
6 Strengths and weaknesses of the models In this section, we list the weaknesses and strengths of the pooling and the exchange models. The weaknesses that are identified will be the grounds for improvements that will be defined during the business requirement phase. The strengths will be used as enablers in the following steps of the project.
6.1 Pooling model
6.1.1 Weaknesses
• Some actors of the supply chain keep the RTIs longer than needed.
• Some actors re-use the RTIs when they are not entitled to do so or for products the RTIs are not meant for.
• In case of seasonal products, it is uneconomical to collect non-used RTIs.
• Hard discounters use RTIs to display units in the shops.
• There is no way the pool manager can anticipate the number and type of RTIs that need to be cleaned and repaired before receiving and checking them.
• The model should be able to react more quickly to demand-side variations, when a product sees a sudden and not forecasted increase in demand. For example, products that are consumed when the temperature raises like sodas, ice creams or barbecue items.
• The model should also be more reactive to supply-side variations. These variations are dependent on the weather in the fruit and vegetable industry, when crops are harvested in advance. This especially affects crates.
• It is recognised that producers over-stock for fear of being out of stock. As a side effect, this artificial inventory increases the level of the overall inventory and slows down the circulation of RTIs.
• It is clear that the RTI inventory is not always well managed, many companies do not know exactly the quantities they have. There is a strong need to improve packaging management on the producer side.
• RTIs have to be sorted and counted by the goods recipient. This is done manually; pallets are sorted by pools based on the colour of the assets. The size of the pallets is identified visually.
• As far as plastic containers are concerned, the sorting is more complicated since there is another feature that is taken into account, the way the container is to be folded.
• The process is complex, with a lot of actors, all independent. In that context, it is critical to exchange information in the most fluid way. But, there is a lack of synchronisation of processes and data because RTIs are not always managed accurately because they are not considered high priority. It is also true that there is no individual identification of the RTIs that would otherwise enable easier communication. The loss rate is therefore difficult to control.
BRIDGE – Building Radio frequency IDentification solutions for the Global Environment
39/49
• Companies do know the value and costs of pallets. They are too cheap to retain attention but prove too expensive in the end!
• Due to the lack of agreement in the sector, plastic crates are not always universal and therefore cannot be mixed. The handling is more complex.
• Pooling is not adapted to cases when pallets are split in the course of transport since it is rather impossible to know where the RTI has been sent to.
• The pooling system requires to locate the RTIs in a very efficient way. There is a lack of visibility on the locations of RTIs.
• There is a need for fast communications.
6.1.2 Strengths
• The pallet system is a universal way of moving goods.
• The Pooling system is easier to manage for retailers because of the limited number of partners.
• The pooling system is an outsourcing of the RTI management thus allowing producers to focus on their core activities, production and marketing.
• By definition, pooled RTIs are re-used and do not add to the amount of items to recycle or destroy.
• The pooling system brings de facto standardisation of the crates.
• The Pooling system brings better quality to the RTIs since the RTIs are controlled and if needed repaired. Products are therefore better protected.
• The Pooling system brings de facto standardisation of material handling.
• The Pooling system allows the provision of RTIs with specified features such as dry or ultra dry RTIs.
6.2 Exchange model
6.2.1 Weaknesses
• Some actors of the supply chain keep the RTIs longer than needed.
• Hard discounters use RTIs to display units in the shops.
• It is difficult to control the quality of exchanged RTIs.
• The system is not properly balanced; it is difficult to get the right number of RTIs back. In some cases the preparation process does not allow to transmit the actual number before loading.
BRIDGE – Building Radio frequency IDentification solutions for the Global Environment
40/49
• This system is too much based on paper documents thus preventing accurate management and opening the door to losses.
• Unless each partner implements RTI management, the system cannot work. All partners are dependent.
6.2.2 Strengths
• This model is easy to implement, since there is no need to define contracts and it is a well-known system.
• This model is available to small companies.
• This model works in many sectors.

BRIDGE – Building Radio frequency IDentification solutions for the Global Environment
41/49
• Conclusion The first task of work package 9 forms the ground for the developments of requirements and solutions of the project since it defines its domain, objectives and context.
6.3 Domain Use of pallets and to some extent crates is a practice that is undoubtedly universal in the retail industry. Both the pooling and the exchange models are important. The Bridge project should address both models and provide solutions – probably different - to improve the management of RTIs in both processes. The food and beverage sectors are the key industries for the development of such tools. Some of the products will challenge the standards – especially beverages – but need to find a solution, due to their weight in terms of RTIs in the supply chain.
6.4 Objectives The system that will be defined in the project will be designed to provide visibility on the RTIs. In order to reach this objective, better identification, data capture and communication between the actors of the supply chain is required. The complexity of the processes, where many actors are involved, is a challenge that must be faced. Efficient and shared information systems associated with reliable data capture tools are the keys to such applications. In terms of company size, the survey shows that small companies are massively involved in the use of RTIs and that easy to implement and cheap solutions are necessary. Use of internet is of course a good enabler in that context.
6.5 Context As far as crates are concerned, the European Regulation (EC) N. 1935/ 2004 on material and articles in contact with food obliges companies to trace materials that are in contact with food. Crates and their constitutive materials fall in this category. The regulation is applicable by 26th October 2006. The need for traceability becomes more critical in that context. Work in the project will be conducted under the standard umbrella of the EPCglobal working groups and especially the RTI working group.
BRIDGE – Building Radio frequency IDentification solutions for the Global Environment
42/49
7 Glossary of terms RTI (ISO TC104 – Supply chain applications of RFID – Returnable Transport Item, ISO/CD 17364, ISO 2005, Page vi) “This standard defines the requirements for RFID tags for Reusable Transport Items (RTI). RTIs are defined as all means to assemble goods for transportation, storage, handling and product protection in the supply chain which are returned for further usage, including for example pallets with and without cash deposits as well as all forms of reusable crates, trays, boxes, roll pallets, barrels, trolleys, pallet collars and lids.” Unit load (ISO 15394, 4.2) One or more transport packages or other items held together by means such as pallets, slip sheet, strapping, interlocking, glue, shrink wrap, or net wrap, making them suitable for transport, stacking and storage as a unit.
BRIDGE – Building Radio frequency IDentification solutions for the Global Environment
43/49
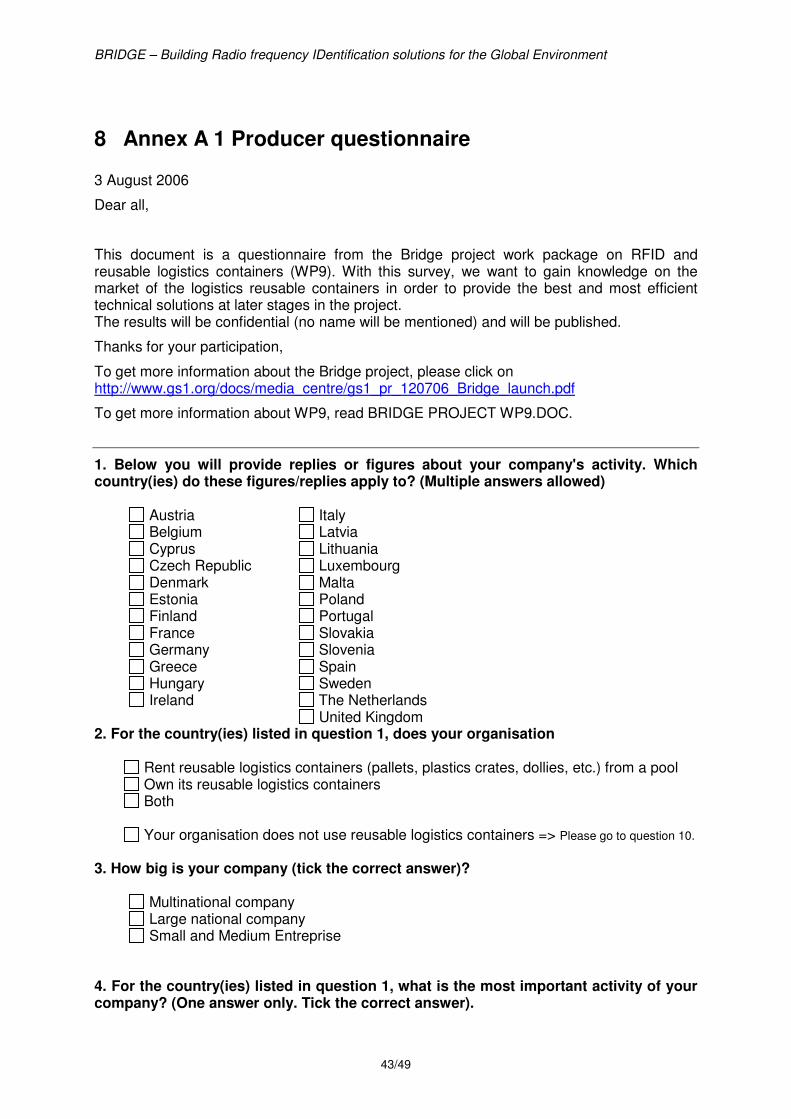
8 Annex A 1 Producer questionnaire 3 August 2006
Dear all,
This document is a questionnaire from the Bridge project work package on RFID and reusable logistics containers (WP9). With this survey, we want to gain knowledge on the market of the logistics reusable containers in order to provide the best and most efficient technical solutions at later stages in the project. The results will be confidential (no name will be mentioned) and will be published.
Thanks for your participation,
To get more information about the Bridge project, please click on http://www.gs1.org/docs/media_centre/gs1_pr_120706_Bridge_launch.pdf
To get more information about WP9, read BRIDGE PROJECT WP9.DOC.
1. Below you will provide replies or figures about your company's activity. Which country(ies) do these figures/replies apply to? (Multiple answers allowed)
Austria Italy Belgium Latvia Cyprus Lithuania Czech Republic Luxembourg Denmark Malta Estonia Poland Finland Portugal France Slovakia Germany Slovenia Greece Spain Hungary Sweden Ireland The Netherlands
United Kingdom 2. For the country(ies) listed in question 1, does your organisation
Rent reusable logistics containers (pallets, plastics crates, dollies, etc.) from a pool Own its reusable logistics containers Both
Your organisation does not use reusable logistics containers => Please go to question 10.
3. How big is your company (tick the correct answer)?
Multinational company Large national company Small and Medium Entreprise
4. For the country(ies) listed in question 1, what is the most important activity of your company? (One answer only. Tick the correct answer).
BRIDGE – Building Radio frequency IDentification solutions for the Global Environment
44/49
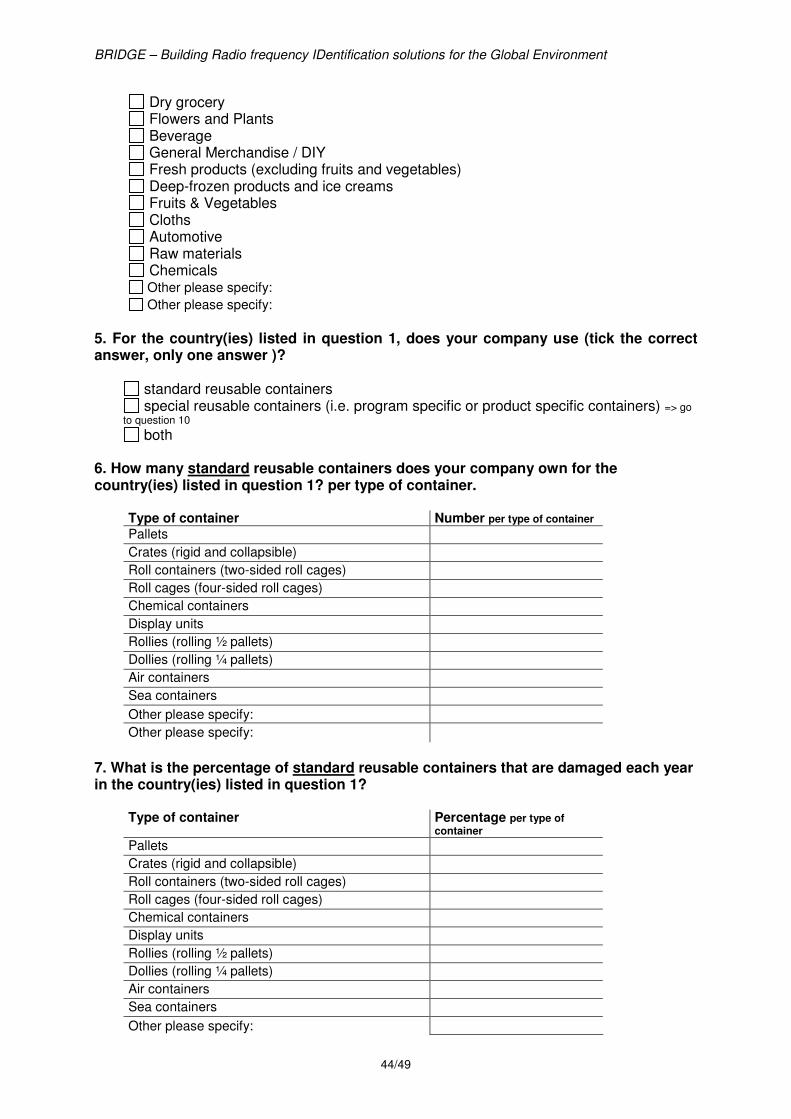
Dry grocery Flowers and Plants Beverage General Merchandise / DIY Fresh products (excluding fruits and vegetables) Deep-frozen products and ice creams Fruits & Vegetables Cloths Automotive Raw materials Chemicals Other please specify:
Other please specify:
5. For the country(ies) listed in question 1, does your company use (tick the correct answer, only one answer )?
standard reusable containers special reusable containers (i.e. program specific or product specific containers) => go
to question 10 both
6. How many standard reusable containers does your company own for the country(ies) listed in question 1? per type of container.
Type of container Number per type of container
Pallets
Crates (rigid and collapsible)
Roll containers (two-sided roll cages)
Roll cages (four-sided roll cages)
Chemical containers
Display units
Rollies (rolling ½ pallets)
Dollies (rolling ¼ pallets)
Air containers
Sea containers
Other please specify:
Other please specify:
7. What is the percentage of standard reusable containers that are damaged each year in the country(ies) listed in question 1?
Type of container Percentage per type of container
Pallets
Crates (rigid and collapsible)
Roll containers (two-sided roll cages)
Roll cages (four-sided roll cages)
Chemical containers
Display units
Rollies (rolling ½ pallets)
Dollies (rolling ¼ pallets)
Air containers
Sea containers
Other please specify:
BRIDGE – Building Radio frequency IDentification solutions for the Global Environment
45/49
Type of container Percentage per type of container
Other please specify:
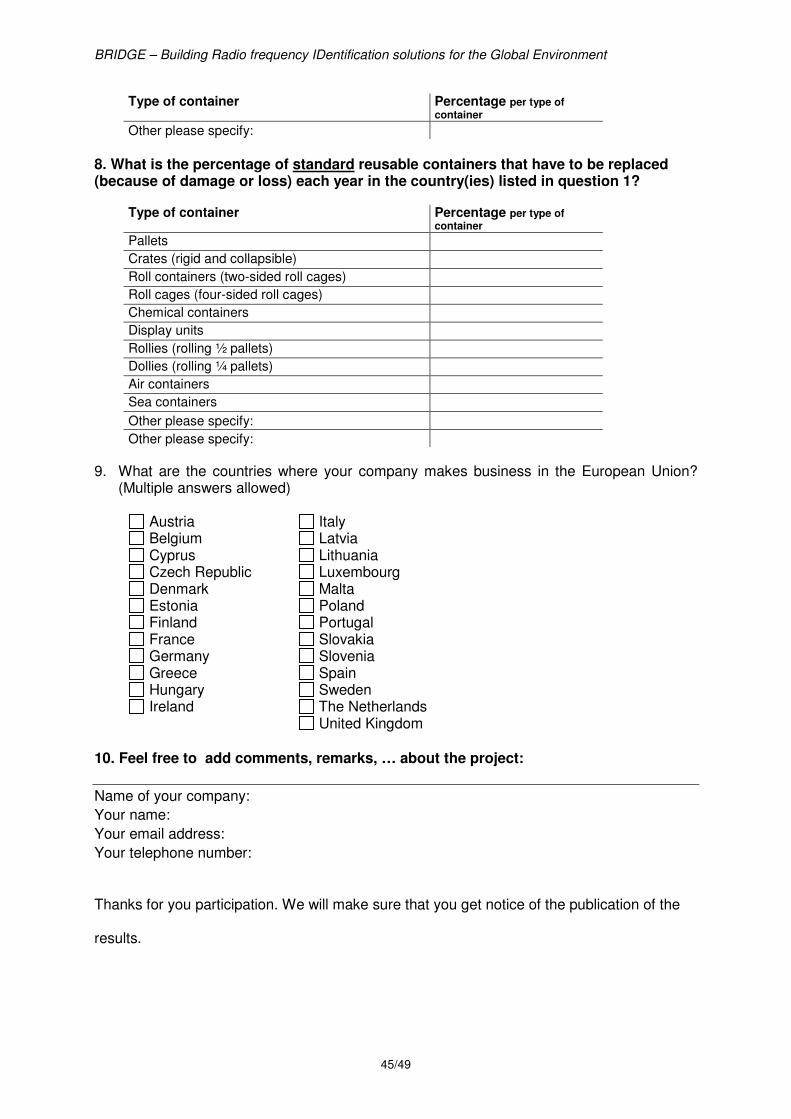
8. What is the percentage of standard reusable containers that have to be replaced (because of damage or loss) each year in the country(ies) listed in question 1?
Type of container Percentage per type of
container Pallets
Crates (rigid and collapsible)
Roll containers (two-sided roll cages)
Roll cages (four-sided roll cages)
Chemical containers
Display units
Rollies (rolling ½ pallets)
Dollies (rolling ¼ pallets)
Air containers
Sea containers
Other please specify:
Other please specify:
9. What are the countries where your company makes business in the European Union? (Multiple answers allowed)
Austria Italy Belgium Latvia Cyprus Lithuania Czech Republic Luxembourg Denmark Malta Estonia Poland Finland Portugal France Slovakia Germany Slovenia Greece Spain Hungary Sweden Ireland The Netherlands
United Kingdom
10. Feel free to add comments, remarks, … about the project:
Name of your company:
Your name:
Your email address:
Your telephone number:
Thanks for you participation. We will make sure that you get notice of the publication of the
results.
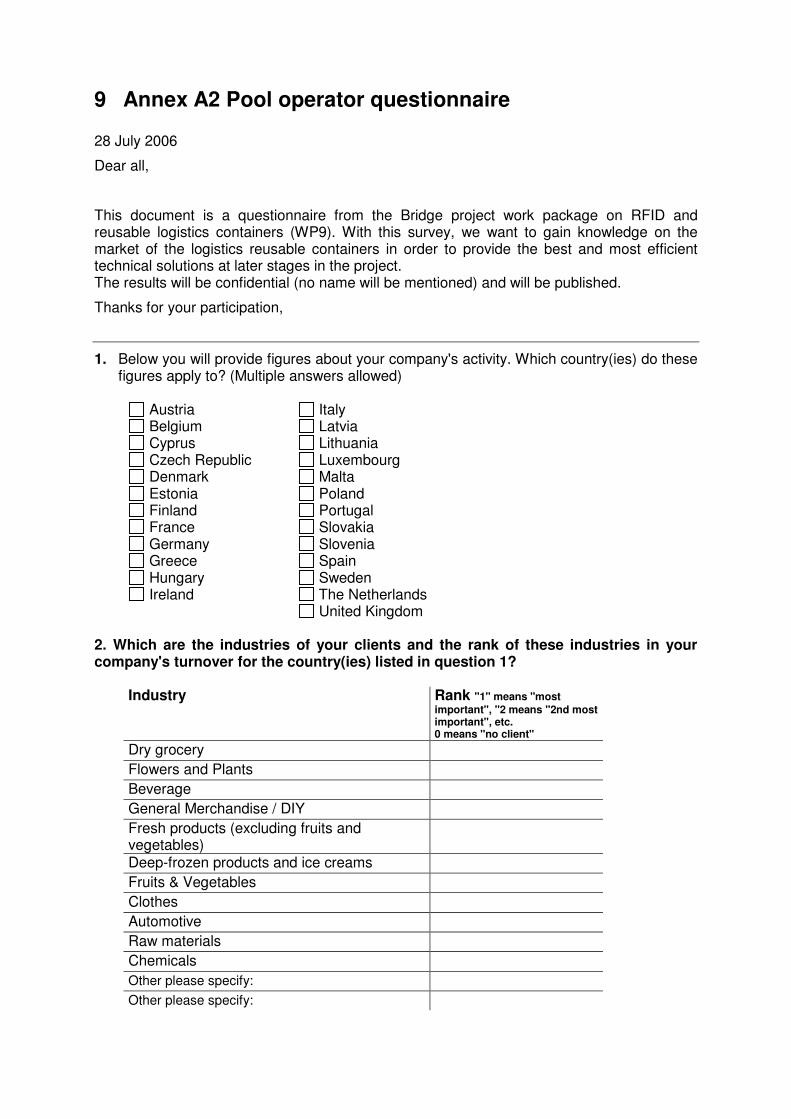
9 Annex A2 Pool operator questionnaire 28 July 2006
Dear all,
This document is a questionnaire from the Bridge project work package on RFID and reusable logistics containers (WP9). With this survey, we want to gain knowledge on the market of the logistics reusable containers in order to provide the best and most efficient technical solutions at later stages in the project. The results will be confidential (no name will be mentioned) and will be published.
Thanks for your participation,
1. Below you will provide figures about your company's activity. Which country(ies) do these figures apply to? (Multiple answers allowed)
Austria Italy Belgium Latvia Cyprus Lithuania Czech Republic Luxembourg Denmark Malta Estonia Poland Finland Portugal France Slovakia Germany Slovenia Greece Spain Hungary Sweden Ireland The Netherlands
United Kingdom 2. Which are the industries of your clients and the rank of these industries in your company's turnover for the country(ies) listed in question 1?
Industry Rank "1" means "most
important", "2 means "2nd most important", etc. 0 means "no client"
Dry grocery
Flowers and Plants
Beverage
General Merchandise / DIY
Fresh products (excluding fruits and vegetables)
Deep-frozen products and ice creams
Fruits & Vegetables
Clothes
Automotive
Raw materials
Chemicals
Other please specify:
Other please specify:
BRIDGE – Building Radio frequency IDentification solutions for the Global Environment
47/49
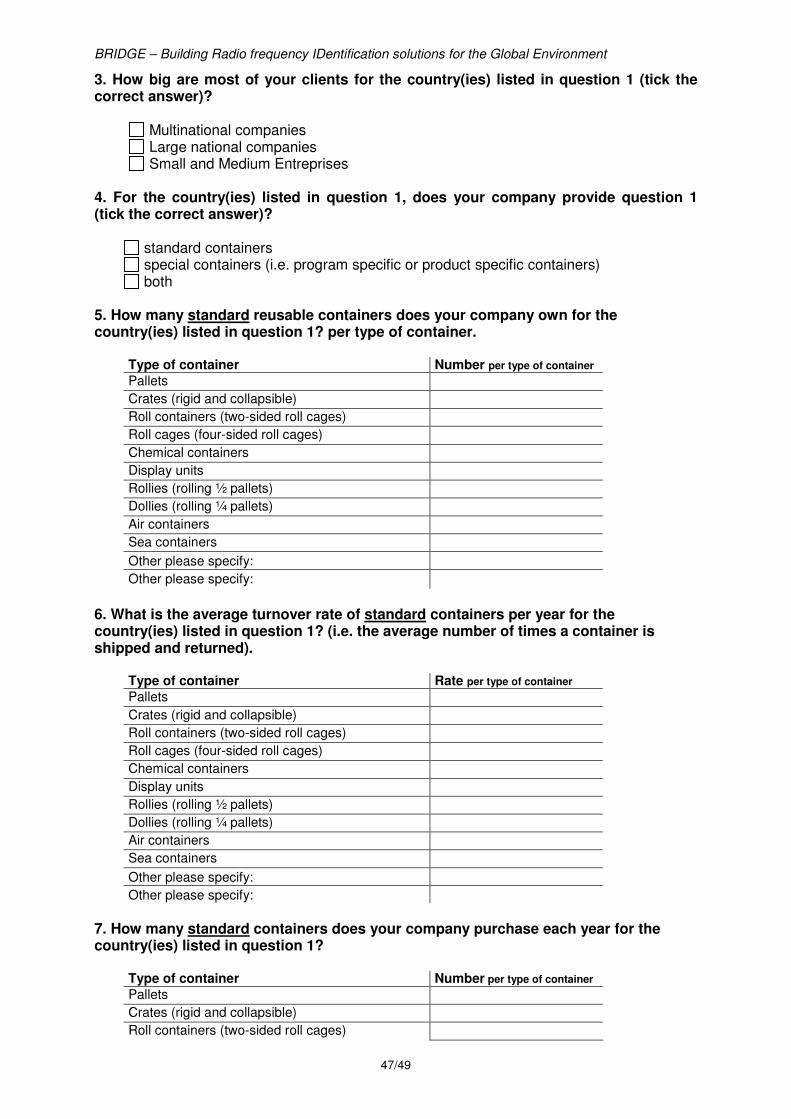
3. How big are most of your clients for the country(ies) listed in question 1 (tick the correct answer)?
Multinational companies Large national companies Small and Medium Entreprises
4. For the country(ies) listed in question 1, does your company provide question 1 (tick the correct answer)?
standard containers special containers (i.e. program specific or product specific containers) both
5. How many standard reusable containers does your company own for the country(ies) listed in question 1? per type of container.
Type of container Number per type of container
Pallets
Crates (rigid and collapsible)
Roll containers (two-sided roll cages)
Roll cages (four-sided roll cages)
Chemical containers
Display units
Rollies (rolling ½ pallets)
Dollies (rolling ¼ pallets)
Air containers
Sea containers
Other please specify:
Other please specify:
6. What is the average turnover rate of standard containers per year for the country(ies) listed in question 1? (i.e. the average number of times a container is shipped and returned).
Type of container Rate per type of container
Pallets
Crates (rigid and collapsible)
Roll containers (two-sided roll cages)
Roll cages (four-sided roll cages)
Chemical containers
Display units
Rollies (rolling ½ pallets)
Dollies (rolling ¼ pallets)
Air containers
Sea containers
Other please specify:
Other please specify:
7. How many standard containers does your company purchase each year for the country(ies) listed in question 1?
Type of container Number per type of container
Pallets
Crates (rigid and collapsible)
Roll containers (two-sided roll cages)
BRIDGE – Building Radio frequency IDentification solutions for the Global Environment
48/49
Roll cages (four-sided roll cages)
Chemical containers
Display units
Rollies (rolling ½ pallets)
Dollies (rolling ¼ pallets)
Air containers
Sea containers
Other please specify:
Other please specify:
8. What is the percentage of standard containers that are damaged each year in the country(ies) listed in question 1?
Type of container Percentage per type of container
Pallets
Crates (rigid and collapsible)
Roll containers (two-sided roll cages)
Roll cages (four-sided roll cages)
Chemical containers
Display units
Rollies (rolling ½ pallets)
Dollies (rolling ¼ pallets)
Air containers
Sea containers
Other please specify:
Other please specify:
9. What is the percentage of standard containers that have to be replaced (because of damage or loss) each year in the country(ies) listed in question 1?
Type of container Percentage per type of
container Pallets
Crates (rigid and collapsible)
Roll containers (two-sided roll cages)
Roll cages (four-sided roll cages)
Chemical containers
Display units
Rollies (rolling ½ pallets)
Dollies (rolling ¼ pallets)
Air containers
Sea containers
Other please specify:
Other please specify:
10. What are the countries where your company makes business in the European Union? (Multiple answers allowed)
Austria Italy Belgium Latvia Cyprus Lithuania Czech Republic Luxembourg Denmark Malta Estonia Poland Finland Portugal
BRIDGE – Building Radio frequency IDentification solutions for the Global Environment
49/49
France Slovakia Germany Slovenia Greece Spain Hungary Sweden Ireland The Netherlands
United Kingdom
11. Feel free to add comments, remarks, … about the project:
Name of your company:
Your name:
Your email address:
Your telephone number: