Embed Size (px)
Citation preview

1
A review of environmental impacts
REUSABLE VS SINGLE-USE PACKAGING
R EPOR T

ABSTRACT Waste and its mismanagement has become a significant global issue. Litter seems to be everywhere; it can be seen trapped along fences, scattered in the streets and along beaches and roadsides, where it pollutes water bodies, the oceans, our land and air. Traditional waste management focuses largely on recycling, which, although important and represents one segment of the life-cycle of materials and products, is clearly not a panacea for our waste problems. In recent years, there has been a push to focus on other circular economy strategies that could further avoid energy and resource consumption, such as reuse.
With the understanding that packaging alone represents 36% of municipal solid waste in Europe, this report focuses on how and when the reuse of packaging is a better alternative than single-use. This is done by analysing the results of life cycle assessments that compare the environmental impacts of single-use to reusable packaging alternatives.
The results demonstrate that the great majority of studies point to reusable packaging as the most environmentally friendly option. The report identifies the packaging types assessed by the various studies and what key aspects, such as the number of cycles or distances and break-even points, favour the environmental success of reusable packaging. It also discusses, in more detail, how specific packaging formats, such as bottles and crates, differ in impacts.
The report closes with a discussion about what needs to be improved to further increase the benefits of reuse systems and the important role of deposit return schemes (DRS), pooling systems, standardization, pricing accessibility to consumers and other measures could help to ensure the success of a reusable packaging system.
Keywords: Reusable packaging; single-use packaging; LCA; environmental impacts; standardisation; littering potential.

1
TABLE OF CONTENTS Acronym glossary……………………………………………………………………………………………………………………………..…...5
Technical terms…………………………………………………………………………………………………………………………………..…..6
1. Introduction………………….…………………………………………………………………………………………………………………...7
1.1. Waste: history and today.……………………………………………………………..……………………………………...7
1.2. Reuse over recycling…………………………………………………………………………………………….……………….8
1.3. Life Cycle Assessment (LCA)……………………………………………………………………………….……....……10
2. Research aim...………..………………………………………………………………………………………………………….…………..11
3. Methodology…….…….……………………………………………………………………………………………………………………...12
3.1. Selection of studies…………………………………………..………………………………………………………………...12
3.2. Search engines…………………………………………………………………………….……………………………………...12
3.3. First look at the studies…………………………………………………...…………….…………………………………..12
4. Results.…………………………………………...……………………………..……………………………………………………………….15
4.1. Studies selected…...………………………………………………………………..………………………………………….15
4.2. Methodological choices…...…………………………………………………………..…………………………………..15
4.2.1. System boundaries…...…………………………………………………………………...……………………...15
4.2.2. Sensitivity analysis…...…………………………………………………………….………………………….....16
4.2.3. Modelling recycling and recycling credit…...………………………………………………………..17
4.2.4. Impact categories.…...………………………………………………………………………………………….....19
4.2.5. Littering.…...…………………………………………….……………………………………………………………….19
4.2.6. Cost Study…...……………………………………………………………………….………………………………...20
4.2.7. General outcome of the analysis.…...………………………………………....……………………......21
Zero Waste Europe Reusable vs single-use packaging Reloop

2
4.3. Key parameters of effective reuse systems…...………………..……………………………………………..24
4.3.1. Transport…...…………………….………………………………………………………………………………...25
4.3.2. Production…...………………………………………………………………………………….…………….......29
4.3.3. Number of cycles (uses).....…...……………………………………………………………..…………..30
4.3.4. Recycled content, End-of-life and Recycling credits…………………………….……...33
4.3.5. Interaction between the key parameters and different packaging types and materials….…...………………………….……………………………………………………………………..…….36
4.3.6. Break-even points……………………………………….…………………………………………………….46
4.3.7. Most relevant life cycle stage of reusable packaging………………………,,,,………..47
5. Discussion…………………………………………………………………………….………………………………………………….……..50
5.1. Materials choice and production impacts…………………………………….……….………..……….……….50
5.2. Deposit Return Scheme (DRS)........................................................................................................51
5.2.1. Job creation………………………………………………………..……………………………………………………..52
5.3. Standardisation and pooling……………………………………………………………….……………………………..52
5.4. Consumer……………………………………………….…………………………………………………………………………….54
5.4.1. Clear communication.…...………………………………………..……………………………………………….55
5.4.2. Price and discount/reward systems…………………………………………………...………………….55
5.4.3. Accessibility to consumers……………………………………………………………………..……………...56
5.5. LCA limitations…...………………………………………………………………………………………….…………..……….56
5.5.1. Littering and waste generation……………………………………………………………………………...56
5.5.2. Recyclability.…...………………………………………………………………………………………………..…..….58
5.5.3. Resource depletion.…...…………………………………………………………………………..…………….....59
5.6. Global warming potential and other impact categories…...…………………..……………………....59
Zero Waste Europe Reusable vs single-use packaging Reloop

3
5.7. Future trends…...…………………………………………………………………………………….…………………...……….61
5.7.1. E-commerce.…...……………………………………………………………………………………..…...……………61
5.7.2. Scaling up.…...…………………………………………………………..………………………………...…………….61
5.7.3. Standardisation across Europe…...…………………………………………………………...…………….61
5.7.4. Policy.…...………………………………………………………………………………………………..………..……….62
5.7.5. Decarbonisation of transport and electricity.…...………………………..………..………………62
6. Limitations.…...…………………………………………………………………………………………………………………..……………63
7. Conclusions.…...………………………………………………………………………...………………………………………..………….64
8. Further research…...……………………………………………………………………………………………………………….………66
8.1. Cost….…...……………………………………………………………………………………………………………………….………..66
9. Studies considered and excluded in this report.…...………………………………………………………….……….67
References.…...……………………………………………………………………………………………………………………………….……..71
Zero Waste Europe Reusable vs single-use packaging Reloop

4
ACRONYM GLOSSARY
Zero Waste Europe Reusable vs single-use packaging Reloop
AC
ADP
AP
B2B
B2C
CSU
EP
GWP
HDPE
LDPE
LSU
ODP
PET
POCP
PP
RAD
RFG
RP
SU or SUP
Aseptic Carton
Abiotic Depletion Potential
Acidification Potential
Business-to-Business
Business-to-Consumer
Conventional Single-Use
Eutrophication Potential
Global Warming Potential
High-Density Polyethylene
Low-Density Polyethylene
Lightweight Single-Use
Ozone Layer Depletion
Polyethylene Terephthalate
Photochemical Ozone Creation
Polypropylene
Radioactive Radiation
Refillable Glass
Reusable Packaging
Single-Use, Single-Use Packaging

5
TECHNICAL TERMS Reusable Packaging: Refers to packaging that has been conceived, designed and placed on the market to accomplish within its life cycle multiple trips or rotations by being refilled or reused for the same purpose for which it was conceived (DIRECTIVE (EU) 2018/852).
Reusable Packaging Cycles: The number of times a reusable packaging is used throughout its lifetime is referred to as “cycles”.
Emissions, CO2 emissions and Global Warming Potential (GWP): In this report, environmental impacts are also referred to as emissions or CO2 emissions. This is because Global Warming Potential is used as the main impact indicator since it allows the conversion of any greenhouse gas emissions (responsible for global warming) into CO2 equivalent emissions.
Recycled content: Recycled content refers to the percentage of recycled post-consumer waste used in the production of certain packaging. For e.g. glass bottles are usually produced partly from virgin material, and partly from recycled glass. If a glass bottle has 35% recycled content, it means that it was produced from 65% virgin glass and 35% recycled glass.
Recycling Credit: The recycling of products provides environmental benefits since instead of just disposing of waste, we are generating a valuable recycled material that will avoid the need for virgin material. These benefits are referred to as “recycling credits” and can be attributed to the product being recycled, or/and the product using the recycled material.
Backhaul: Refers to the return trip(s), or in other words, the transport of the packaging after being used, back to retailer and/or producer which will make possible that the packaging is cleaned and reinserted in the production line to be reused.
Zero Waste Europe Reusable vs single-use packaging Reloop

6
1. INTRODUCTION
1.1 Waste: history and today The years following World War II are often remembered as a period of rapid economic growth. This increase in economic activity resulted in a corresponding increase in the amounts of waste generated, causing landfills to overflow and creating environmental and health problems such as pollution of air, soil and groundwater. The post-war years marked the beginning of traditional waste management approaches, as countries began to implement regulations on waste and waste treatment. Historically, the majority of household waste consisted of organic food waste, since most packaging was designed to be reusable. With the Second World War came a fast development in new types of packaging aimed at extending the shelf-life of foods in order to reduce food waste, which was particularly important at a time when food shortages were an issue [1], [2]. Later, Rates of production and consumption at a global level have gone far beyond the Earth’s capacity to replenish itself. With the liberalisation of trade and each sector of industry continuously setting annual targets for growth, national and international markets are flooded with products and packaging that most countries are ill-equipped to deal with. With that, packaged products became the norm. Nowadays, store shelves display an endless array of products and packaging types, and as competition rises, marketing also comes into play, resulting in an even greater diversity of not only labels but also packaging design features such as shapes and sizes. What these packaging types do have in common is that almost all of them are designed to be single-use. The structure of our supply chains has also changed. Due to raw material requirements, labour costs and tax incentives, the design and manufacturing of products involving actors and materials across international supply chains has become customary [3]. Raw materials are extracted in one country only to be produced and sold in a different one. These new realities, coupled with increased globalisation and rising consumption, are taking a toll on the Earth’s capacity to regenerate the resources we consume and absorb the impacts of their extraction and use. Today in Europe, packaging alone represents 36% of municipal solid waste. While countries around the world continue to struggle with waste management issues and resources continue Zero Waste Europe Reusable vs single-use packaging Reloop

7
being depleted at a rate faster than they can be regenerated, the global economy loses about $80-120 billion in packaging that could be reused or recycled [4].
1.2. Reuse over recycling With increasing concerns regarding environmental impacts, development and uptake of the 3Rs (Reduce, Reuse, Recycle) approach started around the 1980s in Europe, and internationally in the 1990s, as a way to prioritise waste management strategies and reduce resource extraction and energy use [3]. Over time, the 3Rs concept has evolved into what some researchers now call the 9Rs [5], which includes other circular strategies such as Refuse, Rethink, Repair, and Remanufacture, amongst others. The strategies are displayed in Figure 1.
Figure 1: The 9Rs showing circular strategies in order of priority. Source: [6].
Zero Waste Europe Reusable vs single-use packaging Reloop

8
As shown in Figure 1, the idea behind the 3Rs or 9Rs is to prioritise reuse over recycling to avoid unnecessary energy use and resource extraction. Despite this, the main focus of waste management strategies and private- and public sector activity continues to be recycling. But current programs are not working very well, and the volume of packaging that is being recycled is far too low, particularly in the plastic sector. While collection rates seem to be high, these do not account for what is actually being recycled (Figure 2)[7]. In Europe, in 2013, only 10% of plastic packaging was recycled, and only a small portion of that (2% of all plastic packaging) was recycled in a closed-loop, with remainder being downcycled [4]. These problems, along with increased consumer awareness around plastic pollution on beaches and in oceans, have led to a gradual increase in a focus on reuse.
Figure 2: Global flows of plastic packaging materials in 2013. Source: [4]
When compared to recycling or the manufacturing of new products or packaging from virgin materials, reuse avoids resource extraction, reduces energy use, reduces waste generation, and can prevent littering. By changing the way in which consumers think about the use of natural resources and how they relate to the products they buy, reuse can incentivise a shift toward more conscious consumption, and also encourage companies to produce more durable and long-lasting products that can endure as many cycles as possible. Recycling should be seen as the last defence against disposal, only when other circular economy strategies (i.e. reuse, repurposing, remanufacturing, etc.) to manage the products (or Zero Waste Europe Reusable vs single-use packaging Reloop

9
parts of it) are not feasible. At the same time, it’s important to acknowledge that focusing more attention on reuse does not diminish the importance of recycling. On the contrary, the use of recycled materials in reusable products can further reduce their impacts.
1.3. Life Cycle Assessment (LCA) Even though the 3Rs approach prioritises reuse over recycling, reusable packaging might not always have the lowest environmental impact compared to single-use packaging, depending on various factors (i.e. transport distance, etc.). Despite its limitations (highlighted in sections 5.5), Life Cycle Assessment (LCA) is a tool used to measure the environmental impacts of a product’s life cycle. Since its creation in the 1960s, different standards and guidelines for LCA application have been created, such as ISO 14040-14044 or the ILCD (International Reference Life Cycle Data System) guidelines [8]. Aside from being widely used in the scientific community as a modelling technique, LCAs have also been used by private companies looking to assess the environmental impacts of their products and also by governments seeking to improve their policy and action strategies.
Zero Waste Europe Reusable vs single-use packaging Reloop

10
2. RESEARCH AIM
The main goal of this research is to compare the environmental impacts of reusable and single-use packaging and analyse under which conditions reusable packaging is the most environmentally friendly option. To achieve these goals, the following steps were taken:
1. Analyse which types of packaging are being studied in the LCA literature;
2. Analyse the environmental impacts of single-use packaging against reusable alternative(s) for the same application;
3. Verify which studies point to reusable packaging as having the lowest environmental impact compared to single-use packaging;
4. Identify the key parameter(s) that makes:
a. A reusable packaging environmentally preferable;
b. A single-use packaging environmentally preferable. In cases where a single-use packaging was determined to be the most environmentally friendly option, verify if the sensitivity analysis showed changes that would make reusable packaging the preferred option;
5. Highlight the importance of well-performed LCAs in the decision-making processes of private companies and governments;
6. Indicate areas for future research. For objective IV(b), changes in the products’ life cycle that might favour reusable packaging over single-use ones, could be, for example, the number of reuses (also referred to as cycles, which indicates how many times a reusable packaging can be reused) or transportation distances.
Zero Waste Europe Reusable vs single-use packaging Reloop

11
3. METHODOLOGY 3.1. Selection of studies For this review, international studies including scientific papers and technical reports were searched based on the following criteria:
● The study provides an environmental impact comparison between reusable and single-use packaging alternatives aimed for the same application;
● The study follows the LCA methodology according to ISO 14040- 14044 standards;
● The study was published after the year 2000. This was chosen as a criterion since production, transport, design and other factors affecting efficiency might have greatly changed over the years, which could alter the outcome of the research.
3.2. Search engines Studies were found using web-based search engines such as Google Scholar, Academia.edu, Scopus.com and Springer.com by looking for “reusable packaging, “refillable packaging”, “LCA”, “packaging”, “reuse”, “reusable”, “refill”, “refillable”.
3.3. First look at the studies The literature search yielded 32 research articles and reports that met the study criteria. These articles were organized into two categories—B2B (Business-to-Business) and B2C (Business-to-Consumer)—since there are fundamental differences in the life cycles of both systems. Also, the packaging types analysed were characterised according to the Packaging Classification (Table 1) [9]. This division was done for different reasons:
● To identify which reusable packaging types are being studied the most by international academies and how this is being done;
Zero Waste Europe Reusable vs single-use packaging Reloop

12
● To understand the environmental impacts depending on the type of packaging used.
It is important to highlight that even though B2B and B2C are two different types of commercial transactions, for this analysis it is not considered in terms of monetary transaction but in terms of responsibility towards the packaging. For example, when a beer is sold at a bar to a consumer who will drink it while in the establishment, is considered as B2B, as the beer packaging remains in the bar’s possession. It is, therefore, the bar’s responsibility to return the packaging to the brewery so that it can be reused. On the other hand, if the beer bottle is taken by the consumer outside of an establishment, it becomes the consumer’s responsibility to return the packaging to a collection point or retailer for it to be reused.
Zero Waste Europe Reusable vs single-use packaging Reloop
Type of Packaging Packaging Description Product Examples
Refillable by Bulk Dispenser
Container, bottle, cup. Customers use their own reusable packaging or the branded refillable packaging provided in-store or at a mobile truck thereby avoiding the need to produce new packaging.
Cereals, grains, candy, wine, juice, mineral water, beer, olive oil, vinegar, detergent, soap, hair care products, perfume, body and face lotion
Parent Packaging Refill
Bottle, container, pouch, pod, tablet, powder. The refill packaging is made with less material than the parent packaging. Parent packaging can be refilled by:
● Pouring product inside parent packaging;
● Placing container inside of parent packaging;
● Diluting concentrated product in water inside parent packaging.
Makeup, dental floss, tooth and mouthwash tabs, deodorant, perfume, cosmetics, cleaning products, hair care products, flavoured water
Returnable Packaging Container, bottle, cup, plate, bowl Customers return empty packaging that will be cleaned and refilled for future use by the retailer/producer (can be combined with a deposit system to provide a financial incentive).
Beer, soft drinks, mineral water, perishables, detergent, soap, cosmetics, hair care products Reusable cups, containers, plates (for events, cafes, restaurants)

13
Table 1: Packaging Classification according to [9].
This packaging classification can be further divided into two groups that give continuity to reusable systems: “Reused by Consumer” and “Taken back by Business”. The first two classifications, “Zero Waste” and “Parent Packaging Refill”, fall under the Reused by Consumer category and depend only on the consumer to continue to be reused. It is the consumer’s decision to repurchase a zero-waste product, to refill at a dispenser unit or to choose a product with less packaging. The two last classifications, “Returnable” and “Transit,” fall under the Taken back by Business category and depend entirely on the involvement of the company, and require the implementation of a take-back business model that allows the packaging to be cleaned, maintained and reinserted in the production line. It is important to highlight that this division of Reused by Consumer and Taken back by Business is not analogous to Business-to-Consumer and Business-to-Business, rather, it indicates whether or not the business model has a take-back mechanism in place. Packaging options in Reused by Consumer tend to be easier to implement since they do not require a take-back mechanism or infrastructure such as cleaning and storage to be implemented. For packaging options that fall under the Taken back by Business category, this is not the case. Return logistics and some production-line steps such as cleaning, maintenance and storage are usually necessary to facilitate the reuse of packaging. Furthermore, in Taken back by Business, it is easier to understand that the relationships can be either B2B (e.g. crate and pallets between companies) or B2C (e.g. personal care from business to consumer). Companies could also work B2B and B2C when, for example, they supply reusable packaging for clothes to be sent from storage to store and back (B2B) or storage to consumer and back (B2C).
Zero Waste Europe Reusable vs single-use packaging Reloop
Transit Packaging Boxes, containers, soft packages. Customers receive the product in reusable packaging, which is returned by door delivery/pick up, or through the post office. Crates, pallets, wrappers Customer reuses packaging multiple times before being returned to the producer or disposed of.
Reusable packaging for transport or shipping of perishables or non-perishables. B2C: for moving home or office location or e-commerce delivery of apparel, furniture or perishables B2B: transport from producer-warehouse-store

14
4. RESULTS The results of the literature review and analysis are divided into two main groups of findings: Methodological Choices and Key Parameters. The first set of findings examines how the methodologies and assumptions underlying a LCA study on packaging can influence the results, giving some examples from the studies selected. The second elaborates on which factors/parameters have the most influence on whether a reusable packaging is deemed more environmentally friendly than a single-use packaging and how they are addressed by some of the studies reviewed.
4.1. Studies selected The studies included in this review, according to the criteria selection presented in section 3.1, are displayed in Table 4. The table presents the article, the market (B2B or B2C), the packaging classification, the packaging type and the general outcome, which was classified into: positive, negative or a mixed depending on the environmental impact.
4.2. Methodological choices The outcomes of LCA studies can be deeply influenced by the methodological choices and assumptions made during the scope phase of a study. This section summarizes the most common methodologies used by the reviewed studies and discusses their potential impacts on the results.
4.2.1. System boundaries
The system boundaries determine which activities and/or processes in a product’s life cycle are considered in the LCA study. For example, they can start at the extraction of raw materials needed to produce a packaging, like when oil is taken from the ground, and end with the disposal of the packaging after it has been used by the consumer. In many of the papers reviewed for this study, the life cycle was divided into three main stages: production, service life and disposal. This division makes it possible to analyse which stage of the life cycle is most impactful: its production process, its service life (including the number of uses, transport,
Zero Waste Europe Reusable vs single-use packaging Reloop

15
washing and other emissions), or its end-of-life (disposal emissions). Depending on how they are defined, system boundaries can deeply impact a study’s results. In general, the more comprehensive the system’s boundaries are, the more accurate the results of the study can be. It is important to highlight, however, that the opposite does not necessarily apply. In other words, a LCA that considers only a few stages of the life cycle (e.g. production or waste management) is not necessarily a low-quality study. If the study is well done, using, for example, primary data from the processes involved, it can lead to reliable and relevant results for the analysed life cycle stages. In packaging LCAs, it is common to see that the service life is excluded from the system boundaries due to uncertainties regarding consumer behaviour. These uncertainties can be related to the number of times consumers use the packaging before returning it, and especially how/if the packaging is washed by the consumer (hand-wash or by dishwasher). Many studies point to the necessity of investigating the service life, which leads to changes in the final impact. 4.2.2. Sensitivity analysis Sensitivity analysis is commonly used in LCAs to evaluate how the final environmental impact would change if certain input parameters – particularly those about which there may be uncertainty or for which a range of values may exist – were different. In terms of packaging LCAs, the parameters that are most commonly the focus of sensitivity analyses are the number of cycles, the percentage of recycled content in the reusable and single-use packaging, the disposal method (recycling, incineration or landfill) and the distance travelled. These were identified as key factors impacting the sustainability of reusable packaging and are, therefore, further explained in section 4.3. Some articles emphasize how the results of a study can change depending on the percentage of recycled content used in the packaging’s production. For instance, a study analysing the impact of single-use and reusable bottles for carbonated soft drinks highlights that if a PET bottle has 40%-60% recycled content, its emissions would be reduced by 32%-48% compared to one produced from virgin material [10].
Zero Waste Europe Reusable vs single-use packaging Reloop

16
4.2.3. Modelling recycling and recycling credit
In LCA methodology, waste management strategies like reusing, recycling and energy recovery are multifunctional systems, which fulfil the dual functions of: 1) waste management, and 2) production of a secondary material or recovered energy. Deciding which environmental impacts to assign to different functions brings up several allocation problems. While the first function of recycling corresponds to the end-of-life of the analysed product system (e.g. a single-use cup), the second function corresponds to the beginning of another product system (e.g. a single-use bottle with recycled content). The way in which the impacts and benefits of recycling should be allocated to the first life cycle (the cup) and the second (the bottle) is not currently set by an ISO standard, and different approaches can be found in the literature. These can be classified into three categories (Figure 3):
1. The substitution or avoided burden approach: In this method, the first step in the life cycle (e.g. the single-use cup) gets the credits of providing material for the second cycle (e.g. the single-use bottle with recycled content), and therefore, the benefits of recycling are fully allocated to the first life cycle and not to the second. This is typically done by subtracting the impacts of producing a virgin material equivalent to the secondary material.
2. The “allocation” or 50/50 approach: The credits or benefits from recycling are shared between the first and second steps of the packaging’s life cycle. This is the approach chosen by the PEF (Product Environmental Footprint) guide from the European Commission.
3. The cut-off approach: The first step in the life cycle (e.g. the single-use cup) does not get any credit for the recycling activity, and it is assumed that the second step in the life cycle (e.g. the single-use bottle with recycled content) incorporates material free of environmental impacts but includes the impacts from the recycling process. This is commonly referred to as the cut-off approach.
Zero Waste Europe Reusable vs single-use packaging Reloop

17
Figure 3: Common approaches to allocate impacts and credits in LCA between first and subsequent cycles. Adapted from [8].
When the second product follows the same production route as the first one (e.g. it is recycled into the same application), this is considered a Closed-loop recycling system. Closed-loop recycling systems, like reuse systems, avoid the need to extract and use virgin materials, and consequently, their emissions. As per the avoided burden approach, closed-loop systems don’t require an allocation of credits between life cycle stages since the first and the second product are essentially the same. However, in an Open-loop system where the two product systems are different (e.g. a plastic cup that is incinerated, producing energy in the process), one must decide how to allocate recycling credits, and the choice of which approach to use is less clear. The decision of which allocation method to use can have an important influence on the study’s results since the credits from recycling or recovering can be big enough to compensate the emissions from producing the raw materials. When comparing single-use with reusable
Zero Waste Europe Reusable vs single-use packaging Reloop

18
packaging materials, it is important that both packaging alternatives follow the same multifunctionality approach, and that the recycling process considers emissions during recycling, downcycling quality losses and material losses. Otherwise, the application of the avoided burden approach could lead to the same benefits for recycling and reusing, when in fact, reuse activities generally produce no emissions (except for those related to washing and transport), and no significant material or quality losses. The most common approach applied by the reviewed studies is the avoided burden method. At least 63% of the reviewed studies modelled the Open-Loop recycling and recovery activities by giving the credits to the product being recycled at the end-of-life. However, only a few of them mentioned the inclusion of downcycling quality factors and material losses during the recycling process. This is a common practice in LCA studies [11] and leads to an overestimation of benefits from recycling. Two studies (4%) applied the cut-off approach, claiming that the impacts and benefits of recycling correspond to the product using the recycled material. One study applied a 50/50 approach (in combination with other approaches for different types of materials). For the rest of the studies, it was unclear how the recycling processes were modelled.
4.2.4. Impact categories Like system boundaries, the choice of impact categories to communicate when carrying out an LCA study can greatly influence its outcome. A complete selection of impact categories will result in a wider understanding of the impacts of both types of packaging systems (reusable or single-use). However, including fewer impact categories does not necessarily result in an untrustworthy study; it simply means that the study will show the outcome from that system under the impact categories chosen. That is why the choice of impact categories was not a criterion for the selection of studies in this review. More importantly, to better understand the results retrieved from the studies, it is crucial to analyse which considerations were made and where the data was retrieved from. 4.2.5. Littering Unfortunately, the impact of littering is not yet part of LCA methodology, and is rarely included [12], [13]. Experts in the field regard this as a major flaw in the LCA method, which is still being developed. This blind spot in LCA studies can result in an underestimation of the
Zero Waste Europe Reusable vs single-use packaging Reloop

19
advantages of reusable over single-use packaging, since it is the latter that contributes most to the worldwide issues of littering and plastic pollution yet is left out of the analysis. Littering and waste generation are further discussed in section 5.5.
4.2.6. Cost Study Another factor that is often not addressed by LCAs are economic costs. Out of the 32 articles reviewed for this study, only five presented an analysis of costs. Again, some authors point out this blind spot as a limitation of LCA studies [14], as it fact hinders the implementation of reusable packaging systems, especially because the initial investment required of companies to shift from single-use to reusable systems is a great barrier, as single-use products are often cheaper than reusable ones (e.g. no costs for washing, return logistics, etc.). In the same way, the long-term costs savings realized by businesses that do implement reusable systems are ignored. Of the five papers that performed a cost analysis, all were focused on transit packaging (Figure 4), and four of them analysed single-use cardboard and/or wooden boxes vs. reusable plastic packaging. Most of the studies found that reusable packaging had a negative outcome in terms of cost analysis. Nevertheless, financial costs should be further analysed in LCAs to understand which variables would make reusable packaging economically feasible over single-use.
Figure 4: Results of papers that included a cost analysis divided by the packaging classification.
Zero Waste Europe Reusable vs single-use packaging Reloop

20
4.2.7. General outcome of the analysis Before presenting the key parameters that have the most influence on the environmental performance of reusable and single-use packaging systems, a general overview of the reviewed studies is given below. The literature search yielded a total of 32 papers after all selection criteria were applied. These were classified according to the packaging classification [9], as shown in Figure 5 and then further subdivided into B2B and B2C (Figure 6). Most of the studies selected were LCAs on returnable (13 papers) and transit packaging (15 papers). Only five papers referred to zero-waste packaging, and none investigating the impact of refill parent packaging were selected as they did not meet the selection criteria.
Figure 5: Studies that passed the selection criteria divided according to the packaging classification from [9] .
Zero Waste Europe Reusable vs single-use packaging Reloop

21
Figure 6: Studies that passed the selection criteria divided according to the packaging classification from [9] divided into Business-to-Business and Business-to-Consumer.
In terms of the types of packaging analysed (shown in Figure 7), the majority of studies reviewed focused on bottles (eight studies), followed by crates (eight studies) and cups (four studies). For the other studies, four studies analysed general transit packaging (one for the transport of refrigerators, one for cold chain logistics, and two for the transport of car parts), two analysed food takeaway containers, and the rest analysed one of the following: buckets, bulk dispensers, carrier bags, drums, jars and beer kegs.
Figure 7: Papers selected divided by the types of packaging analysed.
Of the papers analysed (Figure 8 and Figure 9), 23 out of 32 (72%) indicated better environmental performance for the reusable packaging than for its single-use alternative. It is
Zero Waste Europe Reusable vs single-use packaging Reloop

22
interesting to note that the same packaging classification had positive, mixed and negative results, which means its result cannot be assumed depending on its application. Each case is specific and should be carefully analysed.
Figure 8: Results of the analysed studies separated into Positive (in favour of the Reusable Packaging), Negative (in favour of the single-use packaging) and Mix (partially reusable and partially single-use.
Figure 9: Same results from Figure 8 shown in percentage of positives, negatives and mix of reusable and single-use packaging. Zero Waste Europe Reusable vs single-use packaging Reloop

23
4.3. Key parameters of effective reuse systems As aforementioned, this research aims to compare the environmental impacts of reusable and single-use packaging and analyse under which conditions (hereafter referred to as ‘parameters’) reusable packaging is the most environmentally friendly option.
In order to analyse the key parameters, the Global Warming Potential (GWP) of the packaging was used as the base indicator of environmental impacts. GWP allows the conversion of greenhouse gas (GHG) emissions (responsible for global warming) into CO2 equivalent, and is widely referred to in impact studies. In all papers analysed, only one of them does not present their results in GWP or CO2 equivalent. This makes it possible to analyse and compare the results of all studies using a common unit. However, it’s worth noting that GWP does not cover impacts regarding ecotoxicity and human toxicity [15]. For this reason, an overview of other impact categories addressed by the papers selected is presented in section 5.6.
Of the main three stages of a product’s life cycle — production, service life (or use phase), and disposal—the most impactful in terms of GWP is usually different for single-use and reusable packaging. While for single-use packaging it is typically the production phase that is the most intensive in terms of GHG emissions, for reusable packaging it is the use phase that tends to generate higher emissions, mainly due to transportation. This is because:
● Reusable packaging demands return logistics, while single-use requires only one-way transport;
● The impacts of associated with the production phase are evenly distributed through the service life of the reusable packaging (across the various reuse cycles), while impacts related to transport are presented in every cycle (reuse) of the reusable packaging; and
● Reusable packaging tends to be heavier than single-use packaging which further increases the transportation impacts.
This is exemplified in study [13], in which the impacts of single-use cardboard boxes and reusable plastic crates were analysed by life cycle stage (Figure 10).
Zero Waste Europe Reusable vs single-use packaging Reloop

24
Figure 10: Emissions by life cycle stage of plastic crates and cardboard boxes. Source [13].
4.3.1. Transport Transport was found to be a key parameter influencing the environmental performance of reusable packaging systems compared to single-use. The impacts of transportation are influenced by three interconnected parameters:
● Transport distances and backhauling;
● Packaging design (weight and volume); and
● Mode of transport.
Transport distance can play a key role in determining the environmental benefit of a reusable packaging system. Most of the studies analysed that showed negative results for reusable packaging generally point to distances as the main reason. This was explored by a study [16], which analysed the impact of different travel distances on GWP, and found out that reusable packaging had lower environmental impacts compared to single-use for distances lower than 1200km as seen on Figure 12.
Zero Waste Europe Reusable vs single-use packaging Reloop

25
Figure 11: Variation of the impact in kg CO2 eq. depending on the distance travelled by the packaging. Adapted from [16].
Study [17] performed sensitivity analyses for a few different parameters including bottle weight and average return rate, but the parameter that affected the results the most was found to be the distances travelled. The study found that when a transport distance of 200km between the bottling plant and the local distributor was applied, the reusable bottles had a lower impact than single-use bottles after only two uses. However, if this distance is increased to 400km, reusable bottles must be reused at least 4 times in order to have the same impact as single-use bottles, and if the distance is further increased to 800km or more, not even 30 reuse cycles would make reusable packaging the environmentally preferable option.
In some cases, transport distances were not so relevant. One study performed a sensitivity analysis to examine the impact of different transport distances between manufacturer and retailer [10]. The results showed that increasing the distance from 10km to 200km only increased GWP by 2.3%.
The distance can be also less significant if the mode of transport is altered. For example, one trip across the United States (U.S.) by truck can result in a negative outcome for reusables while transport from the US to Europe by ship may result in a positive outcome. This is related to the type of fuel used and the energy efficiency per tone-km. A great portion of road freight transport is diesel, which has lower CO2 emissions compared to gasoline, but results in higher particulate matter and nitrogen oxides [18]. In terms of GWP, rail and water transport are less impactful than road transport for being more energy-efficient per tone-km. In fact, water transport can be four to five times less impactful than road, while air transport has the
Zero Waste Europe Reusable vs single-use packaging Reloop

26
highest emissions [18]. Emissions per transport mode are displayed in Figure 12.
Figure 12: CO2 intensity of freight transport modes. Airfreight, Vans, Heavy Goods Vehicle(HGVs), Inland waterways, Coastal shipping, Rail and Pipeline. Adapted from [19].
For electric vehicles, the emissions depend on where the electricity was generated since the carbon-intensity of electricity generation varies by geographic location. For example, some countries rely heavily on renewable energy while others rely more on fossil fuel-based energy sources. An electric vehicle that gets its power from a region that relies primarily on renewable energy will obviously have lower environmental impacts related to transport than one whose power comes primarily from a coal plant.
Examples of how the mode of transport can impact the results of transportation emissions were analysed in a study [20] (Figure 13). The authors evaluated the impact of different modes of transport for specific phases of the life cycle in question. In the specific study, it was found that transportation by rail or ship could drastically reduce emissions for transport distances longer than 300km. Transporting to the south of Italy (average of 1500km) by rail would reduce the CO2 emissions by 65%. The authors also emphasize that transport by ship to Egypt (4800km) has lower emissions than transport by truck to Rome (600km).
Zero Waste Europe Reusable vs single-use packaging Reloop

27
Figure 13: GWP of transporting 1 kg of apples produced in Italy, to different locations and by different transportation means. Adapted from [20].
Packaging designs can also influence the level of emissions from transportation. For example, reusable packaging that is designed to be collapsible and/or suitable for nesting can reduce transport volume, which can significantly optimize logistics and lower fuel usage and related emissions. An example of this was described in [13], in which one truck could be used to do the return transport of empty folded crates previously transported by four full-load trucks. Standardisation of packaging can also bolster more efficient use of space and transport logistics. Standardisation is further discussed in section 5.3 and 5.7.3.
The weight of the packaging is also a relevant factor for transport emissions. Reusable packaging is generally heavier than its single-use counterparts, resulting in higher fuel consumption. This is exemplified in different papers such as [21]–[24]. If the transport modes and distances are kept the same, one leg of transportation of a single-use item can have lower emissions than a returnable packaging due to the sometimes heavier weight of the latter. As already mentioned, this can be attributed to the fact that reusable packaging demands higher quality materials that can withstand the rigour of multiple cycles.
The volume of the packaging can also have an impact on the results. The bigger the volume per packaged product, the lower the impact. This is analysed in many of the studies selected.
Weight and volume were addressed in [25]. The authors performed a sensitivity analysis to see how the results would change by light-weighting an average single-use bottle, by reusing a Zero Waste Europe Reusable vs single-use packaging Reloop

28
bottle of average weight, by reusing a light-weighted bottle and by increasing the volume of a single-use bottle and of a reusable bottle to 1L (Table 2). The results showed that, compared to the impact of a regular single-use bottle, the reuse of a 1L bottle had the most impact on reducing GWP per functional unit followed by light-weighting reusable bottles and reusing regular weight bottles. Light weighting the regular bottle or the 1L bottle was not as effective as any of the reuse options. The results of this study therefore show a clear preference for the implementation of reuse.
Table 2: Mitigation scenarios of light-weighting, reusing and increasing volume per packaging of wine glass bottles. Source [25].
As previously noted, while reusable packaging is often heavier than single-use packaging, this is not always the case. This will depend on the material and application in question. For example, reusable plastic or stainless-steel bottles are generally lighter than single-use glass. In cases where single-use glass bottles are being used, their replacement with reusable packaging can bring further benefits in terms of transportation due to its lighter weight.
4.3.2. Production In some of the studies analysed, the production phase of a packaging’s life cycle was found to have the most significant environmental burden, even for reusable packaging. This is understandable since reusable packaging needs to be produced with higher quality materials in order to withstand the number of cycles it will endure throughout its lifetime.
One of the studies [26] analysed different types of beverage packaging (Figure 15) and found that the production process was responsible for the highest percentage of emissions for all packaging materials used for primary and secondary packaging. In this scenario, emissions from production for a single-use glass bottle (CSU) (primary packaging) were much higher than the emissions from production for a reusable glass bottle (RFG). This happens because, for reusable packaging, the production emissions are divided throughout the number of cycles in order to reflect the emissions per functional unit. This results in a much lower GWP impact
Zero Waste Europe Reusable vs single-use packaging Reloop

29
for the entire life cycle of a reusable glass bottle (RFG).
Figure 15: Global Warming Potential of 1L and 750ml of Aseptic Carton (AC), Conventional Single-Use (CSU), Light-weight Single-Use (LSU), PET, and Refillable Glass (RFG) Bottles. Source [26].
4.3.3. Number of cycles (uses) The number of cycles made by a reusable package over its lifetime plays a key role in determining how environmentally friendly it is compared to single-use alternatives. There is a range between the minimum and maximum number of possible cycles a packaging can withstand, and this is highly related to the type of packaging and application in question, and of course to the quality of the product. Therefore, it is crucial to consider the realistic number of cycles, preferably by having the data retrieved directly from the case study examined or from a company that operates with the same packaging. For some of the studies analysed, this data was not available, which can lead to doubts regarding the results. Some studies examined how the environmental impacts of reusable packaging would change depending on the number of cycles. In these studies, we can usually observe a steep reduction of impacts within the first cycles, which then gradually reaches a plateau. This is attributed to the fact that for reusable packaging, the total emissions associated with production are distributed equally between the total number of cycles, whereas the impacts from transportation and cleaning, when necessary, are still present in every cycle. This can be observed in Figure 15, Figure 16 and Figure 18. Zero Waste Europe Reusable vs single-use packaging Reloop

30
Figure 15: Number of times a bottle is reused and the decrease in Global Warming Potential (g CO2 eq/ll. Adapted from [10].
Figure 16: Reduction of kg of CO2 depending on the number of cycles of reusable plastic crates. Adapted from [16].
The same pattern was observed in a study carried out by [27], which analysed the impacts of single-use and reusable glass bottles (Figure 17). In that scenario, the production phase was found to have the highest impact for single-use glass bottles. Production emissions for the reusable glass bottles were lower, even though both types of packaging consisted of the same material and should therefore have similar impacts Again, this can be explained by the fact that with single-use packaging, the whole of the burden of production impacts are associated with a single trip, whereas the production emissions associated with a reusable bottle are shared equally between the total number of cycles.
Zero Waste Europe Reusable vs single-use packaging Reloop

31
Figure 17: Global Warming Potential (GWP) of single-use glass and reusable glass bottles by stages of the life cycle: Bottle Production, Secondary and Tertiary Packaging Production, Distribution and End-of-Life. Adapted from [27]
Figure 18: Reduction of kg of CO2 depending on the number of cycles of reusable plastic crates. Adapted from [28].
The importance of the number of cycles is also addressed in study [23] in which single-use and reusable cups for festivals were compared. According to the study data, the average number of cycles per reusable cup was only 1,7 times. However, for reusable cups to break-even (in terms of environmental impact) with single-use cups, they should be reused at least 10 times. Zero Waste Europe Reusable vs single-use packaging Reloop

32
Nonetheless, the authors considered several considerations that also could have influenced the results:
1. The cups would be washed after every use, meaning that multiple refills by the same consumer (without washing in between uses) were not taken into consideration.
2. According to the event, only 20% of the cups were returned.
Both considerations could be re-evaluated. At festivals, cups are likely to be reused by the same person more than once, especially if a deposit return scheme (DRS) is in place. The DRS would also incentivise the consumer to return the cup at the end of the festival, increasing the 20% return rate. The role of DRSs for reusable packaging systems is further analysed in section 5.2.
4.3.4. Recycled content, End-of-life and Recycling credits
The relative environmental performance of a packaging may be significantly influenced by the percentage of recycled post-consumer waste (recycled content) used in the packaging. In general, the higher the percentage of recycled content used, the lower the production impact of that particular packaging. This is due to the avoidance of a number of upstream processes involved in the production of a new packaging, like the extraction of raw materials. How these emissions savings are credited in the system will depend on the allocation method used, as mentioned in section 4.2.3.
In some studies, the models that are used to calculate impacts are based on the assumption that a percentage of recycled content is used in the production of the packaging. For example, study [10] assumed that glass bottles contained 35% recycled content and that aluminium cans contained 48%. In a different study [29], it was assumed that honey jars were produced with 61% recycled glass. The use of recycled content in the production of a packaging will depend on a number of factors including the packaging’s intended application and its feasibility, on the country in which it is produced, and on the availability of that recycled material.
End-of-life management refers to the ways in which wastes from packaging systems are processed, and usually includes recycling, landfilling or incineration. The possible end-of-life Zero Waste Europe Reusable vs single-use packaging Reloop

33
scenarios assumed in LCAs vary. These will depend on the product and on the availability of end-of-life processes in the country/region in question. Of the three end-of-life management options aforementioned (i.e. recycling, landfilling and incineration), recycling is generally the environmentally preferable option according to the LCA studies, which can also lead to recycling credits as mentioned in section 4.2.3. Figure 20 and Figure 21 show the difference in the life cycle CO2 emissions depending on the end-of-life scenario used. Figure 20 shows how changing the percentages of recycling and landfilling of a 0,5L PET bottle affects its GWP over a life cycle.
In study [10] it was determined that increasing the recycling rate of PET (0,5L) from 24% to 60% would halve its GWP, which would be the equivalent of half of the aluminium packaging’s emissions. The author also states that glass bottles would have to be reused at least 20 times in order to reach a break-even point with PET bottles, assuming a 60% recycling rate. This number of cycles is feasible since glass bottles are already reused an average of 25 to 30 times.
Figure 19: GWP of 0,5L PET bottles considering different end-of-life scenarios. Adapted from [10].
End-of-life alternatives are also compared in Figure 20. Here, single-use packaging shows a much higher environmental impact, regardless of which end-of-life scenario is applied, when compared to reusable packaging. When all three end-of-life options are compared, recycling shows the lowest emissions irrespective of packaging type.
Zero Waste Europe Reusable vs single-use packaging Reloop

34
Figure 20: Comparison of different end-of-life scenarios (incineration, landfilling and recycling) for single-use and reusable packaging containers. Adapted from [21].
The emissions shown in Figure 19 and Figure 20 take into account the recycling credits. In other words, they show the impact after the avoided emissions from recycling the packaging have been subtracted. One study analysed how recycling credits can impact the result of an LCA [30]. The findings of this study are displayed in Figure 21, which depicts the impact of different beverage packaging materials, with or without recycling credits. This graph shows how crediting a beverage packaging system for the emissions avoided from its recycling (in an avoided burden approach) can reduce its impacts two- to three-fold, especially for aluminium and glass materials whose production processes are highly energy-intensive. Nevertheless, the study did not report the inclusion of material or quality losses during the recycling processes.
Zero Waste Europe Reusable vs single-use packaging Reloop

35
Figure 21: Variation in the CO2 emissions of beverage packaging when including or excluding the credits of secondary materials. Adapted from [30].
4.3.5. Interaction between the key parameters and different packaging types and materials Understanding how these key parameters (transport; production; number of cycles; and recycled content, end-of-life, and recycling credits) interact with each other throughout a product’s life cycle is crucial to determining under which conditions reusable packaging is the most environmentally preferred option. Depending on which life cycle stage of a product is the most impactful, certain measures can be taken to reduce it. It is important to highlight, however, that determining which packaging is the best by comparing the results of different studies is usually not possible. This is because each study relies on different assumptions regarding supply chains, transport distances, number of cycles, production processes, etc., and depending on which assumptions are made, the results can differ drastically. With that being said, the results of these studies can still be used to analyse the relations between packaging materials and formats and the transport distances, so that it is possible to identify when a switch from a single-use packaging to a reusable one offers or not a reduction in CO2 emissions. Since most of the studies reviewed identified transport as the most impactful stage of the
Zero Waste Europe Reusable vs single-use packaging Reloop

36
reusable packaging’s life cycle, an analysis was performed to understand the relationship between transport distance and CO2 emissions. This analysis took into consideration bottles (Figure 22) and crates (Figure 25), the two packaging types most assessed by the LCAs selected. Important note on Figure 22 and Figure 25: The distances shown in Figure 22 (which compares the emissions for single-use and reusable bottles) represent the total distance travelled by a reusable packaging over one life cycle, from the production stage, to use and final disposal. However, it did not provide a direct relation between transport distance and CO2 emissions. Therefore, to further investigate the influence of transport distance, another graph was plotted using only the backhaul and resupply distances (which represent the return trip(s) of the packaging after being used). It’s important to note, however, that this further analysis was only done for crates, since the studies that analysed the impacts of bottles did not provide the required level of information. The interaction between the backhaul and resupply distances and materials used for crates is depicted in Figure 25.
Packaging containers
Overall, the studies show that reusable bottles have a lower environmental impact than single-use ones. Nevertheless, the results directly depend on which single-use and reusable illustrates how the emissions results of single-use and reusable bottles are affected by the type of material used.packaging materials were being compared (e.g. glass, plastic, aluminium cans, etc.). In Figure 22, even though a relationship between transport distance and emissions was not evident, it is clear that the results can vary considerably depending on which material type is used for the packaging.
Zero Waste Europe Reusable vs single-use packaging Reloop

37
Figure 22: Relationship between the distance travelled over of one life cycle of a reusable packaging, x-axis, and CO2 emissions (reusable packaging CO2 emissions/single-use packaging CO2 emissions,y-axis, in which negative values represent a reduction in CO2 emissions and positive values represent an increase in CO2 emissions compared to single-use packaging,SUP. The bars are colour-coded according to the material comparison of single-use packaging,SUP to reusable packaging (RP) respectively as shown in the subtitle. The notes in parentheses above the transport distances in the graph identify the study from where the example was retrieved. Reusable glass bottles vs. Single-use PET, aluminium cans, beverage cartons or bag-in-box.
Reusable glass bottles VS single-use glass bottles (Blue) All of the studies that compared the environmental impacts of single-use and reusable glass showed lower CO2 emissions for reusable ones. This is understandable since glass production is highly energy intensive.
In fact, the production stage of a glass product’s life cycle is generally the one with the highest environmental impacts, even in study [26], in which long distances of 1,340km were considered. It is also important to highlight that single-use glass bottles were shown to have the highest overall impacts compared to other alternative materials, such as PET,
Zero Waste Europe Reusable vs single-use packaging Reloop

38
aluminium and beverage cartons, as shown in Figure 23 and Figure 14.
Figure 23: Global warming potential of single-use glass bottles, aluminium cans and PET bottles (0.5L and 2L). Adapted from [10].
Reusing glass bottles avoids emissions associated with new production; even after the first use, the reduction in emissions can be drastic. Study [10], depicted on Figure 15, showed a 40% reduction in CO2 emissions for the glass bottles analysed after the second cycle. It is important to remember that after a certain number of cycles the emissions associated with reusable packaging reach a plateau as shown in Figure 15 and Figure 16. This is because the emissions from reusable packaging are usually related to the washing process and the transportation phase (backhaul and resupply), which are present in every cycle of a reusable packaging. As shown in Figure 22, the container types analysed in study [26] stand out as having the largest emission reductions. The author analysed two types of single-use glass bottles (conventional (CSU) and lightweight (LSU) and two different sizes of bottle (750ml and 1L). The study found that the reusable glass bottle had 83.3% less emissions than the lightweight (750ml) single-use glass bottle, and 80.5% less compared to the lightweight (1L) single-use glass bottle. When compared to the CSU glass bottles, the reusable bottle had 86.3% less emissions than the 1L format, and 83.2% less emissions than the 750ml format. In this study, it is interesting to note that the emissions reduction is slightly higher when compared to the study that has analysed smaller packaging formats. This is because smaller packaging formats have higher emissions since they require more material per volume of beverage.
Zero Waste Europe Reusable vs single-use packaging Reloop

39
A reduction in emissions was also observed in case [25], in which the emissions of a single-use glass bottle were compared to those of a light-weighted single-use glass bottle, a reusable conventional glass bottle (0,527kg), a reusable light-weighted glass bottle (0,400kg), and a reusable 1L (0,510kg) wine bottle. For all reusable packaging formats, it was assumed that they were reused ,5 times (Table 2). In all cases, the emissions associated with reusable bottles were reduced by over a third compared to the single-use bottle. It is important to highlight that the authors could not find data about the maximum number of cycles of the reusable bottles, and that the assumption of 5 cycles is conservative if one considers that beer bottles can typically withstand 25-30 cycles. Therefore, the emissions reduction benefits of using reusable bottles is actually underestimated since emissions would decrease even further if the number of cycles were increased.
Reusable glass bottles VS single-use PET bottles (Green)
A reduction in emissions was also observed when comparing reusable glass to single-use PET. Even though single-use PET bottles usually have much lower emissions than single-use glass bottles (as shown in Figure 23), if the
glass bottles are reused, they become environmentally preferable over PET. While the reduction in emissions shown by the green bars in Figure 21 may be less significant than that shown by the blue bars, which compares the emissions associated with single-use glass and reusable glass, it still points to a significant reduction and highlights reusable glass as the better alternative. Another noticeable difference in emissions between packaging types that can be seen in Figure 22 is shown by the two green bars from study [10]. In this case, the impacts of two different sizes of PET bottles were considered: 2L and 0.5L. According to the authors, the 0.5L PET bottle has two times more emissions than the 2L PET bottle. This is due to more packaging material required per volume of beverage. Therefore, when both volumes are compared to reusable glass bottles, switching out a 0.5L PET bottle for a reusable glass bottle would lead to higher emissions reductions (-48,8%) than switching a 2L PET (-0,7%) bottle for reusable glass, since the latter two have similar emissions. Zero Waste Europe Reusable vs single-use packaging Reloop

40
Reusable glass bottles VS single-use aluminium cans (Pink) The comparison between reusable glass bottles and single-use aluminium cans analysed in case [10], showed a reduction in emissions for the reusable glass bottles. As shown in Figure 23, aluminium cans usually have lower emissions over their life cycle than single-use glass bottles.
However, according to the author, by reusing glass bottles only three times, its emissions would already be lower than observed for aluminium cans. The variation in the emissions with the number of cycles of reusable glass bottles is depicted in Figure 15.
Reusable glass bottles VS single-use beverage cartons and bags-in-box (Yellow and Grey) As depicted in Figure 22, study [27] compared the impacts of reusable glass bottles to four different packaging types: single-use bag-in-box, single-use aseptic carton, single-use PET, and single-use glass.
If a 500km transport distance is assumed, reusable glass is shown to be the best alternative compared to either single-use glass or single-use PET. This was not the case when comparing the emissions of aseptic cartons and bag-in-box to reusable glass. Both of these packaging types showed better results than reusable bottles. The impacts of each packaging type were also compared assuming a shorter transport distance of 100km. Even though reducing the assumed travel distance resulted in reduced emissions for all four packaging types, aseptic carton and bag-in-box still showed lower emissions than reusable packaging. According to the authors, this can be attributed to the fact that the emissions associated with the production of an aseptic carton and bag-in-box are much lower compared to the other materials. The authors also point out that when assumed transport distances are lowered to less than 100km, the impact of the reusable glass bottle becomes comparable to the aseptic carton and bag-in-box [27]. Nevertheless, the fact that all four packaging types showed reductions in CO2 emissions after the distance was reduced corroborates the findings of many studies that highlight transport distance as a key parameter impacting the success of a reusable system. In paper [27], the authors did not find that reusable glass had lower emissions than aseptic carton containers. Study [26], however, shows different results depending on the LCA method used. Regardless, the reduction in Zero Waste Europe Reusable vs single-use packaging Reloop

41
emissions is not significant and therefore, definitive conclusions cannot be drawn.
Reusable HDPE bottles VS single-use HDPE bottles (Orange) The impacts of single-use PET bottles, single-use HDPE bottles, and reusable HDPE bottles for fabric softener, laundry and hand washing detergents were compared in study [31].
The authors analysed the impacts of different volumes of single-use virgin and recycled PET and HDPE bottles with 1L and 3L reusable HDPE bottles. The authors found that the reduction in emissions was dependent on the number of times the bottles are reused. In this specific case, they determined that the reusable bottle had the lowest impacts between 2 and 10 reuse cycles. In general, studies show that a reusable packaging should be used at least 10 to 15 times to have a smaller impact than single-use packaging, due to other impact categories analysed. Figure 24 depicts the emissions associated with laundry detergent bottles depending on the packaging’s volume and number of cycles.
Figure 24: Climate change impacts in Kg CO2/functional unit (emissions) for virgin single-use and virgin HDPE reusable bottles of laundry detergent. Error bars refer to the impacts of single-use bottles produced entirely with recycled materials. Source [31].
Zero Waste Europe Reusable vs single-use packaging Reloop

42
Crates
Overall, the studies show that reusable crates have a lower environmental impact than single-use ones. A clearer trend was observed in terms of backhaul and resupply distances.
Figure 25: Interaction between backhaul distance of the reusable crates, X-axis, CO2 emissions, reusable packaging CO2 emissions/single-use packaging CO2 emissions, Y-axis, where negative values represent a reduction in emissions and positive values represent an increase of single-use, SUP, and reusable packaging, RP.The bars are colour-coded according to the material comparison of single-use packaging, SUP, and reusable packaging, RP, as shown in the legend.
With regards to crates, transport distances are generally longer than those assumed for bottles, since the packaging is required for logistics. The results in Figure 25 consider only the backhaul and resupply distances, or in other words, what would be a regular cycle of the reusable packaging. A clearer trend on the influence of distance and CO2 reductions can be observed. As distances become longer, the reduction in emissions becomes less significant. Single-use cardboard boxes vs Reusable plastic crates (Yellow) and Wooden crates VS Reusable plastic crates (Purple) When analysing the total distance travelled by a product over its entire life cycle, there is not a clear correlation between distance and emissions for single-use cardboard boxes and reusable plastic crates. Study [16] showed that reducing the distance resulted in a decrease in Zero Waste Europe Reusable vs single-use packaging Reloop

43
emissions. By changing the total distance from 2,000km to 1,000km, the reusable packaging became the most sustainable option. This study was not included in Figure 26 since the backhaul distances were not clearly specified. The comparison between single-use cardboard boxes and reusable plastic crates (yellow) seems to follow the correlation between distance and CO2 emissions in Figure 25. The shorter the distance, the more significant the reduction in emissions for the reusable option compared to the single-use one. Study [24] analysed the impacts of single-use wooden crates and single-use cardboard boxes compared to reusable plastic crates. The difference in emissions between wooden boxes and reusable packaging was not found to be as significant as the one observed between cardboard boxes and reusable packaging. There are two reasons for this:
1. The production emissions for wooden boxes are lower (less energy-intensive) than for cardboard boxes; and
2. Wooden boxes have more embodied energy credits at their end-of-life than cardboard boxes. The emissions of the three materials analysed are displayed in Figure 26.
Figure 26: Environmental impacts of single-use wooden boxes, single-use cardboard boxes and reusable plastic crates, normalized to the total annual European emissions. Adapted from [24].
Zero Waste Europe Reusable vs single-use packaging Reloop

44
In Figure 25, study [28] stands out for showing an increase in emissions for reusable packaging. Two key input parameters influenced this outcome:
1. The assumed transport distance for the reusable packaging; and
2. Recycling credits (the avoided emissions by using recycled cardboard instead of virgin material).
The authors emphasize that, even if recycled cardboard were credited for its avoided emissions for displacing virgin material, single-use cardboard boxes would still have lower emissions than plastic crates, as shown in Figure 27. In this case, transport accounts for the highest emissions throughout the life cycle. Packaging weight, transport distance, and transport mode determined the overall CO2 emissions. To analyse the impacts of distance on the results, the authors examined alternative scenarios, such as halving and doubling the distances travelled. For most impact categories, this did not alter the main conclusions.
Figure 27: Climate Change (CC) impacts of single-use cardboard box (CCB) and reusable plastic crate. Source [28].
However, it is also stated in study [28] that making use of smaller, lighter trucks, with better mileage could further reduce the transport impacts for the reusable system, and potentially make them environmentally preferable over single-use cardboard boxes. This represents an area that is ripe for further research. Single-use mixed materials crates VS reusable plastic crates (Grey)
Zero Waste Europe Reusable vs single-use packaging Reloop

45
Figure 27 presents the results of study [21] that compared the impacts of various single-use packaging types with reusable plastic crates. The single-use packaging types analysed were: wooden boxes (40.6%), single-use plastic crates (15.1%) and cardboard (44.3%)[21]. These were replaced by reusable plastic crates, which were assumed to undergo either 30 reuse cycles (washed after every use) or 70 (washed every two uses). In both scenarios, the study found that reusable crates had a much lower impact than their single-use counterparts. When it comes to the range of cycles assumed for the reusable crates, it was found that reusing a crate 70 times vs. 30 times presented lower emissions since the production impacts are spread out over a larger number of uses.
4.3.6. Break-even points The point at which the environmental impacts of reusable packaging outweigh (or are comparable to) those of single-use packaging is called the “break-even point.” Although it is a useful metric for comparing different options, it’s important to note that because every product has a specific life cycle and different environmental impacts (which depend, for example, on the material used, percentage of recycled content, transport distances and other parameters), there might be several break-even points instead of one. Consequently, the number of cycles or transport distance mentioned below represents an average retrieved from the studies analysed and should not be accepted as a rule. On top of that, not all studies identified the break-even points assumed for the analysed packaging, thus only some are mentioned below.
For bottles, study [17] calculated that the break-even point for reusable glass bottles and single-use glass bottles was reached after 2 cycles, assuming a transport distance of 200km from plant to distributor. Study [30] showed that after the third use, reusable glass bottles are already less impactful than single-use glass or PET. This is corroborated by study [10], in which the environmental impacts of the reusable glass bottle were similar to single-use aluminium cans and 0.5L PET bottles after the third use. However, other authors calculate a higher break-even point when comparing reusable bottles to single-use alternatives. For instance, study [26] calculated that in order to break-even with the emissions of single-use aseptic cartons, PET, glass and lightweight glass bottles, reusable glass bottles would have to be reused 10 to 20 times.
Comparing reusable plastic crates with single-use cardboard boxes, the break-even point was calculated at between 5 and 15 uses by study [24], which in its analysis would be the equivalent of 1 to 3 years of use. This break-even point, according to the author, is much lower
Zero Waste Europe Reusable vs single-use packaging Reloop

46
than the usual service life of a crate, which is between 10 to 20 years. In another study [32], the break-even point was calculated at 3 uses.
4.3.7. Most relevant life cycle stage of reusable packaging By knowing which parameters are the most influential on results, it becomes possible to analyse their level of impact by packaging type. Table 3 includes the four packaging types that were most commonly analysed in the selected studies: bottles, crates, cups and food containers. The numbers shown refer to the number of studies that identified that life cycle stage as having the most impacts for the corresponding packaging type. The key parameters represented in the table are: Production Phase, Number of Cycles, Service Life (which includes transport and cleaning) and End-of-Life Phase (which considers recycled content, end-of-life process and recycling credits).
Table 3: Most relevant key parameters by reusable packaging type. The number refers to the number of studies that identified each life stage as a key parameter. Not all studies analysed the impacts by life cycle stage and/or had inconclusive results; in this case, a 0 is shown.
As already mentioned, the most impactful stage of a products’ life cycle tends to differ for single-use and reusable packaging. While for single-use packaging it is usually the production phase that has the highest impacts, for reusable packaging it is usually the service life due to the extra transportation needed for every cycle and, in some cases, cleaning. With that in mind, it is no surprise that most of the studies point to service life (or use phase) as the most impactful life cycle stage for reusable packaging. In the case of single-use bottles, the production impacts tend to be high, especially for glass Zero Waste Europe Reusable vs single-use packaging Reloop
Packaging Types Production Phase
Number Cycles
Service Life End-of-Life Phase
Bottles 1 1 4 0
Crates 0 0 4 0
Cups 1 0 3 0
Food Containers 2 0 0 0

47
bottles. However, when a bottle is reused, the emissions associated with production are distributed over the product’s life cycle, which reduces its relevance. For service life, transport tends to be the most relevant parameter especially considering the backhaul transport of heavy packaging such as glass bottles. For crates, as observed for bottles, the parameter which appears to have the most impact is the service life, which makes sense considering that the transport distances for this packaging type tend to be longer, including national and international transport. In both cases, a decentralised distribution system might reduce the impacts of transport by reducing the total distances travelled. Opting for a lighter packaging material can also help reduce these impacts. For cups and containers, the studies showed that the washing process tends to be the most relevant parameter since washing between uses can significantly cut down on transport distances required during a regular cycle. This was particularly true for cups, which can be used and washed within the same establishment, reducing the transport distance to zero in regular cycles. In fact, one study pointed to the necessity of reusing cups between washes; this can easily be adopted at festivals and events by charging consumers a refundable deposit on the cup, which encourages them to return cups at the end of the day so that they can be reused. For food containers, emissions associated with the production phase were found to have the largest influence on the overall results. Again, this highlights the importance of ensuring that a reusable packaging is used enough times so that the production impacts per cycle are minimized. When it comes to the washing of cups and takeaway containers, dishwashing is recommended before hand washing, not only to ensure that the items are cleaned according to hygiene standards, but also to lower the impacts in terms of water use. Thus, the application and the relation between key parameters need to be taken into consideration. For cases in which packaging production is the most impactful stage, increasing the number of cycles seems to be key in order to make reuse a feasible option. If a change in the material is not feasible, recycled content can also further reduce the production emissions. For cases in which transport has the highest impacts, reducing the travel distance and packaging design can lead to a significant decrease in emissions. Variations in the recycled content (when assumed) and the recycling/energy-recovery crediting are usually not addressed since these are decided at the beginning of the study based on the specific cases or region. Various end-of-life alternatives (recycling, landfilling, incineration) Zero Waste Europe Reusable vs single-use packaging Reloop

48
were evaluated by some studies using sensitivity analysis. These studies showed how altering assumptions around end-of-life management (e.g. how much material is recycled, how much is landfilled, etc.) could drastically change the results. With respect to assumptions made around recycled content for a particular material, LCA studies usually apply the rate of recycled content that is typical in the region. However, none of the studies performed a sensitivity analysis to determine the influence of using higher or lower levels of recycled content in a reusable packaging on overall environmental impacts. This lends more credence to the idea that a product’s end-of-life phase is often overlooked in studies, despite the fact that including it in the analysis could further increase the advantage of reusable packaging over single-use.
Zero Waste Europe Reusable vs single-use packaging Reloop

49
5. DISCUSSION The results demonstrate that the great majority of studies (76%) point to reusable packaging as the most environmentally friendly option. These results, however, are highly dependent on the considerations and assumptions made in each study, and therefore decisions on which packaging type is the most environmentally friendly should be made on a case-by-case after due consideration has been given to all parameters and applications that may impact how successful (or not) a reusable packaging system is.
After analysing the interaction among some of the key parameters that influence the success of reusable packaging systems, it was concluded that overall transport distances are not as influential on the results as the specific backhaul and resupply distances because the latter will affect every cycle of the reusable packaging, and therefore, will have higher relevance than the production and distribution distances, which are distributed over the number of cycles. Thus, the higher the number of cycles, the less significant are the production and transport distances on the impact of the entire life cycle.
Some parameters that influence the success of a reusable packaging system are further discussed in this section.
5.1. Materials choice and production impacts As seen in the previous section, the packaging’s material deeply influences the results when comparing environmental impacts or/and when analysing a possible switch from single-use to a reusable packaging system. For example, materials with higher production emissions, such as glass, generally require a higher number of cycles in order to break even with single-use or other materials with less CO2 intensive production phases, such as plastic. The choice of material type is also related to its recyclability at the end-of-life. Materials with a high recycling demand and that generate a high-quality recycled product (sometimes even after various recycling cycles) can generate credits for the system, as explained in section 4.2.3. The material type is also entwined with the maximum amount of recycled content that is possible given its application and other factors such as availability of recycled materials and country regulations. A reusable packaging system with high recycled content and recyclability will lead to further emissions reductions over the entire life cycle. Zero Waste Europe Reusable vs single-use packaging Reloop

50
5.2. Deposit Return Scheme (DRS) Deposit return schemes (DRS) can further increase the efficiency and success of reusable packaging systems. These schemes add a small fee to the price of a beverage, which is reimbursed to the consumer once the empty packaging is returned to a collection point for reuse or recycling. DRSs aim to increase the reuse and recycling rates of specific packaging, such as beer bottles [33]. Globally, the median return rate for deposit schemes for one-way beverage containers is 84%. These systems have higher recycling rates compared to other collection methods since contamination is reduced [7].
DRSs already exist in over 40 countries, states, and provinces around the world, including Europe, the United States, Canada, Australia, and Israel. Over the last few years, several more jurisdictions including Victoria (Australia), Tasmania (Australia), Slovakia, Portugal, Turkey, Romania, Latvia, New Zealand, and Scotland have passed legislation to introduce DRS by or before 2023. Newer European DRS programs, like those in Estonia (2005) and Lithuania (2016) offer producers the choice of selling reusable or single-use bottles as part of the same system. The use of DRS has shown to improve the environmental impacts of reusable packaging and can be decisive in increasing reuse.
According to different studies on the impact of beverage packaging, single-use glass bottles were unanimously the least preferred option due to the energy intensity of the production process and disposal stages. However, this is not the case when these bottles can be reused. This point was emphasized by study [10], which stated that glass bottles would have to be reused only three times in order for its emissions to break-even with those of aluminium cans and 0.5L PET bottles. Given the importance of reusable systems, countries considering DRS for single-use bottles and cans should consider how reusable bottles can be integrated into the collection network when designing the system.
Another way in which DRS can increase the efficiency and success of reusable systems is by helping producers to comply with their Extended Producer Responsibility obligations — which require them to cover the full economic costs of the packaging life cycle (from its production to its disposal) — by reducing leakage to the environment (littering) and ensuring that the packaging is returned to them at end-of-life.
In addition, although most DRS have so far been implemented for beverage bottles, these schemes can also be used at a local level to recover other types of packaging including
Zero Waste Europe Reusable vs single-use packaging Reloop

51
reusable food containers, cups for beverages [34] and e-commerce packaging [35], with successful results.
5.2.1. Job creation A study done in the US identified a drastic increase in job creation when beverage containers (including glass, aluminium cans and PET) are collected through a DRS instead of regular curbside collection [36]. Job creation is rarely addressed when talking about reusable packaging and should not be underestimated. The topic should be further analysed since it can lead to further benefits of reusable systems
5.3. Standardisation and pooling Standardisation of packaging can be a decisive tool to facilitate return logistics. Standardisation means less variety in the packaging formats used when it comes to characteristics such as shape, volume, weight, and lid size, amongst others. Standardised packaging formats help to facilitate transport, logistics, cleaning processes and machinery, and can also result in overall cost reduction, as producers with the same packaging formats can share the operational costs of the system. Standardisation can also lead to an increase in reuse [37] and extend the product’s life when parts need to be replaced [38], [39]. Moreover, standardisation can help reduce the complexity of packaging materials, which can further enhance its recyclability and consequently, its overall environmental impact. It’s worth noting that standardised packaging is simpler to introduce in a pooling1 system, in which different producers make use of the same packaging materials while reducing inventory costs.
Beer bottles are a classic example of standardised packaging. With the introduction of the industry standard bottle (ISB), producers no longer need to sort and exchange bottles, which reduces costs by simplifying the collection and reuse process [40]. Another successful example of packaging standardisation can be seen in crates and pallets, which once standardised to specific sizes and models, reduce transport time and costs by optimizing logistics. Some authors even state that standardisation in logistics is directly related to price competitiveness [41]. Although they have been used successfully to improve handling and transportation
1 In a pooling system different companies share the same resource in order to optimize operations and costs. Beer bottles have been pooled by companies in different countries, like Germany or the Netherlands. Another example are crates and pallets. Usually, a third-party company provides the crates and pallets, distributes, collects and cleans the packaging before sending them to the next company. Zero Waste Europe Reusable vs single-use packaging Reloop

52
efficiencies in the U.S. since the 1930s, there is still a need for improvement. Pallet sizing is not standard in the shipping industry, and as such, companies and organisations utilise hundreds of different pallet dimensions around the world. This lack of standardisation reduces the benefits of reusable pallets in international transport.
5.4. Consumer Standardisation of packaging can be a decisive tool to facilitate return logistics. Standardisation means less variety in the packaging formats used when it comes to characteristics such as shape, volume, weight, and lid size, amongst others. Standardised packaging formats help to facilitate transport, logistics, cleaning processes and machinery, and can also result in overall cost reduction, as producers with the same packaging formats can share the operational costs of the system. Standardisation can also lead to an increase in reuse [37] and extend the product’s life when parts need to be replaced [38], [39]. Moreover, standardisation can help reduce the complexity of packaging materials, which can further enhance its recyclability and consequently, its overall environmental impact. It’s worth noting that standardised packaging is simpler to introduce in a pooling2 system, in which different producers make use of the same packaging materials while reducing inventory costs.
Beer bottles are a classic example of standardised packaging. With the introduction of the industry standard bottle (ISB), producers no longer need to sort and exchange bottles, which reduces costs by simplifying the collection and reuse process [40]. Another successful example of packaging standardisation can be seen in crates and pallets, which once standardised to specific sizes and models, reduce transport time and costs by optimizing logistics. Some authors even state that standardisation in logistics is directly related to price competitiveness [41]. Although they have been used successfully to improve handling and transportation efficiencies in the U.S. since the 1930s, there is still a need for improvement. Pallet sizing is not standard in the shipping industry, and as such, companies and organisations utilise hundreds of different pallet dimensions around the world. This lack of standardisation reduces the benefits of reusable pallets in international transport.
2 In a pooling system different companies share the same resource in order to optimize operations and costs. Beer bottles have been pooled by companies in different countries, like Germany or the Netherlands. Another example are crates and pallets. Usually, a third-party company provides the crates and pallets, distributes, collects and cleans the packaging before sending them to the next company. Zero Waste Europe Reusable vs single-use packaging Reloop

53
5.4.1. Clear communication Consumers have been showing increasing interest in brands that offer more sustainable, eco-friendly products with less (single-use) packaging. Demand is also growing for more information on where products come from, how they are made, and what their environmental impacts are. While providing such information can attract consumers and increase consumer loyalty, this information needs to be legitimate and legally verified in order to avoid “greenwashing”, miscommunication and consumer confusion. 5.4.2. Price and discount/reward systems Price is another important factor for manufacturers and brands that use reusable systems. According to them, the price for the reusable packaging has to be competitive with single-use, otherwise, it’s less likely that consumers will opt for it. Companies assert that the price point is such a powerful influence that the sustainability of a product is something most consumers may not even consider if the price isn’t competitive [9]. Two ways in which these could be addressed has been mentioned by companies: The first way is by implementing a deposit scheme for reusable packaging, in which a consumer “rents” the packaging and receives the money back once the packaging is returned. The second way is by having discounts or reward systems applied. The use of deposit schemes is well known with beer bottles for example. To ensure a high return percentage for reusable packaging in a DRS, it is important to set an effective deposit value. If the deposit value is too low, consumers may find it more of an inconvenience to return the container and claim the refund than to reuse the product themselves or dispose of it. Making a competitive price, already with the deposit value, can make consumers understand the value of returning the packaging and can lead to consumer loyalty.
Some companies apply a discount/reward system. RePack3, a Finnish brand focused on reusable systems for e-commerce packaging, offers customers who use their packaging discount vouchers for the next purchase upon the return of the packaging. This incentivises increased return rates, facilitates collaboration between companies, and can lead to consumer loyalty.
3 Repack’s website: www.originalrepack.com Zero Waste Europe Reusable vs single-use packaging Reloop

54
5.4.3. Accessibility to consumers In the end, a company might have a well-designed reusable packaging, but if it is not easily accessible to consumers to take and return, the reusable system might fail. Ensuring that a reusable packaging system is accessible to consumers is also important for the creation of habit. The more available reusable packaging is in restaurants, bars, and stores, the more likely
consumers are to develop a habit to take and return it. 5.5. LCA limitations 5.5.1. Littering and waste generation As alluded to earlier in the report, the impact of littering is not analysed in LCA studies, and experts in the field regard this as a major flaw in the LCA method, which is still being developed. However, study [12] analysed the global warming potential (GWP) of carrier bags and also described an innovative method to estimate the littering potential (LP) of carrier bags (Figure 29). Out of the five bags analysed by the study, three were single-use (HDPE, paper bag and biodegradable bag) and two were reusable (Low-Density Polyethylene (LDPE) bag and Polypropylene (PP) bag). Four parameters were considered: the quantity of bags required for the same function; bags released in the environment; dispersion of bags in the environment; and environmental persistence of the bag’s material.
The study found that while the reusable LDPE bag with 10 cycles was the preferred option in terms of GWP, it had the second worst LP (behind the HDPE bag). Paper bags followed by PPs bags with 20 cycles were found to be the most impactful in terms of GWP, however the PP bag had the lowest LP. It’s worth noting that the number of cycles assumed (10 or 20 depending on the resistance of the material) was theoretical, and that the authors highlighted that the number of cycles assumed for the reusable bags deeply influences the results.
Zero Waste Europe Reusable vs single-use packaging Reloop
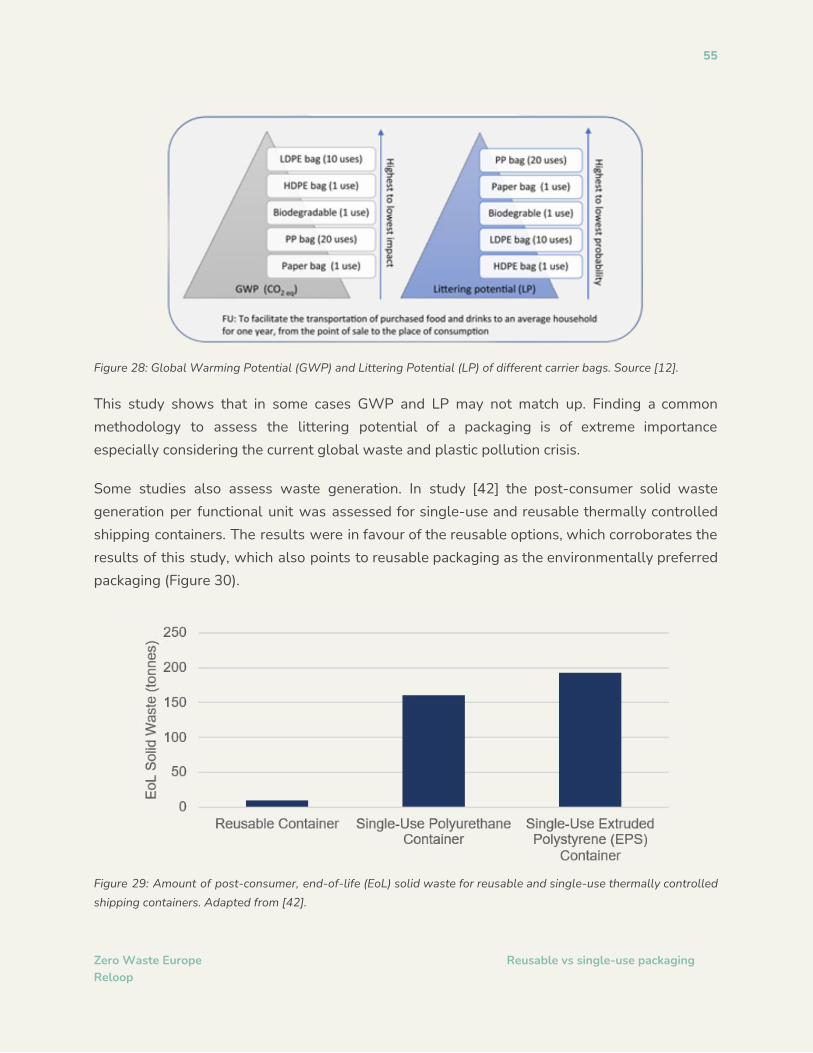
55
Figure 28: Global Warming Potential (GWP) and Littering Potential (LP) of different carrier bags. Source [12].
This study shows that in some cases GWP and LP may not match up. Finding a common methodology to assess the littering potential of a packaging is of extreme importance especially considering the current global waste and plastic pollution crisis.
Some studies also assess waste generation. In study [42] the post-consumer solid waste generation per functional unit was assessed for single-use and reusable thermally controlled shipping containers. The results were in favour of the reusable options, which corroborates the results of this study, which also points to reusable packaging as the environmentally preferred packaging (Figure 30).
Figure 29: Amount of post-consumer, end-of-life (EoL) solid waste for reusable and single-use thermally controlled shipping containers. Adapted from [42].
Zero Waste Europe Reusable vs single-use packaging Reloop

56
Another example of waste generation was analysed in study [43] in terms of GWP impact of single-use compostable and reusable PP clamshells for food takeaway. Two scenarios were analysed: Use by Design and Pilot (Figure 30). In the Use by Design scenario, it was assumed that 100% of the packaging was composted and recycled, thereby resulting in no waste. Under the Pilot scenario, different rates of composting and recycling were assumed. In this case, compostable clamshells were assumed to have a 25% composting rate and 75% landfill rate, while reusable clamshells were assumed to have a 21% recycling rate and 79% landfill rate (Figure 30). These rates were calculated based on the volume of clamshells reaching the landfills.
Figure 30: Amount of waste generated,m2, by single-use compostable and reusable PP clamshell takeaway food
containers. In the Use by Design scenario, it was assumed that 360 compostable clamshells were used one time and 1 reusable PP clamshell were used 360 times, with a 100% composting rate for the compostable packaging and 100% recycling rate for the reusable packaging. In the Pilot scenario, it was assumed that 43 compostable clamshells were used once and 1 reusable clamshell was used 43 times, with a 25% composting rate and 75% landfill rate for the compostable packaging and 21% recycling rate and 79% landfill rate for the reusable packaging. Adapted from [43].
The examples above illustrate the waste avoidance benefits of reusable packaging over single-use alternatives. However, even when an LCA considers the amount of waste generated by a product over its life cycle, the results are usually presented in terms of overall environmental impacts, and not as a separate indicator on waste generation. This reduces the focus on waste generation by LCAs. Furthermore, the impact of littering is not commonly addressed in LCA studies. LCAs usually assume that waste is collected and sorted to be recycled, incinerated or landfilled. Thus, the results do not account for the impacts caused if the waste ends up littered or in the environment. The LCA methodology is still not developed
Zero Waste Europe Reusable vs single-use packaging Reloop

57
enough to calculate the effects of littering in the environment. This disregards an important advantage for reusable packaging, since by being reused, it reduces the chances of littering. 5.5.2. Recyclability Apart from insufficient collection and sorting rates, there are a number of other factors that influence which materials will actually be recycled at end-of-life. One of those factors is the demand for recycled material. If there is no market for a particular recycled material, there is little point in recycling it, and it will most likely end up in landfill or incinerated. Whether or not a product is recycled at end-of-life also depends on the costs of recycling compared to the price of virgin material.
Availability of recycling facilities is another factor. Consider the example of beverage cartons. While they usually present the lowest environmental impact in LCAs compared to other single-use packaging types, they currently pose an infrastructural challenge, as they have to be split into two or three materials—paper, plastic, aluminium—and not all facilities have the capability to do this. This relates to another factor: disassembly. In order to be recycled and used in the creation of new products, some products might require disassembling (where the components are split and sorted), which can also increase costs [44].
On top of that, it’s important to note that “recyclable” does not equal “recycled.” In other words, just because a product is recyclable does not mean it will be recycled and turned into new materials and products. A material’s recyclability depends on its ability to reacquire the properties it had in its virgin or original state after being recycled. In the strictest sense, recycling of a material would generate a fresh supply of the same material—for example, old glass bottles would be converted into new glass bottles. This is possible when recycling metal cans, for example, because of their high recyclability, they can be recycled again and again into a new can, indefinitely, without any losses in quality of the product. However, for many other materials, this is cost-prohibitive (compared to producing the same product from raw materials) so “recycling” involves their reuse in producing other materials instead (known as ‘down cycling’). Paper offers one example of this. Once recycled, paper changes colour and the elasticity of the fibre is reduced. Glass can be recycled in a closed-loop and has high reusability which allows it to be reused many times [45][46][47]. It is no surprise then that the greater the mix of recyclable materials, the lower the overall quality the recycled material becomes. This reality is frequently discussed regarding plastics. Plastic is a complex material; there are many different types that should not be recycled together. If the plastics are not separated, the
Zero Waste Europe Reusable vs single-use packaging Reloop

58
quality of the recycled material degrades, which poses a challenge when it comes to usability of the recycled plastic.
Parameters like such are not an integral part of LCAs. Different methods to analyse recyclability of materials are being developed, but there is still no consensus.
5.5.3. Resource depletion Different authors also point to resource depletion as another area needing improvement in the LCA methodology. Given that natural resources are at the foundation of our economic system, different methodologies have been developed to assess the impact of resource depletion. In LCAs, abiotic resource depletion is one of the most frequently discussed impact categories and is usually focused on two sub-categories: mineral and fossil fuel. The depletion potential of mineral resources is analysed from a scarcity and criticality perspective, while for fossil fuels it is analysed in terms of permanent depletion (e.g. the extinction of a resource) [48].
5.6. Global warming potential and other impact categories Although this report has focused on global warming potential (GWP) of different packaging types in order to facilitate the comparison of the results of different studies, it is important to consider the other environmental impact categories that were analysed.
Most studies that showed reusable packaging as having a lower GWP compared to single-use packaging also showed a lower value for other impact categories analysed. Exceptions were ozone depletion potential and human toxicity potential in study [23], ozone depletion potential in study [49] and water consumption in study [43].
In study [23], which analysed the impacts of single-use and reusable cups for events, it was found that all impacts (with the exception of ozone layer depletion, heavy metals and carcinogen compounds) were reduced when the number of cycles of the reusable cups increased (Figure 31). This can be attributed to the energy required for the production of the cups as well as the washing process. This study was set in Catalonia, where around 65% of the energy is produced from nuclear power plants, which is associated with these impacts. While the number of cycles and the number of washings increased, the production emissions were further divided and therefore, reduced. In this case, the reduction in the production emissions was more relevant than the increase in the emissions due to washing, therefore a net Zero Waste Europe Reusable vs single-use packaging Reloop

59
reduction in the emissions can be observed in the results.
Figure 31: Impact comparison of single-use cups (green) and reusable cups with 2 cycles (blue, 9 cycles (red, 10 cycles (yellow and 14 cycles (grey for greenhouse gas emissions, ozone depletion, acidification, eutrophication, heavy metals, carcinogens, smog, pesticides, energy and solid waste production. Source [23].
The use of nuclear energy was also pointed out in study [49] as the reason for the high impact of ozone depletion. The authors analysed and compared the impacts of single-use (polyethene-coated paper and expanded polystyrene foam) and reusable (glass, ceramic and varying plastic blends) cups. They found that for many regions in the United States, reusable cups were the more environmentally friendly option over polystyrene cups, especially when washed in standard dishwashers after every use.
These examples highlight the importance of considering impact categories beyond GWP. With respect to reusable packaging, where the energy is produced can be a critical factor to consider, since energy will be required to wash the packaging throughout the cycles.
Related to washing, the impact of water consumption is also important to consider. In study [43], the impacts of reusable clamshells and single-use compostable clamshells for take away food in terms of greenhouse gas emissions, energy consumption, material waste and water consumption were analysed. The authors found that reusable packaging had the least environmental impacts in all categories with the exception of water consumption. This is understandable given that the compostable clamshell demands 3.5 times less water than the reusable alternative, which requires repeated washing throughout its lifetime. The issue of higher water consumption for reusable packaging compared to single-use is one that is frequently raised when comparing the impacts of these systems. In order to further decrease the impacts of reusable packaging, it is critical to understand how the cleaning process can be improved (e.g. by using efficient dishwashers) and how the number of Zero Waste Europe Reusable vs single-use packaging Reloop

60
washings between cycles can be minimized without compromising hygiene and safety. By understanding the overall impacts, better decisions can be made in terms of material choice, logistics, energy use, and so forth.
5.7. Future trends 5.7.1. E-commerce As convenience has become increasingly important in our fast-paced society, there has been growing consumer demand for faster delivery of products. In the past few years, for example, e-commerce sales have risen drastically, not only for apparel but also for food and groceries. Around the world, start-ups offering reusable transit packaging for the delivery/pickup of takeaway food, as well as for the delivery of groceries and apparel, are appearing with the aim of reducing packaging waste. While these businesses represent a great opportunity to enhance the efficiency of reuse systems, they do not currently enjoy the benefits of a standardised, pooled packaging system. The development of a more standardised packaging and ensuring ease of return for users (e.g. by increasing the number and density of drop-off points) is still on-going. For now, companies that provide reusable takeaway containers are relying mostly on consumers to return the packaging back to partner restaurants. Some are also exploring ways in which food delivery companies could also pick these up.
5.7.2. Scaling up Understanding how to scale up reusable packaging systems is also crucial to the future of the business. Scaling up and utilizing pooling systems can help a company reduce its transportation impacts by making use of local distribution centres and cleaning facilities in order to reduce travel distances. Collaborating with other companies in the area can facilitate an easy transition. The adoption of subsidies for reusable packaging is also a good measure that could be implemented at local, national or European level to help scale it up.
5.7.3. Standardisation across Europe Having a standardised system across Europe can further reduce emissions and facilitate the reuse of packaging in combination with deposit return schemes. Having more unified and Zero Waste Europe Reusable vs single-use packaging Reloop

61
standardised requirements for reusable packaging would further expand its benefits and lead to more cost and emissions reductions.
5.7.4. Policy Legislation plays a key role in ensuring better packaging design and systems, as well as in addressing overpackaging and packaging waste. Also, ensuring that the right economic measures are in place can help remove the market barriers for reusable packaging systems and create a level playing field with single-use packaging.
5.7.5. Decarbonisation of transport and electricity Another point worth mentioning is how the decarbonisation of transport and electricity might influence the environmental friendliness of reusable packaging systems. Since transport tends to be the stage with the highest emissions in a reusable product’s life cycle, a mode of transport that relies on electricity generated from high percentages of renewable energy might further reduce its impacts. This is also noted in section 5.6, which refers to the influence of the energy mix used.
The potential impact of decarbonisation of electricity is explored in study [25] as shown in Table 2. The authors of that study found that switching the electricity source from grid energy to solar renewable energy would result in a 9% reduction in greenhouse gas emissions.
Zero Waste Europe Reusable vs single-use packaging Reloop

62
6. LIMITATIONS One of the potential limitations of this study is that it was based on the criteria described in section 3. One of those criteria was that the study had to include an LCA. Because our analysis only includes studies that performed an LCA, studies that might have been carried out by companies and that may have included a cost analysis were excluded. This may explain why cost analysis was only included in such a limited number of studies.
Another limitation was the criterion that our review only includes studies that compared the impact of reusable and single-use packaging. Even though the aim of this research could not be achieved otherwise, this criterion means that studies that analysed the environmental impacts of single-use and reusable packaging separately were excluded from the analysis. While such studies would not provide any comparative information, they could bring more insight into the impacts of different packaging materials.
As discussed in section 5.5, littering and waste generation are not commonly addressed in LCA studies. That, coupled with a lack of consensus on a methodology, which is also lacking in LCAs, can lead to an underestimation of the benefits of reusable systems over single-use alternatives, since the latter are associated with more littering and waste. Increasing the share of reusable packaging would reduce littering and present a more circular alternative to recycling single-use packaging, for example. Furthermore, having a littering potential indicator and circularity methodology could help policy-makers analyse the implications of banning single-use packaging from different angles, before deciding on policy measures.
Zero Waste Europe Reusable vs single-use packaging Reloop

63
7. CONCLUSIONS The main goal of this research was to compare the environmental impacts of reusable and single-use packaging and analyse under which conditions reusable packaging is the most environmentally friendly. As seen in this report, most of the studies point to reusable packaging as the most environmentally sound approach compared to different single-use options. However, there are specific circumstances under which single-use is the less impactful option, such as longer transport distances. In terms of cost comparisons, conclusive results could not be drawn due to lack of data.
Through the analysis of a product’s life cycle, it is possible to identify that the success of a reusable packaging is dependent on different factors, such as number of cycles, transport distances, packaging weight, choice of material, and recycled content, amongst others. For instance, the emissions associated with a reusable packaging are deeply influenced by the number of cycles it undergoes, but only to a certain point, at which point a plateau is reached. This plateau can be explained by the fact that there are emissions that occur in every regular cycle of the reusable packaging, such as cleaning and transportation. Therefore, the impacts that are only present in the initial and last cycle, such as those related to transport between the stages of raw material extraction and packaging production and to disposal after its service life, are less significant in the overall impact rather than the distances that will be travelled in every cycle of a reusable packaging, here called backhaul and resupply distances. Thus, shorter backhaul and resupply distances should be prioritised. These tend to be beneficial in terms of impacts since transportation is usually responsible for the highest emissions in a product’s life cycle. Transport emissions are also affected by the packaging design (e.g., product weight and volume). The weight of a reusable packaging, for instance, is generally higher than single-use packaging because it has to be able to withstand the number of reuse cycles it will undergo over its lifetime.
Choice of material is also important. The material chosen should satisfy its application needs while being sufficiently durable and lightweight to ensure that transport emissions are minimised. Materials with high energy-intensive production processes, such as single-use glass, will usually show much higher emissions than reusable glass. Incorporating recycled content into the production process will also lead to further decreases in emissions, reducing the total environmental impacts of the product’s life cycle.
The results are also influenced by the limitations of the LCA methodology. Including an
Zero Waste Europe Reusable vs single-use packaging Reloop

64
indicator for littering potential of packaging would be extremely relevant, especially considering the amount of single-use packaging that ends up littered in the environment. The lack of consensus around recycling processes is another issue. This refers to the demand for recycled material, availability of recycling facilities, recyclability of the material itself, and costs of the entire recycling process compared to that of producing virgin material.
The influence of standardisation, deposit return schemes (DRS), price and discount/reward systems, as well as consumer accessibility are other parameters that are typically excluded from LCAs, despite playing a key role in determining the success of a reusable packaging system. Standardisation can help reduce emissions by optimizing logistics and reducing unnecessary transport. The implementation of a pooling system can further decrease the need for extra transport and travel distances, increasing overall efficiency and reducing costs. For these reasons, standardised packaging and pooling systems can go hand-in-hand to ensure a successful reusable packaging system.
Together with standardisation and pooling, DRSs are an effective way to increase reuse rates and to reinforce the benefits and convenience for consumers. Having reusable packaging easily accessible, easy to return and commonly used by a variety of establishments, increases the acceptance and therefore use by consumers.
It is also important that reusable packaging systems are competitively priced with single-use ones. This can be done through legislation that ensures the right economic incentives are in place, such as requiring the use of discounts (e.g. progressive discounts with every reuse/refill done by the consumer) or reward systems, which offer a discount for purchases at partner establishments, for example.
Zero Waste Europe Reusable vs single-use packaging Reloop

65
8. FURTHER RESEARCH Further research should be done on the interrelations between the key parameters that make reusable packaging environmentally and economically preferable to single-use.
8.1. Costs More open-source studies need to be done to compare the costs of switching from single-use packaging to a reusable packaging system and to analyse the ways in which reusable systems can be set up to ensure they are cost-competitive with the single-use supply chain.
Zero Waste Europe Reusable vs single-use packaging Reloop

66
9. STUDIES CONSIDERED AND EXCLUDED IN THIS REPORT The studies that passed the criteria presented in section 3.1 are listed in Table 4. However, studies that were not included in the analysis of this report followed 2 main classifications:
● Studies that did not fulfil the required criteria, due to methodology used that was considered lower to our quality expectations or due to a specific packaging studied that was not relevant for this report. These studies are listed in Table 5.
● Studies that compared different reusable options or the number of cycles of a reusable packaging system may have been mentioned in the report to exemplify reusable packaging but were not included in the analysis, since only studies that compared single-use to reusable packaging were used. These studies are listed in Table 6.
Zero Waste Europe Reusable vs single-use packaging Reloop
Paper Market Packaging Classification
Packaging type
General Outcome
[31] B2C Zero Waste Bottle Positive after 10 times
[28] B2B Transit Crate Negative
[10] B2C Returnable Bottle Mix of reusable and disposable
[13] B2B Transit Crate Positive
[16] B2B Transit Crate Negative
[17] B2C Returnable Bottle Positive
[20] B2B Transit Bucket Positive
[23] B2C Returnable Cup Negative
[21] B2B Transit Crate Positive environmentally but failed economically
[22] B2B Transit Crate Mix of reusable and disposable

67
Zero Waste Europe Reusable vs single-use packaging Reloop
[24] B2B Transit Crate Positive
[25] B2C Returnable Bottle Positive
[26] B2C Returnable Bottle Positive
[27] B2C Returnable Bottle Positive if the distance is lower than 100km
[29] B2C Returnable Jars Positive
[30] B2C Returnable Bottle Positive
[42] B2B Transit Transit Packaging
Positive
[43] B2C Returnable Food Container
Positive after 15 uses
[49] B2C Zero Waste Cup Positive
[50] B2C Transit Carrier bags Positive after 10 uses
[51] B2C Returnable Keg Positive
[52] B2B Zero Waste Bulk Dispenser
Mix. For some dispensers can increase the waste and emissions.
[53] B2C Returnable Food Container
Positive after 3 to 39 uses for PP. For PP Tupperware food savers from 16 to 208 uses.
[54] B2C Returnable Cup Positive
[55] B2C Zero Waste; Returnable
Bottle Negative
[56] B2B Transit Transit Packaging
Negative environmentally and economically
[57] B2C Zero Waste Cup Positive if the cup is reused between washes
[58] B2B Transit Drums Positive

68
Table 4: Papers that passed the selection criteria and were used in this report classified by Market 2B or B2C, Packaging Classification according to [9], packaging type and General Outcome.
Table 5: Studies excluded from this report due to not fulfilling the selection criteria, analysis quality, or due to the Zero Waste Europe Reusable vs single-use packaging Reloop
[59] B2B Transit Transit Packaging
Positive
[60] B2B Transit Transit Packaging
Positive environmentally but failed economically
[61] B2B Transit Crate Positive
[62] B2B Transit Crate Positive
Papers Market Packaging Classification
Sector Reason why the study was excluded
[63] B2B Transit Food The different packaging was not assessed by a fair comparison
[64] B2C Other Other Specific tableware for aviation
[65] B2C Returnable Beverage Streamlined LCA
[66] B2B Transit Other Not an LCA
[67] B2B Transit Logistics Not an LCA
[68] B2C Transit Food Thesis
[69] B2C Refill Parent Packaging
Cleaning Streamlined LCA
[70] B2B Transit Logistics Specific to LCD and not LCA
[71] B2B Transit Logistics Streamlined LCA
[72] B2B Transit Logistics Not LCA
[73] B2B Returnable Beverage Focuses more on different circularity measures than on the LCA of reusable and single-use packaging itself.
[74] B2C Returnable Beverage Assumptions around the number of cycles are not clear

69
packaging studied judged not relevant for this report.
Table 6: Studies that were not included in this report for comparing reusable options or number of cycles.
Zero Waste Europe Reusable vs single-use packaging Reloop
Papers Market Packaging Classification
Sector Packaging analysed
[32] B2B Transit Logistics Reusable plastic crates and numbers of use
[75] B2B Transit Logistics Intermediate Bulk Container: high-density polyethene (HDPE) container (the “bottle”)
[76] B2C Zero Waste Food Reusable plastic versus glass food savers
[77] B2B Transit Logistics Wooden Pallets

70
REFERENCES [1] K. R. Berger, “A Brief History of Packaging,” PNH GPI-Linked Proteins, pp. 1–20, 2005.
[2] S. J. Risch, “Food Packaging History and Innovations,” J. Agric. Food Chem., vol. 57, no. 18, pp. 8089–8092, 2009.
[3] P. Portas, “Recycling and resource recovery under the Basel Convention: Historical analysis and outlook,” Waste Manag. Green Econ. Law Policy, pp. 56–79, 2016.
[4] World Economic Forum, “The New Plastics Economy: Rethinking the future of plastics,” World Econ. Forum, vol. 1, no. January, pp. 1–36, 2016.
[5] J. Kirchherr, D. Reike, and M. Hekkert, “Conceptualizing the circular economy: An analysis of 114 definitions,” Resour. Conserv. Recycl., vol. 127, no. April, pp. 221–232, 2017.
[6] J. Potting, M. Hekkert, E. Worrell, and A. Hanemaaijer, “Circular Economy: Measuring innovation in the product chain - Policy report,” PBL Netherlands Environ. Assess. Agency, no. 2544, p. 42, 2016.
[7] Reloop Platform, “Deposit Return System: System Performance,” 2020.
[8] B. Corona, L. Shen, D. Reike, J. Rosales Carreón, and E. Worrell, “Towards sustainable development through the circular economy—A review and critical assessment on current circularity metrics,” Resour. Conserv. Recycl., vol. 151, no. September, p. 104498, 2019.
[9] P. M. Coelho, B. Corona, R. ten Klooster, and E. Worrell, “Sustainability of reusable packaging–Current situation and trends,” Resour. Conserv. Recycl. X, vol. 6, no. March, p. 100037, 2020.
[10] D. Amienyo, H. Gujba, H. Stichnothe, and A. Azapagic, “Life cycle environmental impacts of carbonated soft drinks,” Int. J. Life Cycle Assess., vol. 18, no. 1, pp. 77–92, 2013.
[11] L. Rigamonti, S. E. Taelman, S. Huysveld, S. Sfez, K. Ragaert, and J. Dewulf, “A step forward in quantifying the substitutability of secondary materials in waste management life cycle assessment studies,” Waste Manag., vol. 114, pp. 331–340, 2020.
[12] D. Civancik-Uslu, R. Puig, M. Hauschild, and P. Fullana-i-Palmer, “Life cycle assessment of carrier bags and development of a littering indicator,” Sci. Total Environ., vol. 685, pp. 621–630, 2019.
[13] R. Abejón, A. Bala, I. Vázquez-Rowe, R. Aldaco, and P. Fullana-i-Palmer, “When plastic packaging should be preferred: Life cycle analysis of packages for fruit and vegetable
Zero Waste Europe Reusable vs single-use packaging Reloop

71
distribution in the Spanish peninsular market,” Resour. Conserv. Recycl., vol. 155, no. November 2019, p. 104666, 2020.
[14] H. Lewis, K. Verghese, and L. Fitzpatrick, “Evaluating the sustainability impacts of packaging: the plastic carry bag dilemma,” Packag. Technol. Sci., vol. 29, no. January, pp. 399–412, 2010.
[15] D. F. Ciambrone, Environmental life cycle analysis. 2018.
[16] M. Levi, S. Cortesi, C. Vezzoli, and G. Salvia, “A Comparative Life Cycle Assessment of Disposable and Reusable Packaging for the Distribution of Italian Fruit and Vegetables,” Packag. Technol. Sci., vol. 24, no. 7, pp. 387–400, 2011.
[17] C. Tua, M. Grosso, and L. Rigamonti, “Reusing glass bottles in Italy: A life cycle assessment evaluation,” Procedia CIRP, vol. 90, pp. 192–197, 2020.
[18] A. McKinnon, S. Cullinane, M. Browne, and A. Whiteing, Green Logistics: Improving the Environmental Sustainability of Logistics, vol. 31, no. 4. 2011.
[19] A. McKinnon, “CO 2 Emissions from Freight Transport in the UK : Report prepared for the Climate Change Working Group of the Commission for Integrated Transport CO 2 Emissions from Freight Transport in the UK Report prepared for the Climate Change Working Group of the C,” no. N.A., p. N.A., 2017.
[20] M. Boschiero, D. Zanotelli, F. E. Ciarapica, L. Fadanelli, and M. Tagliavini, “Greenhouse gas emissions and energy consumption during the post-harvest life of apples as affected by storage type, packaging and transport,” J. Clean. Prod., vol. 220, pp. 45–56, 2019.
[21] R. Accorsi, A. Cascini, S. Cholette, R. Manzini, and C. Mora, “Economic and environmental assessment of reusable plastic containers: A food catering supply chain case study,” Int. J. Prod. Econ., vol. 152, pp. 88–101, 2014.
[22] M. Bertolini, E. Bottani, G. Vignali, and A. Volpi, “Analysis and life cycle comparison of different packaging systems in the aseptic beverages sector,” Proc. Summer Sch. Fr. Turco, vol. 11-13-Sept, pp. 185–190, 2013.
[23] N. Garrido and M. D. Alvarez del Castillo, “Environmental evaluation of single-use and reusable cups,” Int. J. Life Cycle Assess., vol. 12, no. 4, pp. 252–256, 2007.
[24] S. Albrecht et al., “An extended life cycle analysis of packaging systems for fruit and vegetable transport in Europe,” Int. J. Life Cycle Assess., vol. 18, no. 8, pp. 1549–1567, 2013.
[25] H. J. Ponstein, A. Meyer-Aurich, and A. Prochnow, “Greenhouse gas emissions and
Zero Waste Europe Reusable vs single-use packaging Reloop

72
mitigation options for German wine production,” J. Clean. Prod., vol. 212, pp. 800–809, 2019.
[26] J. Cleary, “Life cycle assessments of wine and spirit packaging at the product and the municipal scale: A Toronto, Canada case study,” J. Clean. Prod., vol. 44, pp. 143–151, 2013.
[27] C. Ferrara and G. De Feo, “Comparative life cycle assessment of alternative systems for wine packaging in Italy,” J. Clean. Prod., vol. 259, p. 120888, 2020.
[28] S. Koskela, H. Dahlbo, J. Judl, M. R. Korhonen, and M. Niininen, “Reusable plastic crate or recyclable cardboard box? A comparison of two delivery systems,” J. Clean. Prod., vol. 69, pp. 83–90, 2014.
[29] L. Postacchini, G. Mazzuto, C. Paciarotti, and F. E. Ciarapica, “Reuse of honey jars for healthier bees: Developing a sustainable honey jars supply chain through the use of LCA,” J. Clean. Prod., vol. 177, pp. 573–588, 2018.
[30] B. Simon, M. Ben Amor, and R. Földényi, “Life cycle impact assessment of beverage packaging systems: Focus on the collection of post-consumer bottles,” J. Clean. Prod., vol. 112, pp. 238–248, 2016.
[31] S. Nessi, L. Rigamonti, and M. Grosso, “Waste prevention in liquid detergent distribution: A comparison based on life cycle assessment,” Sci. Total Environ., vol. 499, no. 1, pp. 373–383, 2014.
[32] C. Tua, L. Biganzoli, M. Grosso, and L. Rigamonti, “Life cycle assessment of reusable plastic crates (RPCs),” Resources, vol. 8, no. 2, 2019.
[33] Zero Waste Europe, “Deposit Return Scheme Manifesto,” 2019.
[34] Zero Waste Europe, “The story of recircle,” pp. 1–8, 2018.
[35] Zero Waste Europe, “The Story of RePack,” 2019.
[36] J. Morris and C. Morawski, “Returning to Work - Understanding the Domestic Jobs Impact from Different Methods of Recycling Beverage Containers,” no. December, pp. 20–21, 2011.
[37] D. R. Cooper and T. G. Gutowski, “The Environmental Impacts of Reuse: A Review,” J. Ind. Ecol., vol. 21, no. 1, pp. 38–56, 2017.
[38] N. M. P. Bocken, I. Pauw, C. Bakkera, and B. van der Grinten, “Product design and business model strategies for a circular economy,” J. Ind. Prod. Eng., vol. 33(5), 308, 2016.
Zero Waste Europe Reusable vs single-use packaging Reloop

73
[39] A. Mestre and T. Cooper, “Circular Product Design. A Multiple Loops Life Cycle Design Approach for the Circular Economy,” Des. J., vol. 20, no. sup1, pp. S1620–S1635, 2017.
[40] Y. D. Ko, I. Noh, and H. Hwang, “Cost benefits from standardization of the packaging glass bottles,” Comput. Ind. Eng., vol. 62, no. 3, pp. 693–702, 2012.
[41] H. Min, H. J. Ko, Y. K. Lim, J. W. Park, and Y. K. Cho, “Challenges and opportunities for logistics standardisation in Asia-Pacific countries: A descriptive case study,” Int. J. Logist. Syst. Manag., vol. 17, no. 3, pp. 357–380, 2014.
[42] K. N. Goellner and E. Sparrow, “An environmental impact comparison of single-use and reusable thermally controlled shipping containers,” Int. J. Life Cycle Assess., vol. 19, no. 3, pp. 611–619, 2014.
[43] M. F. Harnoto, “A Comparative Life Cycle Assessment of Compostable and Reusable Takeout Clamshells at the University of California, Berkeley,” Univ. California, Berkeley, 2013.
[44] G. Villalba, M. Segarra, J. M. Chimenos, and F. Espiell, “Using the recyclability index of materials as a tool for design for disassembly,” Ecol. Econ., vol. 50, no. 3–4, pp. 195–200, 2004.
[45] Glass Packaging Institute, “Glass Recycling Facts.” [Online]. Available: https://www.gpi.org/glass-recycling-facts.
[46] B. Glass and S. Yorkshire, “Maximising the recyclability of glass packaging,” vol. 44, no. 539065, 2018.
[47] G. Villalba, M. Segarra, A. I. Fernández, J. M. Chimenos, and F. Espiell, “A proposal for quantifying the recyclability of materials,” Resour. Conserv. Recycl., vol. 37, no. 1, pp. 39–53, 2002.
[48] M. Klinglmair, S. Sala, and M. Brandão, “Assessing resource depletion in LCA: A review of methods and methodological issues,” Int. J. Life Cycle Assess., vol. 19, no. 3, pp. 580–592, 2014.
[49] L. Woods and B. R. Bakshi, “Reusable vs. disposable cups revisited: Guidance in life cycle comparisons addressing scenario, model, and parameter uncertainties for the US consumer,” Int. J. Life Cycle Assess., vol. 19, no. 4, pp. 931–940, 2014.
[50] D. Civancik-Uslu, R. Puig, L. Ferrer, and P. Fullana-i-Palmer, “Influence of end-of-life allocation, credits and other methodological issues in LCA of compounds: An in-company circular economy case study on packaging,” J. Clean. Prod., vol. 212, pp.
Zero Waste Europe Reusable vs single-use packaging Reloop

74
925–940, 2019.
[51] M. Cordella, A. Tugnoli, G. Spadoni, F. Santarelli, and T. Zangrando, “LCA Case Studies LCA of an Italian Lager Beer,” Int. J., vol. 13, no. 2, pp. 133–139, 2008.
[52] G. Dolci, S. Nessi, L. Rigamonti, and M. Grosso, “Life cycle assessment of waste prevention in the delivery of pasta, breakfast cereals, and rice,” Integr. Environ. Assess. Manag., vol. 12, no. 3, pp. 445–458, 2016.
[53] A. Gallego-Schmid, J. M. F. Mendoza, and A. Azapagic, “Environmental impacts of takeaway food containers,” J. Clean. Prod., vol. 211, no. 2019, pp. 417–427, 2019.
[54] T. N. Ligthart and B. D. Foundation, “Single use Cups or Reusable (coffee) Drinking Systems: An Environmental Comparison,” Netherlands Organ. Appl. Sci. Res., p. 121, 2007.
[55] S. Nessi, L. Rigamonti, and M. Grosso, “LCA of waste prevention activities: A case study for drinking water in Italy,” J. Environ. Manage., vol. 108, pp. 73–83, 2012.
[56] H. Pålsson, C. Finnsgård, and C. Wänström, “Selection of Packaging Systems in Supply Chains from a Sustainability Perspective: The Case of Volvo,” Packag. Technol. Sci., vol. 26, no. 5, pp. 289–310, 2013.
[57] J. Potting and E. van der Harst, “Facility arrangements and the environmental performance of disposable and reusable cups,” Int. J. Life Cycle Assess., vol. 20, no. 8, pp. 1143–1154, 2015.
[58] M. Raugei, P. Fullana-i-Palmer, R. Puig, and A. Torres, “A comparative life cycle assessment of single-use fibre drums versus reusable steel drums,” Packag. Technol. Sci., vol. 22, no. 8, pp. 443–450, 2009.
[59] S. Ross and D. Evans, “The environmental effect of reusing and recycling a plastic-based packaging system,” J. Clean. Prod., vol. 11, no. 5, pp. 561–571, 2003.
[60] D. A. L. Silva, G. W. S. Renó, G. Sevegnani, T. B. Sevegnani, and O. M. S. Truzzi, “Comparison of disposable and returnable packaging: A case study of reverse logistics in Brazil,” J. Clean. Prod., vol. 47, pp. 377–387, 2013.
[61] S. P. Singh, V. Chonhenchob, and J. Singh, “Life cycle inventory and analysis of re-usable plastic containers and display-ready corrugated containers used for packaging fresh fruits and vegetables,” Packag. Technol. Sci., vol. 19, no. 5, pp. 279–293, 2006.
[62] C. Tua, S. Nessi, L. Rigamonti, G. Dolci, and M. Grosso, “Packaging waste prevention in the distribution of fruit and vegetables: An assessment based on the life cycle
Zero Waste Europe Reusable vs single-use packaging Reloop

75
perspective,” Waste Manag. Res., vol. 35, no. 4, pp. 400–415, 2017.
[63] A. Bernstad Saraiva et al., “Comparative lifecycle assessment of mango packaging made from a polyethylene/natural fiber-composite and from cardboard material,” J. Clean. Prod., vol. 139, pp. 1168–1180, 2016.
[64] G. Blanca-Alcubilla, A. Bala, N. de Castro, R. Colomé, and P. Fullana-i-Palmer, “Is the reusable tableware the best option? Analysis of the aviation catering sector with a life cycle approach,” Sci. Total Environ., vol. 708, p. 135121, 2020.
[65] S. Boesen, N. Bey, and M. Niero, “Environmental sustainability of liquid food packaging: Is there a gap between Danish consumers’ perception and learnings from life cycle assessment?,” J. Clean. Prod., vol. 210, pp. 1193–1206, 2019.
[66] V. Chonhenchob and S. P. Singh, “A Comparison of Corrugated Boxes and Reusable Plastic Containers for Mango Distribution,” Packag. Technol. Sci., vol. 16, no. 6, pp. 231–237, 2003.
[67] V. Chonhenchob, D. Kamhangwong’, and S. P. Singh, “Comparison of reusable and single-use plastic and paper shipping containers for distribution of fresh pineapples,” Packag. Technol. Sci., vol. 21, no. 2, pp. 73–83, 2008.
[68] H. E. Guðmundsson, “Plastic packaging in meal kits: A life-cycle comparison of reusable and single-use packaging,” University of Iceland, 2019.
[69] S. Kunamaneni, S. Jassi, and D. Hoang, “Promoting reuse behaviour: Challenges and strategies for repeat purchase, low-involvement products,” Sustain. Prod. Consum., vol. 20, pp. 253–272, 2019.
[70] T. C. Kuo, M. C. Chiu, W. H. Chung, and T. I. Yang, “The circular economy of LCD panel shipping in a packaging logistics system,” Resour. Conserv. Recycl., vol. 149, no. June, pp. 435–444, 2019.
[71] S. G. Lee and X. Xu, “A Simplified Life Cycle Assessment of Re-usable and Single-use Bulk Transit Packaging,” Packag. Technol. Sci., vol. 17, no. 2, pp. 67–83, 2004.
[72] P. Menesatti, E. Canali, G. Sperandio, G. Burchi, G. Devlin, and C. Costa, “Cost and Waste Comparison of Reusable and Disposable Shipping Containers for Cut Flowers,” Packag. Technol. Sci., vol. 25, no. 4, pp. 203–215, 2012.
[73] M. Niero and P. P. Kalbar, “Coupling material circularity indicators and life cycle based indicators: A proposal to advance the assessment of circular economy strategies at the product level,” Resour. Conserv. Recycl., vol. 140, no. October 2018, pp. 305–312, 2019.
Zero Waste Europe Reusable vs single-use packaging Reloop

76
[74] T. M. Mata and C. A. V. Costa, “Life cycle assessment of different reuse percentages for glass beer bottles,” Int. J. Life Cycle Assess., vol. 6, no. 5, pp. 307–319, 2001.
[75] L. Biganzoli, L. Rigamonti, and M. Grosso, “Intermediate Bulk Containers Re-use in the Circular Economy: An LCA Evaluation,” Procedia CIRP, vol. 69, no. May, pp. 827–832, 2018.
[76] A. Gallego-Schmid, J. M. F. Mendoza, and A. Azapagic, “Improving the environmental sustainability of reusable food containers in Europe,” Sci. Total Environ., vol. 628–629, no. 2018, pp. 979–989, 2018.
[77] C. M. Gasol, R. Farreny, X. Gabarrell, and J. Rieradevall, “Life cycle assessment comparison among different reuse intensities for industrial wooden containers,” Int. J. Life Cycle Assess., vol. 13, no. 5, pp. 421–431, 2008
Zero Waste Europe Reusable vs single-use packaging Reloop

77
Authors:
Patricia Megale Coelho – Utrecht University
Blanca Corona – Utrecht University
Ernst Worrell – Utrecht University
Contributors:
Larissa Copello – Zero Waste Europe
Clarissa Morawski – Reloop
Joan Marc Simon – Zero Waste Europe
Nathan Dufour – Zero Waste Europe
Enzo Favoino – Zero Waste Europe
Kaisa Karjalainen – Zero Waste Europe
Justine Maillot – Rethink Plastic alliance
Alba Cabrera - Rezero
Editor:
Rossella Recupero - Zero Waste Europe
Design & layout:
Rossella Recupero - Zero Waste Europe
Cover and last page: Noble.Studio
Reloop & Zero Waste Europe, December 2020
Zero Waste Europe Reusable vs single-use packaging Reloop

78
Zero Waste Europe is the European network of communities, local leaders, experts, and change agents working towards the elimination of waste in our society. We advocate for sustainable systems and the redesign of our relationship with resources, to accelerate a just transition towards zero waste for the benefit of people and planet.
Reloop is an international non-profit organisation that brings together industry, government and NGOs who share a vision of a thriving global circular economy - a system where resources are kept in continuous use and waste and pollution are eliminated. Our broad network seeks to bring about positive change at all levels of resource and waste policy. We want a world free of pollution, where an ambitious and integrated circular economy allows our precious resources to remain resources, so that people, businesses and nature can flourish.
Zero Waste Europe gratefully acknowledges financial assistance from the European Union. The sole responsibility for the content of this event materials lies with Zero Waste Europe. It does not necessarily reflect the opinion of the funder mentioned above. The funder cannot be held responsible for any use that may be made of the information contained therein.
Zero Waste Europe gratefully acknowledges financial assistance from the MAVA foundation. The sole responsibility for the content of this event materials lies with Zero Waste Europe. It does not necessarily reflect the opinion of the funder mentioned above. The funder cannot be held responsible for any use that may be made of the information contained therein.
Zero Waste Europe Reusable vs single-use packaging Reloop

16