Embed Size (px)
Citation preview

MONTHLY
( M i M M K e t / i e u t
FEDERAL RESERVE BANK of CLEVELAND—
I N T H I S I S S U E
Why Didn’t Business Borrow More in ’54? 2
Agriculture During 1954 ................. 7
Annual Index to Monthly Business Review 11
High-Speed Handling of Business Data 1 2
•Commercial, industrial, and agricultural loans at weekly reporting member banks in leading cities.
Digitized for FRASER http://fraser.stlouisfed.org/ Federal Reserve Bank of St. Louis
Why Didn’t Business Borrow More in '54?
BANK LOANS to business and industry are often watched as one barometer of
economic activity. The recent sluggishness in business loans of commercial banks raises questions about the state of economic recovery and about competition between bank and non-bank sources of business credit. The discussion and charts which follow are designed to give some perspective on the factors which have been influencing the demand for business loans.
The proceeds of business loans are used largely, but by no means entirely, for shortterm working capital purposes. Such loans usually tend to expand in the second half of the year, as a result of the building up of stocks by wholesalers and retailers for autumn and Christmas trade, seasonal borrowing by food processors and commodity dealers, and other seasonal factors.
Commercial and industrial loans at weekly reporting member banks throughout the United States rose about $2% billion in the second half of 1951 and nearly $2y2 billion in the same period in 1952.1 In 1953, because of the recession that began about midyear, the rise in business loans during the second half was less than $500 million. In 1954, however, business loans fell by more than $300 million in the third quarter, and by early November they had barely recovered to the mid-year level. In view of the fact that economic recovery is believed to be under way, the failure of business loans in recent months to match even the relatively weak showing of 1953 has seemed surprising.
(1) These figures refer to commercial and industrial loans at a sample of weekly reporting member banks that report changes in their larger loans.
Factors Affecting Business Loans
The two most important reasons for the sluggish behavior of business loans appear to have been inventory liquidation in particular and the change in corporate financing requirements in general.
Inventories. The very close relation which prevailed between business loans and business inventories after World War II is portrayed on the cover chart.2 The relative changes in business loans and inventories were very similar, both in amount and timing, during the early postwar expansion and during the 1949 recession.
Under the stimulus of the Korean war, both business loans and inventories rose sharply starting in August, 1950. In terms of relative change, the two series moved together until the last quarter of 1951, when loans began to rise relatively faster and then went well ahead of inventories in the second half of 1952.
The most probable explanation of the above development is that business loans in the Korean war period included an unusually large volume of capital loans, as opposed to loans for inventory purposes. With the rapid build-up of plant and equipment expenditures, there appears to have been considerable reliance on bank loans for con
(2) Data on outstanding commercial and industrial loans is available only for call report dates, even though the net change in such loans is available weekly for selected member banks. Hence the “business” loans shown on the cover chart include agricultural as well as commercial and industrial loans. It is not believed, however, that the inclusion of agricultural loans significantly changes the relationship between total business loans and business inventories.
The last date plotted is the end of September, since business inventory figures subsequent to September were not available at publication time.
2
Digitized for FRASER http://fraser.stlouisfed.org/ Federal Reserve Bank of St. Louis

struction and other capital purposes. Such loans, made for the purpose of getting started on new fixed capital expenditures, tend to be replaced at a later date with permanent financing from either internal or external sources. As a further factor, some companies may have been carrying larger- than-normal bank loans in this period in order to broaden their excess-profits tax base.
By mid-1953 the gap between business loans and inventories had closed somewhat, and it remained about the same until March of this year. Since then business loans have fallen relatively faster than inventories. The two series now appear to be resuming the closer relationship that prevailed from 1946 through 1951.
Compared with a year ago, business loans at the end of September were down 9 percent, while inventories had declined 5 percent in the same period. While not the only factor at work, inventory liquidation during this period appears to have been the principal force in the reduction of business loans.
The $4.3 billion reduction in total business inventories in the year ended in September was concentrated in manufacturers’ inventories, which accounted for nearly $3.5 billion of the decline.3 It is therefore to be expected that the largest drop in business loans was to manufacturing firms, as discussed below. The decline during the same period in retail inventories was less than $600 million, and in wholesale trade less than $300 million.
Over 80 percent of the total decline in manufacturing inventories occurred in dura- ble-goods lines, especially the metals industry. One important factor in the decline of durable-goods inventories was the slackening in consumer purchases of durables in the recession that began in mid-1953. A second factor was the downturn in Federal spending in the same period, particularly in national security outlays, which account for about five-sixths of total Federal outlays. The book value of inventories of durable-goods manufacturers had nearly doubled from
(3) Based on book-value data, U. S. Department of Com merce.
January 1950 to September 1953. Large increases in inventories had been necessary to support enlarged consumer demand as well as rising defense expenditures for military hard goods.
The cutback in consumer purchases of durable goods, coinciding with the cutback in munitions schedules, resulted in a sharp reduction in inventories of durables which was reflected in declining business loans. The shift from expansion to decline in inventories and business loans was especially sharp among metal and metal products firms. Although the decline in inventories of these firms did not begin until January of this year, loans started to shrink in mid-1953, indicating that factors other than inventories were responsible for shrinking loans. The discussion which follows may throw more light on this matter.
Changes in Corporate Financing Requirements. While bank loans to corporations have been on the decline since last year, other debt of corporations has continued to increase. This development is portrayed in an accompanying chart applying to manufacturing corporations, for which the contrast be-
Since early ’S3, manufacturing corporations have repaid bank loans but continued to increase their non-bank debt.
Billions MANUFACTURING CORPORATIONS
1 9 5 0 1951 1 9 5 2 1 9 5 3 ^ * 1 9 5 4
3
Digitized for FRASER http://fraser.stlouisfed.org/ Federal Reserve Bank of St. Louis
PRINCIPAL SOURCES AND USES OF CORPORATE FUNDS*
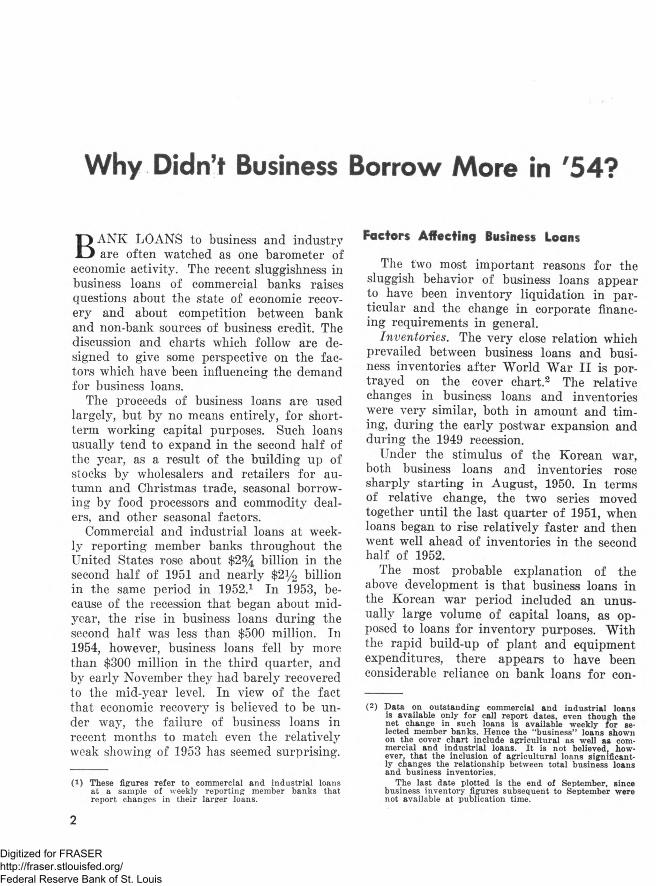
In the two years ending with mid-1954, short-term borrowing of corporations followed the movement of inventories and receivables. Funds raised through the capital market increased in both years, however, as capital spending continued at a high level.
20
Yeor Ended Ju n e 3 0 , 1953(B il l io n s o f D o l la r s )
SOURCES USES15 10 5 0 5 10 15 20 25 I i 1
INCREASE IN INVENTORIES AND ACCOUNTS RECEIVABLE
INCREASE JN BANK LOANS AND TRADE PAYABLES
DECREASE IN FEDERAL INCOME TAX LIAB IL ITY
DECREASE IN CASH AND U. S. SECU R IT IES
PLANT AND EQUIPMENT EXPENDITURES
NET NEW SECURITY ISSU ES AND MORTGAGES
RETAINED PROFITS AND DEPRECIATION
Y ear E n d e d June 30 ,1954( B i l l io n s o f D o lla rs )
SOURCES USES15 10 5 0 5 10 15 20 25
DECREASE IN INVENTORIES AND ACCOUNTS RECEIVABLE
DECREASE IN BANK LOANS AND TRADE PAYABLES
DECREASE IN FEDERAL INCOME TAX LIABILITY
DECREASE IN CASH AND U. S. SECUR IT IES
PLANT AND EQUIPMENT EXPENDITURES
NET NEW SECURITY ISSUES AND MORTGAGES
RETAINED PROFITS AND DEPRECIATION
‘ Excludes banks and insurance companies.
tween the movement of loans and other debt has been the sharpest. Bank loans to manufacturing corporations reached a peak in March, 1953, and by mid-1954 had declined about 23 percent. In the same period, however, the long-term debt of manufacturing corporations rose by 14 percent.
Such a decline in business loans, coupled with a sizeable increase in new corporate security issues and mortgages, poses a fundamental question of interpretation. Has nonbank credit been substituted for bank credit in meeting the same type of financing needs? Or has the shift come about because of a change in the types of financing requirements'? Available evidence points mainly to the latter explanation, although there are exceptions which will be noted later.
To the extent that internal sources of funds (mainly retained earnings and depre
ciation allowances) are insufficient to meet total requirements, external financing becomes necessary. In raising outside funds, there is a general tendency to finance working capital needs with bank loans and trade credit, and to finance fixed capital needs with security issues and mortgages. Over the past year, in contrast to the previous several years, needs for short-term credit declined. At the same time the need for long-term capital continued to grow. Therefore bank credit extended to corporations declined at the same time that corporate demands on the capital market continued at a high level.
The explanation of the above development is brought out more fully in an accompanying chart, which compares the principal sources and uses of corporate funds in the years ending at mid-1953 and mid-1954.
In the first year, the expansion of inven-
4
Digitized for FRASER http://fraser.stlouisfed.org/ Federal Reserve Bank of St. Louis
tories and accounts receivable, as well as the reduction of income tax liabilities, absorbed over $11 billion of funds, about half of which was provided through an expansion of bank loans and trade payables. The balance of short-term needs, as well as the financing of nearly $23 billion in plant and equipment expenditures, was provided mainly through retained profits, depreciation allowances, and an increase in security issues and mortgages.
During the year ended at mid-1954, by way of contrast, inventories and accounts receivable declined by $4.8 billion; in addition, corporate holdings of cash and U. S. Government securities were drawn down by $3 billion. The reductions in the above current assets provided most of the funds to reduce major items of current liabilities, i.e., bank loans and trade credit to the extent of $4.4 billion, and income tax liabilities by $4 billion. On the other hand, the continuation of plant and equipment expenditures at nearrecord levels made necessary further external long-term financing in the form of securities and mortgages, as a supplement to retained earnings and depreciation allowances. Thus, mainly because of a decline in short-term financing needs and a further increase in long-term requirements, bank loans declined at the same time that corporate security issues increased.
Changes in Business Loans by Industry
Further insight into the recent behavior of total business loans can be obtained by examining changes in loans to particular groups of industries. A chart on the following page shows such changes since mid-year, both for the country as a whole and for the Fourth Federal Reserve District.
Areas of Decline. The biggest net repayment of loans, both in the U. S. and the District, has come from the metals group of industries. Under the stimulus of the defense emergency, this group had increased its borrowings by over $2^2 billion from June 1951 to June 1953. With the passing of the emergency, the bank loans outstanding to metals firms have declined persistently since mid-
1953, wiping out more than half of the initial increase. The cutback in loans was due mainly to inventory reduction but partly to refinancing outside banks (for reasons discussed below). Thus far in the second half of 1954, metals firms have repayed over $500 million in bank loans nationally and over $50 million in the Fourth District, where metal products are an important industry.
Public utilities have also shown a substantial reduction in bank loans since mid-year, although the decline has not been as sharp in the District as in the nation. Borrowing of public utilities (partly for tax purposes) reached a peak in June of this year and has since declined by nearly $250 million.
In the case of the metals industries, and to a lesser extent, public utilities, the increased borrowings during the Korean war appear to have been undertaken in part for the purpose of getting started quickly with plant expansion and renovation and purchases of machinery and equipment. The later replacement of construction and other temporary capital loans with new security issues is a standard financing procedure. This practice cannot be regarded as a true case of substituting other credit for bank credit for the same financing requirement.
The third major area of decline in business loans since mid-year has been repayments of loans by sales finance companies, which specialize mainly in the instalment financing of autos and other consumers’ durables. The borrowing of sales finance companies reached a peak in the second quarter of 1953 and has since been on the decline. This development reflects both the reduced purchases of cars during the recession, as well as some tendency for sales finance companies to replace bank borrowing with funds from non-bank sources. Direct sales of notes to non-bank investors, as well as borrowing through open-market commercial paper, constitute important sources of funds to sales finance companies, in addition to their loans from banks. Sales finance companies appear to represent the only true case of substitution of other credit for bank credit in meeting the same financing need. The substitu-
5
Digitized for FRASER http://fraser.stlouisfed.org/ Federal Reserve Bank of St. Louis

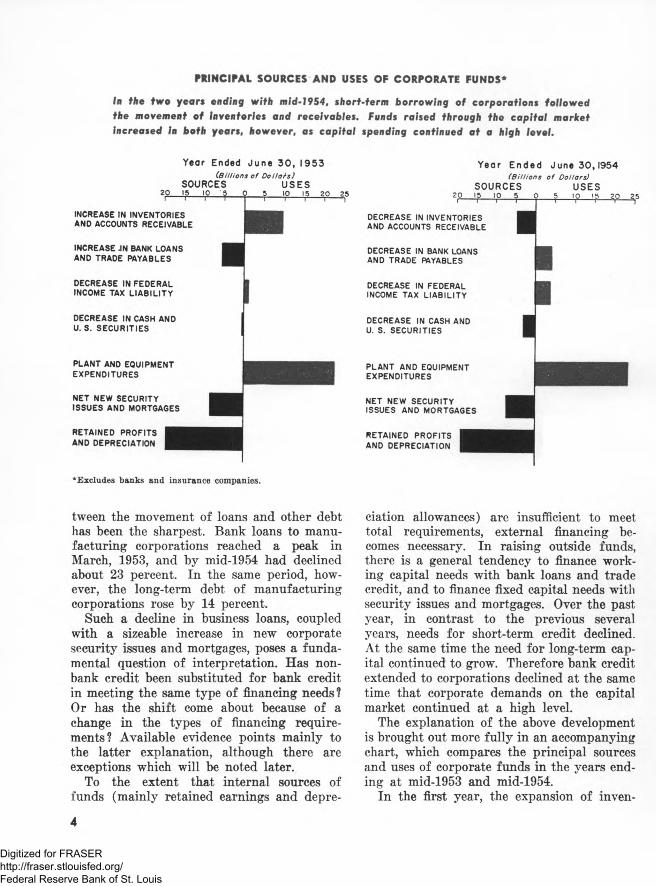
la the U. 5. since mid-year, repayments of business loans by metals firms, public utilities, and sales finance companies have nearly offset the seasonal pickup in other loans.Fourth District banks have shared in the major declines but not the increases.
Net Change in Business Loans, June 30 -Nov. 10,1954 ^UNITE D S T A T E S(M illions of Dollars)
-500 -400 -300 -200 -100 0 +100 >2 0 0 +300+400
BUSINESS OF BORROWER
MANUFACTURING AND MINING*.
METALS AND M ETAL PRODUCTS
OTHER MANUFACTURING AND MINING
PETROLEUM, COAL, CHEMICALS, RUBBER
TEXTILES, APPAREL, LEATHER
FOOD, LIQUOR, AND TOBACCO
SALES FINANCE COMPANIES
PUBLIC U T IL IT IE S , TRANSPORTATION
CO N S TR U C TIO N
OTHER TYPES OF BUSINESS
T R A D E - -W H O L E S A L E AND R E T A IL
COMM ODITY DEALERS
N E T C H A N G E , A L L B O R R O W E R S
* Based on a sample of member banks that report changes in their large loans to industry. **Less than $500 thousand increase.
FOU RT H D I S T R I C T(Millions of Dollars)
* *
tion was probably undertaken because of more favorable borrowing costs outside the banking system.
Areas of Increase. The three groups showing a substantial increase in business loans since mid-year on a national basis have been food processors, commodity dealers, and wholesale and retail trade. In all three cases the pickup has been largely seasonal.
Loans to commodity dealers, which typically show a marked seasonal peak near the end of the year, have increased almost $400 million in the U. S. since mid-year, but have not shown as much strength, relatively, in the Fourth District. Similarly, the seasonal pickup in the national total of loans to whole
sale and retail trade has not been evident in the District. In the case of food firms, whose borrowings also have a sharp year-end peak, the increase in loans nationally contrasts with a decline in the District. Member banks in the District seem to have participated in the major declines, but not in the major increases, in loans to individual industry groups since mid-year.
Summary
In summary, the recent sluggishness of business loans takes on a somewhat different light when viewed on an industry-by-indu3- try basis. While inventory liquidation was
0Continued on Page 11)
Digitized for FRASER http://fraser.stlouisfed.org/ Federal Reserve Bank of St. Louis
Agriculture During 1954
THE FORTUNES of agriculture reflected elements of prosperity, stability and de
pression during 1954, with marked variation according to commodity lines and geographic areas. Surpluses plagued dairymen and poultrymen, for example, while at the other extreme, soybean growers and hog producers (at least through much of the year) enjoyed a market of shortages relative to demand.
To supplement purely economic considerations, the unpredictable pranks of nature ran the gamut during the course of the year. Drought was rampant throughout the South, plant disease reduced crops in the northern wheat belt, and at various times both flood and high winds unleashed their fury upon farmlands of the East. And yet total agricultural output was the third largest in the nation’s history.
Facts and figures drawn from widely scattered areas of the nation and coupled with those of the vast mid-western heartland of American agriculture combine to form a somewhat illusory impression of near-stability during the year drawing to a close. The averages indicate a moderate downturn in production, prices and income, although they mask very substantial changes which have occurred within the individual components.
Agriculture within the Fourth Federal Reserve District has also been affected by cross currents during 1954. Areas of wide diversification which combine cash crops and meat animal production, such as western Ohio, may well view the results of 1954 in an entirely different light from that seen by the depressed dairymen and poultrymen of the northeastern reaches of the District. In
the middle ground, burley tobacco growers in the bluegrass region of Kentucky (who are heavy contributors to District farm income) suffered anxiety over the effects of drought during the summer, only to be spared a financial hardship by heavy rains in the “ eleventh hour.” Tobacco yields may now prove of near-record proportions, with favorable prices assured by the support program.
On balance, Fourth District agriculture, like the nation’s agriculture, has shown a moderate reduction in cash income.
Average Prices Down Slightly
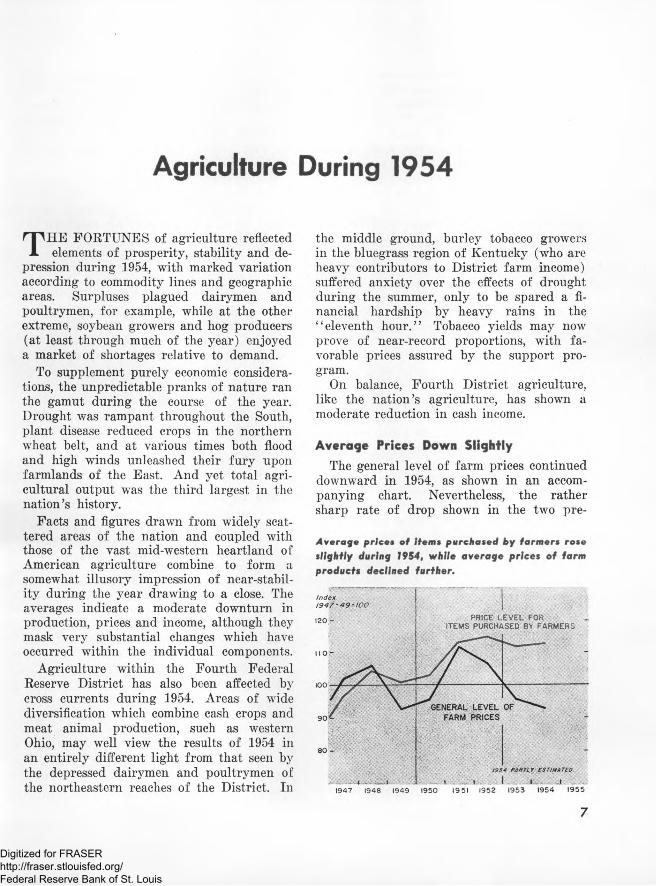
The general level of farm prices continued downward in 1954, as shown in an accompanying chart. Nevertheless, the rather sharp rate of drop shown in the two pre-
Average prices of items purchased by farmers rose slightly during 1954, while average prices of farm products declined further.
In d e x1947-49=PRICE LEVEL FOR
ITEMS PURCHASED BY FARMERS
1947 1948 1949
1 9 5 4 P A R T L t CST ,M ATED.
. .1 ̂ _ JL*.- -J :: ~ 1950 19 51 1952 1953 1954 1955
7
Digitized for FRASER http://fraser.stlouisfed.org/ Federal Reserve Bank of St. Louis

ceding years appears to have been arrested. The moderate price decline in 1954 was enough to bring the annual average virtually to the position of the 1949 recession year.
Of ten commodities contributing more than 80 percent of Fourth District farm income, prices of six appeared steady to stronger than a year ago. An additional three products cleared markets at weak to sharply lower prices. The trend in tobacco prices in the District will not be established until the auction season proceeds further into December.
Hogs and soybeans were in particularly strong hands through the first half of 1954, following reduced production in the preceding season. With the mid-summer advent of seasonally heavy marketings of a bigger pig crop, hog prices were driven moderately below the relatively high 1953 levels. Soybeans followed suit in dropping to 1953 levels by late summer upon the promise of a greatly expanded 1954 crop.
Wheat prices, strongly influenced by support buying, held on a par with a year ago through the opening of the harvest season. As the harvest season progressed, however, wheat prices demonstrated a rather surprising contraseasonal strength despite huge carryovers of old wheat from preceding years. This strength has persisted through the autumn months, presumably due in large part to price-supporting activities of the Commodity Credit Corporation. Many farmers of the District chose to sell on the free market when prices passed $1.90 per bushel. Wheat production on District farms during 1954 was about one-fourth below a year ago; stocks of wheat, as of October 1, were below year-ago by about the same proportion.
Cattle, corn and oats held closely in line with year-ago prices throughout 1954. Normal corn and oats markets were supplemented to some extent by government buying.
On the downside of the price picture, eggs, discarded layers, and broilers literally plummeted from the profitable levels enjoyed by producers during 1953. A decline from year- ago prices ranging between 25 percent and
50 percent prevailed during the bulk of 1954 for eggs and chickens. Broiler prices were 10 to 20 percent lower than in 1953. In each of these segments of the poultry industry, production was boosted during the course of the year and was primarily responsible for the price breaks.
Markets have now been cleared of poultry products without the benefit of any large- scale government buying program. Consumer demand as expressed for these specific products, however, was not strong enough to move the increased output through consumption channels without severe price concessions.
Milk prices continued their downtrend which began several years ago. Although the slippage in milk prices has been held relatively small from year to year (partly by the aid of the price-support program), dairymen have not enjoyed the temporary relief of an intervening high price period as have producers of many other farm commodities. Although milk production has exceeded consumer demand at prices which dairymen consider adequate, dairymen have responded by establishing successive milk production records in 1953 and 1954.
Strong Demand Maintained
Despite a much publicized upswing in unemployment and a reduction in the workweek, consumer income has been well maintained during the course of 1954. Furthermore, the producers and distributors of food and fiber were encouraged by the consumers ’ expressed willingness to buy. Expenditures for products of farm origin have again risen to new record heights, as shown in physical terms by an accompanying chart.
The desire of the American people to eat well and to be well clothed is the mainstay of farm prices. Such a foundation provided by domestic demand, plus a moderate upturn in foreign takings, a slight cut in farm output, and the effects of price support, have combined to provide the necessary strength nearly to halt the cascading farm-price level. Some excesses that will be added to surplus
8
Digitized for FRASER http://fraser.stlouisfed.org/ Federal Reserve Bank of St. Louis
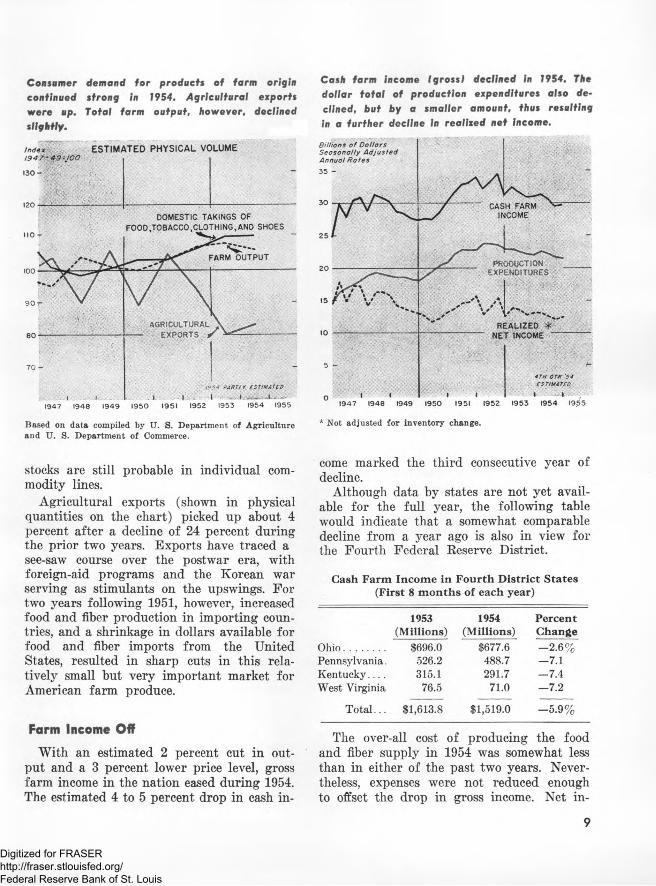
Cash farm income I gross) declined in 1954. The dollar total of production expenditures also declined, but by a smaller amount, thus resulting in a further decline in realized net Income.
* Not adjusted for inventory change.Based on data compiled by U. S. Department of Agriculture and U. S. Department of Commerce.
Consumer demand for products of farm origincontinued strong in 1954. Agricultural exportswere up. Total farm output, however, declined slightly.
Index ESTIMATED PHYSICAL VOLUMEl9 4 7 ~ 4 9 :J O O
DOMESTIC TAKINGS OF.AND SHOES
1947 1948 1949
t PARTlf ESTIMATEDI ■ ---i_, - '̂1- * w
1950 1951 1952 1953 1954 1955
B illions o f D o llo rs Se o so n o lly A d ju ste d Annua l R o te s
35
1947 1948 1949
NET INCOME
4 T H 0 T R 5 4E ST IM A T E D
1950 1951 1952 1953 1954 1955
stocks are still probable in individual commodity lines.
Agricultural exports (shown in physical quantities on the chart) picked up about 4 percent after a decline of 24 percent during the prior two years. Exports have traced a see-saw course over the postwar era, with foreign-aid programs and the Korean war serving as stimulants on the upswings. For two years following 1951, however, increased food and fiber production in importing countries, and a shrinkage in dollars available for food and fiber imports from the United States, resulted in sharp cuts in this relatively small but very important market for American farm produce.
Farm Income Off
With an estimated 2 percent cut in output and a 3 percent lower price level, gross farm income in the nation eased during 1954. The estimated 4 to 5 percent drop in cash in
come marked the third consecutive year of decline.
Although data by states are not yet available for the full year, the following table would indicate that a somewhat comparable decline from a year ago is also in view for the Fourth Federal Reserve District.
Cash Farm Income in Fourth District States (First 8 months of each year)
Ohio...............Pennsylvania. Kentucky. . . . West Virginia
1953(Millions)
$696.0526.2315.1
76.5
1954(Millions)
$677.6488.7291.7
71.0
PercentChange- 2 .6 %—7.1- 7 .4—7.2
T otal. . . $1,613.8 $1,519.0 -5 .9 %
The over-all cost of producing the food and fiber supply in 1954 was somewhat less than in either of the past two years. Nevertheless, expenses were not reduced enough to offset the drop in gross income. Net in
9
Digitized for FRASER http://fraser.stlouisfed.org/ Federal Reserve Bank of St. Louis

come consequently has joined the slow year- to-year slide. Over the nation in total, realized net income to farmers has now dropped for the fourth consecutive year.
Farmers apparently bought smaller physical quantities of production goods in 1954, thus accounting for the decline in total dollar expenditures. Average unit prices paid for these items showed very little change from a year ago.
Farmers' Financial Position
Farmers have maintained a relatively sound financial position even in the face of such setbacks as occurred during the year. Use of credit to finance farm operations has continued to rise, but the total is not at a level relative to income which should be considered alarming. Some repayment problems arise from time to time, but the proportion of loans attaining delinquency status is quite low (at least in the Fourth District) in relation to total farm loan outstandings.
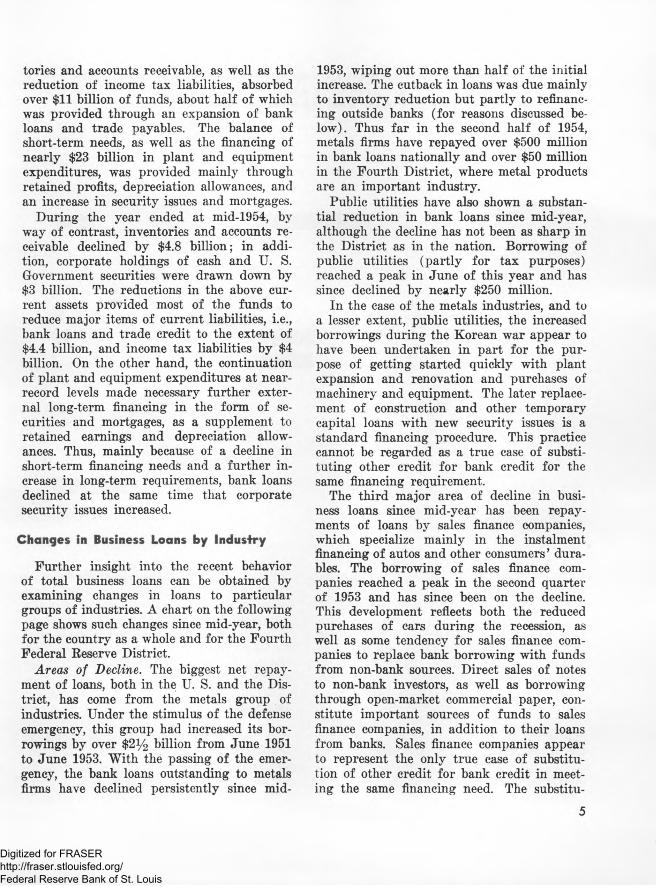
Bank loans to farmers rose during 1954. Outstanding C C C loans fluctuated widely, with altern a tio n s o f le n d in g a n d re p a y m e n ts .
Funds, either from banks or other sources, have been generally adequate to meet worthy credit needs throughout 1954. In areas stricken by drought in successive years, the Farmers Home Administration has been authorized to advance emergency credit to those borrowers in s e r i o u s financial stringency.
On the asset side of the nation’s agriculture, further reduction brought the total valuation nearly back to 1951 levels. This decline, extending over a three-year period, has been due both to lower land values and to lower values placed on other physical assets. On the other hand, financial assets held by farmers appear to have risen very slightly during 1954 to the highest level in history.
The Outlook
As 1954 draws to a close and as farmers take stock of their economic fortunes and misfortunes, they do so with an eye to the future and what 1955 may bring by way of change. Each autumn, agricultural economists from the various state universities meet with U. S. Department of Agriculture representatives in Washington, D. C., to formulate opinion concerning the farm outlook for the ensuing year. Next year, as seen by this group, will not be devoid of change in individual commodity lines, but the general trends are likely in many important respects to resemble those of 1954.
Domestic demand for farm products is expected to continue strong, foreign demand is likely to improve still more, farm output may slide a little. Average farm prices for the year may be expected to be close to the level of the last quarter of 1954. A further slight dip in gross farm income is predicted, and this would be only partly offset by lower production costs. Net returns to farm operators would consequently show another decline, although possibly by a smaller amount than occurred between 1953 and 1954. Such is the general outlook for 1955 as indicated by the Department of Agriculture representatives.
REAL ESTATE SECURED
° 1948 1949 1950 1951 1952 1953
Last date plotted: 3rd. quarter 1954.
10
I1954 1955
Millions o f Do llo rs O u ts ta n d in g
MEMBER BANK LOANS TO FOURTH DISTRICT FARMERS
Digitized for FRASER http://fraser.stlouisfed.org/ Federal Reserve Bank of St. Louis
BUSINESS BORROWING IN ’540Continued, from Page 6)
the major factor in loans repayments by metals firms, a part of the decline in loans to metals firms, as well as in loans to public utilities, represented a retreat from a somewhat abnormal position reached earlier. In addition, sales finance companies appear to have relied more heavily on non-bank credit. Except for the above three classes of borrowers, the recent trend in business loans might have appeared normal or even stronger than normal.
In addition, data on the sources and uses
of corporate funds indicate that the decline in corporate bank loans in 1954 was mainly the result of a reduced need for short-term needs, rather than a substitution of nonbank credit for bank credit.
Recent evidence points to the fact that inventory liquidation is about over and that the decline in defense spending has flattened out. This evidence suggests that the forces which produced the marked sluggishness of business loans during 1954 may be near an end.
ANNUAL INDEX to MONTHLY BUSINESS REVIEW (1954)
FINANCE
1953 Banking Review...................................... JanuaryLocal Trends in Volume of Bank D ebits....... AugustTowards a More Stable Money Supply..... SeptemberWhy Didn’t Business
Borrow More in ’54?................................ -December
INDUSTRY
The 1953 Surge in Construction ..................FebruaryIndustrial Scoreboard, Early ’5 4 ..........................MayRegional Expansion in Steel Capacity................JuneSteel Finishing Capacity.................................. October
AGRICULTURE
Banks in the Farm PriceSupport Program ................................ ........February
Farm Housing and Market Potentials........FebruaryCurrent Trends in Farm P rices............................ JuneHigher Expense Ratios in Agriculture..... SeptemberThe Investment in Farm Price Supports.—November Agriculture During 1954 .............................. December
TRADEDepartment Store Trade in 1953 ..................JanuaryMeasuring 1954 Easter Trade............................ MarchCross Currents o f Retail T rade............................ JulyDistrict Trade Reflects the
Industrial Pattern .................................... November
INDUSTRIAL RESEARCH
More Oil From Known Deposits....................JanuaryProgress Through Chemistry..............................MarchSterilization o f Foods and Other Products....... AprilThe Outlook for Natural G as................................MayBetter Jets Through Ceramic Materials..............JuneA New Approach to Cost Control..........................JulyBetter Management o f Water Resources ..... AugustA New Frontier in M etals................................OctoberScience and Farm Surpluses........................NovemberHigh-Speed Handling o f Business Data..... December
GENERALEyes Are On Inventories.................................... MarchSynthetics Thrust Ahead.......................................AprilPopulation Growth as a Demand F actor............AprilOutlays by Municipal Governments ....................MayCommodity Prices After Two Postwar Cycles....JulyShifting Shapes of the National Product....... AugustOutlays by State Governments........................October
MISCELLANEOUSList o f Directors o f the Federal Reserve
Bank o f Cleveland, 1954 .............................. January
11
Digitized for FRASER http://fraser.stlouisfed.org/ Federal Reserve Bank of St. Louis

High-Speed Handling of Business DataBy DONALD VV. HOLMES and W . L. SWAGER, Battelle Memorial Institute
THE ERA o f high-speed data processing machines for use in business offices is at hand. These machines can perform all the normal
clerical functions in any office: record, file, select from file, calculate, sort, summarize, and tabulate. Their speed and flexibility open up a whole new range o f opportunities for alert, aggressive businessmen.
The first such machines, developed during World War II, were designed by scientists for scientific calculations. The scientists knew the problems to be solved, and were able to design equipment useful for handling those particular kinds o f problems. From these early computers have evolved the high-speed data handling systems available to business today.
Rapid technical strides have been made by engineers, mathematicians, and other scientists in developing these newer machines. However, technical men are no longer as well acquainted with the needs they are attempting to satisfy as they were in the early days. It is not surprising, therefore, that solutions to the problems o f how best to use these devices in business have developed more slowly.
The task o f matching the capabilities of a large data-handling system with the needs o f an existing business office still requires both a clear technical knowledge o f what machines can do, and a sound appraisal o f the information to be handled. It is a rare individual who has command o f such combined knowledge — indeed, even effective teams are rare. Since scientists and engineers cannot be expected to know all the needs o f our business systems, the responsibility for closing this gap falls primarily on the businessman. I f he is going to influence the future development o f data-handling machinery so that it more nearly meets his needs, he must begin now. And he must begin at home by examining and evaluating his specific informational needs, and by learning to describe these needs in terms the designer can understand and use.
Installing a satisfactory computer system in a business office requires plenty o f hard work by all concerned—accountants, executives, systems analysts, and computer engineers. The effort is justified by the possibilities for cost reduction and better management control. The speed o f modern data-handling machines allows management to consider, for example, many new ways to combine business records for better interdepartmental control. There are possibilities o f summarizing sales, production, and other data in new ways; o f bringing together more data as a basis for reports, yet organizing it thoroughly so that the reports are more meaningful. In short, there
Editor’s Note — While the views expressed on this page are not necessarily those of this bank, the Monthly Business Review is pleased to make this space available for the discussion of significant developments in industrial research.
are possibilities o f increasing the content and value, while decreasing the cost, o f business records.
The questions posed in exploring such possibilities are at least as difficult to answer as they are easy to ask. Together, they comprise that involved process o f ‘ ‘ rethinking ’ o f which so much has been heard lately:
WHEN and WHERE should information be available for maximum effectiveness?WHAT type and form o f records will best control each functional acivity in the company ?
Once answers to these difficult questions have been developed, then, and only then, can the question which is usually the first one asked, be given serious consideration:
HOW to go about meeting information requirements ?
I f the preliminaries have been thoughtfully carried out, the process o f developing the best system will be made less difficult, but by no means simple. The cost o f any satisfactory system o f producing information must not exceed the dollars-and-cents value to management. Until this condition is met, both the information requirements and the system for producing same must be reevaluated and modified until the most satisfactory balance is attained.
The problem of balancing the cost o f obtaining and processing financial records with the value o f such records to management is not new. Accountants are continually concerned with it. In practice, though, the task o f estimating a dollars-and-cents value for various kinds of information is a perplexing one and has often been sidestepped. In the past, rough approximations have sufficed, or even a general agreement reached that “ the information would be very useful’ \
With the introduction o f a high-speed data-process- ing equipment, the problem of placing a value on all kinds of information must be faced squarely. Properly used, high-speed electronic systems will provide business control information in its most useful form. Information will be reduced from a wider span o f business details and will be available soon enough to be useful. Improperly used, electronic systems will simply lead to more information faster, and more confusion. Proper use requires sound business and technical judgment in preparing for the installation of an electronic data-handling system.
Alert, aggressive businessmen have a very real opportunity to make more profitable use o f highspeed data processing machines. The technical and business problems, however difficult they may seem, are not insurmountable. Electronic designers, mathematicians, systems analysts, and operations researchers stand ready to team up with businessmen in solving these problems. The effort expended in their solution will bring compensating rewards in terms o f better management control and dollar savings.
12
Digitized for FRASER http://fraser.stlouisfed.org/ Federal Reserve Bank of St. Louis