Embed Size (px)
Citation preview

ONTHLY
7fCafteAt9S7
CROSS SECTIONS of the Fourth Federal Reserve District
II. CLEVELAND AND EASTERN LAKE ERIE NINE ECONOMIC AREAS Including 22 counties
i
D. LORAIN-ELYRIAE. MANSFIELDF. AKRON...G. CANTON
Town-and-Country An
SANDUSKY-ASHLAND. HTABULA-KENT—
CITY-MEADVILLEDigitized for FRASER http://fraser.stlouisfed.org/ Federal Reserve Bank of St. Louis

CLEVELAND Metropolitan Area Cuyahoga and Lake Counties
(Area C.)
Cl e v e l a n d shares with Pittsburgh its position as population center of the Fourth
Federal Reserve District and its place high among the largest metropolitan areas of the United States. The precise rank of Cleveland, and also of Pittsburgh, varies according to whether measurement is taken of the population within the corporate city limits, or within the “ urbanized area,” or within the “ Standard Metropolitan Area” (See Table 1.)
Thus, Cleveland is the 7th largest city of the United States, and Pittsburgh is the 12th largest, in terms of the population of corporate cities. However, in terms of “ urbanized area,” Pittsburgh is the 8th largest city of the nation, while Cleveland is 10th largest. (“ Urbanized area” is a relatively recent Census concept; it applies to contiguous, built-up area, irrespective of corporate limits or county lines.) In terms of “ Standard Metropolitan Area” which includes one or more entire counties closely related to the central
Pittsburgh also ranks 8th among the of the United States and Cleveland is
in 10th place.All three of the rankings just cited are
based on the most recent Census of Population, as of April 1950, shown in Table l . (1) Since 1950, there has been an appreciable population increase. Thus, the Standard Metropolitan Area of Cleveland registered an estimated 15-percent increase in population between 1950 and early 1956 while the increase in the Pittsburgh Metropolitan Area was only about 7 percent.)
The corporate city of Cleveland has a population of about 934,000 according to estimates made in early 1956.
Largest suburbs of Cleveland are Lakewood, Cleveland Heights, Parma, and Euclid, with populations ranging from about 67,000 down to 55,000, as of early 1956. Parma is a relatively new entry in the list of largest suburbs, its population having more than doubled between 1950 and 1956. By contrast, the population of Lakewood declined by about one percent during the same period. Suburbs ranging from about 40,000 down to 25,000(i) Of the three alternative measurements, the “ Standard Metropolitan Area” is the one which is used most extensively within the framework of this cross-sections survey. It has a breadth of coverage which reflects suburban growth; also it has the practical advantage of permitting the use of county- wide data.
The “urbanized area” concept is the most refined of the three measurements and for some purposes is most scientifically defensible. Such data, however, are not available for as many dates as the other measures; also public understanding of the “urbanized area” concept is less fully developed.
The “corporate city" type of measure, although too narrow for many purposes, has the advantage of a long tradition and its meaning is easily recognized.
Digitized for FRASER http://fraser.stlouisfed.org/ Federal Reserve Bank of St. Louis

EDITOR’S N O TE : This article on Cleveland and Eastern Lake Erie is the second of a series of five articles analyzing economic activity in the various areas of the Fourth Federal Reserve District, both in terms of current standings and relative rates of growth.
The first article appeared as a supplement to the December 1956 issue of this Review and dealt with Northwestern Ohio, which is composed of 2 metropolitan areas and 2 town-and-country areas. The third article, to appear in an early issue, will apply to Pittsburgh, Youngstown and the Upper Ohio Valley, comprising 5 metropolitan areas and 4 town- and-country areas. The fourth article will deal with Central and Southwestern Ohio; the fifth and final article will apply to Eastern Kentucky.
Each economic area discussed in the text is composed of one or more counties. The ‘ ‘ metropolitan ’ ’ areas conform to the official Census designation of Standard Metropolitan Areas; in each case there is a central city of at least 50,000 population. Although many of the metropolitan areas are limited to one country each, certain ones, such as Cleveland or Pittsburgh, have two or more counties.
The “ town-and-country ’ ’ areas are composed of a number of adjoining counties (sometimes 10 or more) which have been grouped according to similarity of industrialization, agriculture, levels of income, etc. Although cities in these areas are not as large as 50,000, the town-and-country areas usually include a number of important population centers in the range from 5,000 up to 50,000. For a list of the 19 metropolitan areas and the 15 town-and-country areas of the Fourth District, with the counties included in each, see Table 4 on page 20.
A selection of information (which is the most recent available on a consistent basis) is summarized for the population, manufacturing, finance, agriculture and trade of each. Ranks are assigned to each item of information to indicate the standings of the areas within the Fourth District. Comparable benchmark information is provided for the state of Ohio, the Fourth District in total, and the United States in total.
Further information on methods of classification is shown in the Appendix of this article. Specific sources of information provided in the master table, i.e. Table 3 on pages 12 and 13, are listed at the bottom of that table.
Table 1
CLEVELAND’S RANK IN POPULATION AMONG LARGEST CITIES OF THE U. S.
According to Three Alternative Measures (Census of 1950)
RANKPopulation of
Corporate CityPopulation of
“ Urbanized Area”
Population of Standard Metropolitan
Area*
1st New York............. . .7,892,000 New York............. .12,296,000 New York............... 12,912,0002nd Chicago................ . .3,621,000 Chicago................ . 4,921,000 Chicago.................. 5,495,0003rd Philadelphia........ . .2,072,000 Los Angeles.......... . 3,997,000 Los Angeles............ 4,368,0004th Los Angeles.......... . .1,970,000 Philadelphia......... . 2,922,000 Philadelphia.......... 3,671,0005th Detroit.................. . .1,850,000 Detroit.................. . 2,659,000 Detroit.................... 3,016,0006th Baltimore.............. .. 950,000 Boston................... . 2,233,000 Boston..................... 2,370,0007th CLEVELAN D.. .. 915,000 San Francisco.. . . . 2,022,000 San Francisco........ 2,241,0008th St. Louis............... . . 857,000 PITTSBURGH.. . 1,533,000 PITTSBURGH. . . 2,213,0009th Washington......... . . 802,000 St. Louis............... . 1,400,000 St. Louis................. 1,681,000
10th Boston................. .. 801,000 CLEVELAN D... . 1,384,000 CLEVELAN D.. . . 1,466,00011th San Francisco... .. 775,000 Washington.......... . 1,287,000 Washington............ 1,464,00012th PITTSBURGH. .. 677,000 Baltimore............. 1,162,000 Baltimore................ 1,337,000
♦For estimates o f population o f the Cleveland and Pittsburgh Metropolitan Areas, as o f early 1956, along with those o f the other 17 metropolitan areas o f the Fourth District, see “ Northwestern Ohio,” first article in this series, December 1956 Supplement, page 3.
Digitized for FRASER http://fraser.stlouisfed.org/ Federal Reserve Bank of St. Louis

include in order: East Cleveland, Shaker Heights, Garfield Heights, Maple Heights and South Euclid. Other suburbs of Cleveland which have in excess of 8,000 population include : Berea, University Heights, Rocky River, Lyndhurst, Fairview Park, Bedford, Parma Heights, Mayfield Heights, Bay Village, Westlake, North Olmsted, and Brooklyn.
Altogether, the suburban cities listed above had an estimated population of 514,000 as of early 1956. That represents a growth of 27 percent since the Census of 1950, contrasting with the 2 percent growth shown by the corporate city of Cleveland.
In Lake County, which adjoins Cuyahoga county on the northeast and which is included within the Standard Metropolitan Area of Cleveland, the principal centers of population are as follows: Painesville with 17,000; Willoughby, 12,000; Eastlake, 12,000; Wickliffe, 9,000; and Willowick, 9,000.
Manufacturing Strength
Unlike centers which are dominated by one major industry, Cleveland’s industrial complex has grown as a collection of many small or medium-size plants, mainly under local ownership. In the Cleveland area there are nearly 480 establishments employing 100 or more persons. The value added by manufacturing during 1954 amounted to $2,405 million, according to the Census of Manufactures of that year. In respect to the total “ value added,” the area ranks 2nd among the 19 metropolitan areas of the District. The Pittsburgh area leads the District in the absolute measure of “ value added” by a margin of $84 million.
The Cleveland area also ranks second to Pittsburgh in respect to monthly payrolls of insured employment, as of the first quarter of 1956; the figure for the Cleveland metropolitan area was $238.6 million.
The Cleveland area’s growth in value added by manufacture, between the two Census years 1947 and 1954, was 55 percent and this was substantially larger than the rate of growth
in the Pittsburgh area. (See Table 2, page6.) There was also a growth in manufacturing employment in the Cleveland area, between 1947 and 1954, which amounted to 9 percent. (Manufacturing employment during the same period declined in the Pittsburgh area.)
Expressed on the basis of a relative measure, the Cleveland area ranks 8th among the 19 metropolitan areas of the District in respect to value added per manufacturing worker, with $8,232 added per worker — a figure appreciably higher than the average for Ohio or for the Fourth District or for the nation. (See Table 3 on page 12.) As to the proportion of population employed in manufacturing, with 190 persons per 1,000 population so employed, the area scores 7th among the District’s 19 metropolitan areas.
Leading Industry Groups
Precision metal working has historically been the strong point of Cleveland industry. Machinery is the leading industry classification in the area, both in terms of employment and in terms of value added by manufacture. Over 67,000 persons are employed by the machinery industry (including electrical machinery) or more than one-fifth of the area’s total manufacturing employment. Value added by manufacture in this branch of industry alone amounted to $572.7 million, or 24 percent of the total value added to the area, according to the 1954 Census of Manufactures.
Transportation equipment is second in size in the area. This group includes production of motor vehicles and parts, as well as aircraft, aircraft parts and auxiliary equipment; altogether it employs nearly 60,000 workers. The corresponding value added in 1954 was $502.8 million, or 21 percent of the total value added by manufacture in the area.
Primary metals industries in the Cleveland area employ over 40,000 persons. Operations in the primary metals group include smelting, rolling, casting and forging of metals. Lo
4
Digitized for FRASER http://fraser.stlouisfed.org/ Federal Reserve Bank of St. Louis
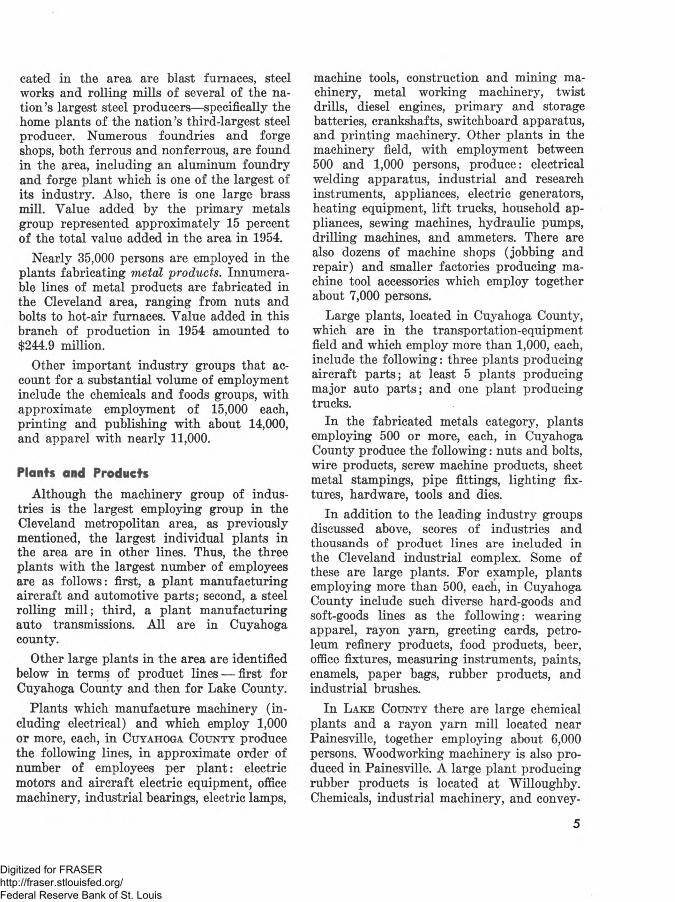
cated in the area are blast furnaces, steel works and rolling mills of several of the nation’s largest steel producers—specifically the home plants of the nation’s third-largest steel producer. Numerous foundries and forge shops, both ferrous and nonferrous, are found in the area, including an aluminum foundry and forge plant which is one of the largest of its industry. Also, there is one large brass mill. Value added by the primary metals group represented approximately 15 percent of the total value added in the area in 1954.
Nearly 35,000 persons are employed in the plants fabricating metal products. Innumerable lines of metal products are fabricated in the Cleveland area, ranging from nuts and bolts to hot-air furnaces. Value added in this branch of production in 1954 amounted to $244.9 million.
Other important industry groups that account for a substantial volume of employment include the chemicals and foods groups, with approximate employment of 15,000 each, printing and publishing with about 14,000, and apparel with nearly 11,000.
Plants and Products
Although the machinery group of industries is the largest employing group in the Cleveland metropolitan area, as previously mentioned, the largest individual plants in the area are in other lines. Thus, the three plants with the largest number of employees are as follows: first, a plant manufacturing aircraft and automotive parts; second, a steel rolling mill; third, a plant manufacturing auto transmissions. All are in Cuyahoga county.
Other large plants in the area are identified below in terms of product lines — first for Cuyahoga County and then for Lake County.
Plants which manufacture machinery (including electrical) and which employ 1,000 or more, each, in C u y a h o g a C o u n t y produce the following lines, in approximate order of number of employees per plant: electric motors and aircraft electric equipment, office machinery, industrial bearings, electric lamps,
machine tools, construction and mining machinery, metal working machinery, twist drills, diesel engines, primary and storage batteries, crankshafts, switchboard apparatus, and printing machinery. Other plants in the machinery field, with employment between 500 and 1,000 persons, produce: electrical welding apparatus, industrial and research instruments, appliances, electric generators, heating equipment, lift trucks, household appliances, sewing machines, hydraulic pumps, drilling machines, and ammeters. There are also dozens of machine shops (jobbing and repair) and smaller factories producing machine tool accessories which employ together about 7,000 persons.
Large plants, located in Cuyahoga County, which are in the transportation-equipment field and which employ more than 1,000, each, include the following: three plants producing aircraft parts; at least 5 plants producing major auto parts; and one plant producing trucks.
In the fabricated metals category, plants employing 500 or more, each, in Cuyahoga County produce the following: nuts and bolts, wire products, screw machine products, sheet metal stampings, pipe fittings, lighting fixtures, hardware, tools and dies.
In addition to the leading industry groups discussed above, scores of industries and thousands of product lines are included in the Cleveland industrial complex. Some of these are large plants. For example, plants employing more than 500, each, in Cuyahoga County include such diverse hard-goods and soft-goods lines as the following: wearing apparel, rayon yarn, greeting cards, petroleum refinery products, food products, beer, office fixtures, measuring instruments, paints, enamels, paper bags, rubber products, and industrial brushes.
In L a k e C o u n t y there are large chemical plants and a rayon yam mill located near Painesville, together employing about 6,000 persons. Woodworking machinery is also produced in Painesville. A large plant producing rubber products is located at Willoughby. Chemicals, industrial machinery, and convey
5
Digitized for FRASER http://fraser.stlouisfed.org/ Federal Reserve Bank of St. Louis

Table 2
INDUSTRY IN ALL 19 METROPOLITAN AREAS
AREA
Monthly Payrolls Insured
Employment 1956—1st Q,(Million $) RANK
Manufacturing Employees
per 1000 Population 1956— 1st Q, RANK
Growth in Value
Added by Manufa ctur es
1947-54 RANK
Pittsburgh................................................ 256.7 1 143 12 + 32 % 16CLEVELAND........................................ 238.6 2 190 7 + 55 % 8Cincinnati................................................ 116.6 3 157 10 + 70 % 7Dayton..................................................... 68.9 4 193 6 + 51 % 10Youngstown............................................. 68.2 5 193 5 + 53 % 9Columbus................................................ 63.0 6 131 14 +109 % 3A K R O N .................................................. 59.7 7 198 2 + 29 % 17Toledo...................................................... 50.0 8 138 13 + 36 % 13CANTON................................................ 36.3 9 198 3 + 75 % 5Wheeling-Steubenville.......................... 27.1 10 124 16 + 44 % 11ERIE........................................................ 23.0 11 172 9 + 23 % 18Hamilton-Middletown.......................... 21.4 12 197 4 +119 % 1LORAIN -ELYRIA............................... 19.8 13 199 1 +112 % 2Huntington-Ashland.............................. 14.9 14 77 18 + 71 % 6Springfield............................................... 11.1 15 145 11 + 18 % 19MANSFIELD......................................... 10.8 16 182 8 + 38 % 12Lima......................................................... 9.1 17 130 15 + 33 % 15New Castle.............................................. 8.7 18 120 17 + 36 % 14Lexington................................................ 5.8 19 33 19 +106 % 4
ing equipment are produced at Wickliffe, and control equipment at Madison.
Greenhouses and nurseries are important enterprises in Lake County.
Cleveland as a Port
Industrial activity of the Cleveland area is closely related to the city’s historic importance as an industrial lake port. Access to the Upper Lakes iron ore deposits by way of the Great Lakes has made Cleveland an important steel center. The completion of the St. Lawrence Seaway will open the way to the rich deposits of iron in Labrador, which will assure a continuous supply of these high- grade raw materials to the steel mills of the area. Other phases of industrial and commercial expansion in the area are expected to gain momentum as the completion of the Seaway way opens the port to ocean-going vessels of larger size than heretofore.
Approximately 20,427,000 tons of freight moved through the port of Cleveland in 1955. Of this total, iron ore and concentrates accounted for 15,195,000 tons, and limestone for2,312,000 tons. Overseas freight amounted to nearly 48,000 tons.
Cleveland as a Financial Center
Cleveland’s importance as a banking center is shown by the fact that per-capita demand deposits at commercial banks of the Cleveland metropolitan area lead all 19 metropolitan areas of the Fourth District. (See Table 3, page 12.) In total dollars of demand deposits, however, Cleveland is second to the Pittsburgh area.
The Cleveland metropolitan area is second only to the Lima area in respect to savings accounts per capita, as indicated by time deposits at commercial banks and mutual savings banks plus withdrawable shares of
6
Digitized for FRASER http://fraser.stlouisfed.org/ Federal Reserve Bank of St. Louis

savings and loan associations.(2) Such savings in the Cleveland area amounted to $1,209 per capita, as of December 31, 1955.
Trade
The Cleveland area ranked 2nd among the 19 metropolitan areas of the Fourth District(2) This should not be confused with a measure of total personal savings, since it fails to include many important forms of personal savings such as securities, insurance policies and pension equities. The item is used here as a partial indicator of savings trends; it was selected because of the availability of consistent data on a county-wide basis.
in respect to retail sales per capita, as measured by the Census of 1954. The figure was $1,272 per capita, slightly below that of the Columbus area, but much higher than the average for Ohio, or for the Fourth District or for the United States. (See Table 3.)
Wholesale sales in the Cleveland metropolitan area amounted to more than $4 billion during the Census year 1954, or about one- third of the entire wholesale trade of the state of Ohio.
LORAIN-ELYRIA Metropolitan Area Lorain County
(Area D.)
Th e c i t y of Lorain has a population of about 57,000 and Elyria, 30,000, as estimated early in 1956. Also included in Lorain
County, with populations ranging from about8,000 down to 3,000, are the following: Ober- lin, Avon Lake, Amherst, Avon, Sheffield Lake, and Wellington.
The total population of the one-county metropolitan area has been estimated, for the purposes of this survey, as 174,000, as of early 1956. That represents a gain of 17 percent since the Census count for 1950 and puts the Lorain-Elyria metropolitan area in 3rd
place among the 19 metropolitan areas of the Fourth District, in respect to growth in recent years. However, the area ranks only 13th in total population.
A Leading Rank in Manufacturing
The Lorain-Elyria area is an important industrial center and one of interesting diversity. Manufacturing activities, in relation to size of population, are outstanding. Thus, the area leads all others of the 19 metropolitan areas of the Fourth District in respect to manufacturing employment per1,000 population, with a figure of 199 per thousand, as of the first quarter of 1956.
The area ranks 2nd among the 19 metropolitan areas in value added by manufacturing per manufacturing employee, according to the latest Census of Manufactures. Also, the area’s growth in value of manufactures between the Census years 1947 and 1954, amounting to 112%, was second largest among all 19 metropolitan areas of the District.
Located in L or ain is the nation’s largest plant producing steel tube (seamless and welded) and pipe. This establishment alone employs over 11,000 persons. Also in Lorain,
7
Digitized for FRASER http://fraser.stlouisfed.org/ Federal Reserve Bank of St. Louis

employing nearly 2,000, is a plant for the manufacture of power shovels. Other plants in Lorain which employ 100 to 500 workers, each, include a shipbuilding works, and plants producing men’s and boys’ apparel, electric welding machines, bronze bearings, and toys. An assembly plant of one of the major auto producers, to employ several thousand people, is now under construction between Lorain and Vermilion.
Although Elyria has no single plant as large as the Lorain tube works, it has three plants, with more than 1,000 employees each, p r o d u c in g electric motors, chrome-plated parts for autos, and air-brake equipment. Other important plants in the metal-products field manufacture the following: industrial casters and wheels, screw machine products, pipe tools, warm-air furnaces, air conditioners, gray iron and alloy castings, glass-lined steel tanks, aircraft parts, steel tubing, bicycle parts, heat transfer products, and wire springs. The non-durable goods lines are represented in Elyria by a large industrial chemicals plant and also by plants turning out such varied products as golf balls and lace goods.
At Avon Lake (between Lorain and Cleveland) there is a large plant employing about2,000 persons in producing truck trailers; also an experimental plant for production of plastics.
Elsewhere in the county, sandstone products and screw machine products are produced at Amherst. Machine-tool castings and gray iron castings are manufactured in Wellington and Grafton, respectively.
Finance and Trade
Demand deposits at commercial banks of the Lorain-Elyria area rose by 34 percent between year-end 1950 and year-end 1955. That gave the area a ranking of 5th among the 19 metropolitan areas of the Fourth District in respect to growth in demand deposits.
In other measures of finance or trade, as covered by the survey, the Lorain-Elyria area’s scoring is not especially outstanding. (Figures and rankings are shown by Table3, page 12.)
MANSFIELD Metropolitan Area Richland County
(Area E.)
©Lexington
Plymouth 0Shl|oh
R IC H L A N D0 Go nges
® Shelby
Povonioo
Roseland-Steel M i l l@4 L incoln* ,,
OntarioQ 04( § ) ^ C o o l R id ge H ti.
West Ausdole Mansfield
®Lucas
Perrysvill
Bellville
©Butler
^ .th ou gh Mansfield and Richland county, Ji V as of press time, had not yet been included in the official Census list of Standard Metropolitan Areas of the U. S., the area is treated as “ metropolitan” for purposes of this survey since the most recent estimates of population make it appear appropriate to do so.
The city of Mansfield, as of early 1956, had a population of about 50,000 and the entire county may be estimated at 107,000; the latter includes Shelby with about 10,000.
The area’s growth in population between 1950 and 1956 was about 17 percent, ranking it 4th in rate of growth among the 19 metropolitan areas of the Fourth Federal Reserve District. (The Mansfield area’s gain in population appears to be quite close to that of the Lorain-Elyria area, which ranks 3rd.)
Manufacturing
The relative importance of manufacturing in the area is shown by the fact that, although it ranks only 18th in terms of population, the number of manufacturing employees per1,000 of population places the area 8th among the District’s 19 metropolitan areas.
8
Digitized for FRASER http://fraser.stlouisfed.org/ Federal Reserve Bank of St. Louis

The value added by manufacture during 1954 in the Mansfield area was $163 million, according to the 1954 Census of Manufactures, or $8,261 per manufacturing employee. In respect to value added per manufacturing employee, the area ranks 7th among the 19 metropolitan areas of the District.
Nearly two-thirds of all industrial activity in the county is concentrated in M a n s f i e l d . Plants employing 500 or more workers, each, produce the following lines: electrical appliances, rubber tires, steel sheet, auto bodies and frames, pole-line hardware, gas stoves, structural steel products, and metal sanitary ware. Other leading products manufactured in Mansfield are: pumps, electric motors and generators, switches, thermostats, furniture, paperboard boxes, and farm implements.
In S h e l b y , northwest of Mansfield, a number of large plants manufacture such products as steel tubing, paper blank books, communication equipment , and builders’
hardware. Machinery is produced in Plymouth.
Finance and Trade
Retail sales in the Mansfield metropolitan area amounted to $1,135 per capita in 1954, according to the Census of that year. In this respect, the area ranks 7th among the 19 metropolitan areas of the Fourth Federal Reserve District.
The area scores higher, or in 5th place out of the 19 metropolitan areas of the District, in respect to growth in retail sales between the Census years 1948 and 1954; Mansfield’s increase in sales was 32 percent.
Demand deposits per capita (at commercial banks) amounted to $517 for the Mansfield metropolitan area, as of December 31, 1955. That gives the area a ranking of 9th among the 19 metropolitan areas of the District.
AKRON Metropolitan AreaSummit County
(Area F.)
Peninsula Hu.d son ’ >
L o <j>Mogadore
Barberton,!§j' l'M'anichester Greensburg
Clinton °
A k r o n is the 5th largest city of Ohio, with jLJL a population of about 294,000 as of early 1956, or about 7 percent more than the Census count of 1950. Close to the city limits are Cuyahoga Falls, with 44,000 (representing a 49 percent gain from its 1950 population)
and Barberton with 33,000 (or 20 percent more than its 1950 figure).
Smaller centers of the area include Tall- madge, Lakemore, Twinsburg, Silver Lake, and Hudson, with populations from about8,000 down to 2,000.
The total population of the Akron metropolitan area, i.e. Summit county, is estimated at 466,000, as of early 1956. Thus, in population it ranks 7th among the 19 metropolitan areas of the Fourth District. Density of population in the Akron area is unusually high, insofar as it has 1,129 persons per square mile, for a rank of 4th.
Akron's Rubber Industry
The rubber industry accounts for more than half of Akron’s manufacturing employment. Since the end of the first decade of this
9
Digitized for FRASER http://fraser.stlouisfed.org/ Federal Reserve Bank of St. Louis

century, Akron has been known as the “ rubber capital of the world;” it is one of the most specialized industrial cities in the country.
The rubber industry in Akron employs more than 50,000 people, or one-fifth of the nation’s total employment for the industry. Products include motor vehicle tires and inner tubes, synthetic rubber, reclaimed rubber, and a large variety of fabricated rubber goods. Between the two Census years 1947 and 1954, however, employment in rubber plants in the Akron metropolitan area declined by 25 percent. The decline was partly due to decentralization in the rubber industry (rise of secondary rubber centers) as well as partly due to the mechanization process and partly due to the fact that 1954 happened to be a recession year. For the United States, the drop in employment in the rubber industry was less than one percent between 1947 and 1954. (Rubber footwear is excluded.) Since 1954, employment in Akron’s rubber industry has shown a moderate pickup.
Other Manufacturing in the Area
Although the rubber industry continues to be of overwhelming importance in Akron, it by no means constitutes the whole of the manufacturing strength of the city and surrounding area. Good diversification characterizes the balance of production which, in relative order of numbers employed, includes important items such as: aircraft parts, machinery (including precision tools and special industry machinery), ordnance equipment, cereal breakfast foods, sporting and athletic goods, gray-iron castings, millwork, pottery products, machine shop products, salt, porcelain electrical supplies, fabricated metal products, plastic products, and paper bags.
Just south of Akron is B a r b e r t o n where there are plants turning out industrial boilers, rubber goods, chemicals, electric transmission-line equipment, valves, matches, and foundry products. Elsewhere in Summit
County, including C u y a h o g a F a l l s , are factories producing stampings and machine shop products, structural clay products, hand tools, models and patterns, and photographic equipment.
The vital importance of manufacturing to the Akron area is shown by the large proportion of its population which is thus employed. As measured by manufacturing employment per 1,000 population, the Akron area ranks 2nd among the District’s 19 metropolitan areas. (See Table 2, on page 6.) In value added by manufacture—$593 million in 1954 —the area is 6th among the 19 areas. However, in value added per manufacturing worker, the area falls below the District average, placing 16th among the total of 19 metropolitan areas.
Finance and Trade
The Akron metropolitan area scores 3rd among the 19 metropolitan areas of the District in the rate of growth in demand deposits at commercial banks between year-end 1950 and year-end 1955. The area scores 4th among the 19 in the rate of growth in savings accounts, as measured by time deposits at commercial banks plus shares of savings and loan associations. The two rates of growth were 39 percent and 69 percent, respectively.
Thus, the growth in both classes of accounts in the Akron area is outstanding. However, on a current per-capita basis, the area ranks only 10th among the 19 metropolitan areas in respect to demand deposits per capita and 7th in respect to per-capita savings accounts, as here defined.
The Akron area occupies an intermediate position in the retail trade measure utilized here. Thus the area was 8th among the 19 metropolitan areas of the District in retail sales per capita in 1954; and 9th in rate of growth in retail sales between 1948 and 1954.
10
Digitized for FRASER http://fraser.stlouisfed.org/ Federal Reserve Bank of St. Louis

CANTON Metropolitan Area Stark County
(Area G.)
©16, QHartville u[JaY €° tnif)n* o Marlboro
•SS L Allia" « ^oCanal Fulton ©Middlebranch
Crystal Spr. ^ ®N.Canton ’ ^o rs ( ©LouisvilleN. Lawrence
* ® . m P ®E.CantonPonsMassillon RobertsvilleO E fS S '
®N.lndustry . . . % ■ '
S T A R K
Beach City E-sPartae ^ ® ff ifrvhesbura
'•^Brewster ©Navarre ® °Justus
Th e c i t y of Canton has a population of about 122,000 as of early 1956. There are two other sizable cities within the county:
Massillon with about 36,000 and Alliance with 30,000.
Between 1950 and 1956, Canton’s population increased by 4 percent, while Massillon showed a 22-percent growth and Alliance posted a 13-percent growth.
Smaller centers include North Canton and Louisville, with approximately 5,000 each.
The entire population of this one-county metropolitan area is estimated at 321,000 as of early 1956, for a position of 10th among the 19 metropolitan areas of the Fourth District. In population per square mile, the area ranks 8th among the 19 metropolitan areas.
A Heavy Industry CenterIn the Canton metropolitan area, 198 peo
ple per 1,000 of the area’s population are employed in manufacturing. In this respect, Canton ranks 3rd among the 19 metropolitan areas of the District.
About one-third of the manufacturing employees are in the primary metals group of industries; a little more than one-third are in the combined group of machinery and fabricated metal products; the remainder are employed in a variety of soft-goods and hard- goods industries.
The value added by manufacture in the area, according to the Census of 1954, was $491 million—a growth of 75 percent from 1947, the date of the last previous census. The rate of growth in value added in the Canton area is the 5th highest among the 19 metropolitan areas.
In C a n t o n proper are located integrated steel works and rolling mills operated by the third largest steel producer of the nation. Stainless and alloy steel in a variety of basic shapes are the principal products. Also in Canton are large steel forgings plants as well as foundries producing gray iron castings and malleable iron castings.
Leading products of the machinery and fabricated metal group in Canton, in approximate order of number of employees, are: roller bearings, vacuum cleaners, metalworking machinery, metal office furniture, internal combustion engines, safes and vaults, structural steel products, power-transmission equipment, stampings, switchboard apparatus, printing machinery, steel screens, and sheetmetal products.
Outside of the metals field, there are a number of important plants in Canton which produce fabricated rubber products, ceramics, dental equipment, structural clay products, paperboard boxes, p e t ro leu m products, women’s apparel, and pharmaceutical preparations.
M a s s i l l o n , located just west of Canton, contains part of the integrated steel works previously mentioned. Also manufactured in Massillon are industrial machinery, heat exchange apparatus stampings, steel castings, bolts and nuts, roller bearings, advertising signs, and bedsprings.
In A l l i a n c e , northwest of the city of Canton, there are about a dozen substantial plants which manufacture hard goods and which employ about 6,000 people. Important products include: steel forgings, steel castings, conveying equipment, electric motors, metal tubing, brick and tile products, structural steel, and computing machines.
(Canton discussion continued on page 14)
11
Digitized for FRASER http://fraser.stlouisfed.org/ Federal Reserve Bank of St. Louis

Tabis 3
CLEVELAND AND EASTERN LAKI ERIE: NINE ECONOMIC AREASBasie Economic Facts
METROPOLITAN TOWN-AND-COUNTRY
OHIO DISTRICT u. S.
Area C R CLEVE- A LAND N
(2 Counties) K
Area D LORAIN- ELYRIA
(1 County)
RANK
Area E MANSFIELD
(1 County)
RANK
Area F AKRON
(1 County)
RANK
R\rea G a
('ANTON N(" County) k
Area H ERIE
(1 County)
RANK
Area 3 SANDUSKY ASHLAND(6 Counties)
R-ANK
Area 4 ASHTABULA-
KENT(3 Counties)
RANK
Area 5 OIL CITY- MEADVILLE(6 Counties)
RANK
POPULATION1. Population, Tan. 1, 1956.................................thous. 1,673 2 174 13 107 18 466 7 , 321 10 240 12 278 10 198 13 282 8 9,040 14,306 165,8792. Population, per sq. mile, Jan. 1, 1956............ 2,440 1 351 11 215 17 1,129 4 1 560 8 295 14 108 5 123 1 66 12 220 194 56
MANUFACTURING A \3. Monthly payrolls, all insured employment
(1956— 1st Q . ) .........................................mil. dol. 238.6 2 19.8 13 10.8 16 59.7 7 36.3 9 23.0 11 18.7 4 12.2 11 17.6 5 926.7 1,333.2 12,9334. Manufacturing employment per 1,000
population (1956— 1st Q .) ........................... 190 7 199 1 182 8 198 2 198 3 172 9 119 1 100 6 112 5 152 134 1015. Value added by manufacture, 1954........mil. dol. 2,405 2 280 12 163 15 593 6 491 9 276 13 232 5 139 8 270 3 10,154 14,181 116,0016. Value added per manufacturing employee. 8 2 7 16 5 15 6 7 3
1954................................................................. dol. 8,232 9,274 8,261 6,901 l*,520 6,943 7,449 7,001 7,698 7,994 7,971 7,189
FINANCE7. Demand deposits, per capita, Dec. 31, 1955.. .dol. 940 1 283 19 517 9 497 10 463 12 555 7 432 3 282 11 521 2 592 605 6578. Savings accounts (Commercial banks
and savings and loan associations)per capita, Dec. 31, 1955......................... dol. 1,209 2 661 9 654 10 674 7 827 4 469 17 814 1 591 3 408 8 759 660 641
AGRICULTURE9. Farm income, per acre, 1954........................... .dol. — — — — — — 46.77 4 33.33 6 24.56 10 42.20 36.23 21.27
10. Farm income, per farm, 1954.......................... dol. — — — — ---------- ---- --- 5,144 4 2,918 9 2,661 10 4,765 3,625 5,126
TRADE11. Retail sales, per capita, 1954.......................... dol. 1,210 2 1,060 13 1,135 7 1,131 8 j >059 14 1,068 12 1,013 4 1,024 3 890 8 1,099 1,010 1,053
SOME GROW TH TRENDS12. Growth in population, 1950-56....................... +15% 7 + 17% 3 +17% 4 +14% 11 +13% 12 + 9% 16 +15% 2 +17% 1 + 1% 12 + 14% +10% +10%13. Growth in manufacturing employment, 1947-54.. + 9% 6 + 4% 8 + 6% 7 — 9% 14 '+ 4% 9 — 14% 18 +17% 5 +25% 3 — 3% 13 + 6% + 2% +13%14. Growth in value added by manufacture, 1947-54. +55% 8 +112% 2 +38% 12 + 29% 17 +75% 5 +23% 18 + 67% 5 +75% 3 + 44% 12 + 60% +34% +56%15. Growth in demand deposits, 1950-55............. +17% 17 + 34% 5 + 28% 11 + 39% 3 +33% 7 + 17% 16 + 39% 1 + 32% 4 +23% 6 + 26% + 22% +20%16. Growth in savings accounts, 1950-55............. + 36% 15 + 41% 14 + 36% 16 +69% 4 '+52% 8 + 51% 11 +46% 7 +49% 5 +14% 15 + 46% + 43% + 55%17. Growth in farm income, 1949-54.................... — — — — — — +22% 4 + 5% 10 + 5% 11 +20% + 13% +12%18. Growth in retail sales, 1948-54........................ +29% 8 +36% 4 +32% 5 +28% 9 +24% 13 + 17% 16 +26% 9 +47% 3 + 9% 13 +31% + 25% +30%
Rank number for a metropolitan area refers to the area’s rank among the 19 met°Politan areas of the Fourth Federal Reserve District, 13 of which are covered in other articles of this series.Rank number for a town-and-country area refers to the area’s rank among the 15 tow»rand’ country areas of the Fourth Federal Reserve District, 12 of which are covered in other articles of this series.Sources:
1. Estimates based on data from U. S. Bureau of the Census and from various state agencies, 1956.
2. Square miles from Census of Population, 1950.3, 4. Division of Research and Statistics, Ohio Bureau of Unemployment Compensation, Colum
bus; similar sources for data for other states, 1956.5, 6. Census of Manufactures, 1954.
7. Federal Reserve data; refers to demand deposits of individuals, partnerships and corporations.
8. Federal Home Loan Bank of Cincinnati, Federal Home Loan Bank of Pittsburgh; state departments of banking; Federal Reserve data on time deposits. Item refers to time deposits at commercial banks and mutual savings banks plus value of withdrawable shares
12 of savings and loan associations (both state and Federal-chartered).
9, 10. Census of Agriculture, 1954.11. Census of Business, 1954.
12. Census of Population, 1950 and estimates as of item 1.
13, 14. Census of Manufactures, 1954.15. 16. Same as 7 and 8.
17. Census of Agriculture, 1954 and 1947.
18. Census of Business, 1954 and 1948. 13Digitized for FRASER http://fraser.stlouisfed.org/ Federal Reserve Bank of St. Louis
In Minerva, manufactures include road machinery, communication equipment, wax paper, and tile products. In Hartville, there are plants producing rubber products and screens. East Sparta produces tile products in large quantities. There is a cement plant in Middle Branch.
Finance and Trade
In respect to important types of savings accounts, the Canton area ranks relatively
high. Thus, savings accounts in the form of time deposits at commercial banks plus shares of savings and loan associations amounted to $827 per capita at the end of 1955. That gives the area 4th place among the 19 metropolitan areas of the Fourth Federal Reserve District.
The area is not in a relatively high position among other metropolitan areas of the District in respect to demand deposits, on a per capita basis, nor in respect to retail sales per capita. (See Table 3 on page 12.)
ERIE Metropolitan AreaErie County
(Area H.)
©Fairview
® q Girard
oE.Sp ring fie ld
u?o • i- ia °p|ateaW.Spnngfield©Cranesville
Albion® ^Lundys Lon©
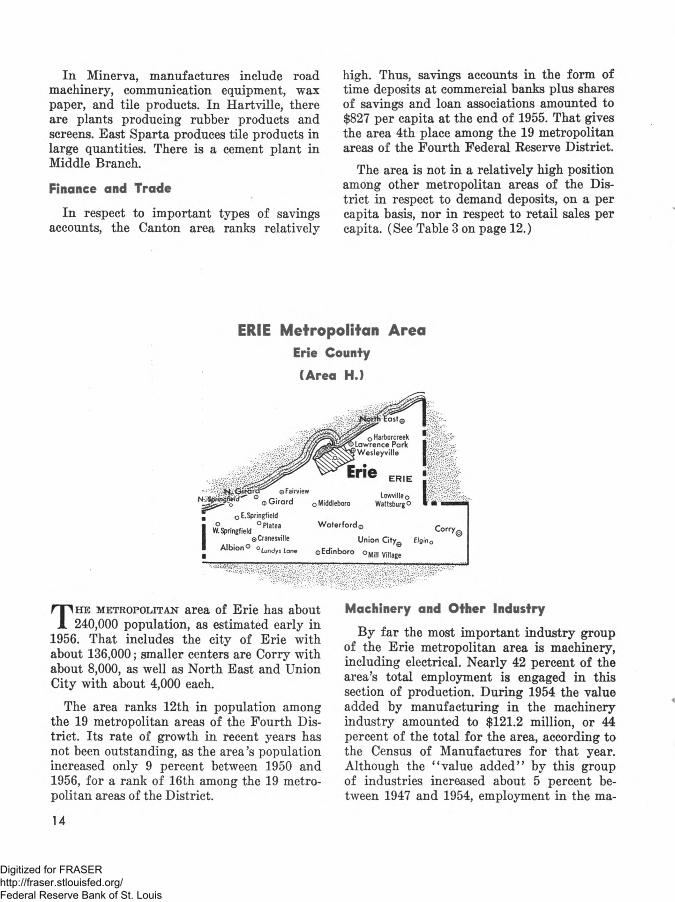
Th e m e t r o p o l i t a n area of Erie has about240,000 population, as estimated early in
1956. That includes the city of Erie with about 136,000; smaller centers are Corry with about 8,000, as well as North East and Union City with about 4,000 each.
The area ranks 12th in population among the 19 metropolitan areas of the Fourth District. Its rate of growth in recent years has not been outstanding, as the area’s population increased only 9 percent between 1950 and 1956, for a rank of 16th among the 19 metropolitan areas of the District.
Machinery and Other Industry
By far the most important industry group of the Erie metropolitan area is machinery, including electrical. Nearly 42 percent of the area’s total employment is engaged in this section of production. During 1954 the value added by manufacturing in the machinery industry amounted to $121.2 million, or 44 percent of the total for the area, according to the Census of Manufactures for that year. Although the ‘ ‘value added” by this group of industries increased about 5 percent between 1947 and 1954, employment in the ma
14
Digitized for FRASER http://fraser.stlouisfed.org/ Federal Reserve Bank of St. Louis

chinery industries dropped 31 percent during the same period. At the same time, total employment in the Erie area declined by 14 percent.
Metals and metal products account for another 20 percent of the area’s total employment. The value added in the metal industry group was $50.2 million in 1954—a growth of 37 percent between the two Census years. Employment in this group declined by 6 percent, however.
The total value added by manufacture in the area during 1954 was $276 million—for a rank of 13th among the 19 metropolitan areas — or $6,943 per manufacturing employee, for a rank of 15th. (See Table 3, page 12.) The latter figure is below the Ohio or the District average and also below the U. S. average. With 172 persons per 1,000 population employed in manufacturing, the area ranks 9th; the monthly payroll of all insured employment in the area is 11th among the 19 metropolitan areas of the District.
In Erie, large plants employing 1,000 or more manufacture the following: locomotives, paper products, steel forgings and castings, electronic components, and cranes and power shovels. Plants employing between 500 and 1,000 persons, each, produce rubber goods, toys, control equipment, scientific instruments, boilers, and plumbers’ supplies.
A substantial number of establishments in Erie which employ between 100 and 500 workers produce a wide variety of commodities in both hard and soft goods lines. These
commodities include malleable iron castings, clothes wringers, rolling mill equipment, electric motors and generators, electric switchboards, hardware specialties, asphalt and asbestos roofing, pig iron, forge shop equipment, pumps and valves, nonferrous castings and tubing, storm windows and doors, ladies’ garments, enameled products, paperboard boxes, steam engines, bottle caps, and bolts and nuts. Also, Erie is coming to be a center for the manufacture of miscellaneous plastic products, molded as well as extruded.
Of the other manufacturing centers in Erie county, C o r r y is the largest. In Corry, there are four large plants, with a combined employment of about 2,000, which manufacture aircraft parts, metal springs, office furniture, and engines. At Girard is located a large establishment producing toys and also factories for manufacture of wood products and leather goods, respectively. At North East, there are two important food-processing plants as well as a nonferrous-metals plant. Several furniture plants are at Union City. Trailers are manufactured at Albion, and plumbers’ supplies at Lawrence Park.
Finance and Trade
The Erie metropolitan area ranks somewhere between 7th and 16th among the 19 metropolitan areas of the District in respect to the various measures of finance and trade utilized in this survey. (See Table 3, on page12, items 7, 8, 11, 15, 16, 18.)
15
Digitized for FRASER http://fraser.stlouisfed.org/ Federal Reserve Bank of St. Louis

SANDUSKY-ASHLAND Area6 counties
(Area 3.)
Bellevue® Monroeville . Co llin t .® 0
Norwalk
H U R O N Clarksfleld
Olena o0Havana
. , North FairfieldSteuben O o
@Willard
lorth Fairfield
Fitchvill*0 © New tondori-U ;^
New Haven0 Delp%© N0Va
Greer ^ich Sullivan
O Savannah West Salem s Burbank* Pnlk
®Spencer ° ° m Sharon Center0
M E D IN A
© o W adsworth©Homerville Leroy @
MarshallvilleW A Y N E Smithville
Weilersvlllea (o)_O rrv ille
Seediburg Dalton©
Apple Creek QKidron0
W. Lebanon Shreve Fredericksburg M( Ea(on°
® © ____?:■ £% •„ © Lakeville 0Holmesville M(-Hopo_ JvUugonv ille H O L M E S ° . o ^
o , Bcntono WmesburgNashville
Millersburg Berlin 0
0Clenmonl Wa/nuf Creek
©Killbuck ^ Charm
Th i s town-and-country area lies west and south of the Cleveland, Lorain, and
Akron metropolitan areas. Its industrial and agricultural characteristics link it more with the northeastern parts of Ohio than with the northwestern sections.
The area ranks 2nd among the 15 town-and-
country areas of the Fourth District in population growth between 1950 and 1956, with a 15 percent gain estimated for the six-year interval. In absolute numbers, the population of the area, at 278,000, now ranks 10th among the 15 town-and-country areas; in average density per square mile, the area is 5th among the 15.
16
Digitized for FRASER http://fraser.stlouisfed.org/ Federal Reserve Bank of St. Louis

Medium-size and smaller cities are characteristic of the area. The largest city, Sandusky, has a population of about 33,000, according to estimates of early 1956. Next are Ashland and Wooster, with about 16,000 each. Smaller centers, ranging from 11,000 down to about 5,000 include: Norwalk, Wadsworth, Bellevue, Medina, Orrville, Willard, Huron, and Rittman.
Manufacturing Strength
The importance of manufacturing in the Sandusky-Ashland area is shown by the large number of manufacturing employees per1,000 of population. With 119 employees per thousand, the area leads the list of 15 town- and-country areas of the District.
The largest plants in S a n d u s k y manufacture the following products: ball bearings, auto parts, radios and television, washing machines, and paper products. Other important products manufactured in Sandusky include: steel castings, chain couplings, aluminum and magnesium smelter products, rubber toys, school supplies, gray iron castings, fertilizers, nuts and bolts, porcelain insulators, and concrete pipe. Sandusky is important as a lake port, especially in coal shipments, boat building, commercial fishing, and summer resort business. The city is also a center of the wine-making industry. Elsewhere in Erie county the notable products are Portland cement in Baybridge, lighting fixtures in Vermilion, and nonferrous bearings in Birmingham. Stone quarrying is also important in Erie county.
A s h l a n d has a large plant for the manufacture of water pumps and sprays as well as several rubber plants producing a score of rubber products. A large commercial printing establishment is also located in the city. Other important products manufactured in Ashland are: pipe fittings and castings, men’s and boys’ wearing apparel, and veterinary medicines.
An auto-bus factory is located at Loudon- ville (Ashland county) and a plant manufacturing plumbing fixtures at Perrysville.
In Wayne county, the largest single plant, located in Rittman, manufactures paper box- boards; also in Rittman is a salt plant. A variety of hard goods are produced in W o o s t e r , including: household rubber goods, pumping equipment, seamless steel tubing, steel building parts, nonferrous foundry products, and cooking utensils. Steel castings, preserved foods, and mechanical controlling instruments are manufactured at Orrville, porcelain electrical supplies at Shreve, and pottery products in Fredericksburg.
A large match factory with approximately 1,400 employees is located at Wadsworth in Medina county. Other leading products of Wadsworth include valves, rubber footwear, and gray iron castings. Products of M e d i n a include, among others: nonferrous castings, heating equipment, and apiary supplies.
In Huron county, electric lamps, farm machinery, and vegetable oils are produced at B e l l e v u e ; wool carpets, valves, and furniture at N o r w a l k ; rubber products at Willard; and men’s apparel at New London.
Products manufactured in Holmes county include building stone at Glenmont, rubber products at Killbuck, and furniture at Millersburg.
Agriculture
Agricultural activity in the Sandusky- Ashland area reflects its proximity to the Cleveland area as well as to several other metropolitan areas in Northern Ohio. Dairying and raising of hogs, poultry, and beef cattle, together with other complementary enterprises, represent a balanced farming.
According to the 1954 Census of Agriculture, the value of all farm products sold amounted to $66 million, representing a return of $46.80 per acre of farm land. Such an average income per acre is appreciably above the District average and places the area 4th among the 15 town-and-country areas of the District.
17
Digitized for FRASER http://fraser.stlouisfed.org/ Federal Reserve Bank of St. Louis
Nearly two-thirds of cash income is realized from the sale of livestock and livestock products; dairying brings in about 30 percent, while sales of poultry, hogs, and cattle account for approximately 36 percent. Wheat, corn, and soybeans are also important.
Wayne and Erie counties enjoy considerably higher returns per acre than other counties in the area. Their returns per acre are $61.00 and $57.40 respectively, while in Medina, Holmes, and Huron counties the returns are closer to the Ohio average of $42.20 per acre. In Ashland county, the return per acre is approximately $7 below the Ohio average.
Tops in Savings
The Sandusky-Ashland area is first on the list of all 15 town-and-country areas of the Fourth Federal Reserve District in respect to per-capita savings accounts (as measured by time deposits at commercial banks plus shares of savings and loan associations). The area’s figure of $814 per capita is taken as of December 31, 1955.
The area ranks 3rd among the 15 town-and- country areas in demand deposits at commercial banks, on a per-capita basis, as of the same date. Furthermore, with a growth of 39 percent in demand deposits between 1950 and 1955, the area takes 1st place in the rate of growth of demand deposits during the five-year interval. In growth in savings accounts, as here measured, the area ranks 7th among the 15 town-and-country areas.
Retail Trade
The area is also relatively strong in retail trade, as judged by the Census of 1954. In retail sales per capita, as of that year, it was 4th among the 15 town-and-country areas. The growth of retail sales between the years 1947 and 1954, the Sandusky-Ashland area ranks 9th among the 15 comparable areas.
ASHTABULA-KENT Area3 counties
(Area 4.)
Montville,
©Chardon
G E A U G a "
©Kingsville
} E. AshtabulaGeneva-on-the-Lake
© Geneva A S H T A B U L A
-:*0 Unionville o Austinbur8Pierponto
Jefferson
,TL o DorsetThompson
®Rock Creek
0 Hartsgrove Andover^
°N ew Lyme
HuntsbClaridon°r O ?
Chesterland East Clarldon
Burton0 Middlefie
] QSouth Russell
irg C.Orwelto ©o
Windsor Orwell
Williamsfield_Colebrook
Welshfieldr
Parkman0
°Geauga Lake P O R T A G E ®Aurora ©Hiram
©Mantua ©Garret
Windham©
©Freedom Sta.
Kent 0 oCharlestown RavennaNew Milford
o • mfield Rootstown
oMogadoreRandolph® Deerfield.
Atwater
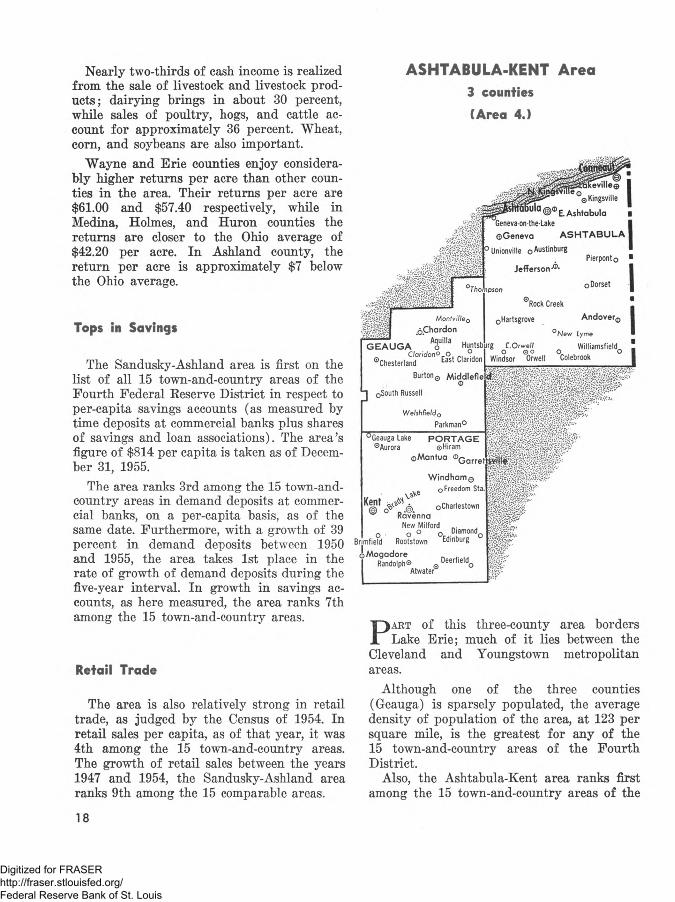
Pa r t of this three-county area borders Lake Erie; much of it lies between the
Cleveland and Youngstown metropolitan areas.
Although one of the three counties (Geauga) is sparsely populated, the average density of population of the area, at 123 per square mile, is the greatest for any of the 15 town-and-country areas of the Fourth District.
Also, the Ashtabula-Kent area ranks first among the 15 town-and-country areas of the
18
Digitized for FRASER http://fraser.stlouisfed.org/ Federal Reserve Bank of St. Louis

District in growth in population between 1950 and 1956; its increase for the period was 17 percent.
As of early 1956, Ashtabula’s population is estimated at 26,000. Next in size in the area is Kent (Portage county) with about 14,000, not including 6,000 university students; then comes Conneaut (Ashtabula county) with about 11,000 and Ravenna (Portage county) also with about 11,000. Smaller centers of about 5,000 eaeh include Geneva, Lakeville and Windham.
Industrial Growth
Manufacturing industries in the Ashtabula- Kent area employ approximately 20,000 persons, or 100 per thousand of the area’s population. The value added by manufacture during 1954 was $139 million. That figure represents a 75-percent growth between the two Census years 1947 and 1954. This rate of growth in “ value added” is 3rd highest among the 15 town-and-country areas of the District. The area is also in 3rd place in the rate of increase in manufacturing employment over the same period. (See Table 3, page 12.)
The leading manufacturing centers of the area are Kent and Ashtabula, which are about equal in number of manufacturing employees.
K e n t , in Portage county, has one large machine shop, employing nearly 1,700 persons and several smaller machine shops employing more than 100 each. There are also large plants manufacturing motors for buses and electric motors. Other important products of Kent include bolts and nuts, diesel engines, and air compressors. Significant for the economic, as well as the educational, life of the community is the very rapid growth of Kent State University in recent years.
In R a v e n n a , also in Portage county, there are several plants producing a variety of rubber items, a foundry turning out gray iron castings, and a plant for manufacture of power cranes and shovels. A large number of
workers are employed by the Federal Government at the Ravenna Arsenal at Apco. Elsewhere in Portage County, rubber tires are produced at Garrettsville and refractories at Windham.
Scores of different products, in both hard and soft goods lines, are produced in A shtab u l a . Plants employing more than 100 each are found in the following lines: ferro-alloys, sodium and titanium extraction, electric motors and generators, leather goods, forgings and stampings, auto parts, chemicals, radio parts, hand tools, plastics, ship boilers, paperboard boxes, electrical appliances, and power-transmission equipment. Commodities produced by principal plants in Conneaut (A shtabula county) are: radio and television parts, concrete products, lighting fixtures, and hand tools. In Geneva, the leading products are sporting goods, forged steel wheels, and builders’ hardware. Paperboard boxes are manufactured at Jefferson.
Summer resort business is important to Geneva, Conneaut, and Ashtabula.
A variety of rubber products are made at Middlefield and Char don, in Geauga county; accounting forms are also produced at Chardon.
Conneaut and Ashtabula are important Lake ports, especially in respect to shipments of iron ore.
Agriculture
There are approximately 7,700 farms in the Ashtabula-Kent area, averaging about 90 acres in size, which brought in $22.5 million of cash income to the area farmers during1954, according to the Census of that year. The return of $33.30 per acre of farm land brought the area a rank of 6th among 15 town-and-country areas in this respect.
Dairying makes up the leading source of income. According to the Census of 1954, nearly 50 percent of total cash income of the area comes from the sale of dairy products. Poultry and hogs bring in 15 percent and 5
19
Digitized for FRASER http://fraser.stlouisfed.org/ Federal Reserve Bank of St. Louis

percent respectively, while sale of cattle accounts for 4 percent of the total.
Portage county derives 10 percent of its total farm income from truck crops and 5 percent from wheat.
Greenhouse crops and fruit account for a significant portion of income in Ashtabula county. Prominent in the greenhouse crops are vegetative flower plant cuttings.
Forest products bring 5 percent of total cash income to Geauga county. Maple syrup is a prominent item.
Finance
The Ashtabula-Kent area appears to rank higher in savings accounts than in demand deposits. It is 3rd among the 15 town-and- country areas of the Fourth District in per- capita savings accounts, in the form of time deposits at commercial banks plus shares of
savings-and-loan associations. At the same time, the area ranks 11th out of the 15 in demand deposits at commercial banks, expressed on a per-capita basis. (Both measures are as of the close of 1955.)
The area ranks 5th among the 15 town-and- country areas in its growth in savings accounts (as defined above) between 1950 and1955. Its ranking is 4th among all 15 town- and-country areas in growth of demand deposits during the same period. (See Table 3, page 12.)
Strength in Trade
The Ashtabula-Kent area scores 3rd among the 15 town-and-country areas of the Fourth District in retail sales per capita, according to the Census of 1954. The area’s rank is also 3rd in growth of retail sales between the two Census years 1948 and 1954.
Table 4
LIST OF THE 34 ECONOMIC AREAS OF THE FOURTH DISTRICT
NORTHWESTERN OHIOA. Toledo metropolitan area
Lucas CountyB. Lima metropolitan area
Allen County1. Fremont-Bryan town-and-country area
Counties included: Defiance, Fulton, Henry, Ottawa, Paulding, Putnam, Sandusky, Van Wert, Williams, Wood.
2. Marion-Findlay town-and-country areaCounties included: Auglaize, Crawford, Hancock, Hardin, Logan, Marion, Mercer, Seneca, Union, Wyandot.
CLEVELAND AND EASTERN LAKE ERIE
C. Cleveland metropolitan areaCuyahoga and Lake Counties
D. Lorain-Elyria metropolitan areaLorain County
E. Mansfield metropolitan areaRichland County
F. Akron metropolitan areaSummit County
G. Canton metropolitan areaStark County
H. Erie metropolitan areaErie County (Pa.)
3. Sandusky-Ashland town-and-country areaCounties included: Ashland, Erie, Holmes, Huron, Medina, Wayne.
4. Ashtabula-Kent town-and-country areaCounties included: Ashtabula, Geauga, Portage.
5. Oil City-Meadville town-and-country areaCounties included: Clarion, Crawford, Forest, Jefferson, Venango, Warren.(all in Pa.)
20
Digitized for FRASER http://fraser.stlouisfed.org/ Federal Reserve Bank of St. Louis
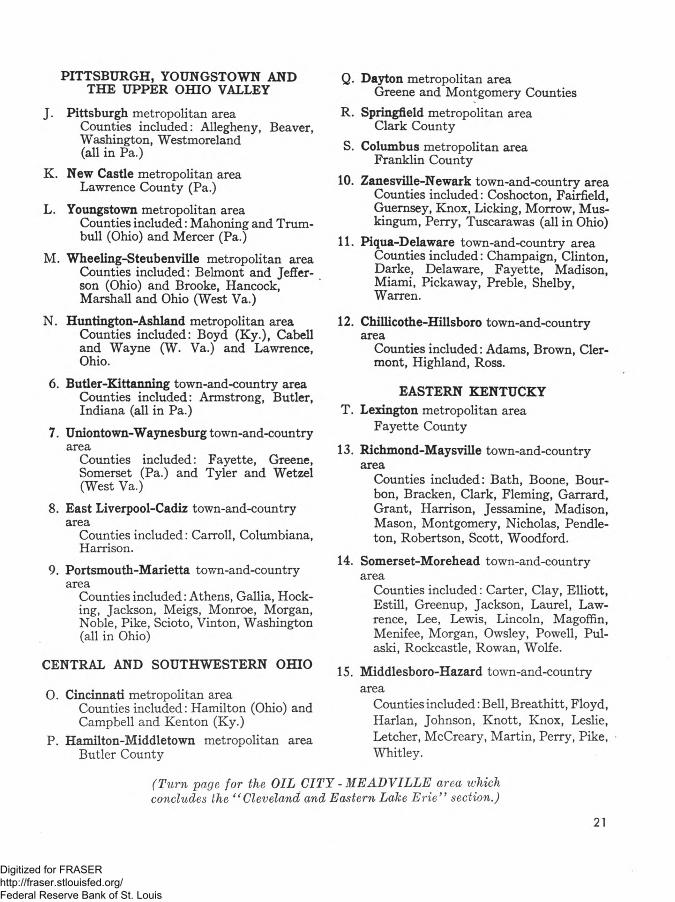
PITTSBURGH, YOUNGSTOWN AND THE UPPER OHIO VALLEY
J. Pittsburgh metropolitan areaCounties included: Allegheny, Beaver, Washington, Westmoreland (all in Pa.)
K. New Castle metropolitan area Lawrence County (Pa.)
L. Youngstown metropolitan areaCounties included: Mahoning and Trumbull (Ohio) and Mercer (Pa.)
M. Wheeling-Steubenville metropolitan area Counties included: Belmont and Jefferson (Ohio) and Brooke, Hancock, Marshall and Ohio (West Va.)
N. Huntington-Ashland metropolitan areaCounties included: Boyd (Ky.), Cabell and Wayne (W. Va.) and Lawrence, Ohio.
6. Butler-Kittanning town-and-country areaCounties included: Armstrong, Butler, Indiana (all in Pa.)
7. Uniontown-Waynesburg town-and-country area
Counties included: Fayette, Greene, Somerset (Pa.) and Tyler and Wetzel (West Va.)
8. East Liverpool-Cadiz town-and-country area
Counties included: Carroll, Columbiana, Harrison.
9. Portsmouth-Marietta town-and-country area
Counties included: Athens, Gallia, Hocking, Jackson, Meigs, Monroe, Morgan, Noble, Pike, Scioto, Vinton, Washington (all in Ohio)
CENTRAL AND SOUTHWESTERN OHIO
O. Cincinnati metropolitan areaCounties included: Hamilton (Ohio) and Campbell and Kenton (Ky.)
P. Hamilton-Middletown metropolitan area Butler County
Q. Dayton metropolitan areaGreene and Montgomery Counties
R. Springfield metropolitan area Clark County
S. Columbus metropolitan area Franklin County
10. Zanesville-Newark town-and-country areaCounties included: Coshocton, Fairfield, Guernsey, Knox, Licking, Morrow, Muskingum, Perry, Tuscarawas (all in Ohio)
11. Piqua-Delaware town-and-country areaCounties included: Champaign, Clinton, Darke, Delaware, Fayette, Madison, Miami, Pickaway, Preble, Shelby, Warren.
12. Chillicothe-Hillsboro town-and-country area
Counties included: Adams, Brown, Clermont, Highland, Ross.
EASTERN KENTUCKY T. Lexington metropolitan area
Fayette County
13. Richmond-Maysville town-and-country area
Counties included: Bath, Boone, Bourbon, Bracken, Clark, Fleming, Garrard, Grant, Harrison, Jessamine, Madison, Mason, Montgomery, Nicholas, Pendleton, Robertson, Scott, Woodford.
14. Somerset-Morehead town-and-country area
Counties included: Carter, Clay, Elliott, Estill, Greenup, Jackson, Laurel, Lawrence, Lee, Lewis, Lincoln, Magoffin, Menifee, Morgan, Owsley, Powell, Pulaski, Rockcastle, Rowan, Wolfe.
15. Middlesboro-Hazard town-and-country area
Counties included: Bell, Breathitt, Floyd, Harlan, Johnson, Knott, Knox, Leslie, Letcher, McCreary, Martin, Perry, Pike, Whitley.
(Turn page for the OIL CITY -M EADVILLE area ivhich concludes the “ Cleveland and Eastern Lake Erie” section.)
21
Digitized for FRASER http://fraser.stlouisfed.org/ Federal Reserve Bank of St. Louis

OIL CITY - MEADYILLE Area6 counties
Mmm.------ -- - - -C R A W F O R D Spartansburg0
SpringQoro© Cam bridge Sp rsP Lincolnvilleo
■ ©Conneautville ^Woodcock
1 Woodcock Cenlerville0
©Saegerstown
crB/j 0 Tryonville
Harmonsburg r/c^ B,0°ming Va"ey° oTownvilleLinesville © ° A Meadville . . . . Hydetown0
Ct " ° Kerrtown©©Nebbon.HiH. 0 y Titusville®©Conneaut Lake Plateau Hts. Pleasantville©
■ Hartsiown 0 oGeneva f T V E N A N G O
Adamsville0 oAlhnllc Cochronton©
W A R R E N
0 Grand Valley
©Tidioute
0 Enterprise
Clarendon®
0 Cooperstown
Rouseville©
R e n o © O il CityFranklin a® Rocky G rove
- ° Seneca
E. Hickory Q Endeavor
f o r e s t ""'’ ° K ,ll' t , , i "e
u — 0Tylersburg i s w s
i t s-J~73orb/e 0 C° ° ksbUrgf J^ /^ la n n g ton - i a ^Lucinda _____________
_ _ _ _ _ _ _ _ _ _ _ 'Truemansville0 Brookston0
,r 0 May burg I
i i H rMarienville©
----- Marble QC L A R IO N Lucmda
Shippenville Fisher0 °Miola
^Clarion
Strattanville
o Limes lone
J E F F E R S O N
°Sige'
oCorsiCa .B ro o k v illeFads Creek c
©Summerville Reynoldsville Rathnel
KnoxDaleo © op° J oftv, (e
r , . Soldier0 © o C o o lsp n n g Sykesville
0 W orthville ’ „. . . Cramer©
®0e Lancey o oDoro Walstono Big Run®
Punxsutnwney© 0 m Hamilton° ©Valier e
Th i s town-and-country area, comprising 6 counties of northwestern Pennsylvania, lie south and east of Erie county. Oil City,
which is close to the center of the area, and Meadville, near the Ohio border, are about equal in population; each has approximately 20,000, as of early 1956.
Other cities include Warren, with about 15,000; also Franklin, Punxsutawney and Titusville with approximately 10,000 each.
Smaller centers include Clarion, Brookville and Polk, each with about 5,000.
The six-county area has a total population of about 282,000, or 8th largest among the 15 town-and-country areas of the District. The average density of population is not great; with 66 persons per square mile, the area’s average density ranks 12th among the 15 town-and-country areas of the District. One of the counties of the area, i.e. Forest
22
Digitized for FRASER http://fraser.stlouisfed.org/ Federal Reserve Bank of St. Louis

County, contains no city or village larger than 1,000.
Manufacturing
The Oil City - Meadville area ranks 3rd among the 15 town-and-country areas of the District both in terms of the total value added by manufacturing and in terms of value added per manufacturing employee. In respect to the number of manufacturing employees per 1,000 population, as well as to the monthly payrolls of all insured employment, the area ranks 5th.
Crawford county leads the industrial activity of the area, especially because of several large plants located in M e a d v i l l e and Titusville. In Meadville are three large plants, together employing approximately 5,000 persons, for manufacture of slide fasteners, rayon yarn, and heating equipment, respectively. Other important commodities produced in Meadville include nonferrous castings and bearings, malleable-iron castings, machine tools, and hand tools. Principal products manufactured in Titusville are: steel plates, fabricated metals, and steel forgings. A food processing plant is located in Springboro, and a rubber-products plant at Conneautville; advertising novelties are produced at Cochranton.
In Venango county, near O i l C i t y , petroleum refineries are located at Rouseville, Emlenton, Reno and Franklin. There are a number of important manufacturing plants, centering in Oil City and Franklin, some of which are associated with the historic oil industry of the county. The following product lines are represented, in approximate order of number of employees: oil well supplies and steel pipe, machinery and mining equipment, air compressors and diesel motors, glass bottles, structural steel, steel containers, and tin cans.
Largest manufacturing plants in " W a r r e n (Warren county) employing 100 or more persons produce radio and television sets, steel shapes, petroleum products, steel tanks,
plastics, furniture, metal shelving, electric lamps, and railroad supplies. A large forge plant is located in Irvine.
In Jefferson county, the principal products are radio and television sets and parts, glass containers, and clay products.
Substantial employment in Clarion county is provided by the glass containers industry. Also significant are rubber goods and clay products.
Important commodities produced in Forest county are glass containers and lumber products.
Mineral-Extractive Industries
Prominent in the area’s economy are mineral-extractive industries. The area produced 18 billion cubic feet of natural gas in 1954. Two counties, Clarion and Jefferson, accounted for more than 90 percent of the total.
Over ten thousand oil wells produced 1,565 thousand barrels of crude oil in 1954. Of this total, 56 percent was produced in Venango county which ranked 2nd in the state of Pennsylvania in crude oil production in that year. Warren county, which ranked 3rd in the state, accounted for 30 percent of the area’s oil output, and Forest county’s share was about 7 percent.
The value of bituminous coal mined in the area was approximately $13 million—nearly all mined in Clarion and Jefferson counties. Sand and gravel, also, are extracted in Crawford, Venango, and Warren counties.
Agriculture
According to the Census of 1954 the area had 9,574 farms which brought nearly $25.5 million of cash income to farm owners. This figure was equivalent to $2,661 per farm, or $24.56 per acre of farm land. In respect to both of these figures, the area ranks 10th among the 15 town-and-country areas in the District. While the income per acre of farm land is below the Ohio and the District aver
23
Digitized for FRASER http://fraser.stlouisfed.org/ Federal Reserve Bank of St. Louis

ages, it is above the average for the United States. Between 1949 and 1954, the two Census years for agriculture, total farm income of the area increased by 5 percent (for the rank of 11th).
Crawford county, with income of $27.98 per acre of farm land, leads the area’s list of six counties.
Dairy products are the area’s most important source of income. In 1954, cash income from this source amounted to $14.2 million, representing 56 percent of the total farm income. About 14 percent of income is derived from livestock and livestock products; 13 percent from poultry; and 12 percent from field
crops. Principal field crops of the area are: com, wheat, oats, and hay.
Finance and Trade
The Oil City - Meadville area ranks 2nd among all 15 town-and-country areas of the Fourth District in respect to demand deposits at commercial banks, expressed on a per-capita basis. That is based on data as of December 31, 1955.
In the other measures of finance or of retail trade volume, as included in this survey, the area’s ranking is not outstanding. (See Table 3, page 12.)
APPENDIX
Classification of Areas. The “ metropolitan areas” used in this study are the Standard Metropolitan Areas as defined by T7. S. Census in agreement with other governmental agencies. The official current list, however, does not include Mansfield, Ohio, and New Castle, Pa. Those two have been considered as metropolitan areas for this study, insofar as their recently estimated population makes it appear appropriate to do so, and it may be anticipated that the official list will soon include them. Also, it may be noted that the Huntington-Ashland metropolitan area (covering counties in three states) is included in this study, although only part of the area lies within the Fourth Federal Reserve District. The part of that area lying outside of the Fourth District, however, has been excluded from Fourth District totals appearing as benchmark figures in the next-to-final column of Table 3.
The “ town-and-country areas’ ’ used in the study are, for the most part, identical with the “ nonmetropolitan” state economic areas used in Census classification. (For the basis of classification, see State Economic Areas, by Donald J. Bogue, Bureau
of the Census, U. S. Department of Commerce, 1951.) Exceptions have been made where necessary due to the fact that the boundaries of the Fourth Federal Reserve District cut across several of the officially designated state economic areas. One additional exception has been made in order to place Ashtabula, Ohio, and East Liverpool, Ohio, in separate areas, which seems a more desirable treatment than that of the standard classification.
In the standard classification of nonmetropolitan state economic areas, numbers but not names are assigned to the various areas. In this study, it has been found necessary to use an independent numbering system and also to assign names. In the case of each town-and-country area designated here, the first named city is the largest city of the area; the second named city is chosen either with reference to geographical location within the area or because it is the second largest city within the area. Examples: Zanesville-Newark area, Fremont-Bryan area; in these cases, Newark was chosen mainly because of its size, while Bryan was chosen largely because of its location near the extreme western end of its area.
24
Digitized for FRASER http://fraser.stlouisfed.org/ Federal Reserve Bank of St. Louis