Embed Size (px)
Citation preview

HT·· 11
·- . r4~27 1992 .
REVENUES,EXPENDITURES AND DEBT
OF MINNESOTA COUNTIES
DECEMBER 31, 1992
Pursuant to Minn. 6.75 and 6~74
This document is made available electronically by the Minnesota Legislative Reference Library as part of an ongoing digital archiving project. http://www.leg.state.mn.us/lrl/lrl.asp

The Office of the State Auditor is a Constitutional Office which serves as a
watchdog for Minnesota taxpayers and helps to assure integrity, accountability,
and cost-effectiveness in government throughout the state.
Through financial, compliance, and special audits, the Office of the State Auditor helps to assure that local governments hold themselves to the highest
standards of integrity. The Office works actively with local government officials
to find more efficient and cost effective ways to spend tax dollars.
The Office performs approximately 320 audits per year. The State Auditor
has oversight responsibilities for 4,300 units of local governments throughout the
state. The local units of government include:
• 1803 townships
• 855 cities
• 429 educational districts
• 87 counties
• 703 police and fire relief association funds
• 145 housing and redevelopment authorities
• 22 port authorities
• 91 soil and water conservation districts
• 150 (approximate) special districts
Through its reports and research, the Office helps local governments to find
new ways to provide essential services more economically and efficiently in order
that they may respond to growing needs with limited financial resources.
The State Auditor serves on the State Executive Council, State Board of
Investment, Land Exchange Board, Public Employee's Retirement Association
Board, Minnesota Housing Finance Agency, and Rural Finance Administration
Board.
@ Printed on Recycled Paper An Equal Opportunity Employer

PREFACE
The annual report of the State Auditor covers the revenues, expenditures, indebtedness,
taxable tax capacities and tax levies of the counties in Minnesota for the fiscal year ended
December 31, 1992. Populations were taken from "Minnesota Population, 1992" from the
Office of the State Demographer. This information has been collected and is published and
distributed pursuant to Minnesota Statutes, Sections 6. 74 and 6. 75.
The Office of the State Auditor has generated this report using dBASE IV and IBM
compatible personal computers. Anyone wishing to analyze the data further should contact
this office by calling (612) 297-3682. Diskettes are available.
My staff and I want to express our appreciation to all whose cooperation contributed to the
preparation of this report.
April 12, 1994
1

PREFACE
The annual report of the State Auditor covers the revenues, expenditures, indebtedness,
taxable tax capacities and tax levies of the counties in Minnesota for the fiscal year ended
December 31, 1992. Populations were taken from "Minnesota Population, 1992" from the
Office of the State Demographer. This information has been collected and is published and
distributed pursuant to Minnesota Statutes, Sections 6. 74 and 6. 75.
The Office of the State Auditor has generated this report using dBASE IV and IBM
compatible personal computers. Anyone wishing to analyze the data further should contact
this office by calling (612) 297-3682. Diskettes are available.
MY staff and I want to express our appreciation to all whose cooperation contributed to the
preparation of this report.
April 12, 1994
i

County spending for human services declined $124. 8 million or -10 .4 percent between 1991 and 1992. The decrease in human service spending was caused primarily by the transfer of income maintenance programs to the state, which directly issues income maintenance payments under a state developed computer system (MAXIS). Counties remain responsible for a share of these programs' administrative costs.
Counties increased current expenditures on all services with the exception of human services and economic development. Sanitation, public safety, general government and streets and highways posted the largest dollar increases in spending from 1991 to 1992. These increases cumulatively were smaller than the decreased spending on human services. As a result, even though current expenditures declined in 1992, when human service expenditures are excluded, spending for all other county services increased 10.8 percent between 1991 and 1992.
Capital Outlay
County spending for capital outlay increased nearly $87 million or 26 percent between 1991 and 1992.1 Streets and highways accounted for 66 percent of all capital investments and increased 26.6 percent in 1992. Counties' expenditures on capital outlay also increased for public safety, libraries, human services, natural resources, and parks and recreation. Spending for capital investments decreased for other county services.
Debt Service
Counties also spent $112.9 million in principal and interest payments to reduce existing long-term debt. Debt service payments increased 18.6 percent between 1991 and 1992.
COUNTY REVENUES
To finance public services in 1992, counties raised $2.8 billion in revenues (excluding borrowing). Revenues declined $14.8 million or 0.5 percent between 1991 and 1992. Once again, the transfer of income maintenance programs to the state impacts these tren~s.
Minnesota's counties derived their revenues from a variety of sources, but property taxes and state grants are the two largest revenue sources for counties. The relative share of county revenues continued to shift in 1992. Minnesota counties relied more heavily on property taxes in 1992 than 1991, in part to offset reduced revenues coming from state and federal governments, and in part to support increased spending. Counties collected $1.1 billion in local property taxes, which represented 38.2 percent of total county revenues in 1992, compared to 36.3 percent the previous year. Counties received $881.2 million in state grants, which accounted for 31.4 percent of total revenues, compared to 32.4 percent in 1991. Federal grants of $335.9 million in 1992 represented the third largest revenue source for counties.
Spending on capital projects is cyclical; year-to-year fluctuations are to be expected.
iv

Revenues from property taxes increased $48 million or 4. 7 .percent, the largest increase of all revenues sources. Counties also increased their revenues from charges for services ($10.8 million or 5.3 percent), special assessments ($2.4 million or 16.6 percent), fines and forfeits ($1 million or 5.8 percent), and licenses and permits ($668 thousand or 7.3 percent).
State grants, the second largest revenue source for counties, declined $32.9 million or 3.6 percent, in 1992. This is the second year of decreases in state grants to counties. State human service grants, which declined $97. 8 million, accounted for the lion's share of the decline in state grants between 1991 and 1992.
Federal grants declined $36.1 million, or 9. 7 percent, from 1991 to 1992. The decline in federal grants continues a marked trend in which federal grants have made up ever smaller shares of total county revenues. When state and federal human service grants are excluded, total revenues increased 6.3 percent in 1992.
Revenues from Borrowing
Revenues from bonds and other long-term debt increased $245 million or 150 percent from 1991 to 1992. Seven of Minnesota's larger metropolitan or urbanized counties2 accounted for 81 percent of total borrowing in 1992. Some counties financed new projects, while others refunded bonds to take advantage of lower interest rates.
COUNTY ENTERPRISE FUNDS
Besides the services discussed above, counties provided some services as enterprise operations. Enterprise funds are used for specific services intended to be self-sustaining through fees and user charges. Hospitals, nursing homes, and solid-waste management facilities are commonly operated as enterprises. ·
In 1992, counties spent $572.3 million on enterprise operations. Revenues from public service enterprises totaled $547 .1 million that year, resulting in a total operating loss of $25 .1 million. Hospital enterprises accounted for $23.8 million of total losses, nursing homes for $1.5 million in losses, while other county enterprises reported operating income of $198,324.
STATEWIDE DATA MASK LOCAL TRENDS
Statewide spending and revenue data mask considerable variation among Minnesota counties. For example, Hennepin and Ramsey counties combined account for 38 percent of total current expenditures for all counties. When aggregated into a statewide database, major changes in spending and revenue patterns in these counties can mask significant fiscal trends in the other 85 counties as well as the other five metropolitan counties.
2 Anoka, Dakota, Olmsted, Ramsey, Scott, Stearns and Washington counties.
V

Hennepin and Ramsey counties account for most of the decreases in human services expenditures and intergovernmental revenues in 1992. These counties were among the last to implement the state computer system by which the state issues income maintenance payments directly. These changes significantly influenced both statewide and metro trends.
For instance, Hennepin and Ramsey counties' decline in revenues was so large it offset the increases in revenues experienced by other counties. Although statewide data show county revenues declining 0.5 percent in 1992, the nonmetropolitan counties actually saw their revenues increase by 1.2 percent, while Anoka, Carver, Dakota, Scott and Washington counties combined increased their revenues 7 .2 percent. In contrast, Hennepin and Ramsey counties decreased revenues 5.4 percent between 1991 and 1992.
Similarly, Hennepin and Ramsey counties' decline in current expenditures was much greater than elsewhere. Statewide counties decreased current expenditures 2.5 percent in 1992. In Hennepin and Ramsey counties current expenditures declined 6.9 percent ($64 million) while the Greater Minnesota counties decreased their spending 0.4 percent ($4.5 million). However, in the other five Twin Cities metropolitan counties current expenditures increased 3.2 percent ($9.9 million). County-by-county variations were even greater.
Total capital outlays increased $87 million (26 percent) in 1992. However, 34 counties decreased their spending on capital outlay, while six counties accounted for 85 percent of the increase in capital outlays - Dakota, Hennepin, Olmsted, Ramsey, St. Louis and Washington. In addition to increased spending for streets and highways, large projects in these counties included construction of a new government center in Olmsted County, renovation of the historic courthouse in Ramsey County, construction of a new detention center in Washington County, and construction of new libraries in Dakota, Hennepin and Ramsey counties.
SUMMARY
Minnesota counties are continually challenged with the need to provide essential services while revenues continue to shift from state and federal grants to local property taxes, charges for services, and other local sources. At first glance statewide trends in county revenues and spending appear to indicate that Minnesota counties managed to control spending between 1991 and 1992. However, changes in financing human service programs, the predominant county activity, dominate and skew these trends. County property taxes continued to increase in 1992, placing increasing demands on local property owners. Given the fiscal pressures and increasing demands for services facing Minnesota counties, it is essential that all county officials continue to focus on opportunities to improve the efficiency and effectiveness of their service delivery systems.
vi

TABLE OF CONTENTS
PREF ACE . . . . . . . . . . . . . . . . . . . . . . . . . . . . . . . . . . . . . . . . . . . . . . . . i
EXEClJTIVE SUMMARY . . . . . . . . . . . . . . . . . . . . . . . . . . . . . . . . . . . . . . iii
STATISTICAL SUMMARY ..................................... 1
LIST OF FIGURES
FIGURE 1: REVENUES OF THE COUNTIES FOR 1992 . . . . . . . . . . . . . . . . . 4
FIGURE 2: EXPENDITURES OF THE COUNTIES FOR 1992 . . . . . . . . . . . . . . 4
FIGURE 3: REVENUES AND EXPENDITURES OF THE COUNTIES ......... 5
FIGURE 4: BONDED INDEBTEDNESS OF THE COUNTIES ........... ~ . . 5
LIST OF TABLES
TABLE 1: REVENUES, EXPENDITURES AND BONDED DEBT OF COUNTIES . 9
TABLE 2: CLASSIFICATION OF COUNTY REVENUES . . . . . . . . . . . . . . . 10
TABLE 3: CLASSIFICATION OF COUNTY EXPENDITURES . . . . . . . . . . . . 11
TABLE 4: OUTSTANDING INDEBTEDNESS OF COUNTIES . . . . . . . . . . . . 40
TABLE 5: ANALYSIS OF COUNTY HOSPITAL OPERATIONS . . . . . . . . . . . 42
TABLE 6: ANALYSIS OF COUNTY NURSING HOME OPERATIONS . . . . . . . 43
TABLE 7: ANALYSIS OF OTHER COUNTY ENTERPRISE OPERATIONS . . . . 44
DEFINITION OF TERM'S . . . . . . . . • . . . . . . . . . • . . .· . . . . . . . . . . . . . . . . 47
vii

STATISTICAL SUMMARY
SCOPE
This report presents financial data on the 87 counties in Minnesota for the fiscal year ended December 31, 1992. The data in this report were generated from the audited annual financial statements of the counties and from_ Department of Revenue reports of levies and tax capacities. All counties report their governmental funds on the modified accrual basis of accounting.
OPERATIONS
A comparative summary of revenues, expenditures, and outstanding bonded indebtedness of the counties for the years 1988 through 1992 is presented in Table 1. Governmental revenues and expenditures reported in Tables 2 and 3 include the general fund and all other governmental funds. County hospitals and nursing homes are _considered public service enterprises and their financial operations are presented in separate tables. Population figures are based on the 1992 population estimates from the office of the State Demographer.
Counties serve as agents for other governmental units in the collection and distribution of taxes and grants, in addition to their governmental functions. The county "agency" funds that account for these monies are not included in the report.
REVENUES
Revenues of county governmental funds totaled $2.81 billion in 1992, which is $14.8 million or 0.5% lower than in 1991. The two main sources of county revenues are property taxes and intergovernmental revenues, which together accounted for 82.7% of total revenues in 1992. (See Figure 1.)
Over the past five years, the percentage of revenues from taxes has increased from 36.0% in 1988 to 38.2% in 1992. Intergovernmental revenues have decreased from 47.8% in 1988 to 44.5% in 1992. During this five year-period, the amount of taxes collected increased from $843.6 million to $1.07 billion, and intergovernmental revenues increased from $1.12 billion to $1.25 billion.
EXPENDITURES
Expenditures (including principal payment on debt) by counties for governmental functions in 1992 totaled $2.83 billion, which is an increase of $46.0 million, or nearly 1.7% over 1991.
1

The increase over the five years from 1988 to 1992 is $465.0 million, or 19. 7%. The category (including current expenditures and capital outlay) with the greatest increase was public safety, which rose $129.5 million. General government expenditures rose $123.0 million, highway expenditures increased $78.6 million, and debt service expenditures rose $65 .1 million during the last five years.
For 1992, human services was the largest county function, accounting for 46.9% of the total current expenditures in 1992. (See Figure 2.)
1991 1992 HUMAN SERVICES EXPENDITURES Amount Amount
Income Maintenance 450,500,070 361,792,843
Social Services 436,124,068 489,533,373
Other Welfare Costs J14.1J6. 720 224.651.769
Total 1.200. 760.858 1.015 .977.985
This report does not include direct welfare payments for the counties made by the State Department of Human Services. Five counties do not report detailed welfare expenditures. These five comprise two welfare districts and report all expenditures in the "Other Welfare Costs" category. Consequently, the detail of welfare expenditures is presented for reference purposes only. Lincoln, Lyon, and Murray counties comprise the Region VIlI North Welfare Board and the Counties of Faribault and Martin form the Faribault-Martin Human Services Board.
OPERATION OF PUBLIC SERVICE ENTERPRISES
The financial operations of county hospitals, nursing homes, and other county service enterprises are presented in Tables 5, 6, and 7. These enterprise funds report their operations using the accrual basis of accounting. ·
The 15 county hospitals had operating revenues of $318.7 million and operating expenses of $342.5 million, resulting in an operating loss of $23.8 million. The non-operating revenues, totaling $19.6 million (primarily Hennepin County's $16.5 million in taxes and grants), still resulted in a net loss of $8.5 million for all hospitals.
Counties operated 15 nursing homes during 1992. The results of operation for 13 of the nursing homes are shown on Table 6. (Two nursing homes include their operation with the county hospital.) County nursing homes had operating revenues of $48.9 million and operating
2
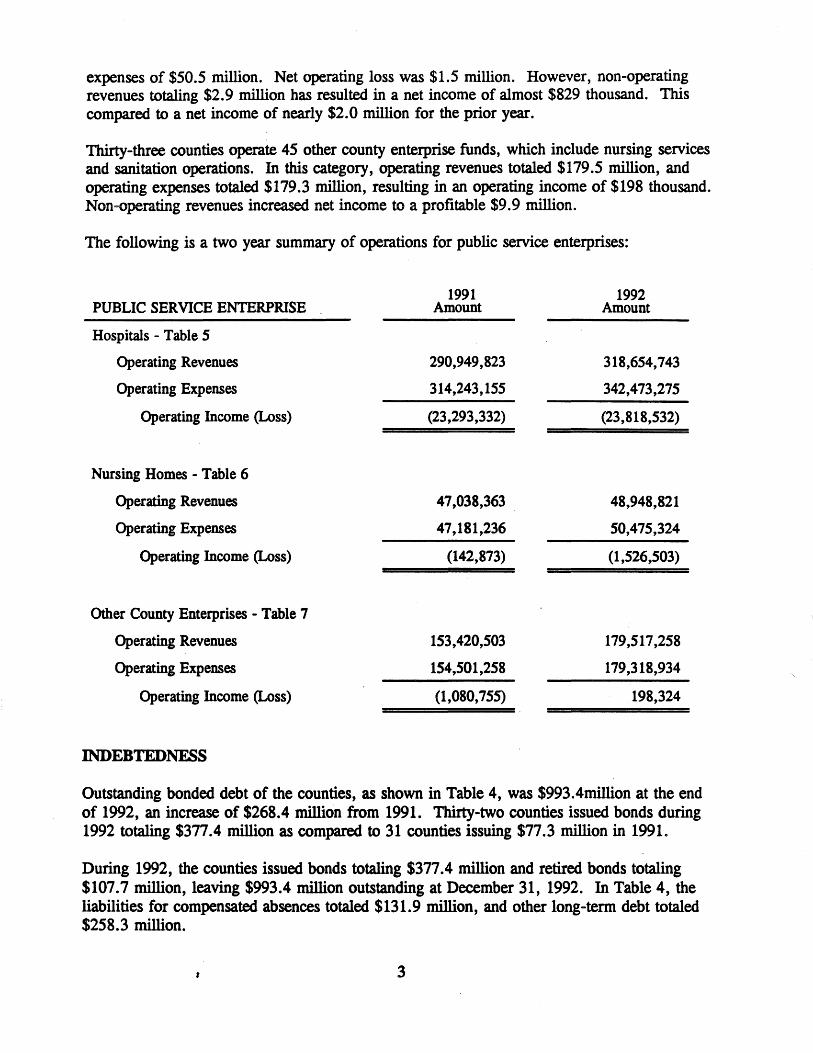
expenses of $50.5 million. Net operating loss was $1.5 million. However, non-operating revenues totaling $2.9 million has resulted in a net income of almost $829 thousand. This compared to a net income of nearly $2.0 million for the prior year.
Thirty-three counties operate 45 other county enterprise funds, which include nursing services and sanitation operations. In this category, operating revenues totaled $179.5 million, and operating expenses totaled $179.3 million, resulting in an operating income of $198 thousand. Non=0perating revenues increased net income to a profitable $9.9 million.
The following is a two year summary of operations for public service enterprises:
PUBLIC SERVICE ENTERPRISE
Hospitals - Table 5
Operating Revenues
Operating Expenses
Operating Income (Loss)
Nursing Homes - Table 6
Operating Revenues
Operating Expenses
Operating Income (Loss)
Other County Enterprises - Table 7
Operating Revenues
Operating Expenses
Operating Income (Loss)
INDEBTEDNESS
1991 Amount
290,949,823
314,243,155
(23,293,332)
47,038,363 .
47,181,236
(142,873)
153,420,503
154,501,258
(1,080,755)
1992 Amount
318,654,743
342,473,275
(23,818,532)
48,948,821
50,475,324
(1,526,503)
179,517,258
179,318,934
198,324
Outstanding bonded debt of the counties, as shown in Table 4, was $993.4million at the end of 1992, an increase of $268.4 million from 1991. Thirty-two counties issued bonds during 1992 totaling $377.4 million as compared to 31 counties issuing $77.3 million in 1991.
During 1992, the counties issued bonds totaling $377.4 million and retired bonds totaling $107.7 million, leaving $993.4 million outstanding at December 31, 1992. In Table 4, the liabilities for compensated absences totaled $131.9 million, and other long-term debt totaled $258.3 million.
3

FIGURE 1 Governmental Revenues
$2,809,350,707
Special Assessments 0.6%
Federal Grants 12.0%
Local Grants 1.1 %
State Grants 31.4%
Taxes 38.2%
Fines & Forfeits 0. 7% All Other Revenues 4.8%
Interest Earnings 3.6%
Service Charges 7.7%
FIGURE2 Total Governmental Expenditures
$2,829,872,712
Human Services 38.3%
Culture & Recreation 3.0% All Other Expend. 3.0%
General Government 15.4%
Health 3.8%
Highways 16.9%
Natural Resources 1.5%
Public Safety 14.0%
Debt Service 4.0%

FIGURE3 GOVERNMENTAL REVENUES & EXPENDITURES *
Billions $3.00 ------------------------, "~ ~ "~ ~ $2.2S r
$2.00 t--------$1.75 I-. $1.S0 I·. $1.25 $1.00 $0.75 $0.50 I I ..
$0.25 ~~ .
1982 1983 1984 1985 1986 1987 1988 1989 1990 1991 1992
Year
I • REVENUES • EXPENDITURES I • Excludes Prlacipal Paymeats
FIGURE4 OUTSTANDING BONDED INDEBTEDNESS
Millions $1200
$1100
$1000
$900
$800 1------------------------------t· ...... $700 I ~ t-t · . . ....
$600 I r.7-..................................... ... $500 1---------------------1:::.H.·::.H.·.·.·:H.·.·.·: ...
$400 - 1--------,--...,...--1' ... ~ ... 1--1 ... •1---f .......
$300 ,............ I r.7-w::: :~ .... .._. .... +--+ ... +--t ... t--t ................ ...
t-----ro---i--1, ... .,___._ ·: :. ·1---1:::. ·1---1:::: 1---1:::: 1----1::. · .. J--l'.' :: .1---1 ·: ::.1---1 · .... :. $200,_
$100
$0 1982
.... t--t .... t--f .... t--f .... t--f .... t--f .... f--i .... .t---i. ... -1--i ... -1--i .... 1-,
1983 1984 1985 1986 1987 1988 1989 1990 1991 1992
Year

REVENUES,EXPENDITURES
AND DEBT
OF MINNESOTA COUNTIES

\0
TABLE 1 REVENUES, EXPENDITURES, AND BONDED DEBT OF THE COUNTIES FOR THE YEARS ENDED DECEMBER 31, 1988, 1989, 1990, 1991 AND 1992
1991 - 1992 GOVERNMENfALFUNDS 1988 1989 1990 1991 1992 % Increase
REVENUF.S AMOUNT % AMOUNT % AMOUNT % AMOUNT % AMOUNT % [Decrease]
LICENSES AND PERMITS 6,794,353 0.3% 7,646,576 0.3% 7,846,392 0.3% 9,177,63'1 0.3% 9,846,155 0.4% 7.3% INTERGOVERNMENTAL REVENUES
LOCALUNITSGRANI'S 22,769,533 1.8% 14,732.051 0.6% 25,886,741 0.9% 25,656,829 0.9% 31,678,020 1.1% 23.5% TOTAL INTERGOVERNMENTAL REVENUES 1,118,475,581 47.8% 1,271,301,022 49.1% 1,394,119,050 49.8% 1,311,848,259 46.5% 1,248,830,238 44.5% -4.8%
INTEREST EARNINGS 75,984,120 3.2% 102,871,673 4.0% 106,779,368 3.8% 105,462,283 3.7% 102,324,757 3.6% -3.0% ALL ontER REVENUES 106,844,639 4.6% 102,40t,101 4.0% 119,623,956 4.3% 135,114,612 4.8% 123,344,778 . . 4.4% -8.7%
BORROWING 87,9~774 371,547,508 112,191,244 98,158,748 245,030,608 149.6% Htti:t~~:AW:ijQ~Jtttt(J:J\t~~Mn.i$.,.,::tldfJ:t:t:J:<::::~~,•~~J1U:l:t::Jt?tttt::~~~~'?.~M®t::ttt:/?tt:t :g~~~~~~·M~f/ :=::;: ttM~~~~~~--U$:C:::::':::::::::?,' ',,: < ::, < >: 4~%
EXPENDrIURP.S
PUBLIC SAFEIY - Oment Expenditures 252,460,827 10.7% 281,764,320 10.4% 307,242,079 10.7% 328,637,603 11.8% 354,679,853 12.5% 7.9%
llli• iliiiiiirJmllll!lllilli;;:111iii • II lii1 11111ii l!i!lri; l ;j~i ~iiliii ii .iji Iii ············•~ii\ · ..... ;~i5 SANITATION- CUrrent Expenditures 14,486,390 0.6% 19,565,093 0.7% 28,417,760 1.0% 31,755,125 1.1% 38,833,875 1.4% 22.3%
1111111.iJiii :i ll ;:. ;;;::!~#, liti,; f =x:.?s!:::t):j:!f Si;:. ii!ii .. ;.;.. .. ~:lit 1•1ii 11~&11 ti ii!~- ; iii i .. ti iii. HUMAN SERVICES - Oirrent Expenditures 1.079,961,416 45.7% 1,188,841,962 43.8% 1,278,737,079 44.7% 1,200,760,858 43.1% 1,075,977,985 38.0% -10.4%
:111&111s•Jtlifif: il'lliilil!~l•ll!tidifli:11 1ii:1 :11•iii1:1 :1:ii •::;jfiii • iii; ll'tli :iii1nt1iiii f~i· 1j\1i PARKS AND RECREATION - Current Expenditures 18,671,922 0.8% 21,353,187 0.8% 23,236,688 0.8% 23,639,280 0.8% 26,034,480 0.9% 10.1 %
•l• ®llllliill11iii~il!l!•li1• :jfi t•l'llitii.llillii!I iii i ii:: lliii i IiiI ~~i,i Ii~ir····· ·•·••••••·~,~!! ECONOMIC DEVELOPMENT - Current Expenditures 12,903,374 0.5% 20,094,572 0.7% 23,287,786 0.8% 23,856,723 0.9% 22,263,271 0.8% -6.7% -•••~ •••• 1a• ii~1a•111a1i~11m11t~J1
DEBT SERVICE- Principal Paid on Bends 23,211,515 1.0% 109,440,350 4.0% 32,701,290 1.1% 34,057,264 1.2% 44,634,407 1.6% 31.1% - Other Lmg-term Debt 4,120,726 0.2% 7,824,116 0.3% 11,218,971 0.4% 16,629,779 0.6% 19,353,164 0.7% 16.4% -•• -11•1•1•• m1• 1=1111a1••s~ TOTALCAPITALOUILAY 280,934,815 11.9% 341,483,449 12.6% 380,631,931 13.3% 333,954,984 12.0% 420,915,509 14.9% 26.0%
TOTAL DEBT SERVICE 47,808,603 2.0% 144,995,813 5.3% 86,262,520 3.0% 95,238,690 3.4% 112,911,756 4.0% 18.6% ttt?tttt~~m:;~::::•• :::::::::::•• :'''•t•:tnttt>t:~>~~~~<>~®.~:::/ >~10:~Au t?t.~~<•::::::::wMn~••$.: •tJ~~•< >2-,.,>l.O~<<:•OI)~: · :::::::·~~,,z1~::: ?100~•···• .. ••·••· ............ ••·1.11'
SUMMARY OP BONDED DEBT TRANSACTIONS
-~~;}~~~!J'.1
••·· ·•·····•·•·•·•·•·•. I +•Ji/ ;:: ii(ii)Ci ::I lilf iiilliliJilli i'lll'i iii j'j l IlllliiB: ; ;:; :ilili ili t··•.••· OUTSTANDIJIO DECEMBER 31 398,451,791 644,578,837 717,579,247 724,992,252 993,403,701
NOTE: C-JTIIEJANUARY 1 BALANCE HAS BEEN ADJUSTED FOR DEBT INCORRECILY REPORTED INnIE PREVIOUS YFAR.
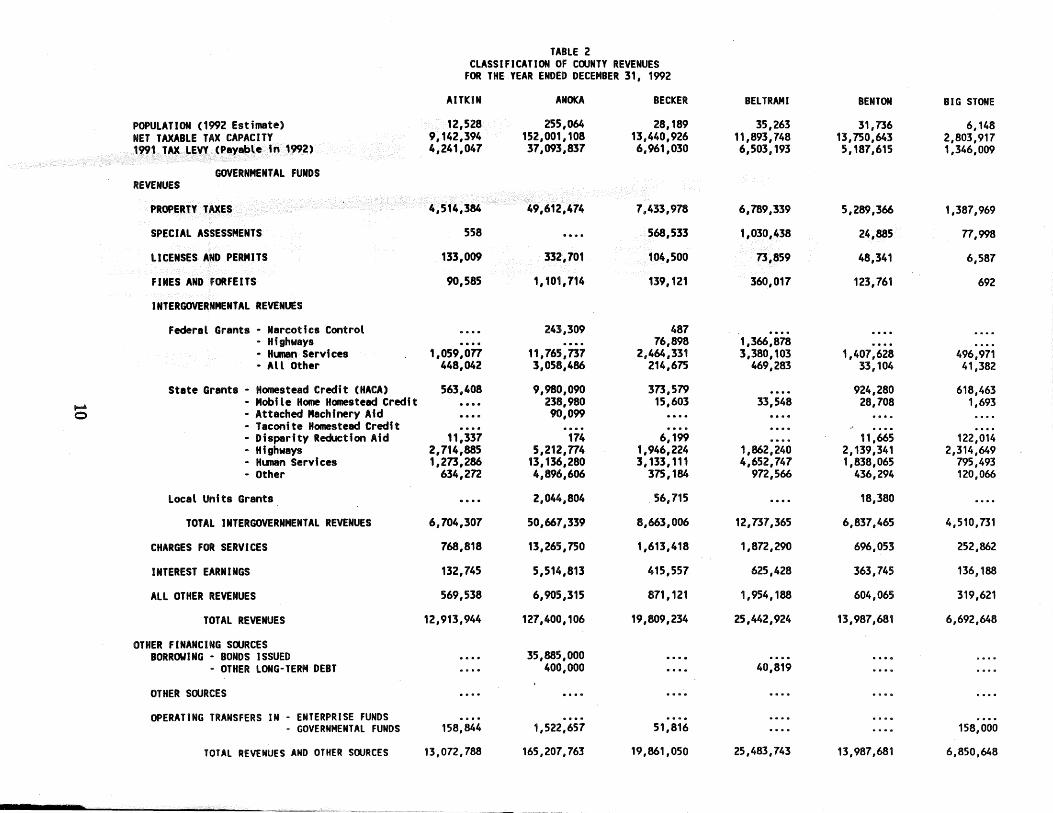
TABLE 2 CLASSIFICATION OF COONTY REVENUES
FOR THE YEAR ENDED DECEMBER 31, 1992
AITKIN ANOKA BECKER BELTRAMI BENTON BIG STONE
POPULATION (1992 Estimate) 12,528 255,064 28,189 35,263 31,736 6,148 NET TAXABLE TAX CAPACITY 9,142,394 152,001,108 13,440,926 11,893,748 13,750,643 2,803,917 1991 TAX LEVY (Payable in 1992) 4,241,047 37,093,837 6,961,030 6,503, 193 5,187,615 1,346,009
GOVERNMENTAL FUNDS REVENUES
PROPERTY TAXES 4,514,384 49,612,474 7,433,978 6,789,339 5,289,366 1,387,969
SPECIAL ASSESSMENTS 558 .... 568,533 1,030,438 24,885 n,998
LICENSES AND PERMITS 133,009 332,701 104,500 73,859 48,341 6,587
FINES AND FORFEITS 90,585 1,101,714 139,121 360,017 123,761 692
INTERGOVERNMENTAL REVENUES
Federal Grants - Narcotics Control .... 243,309 487 - Highways .... . ... 76,898 1,366,878 • Hunan Services 1,059,on 11,765,737 2,464,331 3,380,103 1,407,628 496,971 • All Other 448,042 3,058,486 214,675 469,283 33,104 41,382
State Grants - Homestead Credit (HACA) 563,408 9,980,090 373,579 .... 924,280 618,463 ~
- Mobile Home Homestead Credit .... 238,980 15,603 33,548 28,708 1,693 0 - Attached Machinery Aid ... ., 90,099
• Taconite Homestead Credit .... . ... · Disparity Reduction Afd 11,337 174 6,199 .... 11,665 122,014 - Highways 2,714,885 5,212,n4 1,946,224 1,862,240 2,139,341 2,314,649 - Hunan Services 1,273,286 13,136,280 3,133,111 4,652,747 1,838,065 795,493 - Other 634,zn 4,896,606 375,184 9n,s66 436,294 120,066
Local Units Grants .... 2,044,804 . 56,715 . ... 18,380
TOTAL INTERGOVERNMENTAL REVENUES 6,704,307 50,667,339 8,663,006 12,737,365 6,837,465 4,510,731
CHARGES FOR SERVICES 768,818 13,265,750 1,613,418 1,Bn,290 696,053 252,862
INTEREST EARNINGS 132,745 5,514,813 415,557 625,428 363,745 136,188
All OTHER REVENUES 569,538 6,905,315 871,121 1,954, 188 604,065 319,621
TOTAL REVENUES 12,913,944 127,400,106 19,809,234 25,442,924 13,987,681 6,692,648
OTHER FINANCING SOURCES BORROWING· BONDS ISSUED .... 35,885,000
· OTHER LONG-TERM DEBT .... 400,000 . ... 40,819
OTHER SOURCES
OPERATING TRANSFERS IN - ENTERPRISE FUNDS - GOVERNMENTAL FUNDS 158,844 1,522,657 51,816 .... . ... 158,000
TOTAL REVENUES AND OTHER SOORCES 13,072,788 165,207,763 19,861,050 25,483,743 13,987,681 6,850,648

TABLE 3 CLASSIFICATION OF COUNTY EXPENDITURES
FOR THE YEAR ENDED DECEMBER 31, 1992 GOVERNMENTAL FUNDS AITKIN ANOKA BECKER BELTRAMI BENTON BIG STONE
EXPENDITURES GENERAL GOVERNMENT· Current Expenditures 1,713,637 18,488,000 2,260,589 2,901,797 2,069,168 940,481
• Capitar outlay 22,250 5,543,785 33,664 •II•• 5,085 .... TOTAL GENERAL GOVERNMENT 1,735,887 24,031,785 2,294,253 2,901,797 2,074,253 940,481
PUBLIC SAFETY Sheriff 577,515 10,495,848 1,005,468 1,075,981 1,439,886 264,583 Corrections 733,503 8,117,339 611,605 1,378,698 188,339 27,697 All Other 70,019 204,862 46,841 81,405 58,146 2,765 capital outlay 61,319 67,000 66,082 .... 55,259 . ...
TOTAL PUBLIC SAFETY 1,442,356 18,885,049 1,729,996 2,536,084 1,741,630 295,045 STREETS AND HIGHWAYS
Adninistratfon 224,211 679,166 146,419 233,854 128,734 255,165 Operation and Maintenance 1,959,410 4,146,211 1,724,941 2,003,983 1,269,003 855,271 Capital outlay 1,919,513 10,193,732 1,089,923 1,606,065 1,634,274 2,000,646
TOTAL STREETS AND HIGHWAYS 4,103,134 15,019,109 2,961,283 3,843,902 3,032,011 3,111,082 SANITATION · Current Expenditures 1,008,996 .... 1,587,356 1,632,499 77,747 147,088
- Capital outlay .... . ... . ... • ti •• . ... . ... TOTAL SANITATION 1,008,996 .... 1,587,356 1,632,499 77,747 147,088
HUMAN SERVICES Income Maintenance 1,332,751 16,639,532 2,572,126 4,362,745 2,277,061 634,826 Social Services -2, 165,846 25,512,590 4,894,091 7,066,901 2,895,903 1,042,326 Other Hunan Service Costs .... .... . ... 105,552 . '- .. 70,991 Capital outlay .... 5,503,463 . ... • 0 •• . ... . ...
..... TOTAL HUMAN SERVICES 3,498,597 47,655,585 7,466,217 11,535,198 5,172,964 1,748,143
..... HEALTH - Current Expenditures 573,551 2,654,674 75,500 107,728 542,233 59,530 - Capital outlay .... .... . ... • 0 •• . ... . ...
TOTAL HEALTH 573,551 2,654,674 75,500 101,ns 542,233 59,530 CULTURE AND RECREATION
Libraries - Current Expenditures 78,808 4,084,823 88,610 86,798 210,653 23,486 - Capital outlay .... . ... . ... • 0 •• . ... . ...
Parks and Recreation - Current Expenditures 258,553 4,074,870 166,419 860,982 48,311 16,002 - Capital outlay .... 36,000 . ... • 0 •• . ... . ...
TOTAL CULTURE AND RECREATION 337,361 8,195,693 255,029 947,180 258,964 39,488 CONSERVATION OF NATURAL RESOURCES· Current Exp 802,737 2,089,041 598,273 1,238,007 157,821 185,133
· Capital outlay . . . . . ... .... • 0 •• . ... . ... TOTAL CONSERVATION OF NATURAL RESOURCES 802,737 2,089,041 598,273 1,238,007 157,821 185,133
ECONOMIC DEVELOPMENT· Current Expenditures 51,210 3,695,976 115,698 41,686 102,983 30,347 - Capital outlay . . . . . ... .... • D • • .... . ...
TOTAL ECONOMIC DEVELOPMENT 51,210 3,695,976 115,698 41,686 102,983 30,347 All OTHER· Current Expenditures .... 934,499 137,597 633,986 . ... 89,376
- capital outlay . . . . . . . . .... • 0 ••
DEBT SERVICE· Principal Paid on Bonds 130,000 1,016,215 270,000 430,000 - Other Long- term Debt 344,203 2,914,011 375,532 60,702 - Interest and Fiscal Charges 130,129 4,566,472 376,044 311,104 36, 105
TOTAL CURRENT EXPENDITURES 11,550,747 101,817,431 16,031,533 23,812,602 11,465,988 4,645,067 TOTAL CAPITAL OUTLAY 2,003,082 21,343,980 1,189,669 1,606,065 1,694,618 2,000,646 TOTAL DEBT SERVICE 604,332 8,496,698 1,021,576 801,806 36,105 ....
TOTAL EXPENDITURES 14,158,161 131,658,109 18,242,778 26,220,473 13,196,711 6,645,713 OTHER FINANCING USES
Debt Redeq:>tion - Refunded Bonds Other Financing Uses Transfers to· Enterprise Fl.aids
158,844 1,522,657 - Governmental Funds 51,816 •a•• .... 158,000 TOTAL EXPENDITURES AND OTHER USES 14,317,005 133,180,766 18,294,594 26,220,473 13,196,711 6,803,713
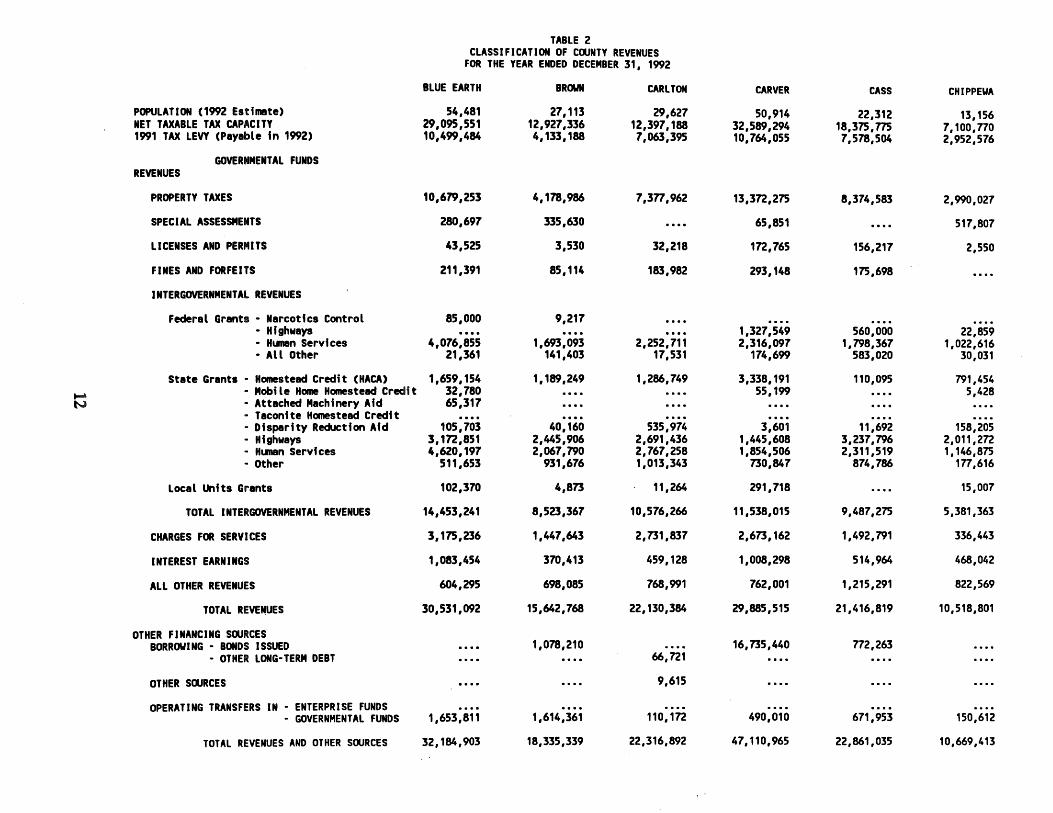
TABLE 2 CLASSIFICATION OF COUNTY REVENUES
FOR THE YEAR ENDED DECEMBER 31, 1992
BLUE EARTH BROWN CARLTON CARVER CASS CHIPPE"A
POPULATION (1992 Estimate) 54,481 27,113 29,627 50,914 22,312 13,156 NET TAXABLE TAX CAPACITY 29,095,551 12,927,336 12,397,188 32,589,294 18,375,775 7,100,770 1991 TAX LEVY (Payable in 1992) 10,499,484 4, 133, 188 7,063,395 10,764,055 7,578,504 2,952,576
GOVERNMENTAL FUNDS REVENUES
PROPERTY TAXES 10,679,253 4,178,986 7,377,962 13,372,275 8,374,583 2,990,027
SPECIAL ASSESSMENTS 280,697 335,630 .... 65,851 . ... 517,807
LICENSES AND PERMITS 43,525 3,530 32,218 172,765 156,217 2,550
FINES AND FORFEITS 211,391 85,114 183,982 293,148 175,698
INTERGOVERNMENTAL REVENUES
Federal Grants - Narcotics Control 85,000 9,217 - Highways .... . ... . ... 1,327,549 560,000 22,859 • Hunan Services 4,076,855 1,693,093 2,252,711 2,316,097 ,. 798,367 1,022,616 • All Other 21,361 141,403 17,531 174,699 583,020 30,031
State Grants· Homestead Credit (HACA) 1,659,154 1,189,249 1,286,749 3,338,191 110,095 791,454 .... • Mobile Home Homestead Credit 32,780 . . . . .... 55,199 . ... 5,428 N • Attached Machinery Aid 65,317
• Taconite Homestead Credit .... - Disparity Reduction Afd 105,703 40,160 535,974 3,601 11,692 158,205 • Highways 3,172,851 2,445,906 2,691,436 1,445,608 3,237,796 2,011,272 - Hunan Services 4,620,197 2,067,790 2,767,258 1,854,506 2,311,519 1,146,875 - Other 511,653 931,676 1,013,343 730,847 874,786 177,616
Local Units Grants 102,370 4,873 11,264 291,718 .... 15,007
TOTAL INTERGOVERNMENTAL REVENUES 14,453,241 8,523,367 10,576,266 11,538,015 9,487,275 5,381,363
CHARGES FOR SERVICES 3,175,236 1,447,643 2,731,837 2,673,162 1,492,791 336,443
INTEREST EARNINGS 1,083,454 370,413 459,128 1,008,298 514,964 468,042
ALL OTHER REVENUES 604,295 698,085 768,991 762,001 1,215,291 822,569
TOTAL REVE~UES 30,531,092 15,642,768 22,130,384 29,885,515 21,416,819 10,518,801
OTHER FINANCING SOURCES BORROWING - BONDS ISSUED . . . . 1,078,210 .... 16,735,440 772,263
- OTHER LONG-TERM DEBT . . . . .... 66,721
OTHER SOURCES . . . . .... 9,615
OPERATING TRANSFERS IN - ENTERPRISE FUNDS - GOVERNMENTAL FUNDS 1,653,811 1,614,361 110,172 490,010 671,953 150,612
TOTAL REVENUES AND OTHER SOURCES 32,184,903 18,335,339 22,316,892 47,110,965 22,861,035 10,669,413

TABLE 3 CLASSIFICATION OF COUNTY EXPENDITURES
FOR THE YEAR ENDED DECEMBER 31, 1992 GOVERNMENTAL FUNDS BLUE EARTH BROWN CARLTON CARVER CASS CHIPPEWA
EXPENDITURES GENERAL GOVERNMENT· Current Expenditures 3,882,377 1,872,612 3,507,521 5,573,496 2,903,472 1,550,290
• Capital outlay 416,526 .... . ... 323,746 80,612 . ... TOTAL GENERAL GOVERNMENT 4,298,903 1,872,612 3,507,521 5,897,242 2,984,084 1,550,290
PUBLIC SAFETY Sheriff 1,432,770 692,387 1,267,147 3,584,507 1,331,913 359,673 Corrections 1,285,483 634,817 1,091,020 422,396 840,990 227,061 All Other 43,836 61,932 322,904 146,597 101,221 30,621 Capital outlay .... 117,010 . ... 2,480,493 148,041 . ...
TOTAL PUBLIC SAFETY 2,762,089 1,506, 146 2,681,071 6,633,993 2,422,165 617,355 STREETS AND HIGHVAYS
Adninistration 341,698 139,626 244,091 183,500 354,764 94,615 Operation and Maintenance 2,580,006 1,167,065 2,726,098 1,602,016 1,693,529 1,053,589 Capital outlay 4,360,535 2,537,801 2,209,556 2,097,362 2,447,137 1,810,025
TOTAL STREETS AND HIGHVAYS 7,282,239 3,844,492 5,179,745 3,882,878 ,.,495,430 2,958,229 SANITATION· Current Expenditures 742,101 355,969 1,026,761 .... 404,819 846,574
- Capital outlay .... . ... . ... . ... 672,606 . ... TOTAL SANITATION 742,101 355,969 1,026,761 .... 1,077,425 846,574
HUMAN SERVICES Income Maintenance 4,238,377 1,967,610 2,698,994 1,827,763 2,423,750 1,133,949 Social Services 6,274,809 3,656,089 5,170,671 6,768,990 3,m,201 2,432,847 Other Hunan Service Costs .... Capital outlay 146,572
.... TOTAL HUMAN SERVICES 10,659,758 5,623,699 7,869,665 8,596,753 6,195,957 3,566,796 ~ HEALTH - Current Expenditures 623,427 640,836 798,574 902,208 1,220,562 68,080
· Capital outlay .... . ... . ... • 19 •• . ... . ... TOTAL HEALTH 623,427 640,836 798,574 902,208 1,220,562 68,080
CULTURE AND RECREATION Libraries - Current Expenditures 261,674 26,720 38,196 502,966 .... 152,745
- Capital outlay .... . ... . ... • 0 •• . ... . ... Parks and Recreation - Current Expenditures 280,534 453,270 119,137 351,341 14,500 61,512
- Capital outlay 6,045 . . . . .... 54,463 . . . . . ... TOTAL CULTURE AND RECREATION 548,253 479,990 157,333 908,n0 14,500 214,257
CONSERVATION OF NATURAL RESOURCES - Current Exp 476,004 1,136,524 402,810 321,937 1,168,148 419,401 • Capital outlay .... . . . . . ... . ... 1,340 . ...
TOTAL CONSERVATION OF NATURAL RESOURCES 476,004 1,136,524 402,810 321,937 1,169,488 419,401 ECONOMIC DEVELOPMENT· Current Expenditures 168,067 56,625 527,528 168,640 25,661 22,974
- Capital outlay .... . . . . . ... . ... . ... . ... TOTAL ECONOMIC DEVELOPMENT 168,067 56,625 527,528 168,640 25,661 22,974
ALL OTHER - Current Expenditures .... . ... . ... . ... . ... 54,788 - Capital outlay 29,418 216,645 .... . ... . ... . ...
DEST SERVICE· Principal Paid on Bonds 220,000 57,000 80,000 425,000 30,000 160,000 · Other Long-term Debt 735,360 25,694 227,282 .... 220,304 10,000 · Interest and Fiscal Charges 349,159 75,690 234,283 108,829 222,139 55,605
TOTAL CURRENT EXPENDITURES 22,631, 163 12,862,082 19,941,452 22,356,357 16,255,536 8,508,719 TOTAL CAPITAL OUTLAY 4,959,096 2,871,456 2,209,556 4,956,064 3,349,736 1,810,025 TOTAL DEBT SERVICE 1,304,519 158,384 541,565 533,829 472,443 225,605
TOTAL EXPENDITURES 28,894,778 15,891,922 22,692,573 27,846,250 20,077,715 10,544,349 OTHER FINANCING USES
Debt Reden.,tfon - Refunded Bonds Other Financing Uses Transfers to· Enterprise Fll'lds
1,653,811 1,614,361 · Goverrinental Funds 110,172 490,010 671,953 150,612 TOTAL EXPENDITURES AND OTHER USES 30,548,589 17,506,283 22,802,745 28,336,260 20,749,668 10,694,961

TABLE 2 CLASSIFICATION OF COUNTY REVENUES
FOR THE YEAR ENDED DECEMBER 31, 1992
CHISAGO CLAY CLEARWATER COOK COTTONWOCX> CROW WING
POPULATION (1992 Estimate) 32,232 51,006 8,343 3,931 12,656 45,m NET TAXABLE TAX CAPACITY 14,298,812 18,622,217 3,750,660 4,853,670 8,746,020 33,221,850 1991 TAX LEVY (Payable In 1992) 6,899,092 8,290,319 2,671,329 2,383,848 3,450,329 10, 151,646
GOVERNMENTAL FUNDS REVENUES
PROPERTY TAXES 7,156,599 7,892,612 3,032,061 2,936,132 3,558,565 10,064,815
SPECIAL ASSESSMENTS 434,630 487,850 79,740 84,476 235,519 21,048
LICENSES AND PERMITS 261,669 11,956 8,470 46,343 5,303 301,315
FINES AND FORFEITS 699,860 175,039 56,686 57,839 68,452 291,449
INTERGOVERNMENTAL REVENUES
Federal Grants· Narcotics Control 30,000 .... . ... . ... . ... 120,000 • Highways .... 50,723 8,658 138,742 . ... 203,585 • Hunan Services 1,567,117 3,258,623 1,150,910 186,286 815,006 4,757, 195 • All Other 172,504 39,176 156,717 3,768,240 4,813 228,303
State Grants· Homestead Credit (HACA) 1,760,579 1,223,752 213, 142 203,391 858,662 667,039 .- • Mobile Home Homestead Credit 46,557 .... 3,895 1,527 . ... 18,738 ~ • Attached Machinery Aid .... 72,233 . ... . ... . ... 52,568
• Taconite Homestead Credit . . . . .... . ... . ... . ... 169,170 • Disparity Reduction Aid 5,177 615,555 71,099 4,732 74,400 21,155 - Highways 2,297,765 3,389,043 2,245,267 1,275,652 1,958,053 2,601,673 • Hunan Services 2,280,549 4,470,126 1,105,248 257,635 1,022,911 4,367,497 • Other 644,841 275,319 352,957 984,592 175,504 1,670,892
Local Units Grants 36,303 19,034 44,758 .... . ... 222,793
TOTAL INTERGOVERNMENTAL REVENUES 8,841,392 13,413,584 5,352,651 6,820,797 4,909,349 15,100,608
CHARGES FOR SERVICES 1,509,549 1,245,644 500,749 575,806 682,476 2,885,079
INTEREST EARNINGS 431,492 517,694 233,587 394,130 282,237 368,194
ALL OTHER REVENUES 1,157,463 1,437,832 636,307 366,648 658,264 1,004,350
TOTAL REVENUES 20,492,654 25,182,211 9,900,251 11,282,171 10,400,165 30,036,858
OTHER FINANCING SOURCES BORROWING· BONDS ISSUED 3,451,324 . . . . .... . ... 813,462 1,496,841
• OTHER LONG-TERM DEBT 184,965 . . . . .... . . . . . ... 1,422,409
OTHER SOURCES
OPERATING TRANSFERS IN· ENTERPRISE FUNDS . . . . . . . . .... . . . . . ... 263,631 • GOVERNMENTAL FUNDS 4,123,992 141,479 29,592 3,160,000 708,733
TOTAL REVENUES AND OTHER SOURCES 28,252,935 25,323,690 9,929,843 14,442,171 11,922,360 33,219,739

TABLE 3 CLASSIFICATION OF COUNTY EXPENDITURES
GOVERNMENTAL FUNDS FOR THE YEAR ENDED DECEMBER 31, 1992
CHISAGO CLAY CLEARMATER COOK COTTONIIOOO CR~ MING
EXPENDITURES GENERAL GOVERNMENT· Current Expenditures 2,275,442 2,577,241 999,141 1,492,896 1,159,944 4,884,345
- Capital outlay 3,052 .... . ... 9,573 11,716 . ... TOTAL GENERAL GOVERNMENT 2,278,494 2,577,241 999,141 1,502,469 1,171,660 4,884,345
PUBLIC SAFETY Sheriff 1,546,381 1,054,430 387,904 446,844 410,412 2,322,288 Corrections 868,979 1,199,334 155,124 269,300 212,994 1,600,926 All Other 158,620 92,943 42,507 47,349 23,583 435,157 Capital outlay 946,292 .... 26,651 . ... 1,136,784 . ...
TOTAL PUBLIC SAFETY 3,520,2n 2,346,707 612,186 763,493 1,783,m 4,358,371 STREETS AND HIGHMAYS
Adninistratfon 255,065 259,751 277,950 112,915 153,8n 412,509 Operation and Maintenance 1,283,024 1,646,534 1,093,859 1,350,910 1,134,930 '2,354,885 Capf tal outlay 2,441,906 2,860,827 1,794,884 682,828 1,872,125 2,770,870
TOTAL STREETS AND HIGHVAYS 3,979,995 4,767,112 3,166,693 2,146,653 3,160,927 5,538,264 SANITATION - Current Expenditures 667,356 1,285 357,435 498,180 258,919
- Capital outlay .... . ... 182,791 . ... 798,170 TOTAL SANITATION 667,356 1,285 540,226 498,180 1,057,089
HUMAN SERVICES Income Maintenance 2,337,452 7,583,524 1,575,117 271,314 1,023,381 5,424,354 Social Services 3,857,426 s, 138,874 1,259,161 591,873 2,135,306 6,298,744 Other Hunan Service Costs capital outlay
~ TOTAL HUMAN SERVICES 6,194,878 12,n2,398 2,834,278 863,187 3,158,687 11,n3,098 UI HEALTH - current Expenditures 850,794 .... 102,282 327,806 63,878 1,113,085
• Capital outlay .... . ... . ... .... .... TOTAL HEALTH 850,794 .... 102,282 327,806 63,878 1,113,085
CULTURE AND RECREATION libraries· Current Expenditures 140,039 141,160 2s,n1 54,100 26,418 135,960
- capital outlay .... . ... . ... . ... . ... . ... Parks and Recreation· Current Expenditures 98,468 78,653 99,625 63,495 138,194 118,068
- Capital outlay .... . ... . ... 446,737 . ... . ... TOTAL CULTURE AND RECREATION 238,507 219,813 125,346 564,332 164,612 254,028
CONSERVATION OF NATURAL RESOURCES· Current Exp 189,330 464,299 665,776 69,497 378,819 500,428 - Capital outlay .... . ... . ... . ... . ... . ...
TOTAL CONSERVATION OF NATURAL RESOURCES 189,330 464,299 665,776 69,497 378,819 500,428 ECONOMIC DEVELOPMENT - Current Expenditures 148,058 30,546 28,181 258,478 4,381 1,342,058
- Capital outlay ..... . ... . ... 3,708,248 . ... . ... TOTAL ECONOMIC DEVELOPMENT 148,058 30,546 28,181 3,966,n6 4,381 1,342,058
ALL OTHER· Current Expenditures 1,310,291 332,499 42,965 .... 166,525 13,733 - Capital outlay .... . ... . ... . ... . ... . ...
DEBT SERVICE· Principal Paid on Bonds 590,000 205,000 15,000 120,000 140,000 590,000 - Other Long-term Debt 17,049 39,828 60,495 29,165 182,127 73,900 - Interest and Fiscal Charges 849,131 205,248 46,207 203,160 279,833 264,153
TOTAL CURRENT EXPENDITURES 15,986,725 20,601,073 7,112,748 5,854,957 7,291,556 26,956,540 TOTAL CAPITAL OUTLAY 3,391,250 2,860,827 2,004,326 4,847,386 3,818,795 2,770,870 TOTAL DEBT SERVICE 1,456,180 450,076 121,702 352,325 601,960 928,053
TOTAL EXPENDITURES 20,834,155 23,911,976 9,238,776 11,054,668 11,712,311 30,655,463 OTHER FINANCING USES
Debt Redeq:,tion - Refunded Bonds Other Financing Uses . . . . . ... .... . ... . ... 134,786 Transfers to· Enterprise FI.M'lds . . . . 1,283,780 .... .... . ...
- Governnental Funds 4,123,992 141,479 29,592 3,160,000 708,733 TOTAL EXPENDITURES AND OTHER USES 24,958,147 25,337,235 9,268,368 14,214,668 12,421,044 30,790,249

TABLE 2 CLASSIFICATION OF COUNTY REVENUES
FOR THE YEAR ENDED DECEMBER 31, 1992
DAKOTA DODGE DOUGLAS FARIBAULT FILLMORE FREEBORN
POPULATION (1992 Estimate) 290,443 16,083 29,058 16,774 20,811 32,979 NET TAXABLE TAX CAPACITY 230,251,850 6,919,896 15,621,934 11,530,300 7,538,252 16,581,862 1991 TAX LEVY (Payable In 1992) 49,726,718 2,462,812 5,852,679 3,277,715 2,950,226 6,714,389
GOVERNMENTAL FUNDS REVENUES
PROPERTY TAXES 57,630,972 2,502,752 6,121,741 3,311,051 2,936,878 7,121,824
SPECIAL ASSESSMENTS 2,210 13,474 52,045 299,984 .... 452,279
LICENSES AND PERMITS 6,122 3,650 112,087 1,435 22,624 7,926
FINES AND FORFEITS 998,530 52,969 162,784 73,274 104,226 218,759
INTERGOVERNMENTAL REVENUES
Federal Grants - Narcotics Control 118,348 .... 17,227 - Highways 482,553 353,562 142,572 .... 171,427 - Hunan Services 15,169,387 814,659 1,726,695 .... 1,158,231 2,440,612 - All Other 1,021,469 7,054 31,177 225,294 23,635 69,095
State Grants - Homestead Credit (HACA) 8,624,741 1,095,656 1,426,582 844,909 793,416 1,507,094 t-,,6 - Mobile Home Homestead Credit . . . . .... 14,586
°' - Attached Machinery Aid 375,m • Taconite Homestead Credit .... • Disparity Reduction Afd 3,046 243,845 9,467 101,591 298,451 71,008 • Highways 4,095,849 2,137,344 1,604,822 2,123,769 3,225,953 2,139,571 • Hunan Services 17,935,495 914,459 2,223,311 .... 1,758,761 2,601,725 · Other 2,425,813 105,690 252,364 252,862 282,406 342,760
Local Units Grants 8,602,825 .... 110,238 17,432 25,712
TOTAL INTERGOVERNMENTAL REVENUES 58,855,298 5,672,269 7,559,041 3,565,857 7,737,992 9,171,865
CHARGES FOR SERVICES 5,766,549 817,017 1,447,100 952,882 1,683,271 1,550,758
INTEREST EARNINGS 5,932,783 151,940 305,803 266,089 217,626 638,854
All OTHER REVENUES 3,669,974 318,444 340,351 597,290 220,005 447,556
TOTAL REVENUES 132,862,438 9,532,515 16,100,952 9,067,862 12,922,622 19,609,821
OTHER FINANCING SOURCES BORROWING - BONDS ISSUED 33,072,910
- OTHER LONG-TERM DEBT 1,475,000 .... 31,556 310,476
OTHER SOORCES 197,370
OPERATING TRANSFERS IN· ENTERPRISE FUNDS .... 149,194 • GOVERNMENTAL FUNDS 3, 151,260 399,466 100,000 628,389 582,339
TOTAL REVENUES AND OTHER SOURCES 170,758,978 10,081,175 16,232,508 10,006,727 13,504,961 19,609,821

TABLE 3 CLASSIFICATION OF COUNTY EXPENDITURES
FOR THE YEAR ENDED DECEMBER 31, 1992 GOVERNMENTAL FUNDS DAKOTA DOOGE DOUGLAS FARIBAULT FILLMORE FREEBORN
EXPENDITURES GENERAL GOVERNMENT· Current Expenditures 30,952,334 1,471,731 2,235,751 1,365,476 1,656,554 2,649,640
- Capital outlay 2, 171,525 .... . ... 108,304 . ... 168,456 TOTAL GENERAL GOVERNMENT 33,123,859 1,471,731 2,235,751 1,473,780 1,656,554 2,818,096
PUBLIC SAFETY Sheriff 7,614,210 917,611 935,410 572,805 656,554 919,086 Corrections .... 78,514 782,677 164,877 403,959 679,384 All Other 249,605 32,516 54,756 27,485 23,904 39,700 Capital outlay .... . ... . ... 12,123 . ... 70,260
TOTAL PUBLIC SAFETY 7,863,815 1,028,641 1,m,843 m,290 1,084,417 1,708,430 STREETS AND HIGHYAYS
Actninistration 207,955 200,523 288,343 142,417 470,899 210,242 Operation and Maintenance 2,855,178 1,177,196 1,892,245 1,314,305 1,533,622 1,566,853 Capital outlay 14,838,185 2,036,766 1,743,389 2,455,704 2,474,318 1,530,709
TOTAL STREETS AND HIGHYAYS 17,901,318 3,414,485 3,923,977 3,912,426 4,478,839 3,307,804 SANITATION· Current Expenditures .... . ... . ... 358,319 . ... 358,257
- Capital outlay .... . ... . ... • o •• .... . ... TOTAL SANITATION .... . ...
HUMAN SERVICES . ... 358,319 . ... 358,257
Income Maintenance 17,249,736 944,899 1,820,729 .... 1,085, 153 1,602,210 Social Services 28,357,370 1,299,859 4,498,581 .... 2,162,830 6,515,873 Other Hunan Service Costs .... . ... . ... 870,619 . ... . ... Capital outlay .... . ... . ... • u •• . ... 441 .... TOTAL HUMAN SERVICES 45,607,106 2,244,758 6,319,310 870,619 3,247,983 8,118,524
'-l HEALTH - Current Expenditures 3,412,985 423,095 25,000 . ., .. m,os1 825,724 - Capital outlay .... .... . ... . ., .. . ... 14,995
TOTAL HEALTH 3,412,985 423,095 25,000 • u •• m,os1 840,719 CULTURE AND RECREATION
libraries - Current Expenditures 4,390,169 41,664 265,080 123,804 41,022 74,000 - Capital outlay 3,420,343 .... . ... • p •• . ... . ...
Parks and Recreation - Current Expenditures 3,241,505 18,827 359,326 116,077 39,448 45,577 - Capital outlay .... . ... . ... • e • • .... 24,441
TOTAL CULTURE AND RECREATION 11,052,017 60,491 624,406 239,881 80,470 144,018 CONSERVATION OF NATURAL RESOURCES· Current Exp 1,490,946 205,997 294,m 507,339 406,322 454,584
- Capital outlay .... . ... . ... • Ill •• .... . ... TOTAL CONSERVATION OF NATURAL RESOURCES 1,490,946 205,997 294,m 507,339 406,322 454,584
ECONOMIC DEVELOPMENT - Current Expenditures 3,635,966 10~739 20,000 354,589 19,377 1,816 - capital outlay . . . . .... . ... . .... . ... . ...
TOTAL ECONOMIC DEVELOPMENT 3,635,966 10,739 20,000 354,589 19,377 1,816 All OTHER - Current Expenditures .... 110,929 317,426 653,975 118,171 349,721
- Capital Outlay . . . . . ... .... . ... . ... . ... DEBT SERVICE - Principal Paid on Bonds 875,000 .... 560,000 1,325,000 . ... 330,000
- Other Long-term Debt 2,413,008 100,236 244,901 .... . ... 16,365 - Interest and Fiscal Charges 5,039,800 196,933 593,933 331,986 .... 201,083
TOTAL CURRENT EXPENDITURES 103,657,959 6,934,100 13,790,096 6,572,087 9,390,872 16,292,667 TOTAL CAPITAL OUTLAY 20,430,053 2,036,766 1,743,389 2,576,131 2,474,318 1,809,302 TOTAL DEBT SERVICE 8,327,808 297,169 1,398,834 1,656,986 .... 547,448
TOTAL EXPENDITURES 132,415,820 9,268,035 16,932,319 10,805,204 11,865,190 18,649,417 OTHER FINANCING USES
Debt Reden.-,tion - Refunded Bonds Other Financing Uses Transfers to - Enterprise Funds . . . . 6,836 203,000 .... 23,326
- Governnental Funds 3,151,260 399,466 100,000 628,389 582,339 TOTAL EXPENDITURES AND OTHER USES 135,567,080 9,674,337 17,235,319 11,433,593 12,470,855 18,649,417

TABLE 2 CLASSIFICATION OF COUNTY REVENUES
FOR THE YEAR ENDED DECEMBER 31, 1992
GOOOHUE GRANT HENNEPIN HOOSTON HUBBARD ISANTI
POPULATION (1992 Estimate) 41,391 6,216 1,047,206 18,757 15,330 26,992 NET TAXABLE TAX CAPACITY 40,496,945 ·3~ 753,402 1,004,055,687 s,9so,n4 10,807,443 9,541,310 1991 TAX LEVY (Payable in 1992) 8,411,652 1,514,494 297,914,392 2,803,868 3,aoo,ns 5,163, 198
GOVERNMENTAL FUNDS REVENUES
PROPERTY TAXES 8,321,699 1,505,517 300,443,565 2,837,sn 4,018,551 5,241,497
SPECIAL ASSESSMENTS 2,882 58,075 .... . ... . ... 90
LICENSES AND PERMITS 184,479 75 1,6n,951 25,739 84,615 223,273
FINES AND FORFEITS 260,806 .... 1,535,815 n,221 86,454 204,867
INTERGOVERNMENTAL REVENUES
Federal Grants - Narcotics Control - Highways 280,925 .... 6,761,974 - Hunan Services 1,710,225 420,591 57,744,493 1, 122,327 1,135,530 1,664,934 - All Other 274,3n 20,435 8,414,705 117,939 164,063 108,380
State Grants· Homestead Credit (HACA) 1,022,745 469,696 22,439,139 1,003,061 334,937 1,736,885 .- - Mobile Home Homestead Credit 15,883 2,339 43,587 .... 7,001 33,824 00 - Attached Machinery Aid
- Taconite Homestead Credit - Disparity Reduction Aid 38,123 8,702 .... 192,807 . ... 60,705 - Highways 3,049,704 719,236 29,928,753 1,400,904 2,698,850 1,593,881 - Hunan Services 2,496,535 583,783 26,097,Sn 1,528,740 1,470,418 1,942,733 - Other 1,201,128 156,632 94,778,225 329,529 519,908 147,376
Local Units Grants 206,701 .... 6,683,898
TOTAL INTERGOVERNMENTAL REVENUES 10,296,346 2,381,414 252,892,651 5,695,307 6,330,707 7,288,718
CHARGES FOR SERVICES 3,131,410 439,884 52,704,580 1,oss,n9 4n,3o9 919,716
INTEREST EARNINGS 779,762 82,021 33,983,999 419,692 292,989 289,651
ALL OTHER REVENUES 2,153,765 209,890 34,221,461 142,873 n6,373 505,735
TOTAL REVENUES 25,131,149 4,676,876 6n,460,02a 10,257,144 12,016,998 14,673,547
OTHER FINANCING SOORCES BORROIIING • BONDS ISSUED 445,770
- OTHER LONG-TERM DEBT
OTHER SOORCES
OPERATING TRANSFERS IN - ENTERPRISE FUNDS - GOVERNMENTAL FUNDS 332,975 29,538 10,333,005 .... 17,346 22,937
TOTAL REVENUES AND OTHER SOORCES 25,909,894 4,706,414 687,793,033 10,257,144 12,034,344 14,696,484

TABLE 3 CLASSIFICATION OF COUNTY EXPENDITURES
FOR THE YEAR ENDED DECEMBER 31, 1992 GOVERNMENTAL FUNDS GOODHUE GRANT HENNEPIN HOUSTON HUBBARD ISANTI
EXPENDITURES GENERAL GOVERNMENT· Current Expenditures 4,393,094 697,072 58,218,230 1,489,642 1,930,205 2,240,380
- Capital outlay .... . ... 7,762,376 . ... . ... . ... TOTAL GENERAL GOVERNMENT 4,393,094 697,072
PUBLIC SAFETJ 65,980,606 1,489,642 1,930,205 2,240,380
Sheriff 1,587,676 392,338 14,422,664 477,792 566,703 988,815 Corrections 1,234,055 86,949 61,749,638 346,651 336,840 632,300 All Other 195,384 5,685 54,231,452 65,551 63,855 28,853 Capital outlay .... . ... 9,738,167 . ... . ... . ...
TOTAL PUBLIC SAFETY 3,017,115 484,972 140,141,921 889,994 967,398 1,649,968 STREETS AND HIGHWAYS
Actninistration 274,909 168,622 259,008 110,904 174,233 178,662 Operation and Maintenance 1,980,335 1,054,943 17,614,087 1,602,455 1,282,369 696,725 Capital outlay 4,993,495 246,683 28,171,699 847,552 2,114,931 1,966,513
TOTAL STREETS AND HIGHWAYS 7,248,739 1,470,248 46,044,794 2,560,911 3,571,533 2,841,900 SANITATION· Current Expenditures 1,267,229 282,315 .... 521,763 . ... 1,318,642
- capital outlay .... . ... 42,826 . ... . ... . ... TOTAL SANITATION . 1,267,229 282,315 42,826 521,763 1,318,642 ....
HUMAN SERVICES Income Maintenance 2,572,809 584,255 96,992,454 843,574 1,324,914 1,917,507 Social Services 4,199,198 880,599 6,887,103 2,313,950 2,693,968 3,403,012 Other Hunan Service Costs .... . ... 218,207,370 Capital outlay .... . ... 1,828,m
~ TOTAL HUMAN SERVICES 6,m,001 1,464,854 323,915,699 3,157,524 4,018,882 5,320,519
\0 HEALTH - Current Expenditures 2,679,838 .... 30,594,378 61a,n1 56,666 583,204 - Capital outlay 16,793 .... 1,185,305 . ... . ... . ...
TOTAL HEALTH 2,696,631 .... 31,779,683 61e,n1 56,666 583,204 CULTURE AND RECREATION
Libraries - Current Expenditures 110,700 28,319 18,238,389 17,015 45,863 108,835 - Capital outlay . . . . .... 3,815,871 . ... . ... . ...
Parks and Recreation - current Expenditures 383,106 18,300 .... 77,869 107,753 19,603 - Capital outlay . . . . . . . . .... . .... . ... . ...
TOTAL CULTURE AND RECREATION 493,806 46,619 22,054,260 94,884 153,616 128,438 CONSERVATION OF NATURAL RESOURCES - Current Exp 192,731 255,263 .... 296,131 505,517 131,562
- Capital outlay . . . . . . . . .... . ... . ... . ... TOTAL CONSERVATION OF NATURAL RESOURCES 192,731 255,263 .... 296,131 505,517 131,562
ECONOMIC DEVELOPMENT - Current Expenditures 20,075 .... 1,250,264 34,911 16,581 14,670 - Capital outlay . . . . . . . . 50,698 .... . ... . ...
TOTAL ECONOMIC DEVELOPMENT 20,075 .... 1,300,962 34,911 16,581 14,670 All OTHER - Current Expenditures . . . . 71,573 .... 182,690 186,143 173,950
- Capital outlay . . . . . . . . . . . . • 0 •• . ... . ... DEBT SERVICE· Principal Paid on Bonds 74,000 25,000 10,135,000 • 0 •• . ... 175,000
- Other Long-term Debt 511,525 12,318 4,125,000 150,396 135,785 65,000 - Interest and Fiscal Charges 139,334 15,730 7,012,521 11,749 34,152 371,299
TOTAL CURRENT EXPENDITURES 21,091,139 4,526,233 578,665,037 8,999,669 9,291,610 12,436,720 TOTAL CAPITAL OUTLAY 5,010,288 246,683 52,595,714 847,552 2,114,931 1,966,513 TOTAL DEBT SERVICE 724,859 53,048 21,272,521 162,145 169,937 611,299
TOTAL EXPENDITURES 26,826,286 4,825,964 652,533,272 10,009,366 11,576,478 15,014,532 OTHER FINANCING USES
Debt Redeq,tion - Reflnfed Bonds Other Financing Uses Transfers to - Enterprise Funds . . . . 20,796 4,674,585 .... 80,000
- Governnental Funds 332,975 29,538 10,333,005 .... 17,346 22,937 TOTAL EXPENDITURES AND OTHER USES 27,159,261 4,876,298 667,540,862 10,009,366 11,673,824 15,037,469
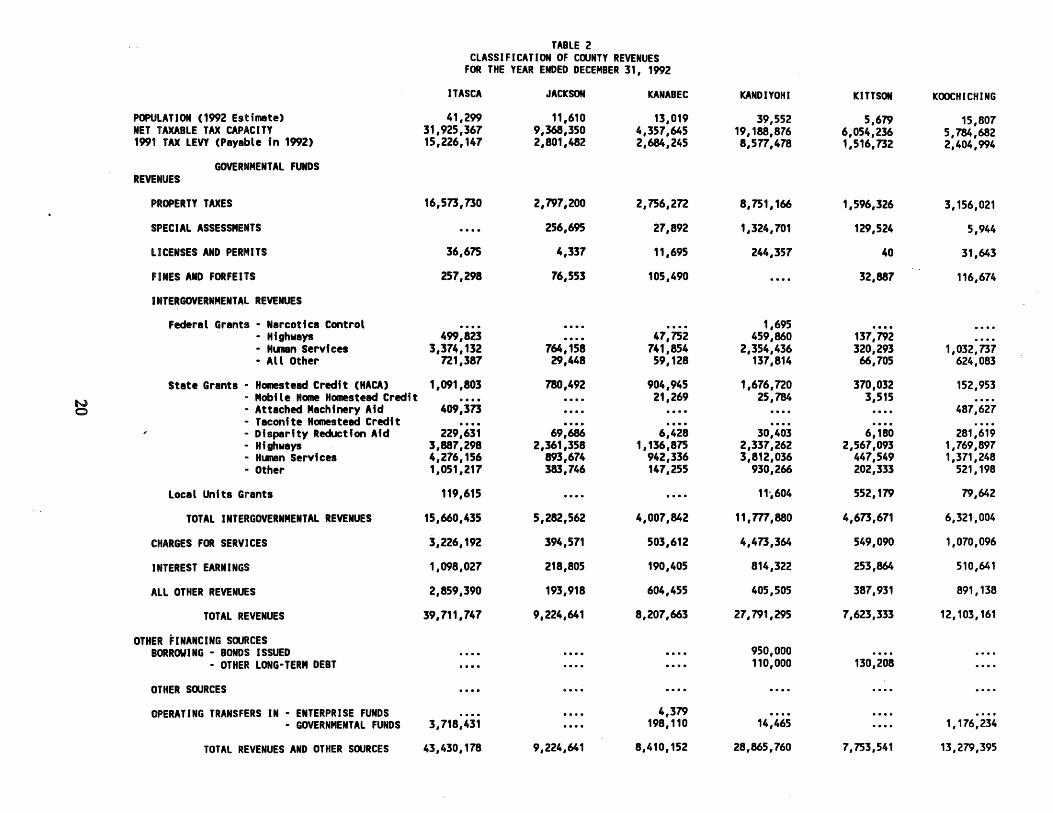
TABLE 2 CLASSIFICATION OF COUNTY REVENUES
FOR THE YEAR ENDED DECEMBER 31, 1992
ITASCA JACKSON KANABEC KANDIYOHI KITTSON KOOCHICHING
POPULATION (1992 Estimate) 41,299 11,610 13,019 39,552 5,679 15,807 NET TAXABLE TAX CAPACITY 31,925,367 9,368,350 4,357,645 19,188,876 6,054,236 5,784,682 1991 TAX LEVY (Payable in 1992) 15,226,147 2,801,482 2,684,245 8,577,478 1,516,732 2,404,994
GOVERNMENTAL FUNDS REVENUES
PROPERTY TAXES 16,573,730 2,797,200 2,756,2n 8,751,166 1,596,326 3,156,021
SPECIAL ASSESSMENTS .... 256,695 27,892 1,324,701 129,524 5,944
LICENSES AND PERMITS 36,675 4,337 11,695 244,357 40 31,643
FINES AND FORFEITS 257,298 76,553 105,490 .... 32,887 116,674
INTERGOVERNMENTAL REVENUES
Federal Grants - Narcotics Control .... . ... . ... 1,695 - Highways 499,823 .... 47,752 459,860 137,792 - Hunan Services 3,374,132 764,158 741,854 2,354,436 320,293 1,032,737 • All Other n1,3&7 29,448 59,128 137,814 66,705 624,083
State Grants· Homestead Credit (HACA) 1,091,803 780,492 904,945 1,676,no 370,032 152,953
~ • Mobile Home Homestead Credit . . . . .... 21,269 25,784 3,515 . ... • Attached Machinery Aid 409,373 . . . . .... . ... . ... 487,627 - Taconite Homestead Credit . . . . . . . . .... . ... . ... . ... · Disparity Reduction Aid 229,631 69,686 6,428 30,403 6,180 281,619 • Highways 3,887,298 2,361,358 1,136,875 2,337,262 2,567,093 1,769,897 • Hunan Services 4,276,156 893,674 942,336 3,812,036 447,549 1,371,248 - Other 1,051,217 383,746 147,255 930,266 202,333 521,198
Local Units Grants 119,615 . . . . .... 11·,604 552,179 79,642
TOTAL INTERGOVERNMENTAL REVENUES 15,660,435 5,282,562 4,007,842 11,m,aso 4,673,671 6,321,004
CHARGES FOR SERVICES 3,226,192 394,571 503,612 4,473,364 549,090 1,070,096
INTEREST EARNINGS 1,098,027 218,805 190,405 814,322 253,864 510,641
ALL OTHER REVENUES 2,859,390 193,918 604,455 405,505 387,931 891,138
TOTAL REVENUES 39,711,747 9,224,641 8,207,663 27,791,295 7,623,333 12, 103, 161
OTHER FINANCING SOURCES BORROWING - BONDS ISSUED . . . . .... . ... 950,000
- OTHER LONG-TERM DEBT . . . . . . . . .... 110,000 130,208
OTHER SOURCES
OPERATING TRANSFERS IN· ENTERPRISE FUNDS . . . . .... 4,379 - GOVERNMENTAL FUNDS 3,718,431 . . . . 198,110 14,465 .... 1, 176,234
TOTAL REVENUES AND OTHER SOURCES 43,430,178 9,224,641 8,410,152 28,865,760 7,753,541 13,279,395

TABLE 3 CLASSIFICATION OF COONTY EXPENDITURES
GOVERNMENTAL FUNDS FOR THE YEAR ENDED DECEMBER 31, 1992
ITASCA JACKSON KANABEC KANDIYOHI KITTSON KOOCHICHING
EXPENDITURES GENERAL GOVERNMENT· Current Expenditures 4,401,829 1,048,524 1,109,288 2,279,440 961,985 1,n2,921
• Capital outlay 157,003 49,423 .... 52,321 . ... . ... TOTAL GENERAL GOVERNMENT 4,558,832 1,097,947 1,109,288 2,331,761 961,985 1,n2,921
PUBLIC SAFETY Sheriff 1,656,864 371,183 747,686 1,001,329 376,048 910,778 Corrections 1,109,562 310,333 57,358 1,381,182 100,058 240,959 All Other 300,010 65,941 14,420 333,241 14,825 27,041 Capital outlay .... . ... . ... 109,938 . ... . ...
TOTAL PUBLIC SAFETY 3,066,436 747,457 819,464 2,825,690 490,931 1,178,778 STREETS AND HIGHWAYS
Adninistration 269,232 116,753 152,039 1,231,599 122,696 304,916 Operation and Maintenance 6,218,418 1,485,401 1,273,767 1,968,628 1,019,294 1,007,427 Capital outlay 3,550,804 1,600,939 1,291,954 3,122,903 1,760,909 3,225,484
TOTAL STREETS AND HIGHWAYS 10,038,454 3.,203,093 2,717,760 6,323,130 2,902,899 4,537,827 SANITATION· Current Expenditures 2,139,934 84,439 232,436 1,195,800 519,863 949,145
• Capital outlay .... 22,476 . ... 718,864 264,102 . ... TOTAL SANITATION 2,139,934 106,915 232,436 1,914,664 783,965 949,145
HUMAN SERVICES Income Maintenance 4,533,931 956,909 1,317,859 2,924,792 ,n,094 1,473,749 Social Services 8,377,038 1,881,607 1,679,792 7,144,845 638,516 2,627,210 Other Hunan Service Costs .... .... . ... 16,467 Capital outlay . . . . . ... .... . ...
N TOTAL HUMAN SERVICES 12,910,969 2,838,516 2,997,651 10,086,104 1,110,610 4,100,959 ~ HEALTH· Current Expenditures 1,838,581 104,740 453,181 1,258,331 48,046 650,632
• Capital outlay .... . ... . ... . ... . ... .... TOTAL HEALTH 1,838,581 104,740 453,181 1,258,331 48,046 650,632
CULTURE AND RECREATION Libraries· Current Expenditures .... 96,535 52,493 120,080 39,480 2s,3n
• Capital outlay . . . . .... . ... .... . ... . ... Parks and Recreation· Current Expenditures 227,193 174,505 876 157,703 83,708 51,455
• Capital outlay . . . . . ... .... . ... . ... . ... TOTAL CULTURE AND RECREATION 227,193 271,040 53,369 277,783 123,188 79,827
CONSERVATION OF NATURAL RESOORCES • Current Exp 1,106,802 634,2n 101,m 641,019 292,685 634,4n · Capital OUtlay . . . . . ... .... .... . ... . ...
TOTAL CONSERVATION OF NATURAL RESOORCES 1,106,802 634,2n 101,m 641,019 292,685 ·v.,4n ECONOMIC DEVELOPMENT· Current Expenditures 85,252 3,561 24,408 300 1,876 )91,784
- capital outlay . . . . . ... . ... ..... . ... . ... TOTAL ECONOMIC DEVELOPMENT 85,252 3,561 24,408 300 1,876 391,784
ALL OTHER· Current Expenditures 1,353,801 183,n4 154,578 593,lt25 262,387 134,035 · Capital outlay 18,680 . . . . . . . . • o •• . ... ....
DEBT SERVICE· Principal Paid on Bonds 1,180,000 10,000 120,000 616,100 428,896 573,942 • Other Long-term Debt 100,615 .... .... 678,605 151,517 • Interest and Fiscal Charges 325,293 64,114 34,339 695,287 123,448 2n,968
TOTAL CURRENT EXPENDITURES 33,618,447 7,518,427 7,377,954 22,248,181 4,953,561 11,154,902 TOTAL CAPITAL OOTLAY 3,n6,487 1,6n,83a 1,291,954 4,004,026 2,025,011 3,225,484 TOTAL DEBT SERVICE 1,605,908 74,114 154,339 1,989,992 703,861 846,910
TOTAL EXPENDITURES 38,950,842 9,265,379 8,824,247 28,242,199 7,682,433 15,227,296 OTHER FINANCING USES
Debt Reden.,tion · Refunded Bonds . . . . . . . . .... 925,000 Other Financing Uses Transfers to· Enterprise Funds
3,718,431 198,110 14,465 1, 176,234 · Governnental Funds . . . . .... TOTAL EXPENDITURES AND OTHER USES 42,669,273 9,265,379 9,022,357 29,181,664 7,682,433 16,403,530

TABLE 2 CLASSIFICATION OF COUNTY REVENUES
FOR THE YEAR ENDED DECEMBER 31, 1992
LAC QUI PARLE LAKE LAKE OF THE IIOODS LE SUEUR LINCOLN LYON
POPULATION (1992 Estimate) 8,807 10,353 4,171 23,563 6,816 24,776 NET TAXABLE TAX CAPACITY 5,071,094 4,271,713 1,886,558 10,178,796 3,660,797 13,139,211 1991 TAX LEVY (Payable fn 1992) 1,575,375 3,359,010 1,147,483 4,143,759 2,004,254 4,599,661
GOVERNMENTAL FUNDS REVENUES
PROPERTY TAXES 1,617,967 4,825,803 1,678,237 4,437,042 2,026,634 4,675,914
SPECIAL ASSESSMENTS 281,529 .... 378,688 65,169 335,127 213,335
LICENSES AND PERMITS 3,966 12,494 31,326 70,693 1,268 11,265
FINES AND FORFEITS .... 74,344 41,970 73,495 28,341 203,343
INTERGOVERNMENTAL REVENUES
Federal Grants - Narcotics Control . . . . .... . ... 25,000 - Highways 236,090 .... 105,052 . ... 123,014 604,151 - Hunan Services 527,869 757,359 193,321 1,506,944 .... . ... • All Other 76,052 734,041 182,185 282,030 47,562 44,035
State Grants - Homestead Credit (HACA) 506,761 818,873 239,906 . 1,593,635 622,111 1,000,008
~ • Mobile Home Homestead Credit .... 3,617 .... . ... . ... 5,680 - Attached Machinery Aid - Taconite Homestead Credit • Disparity Reduction Aid 70,644 233,858 14,925 119,784 52,482 38,633 • Highways ·2,269,576 1,418,864 2,657,814 2,190,056 1,807,781 2,737,117 - Hunan Services 710,037 821,662 253,940 1,980,274 .... . ... • Other 135,999 575,113 324,570 423,509 201,361 315,971
Local Units Grants . . . . . . . . .... 6,n1 . ... 11, 713
TOTAL INTERGOVERNMENTAL REVENUES 4,533,028 5,363,387 3,971,713 8,127,953 2,854,311 4,757,308
CHARGES FOR SERVICES 218,197 797,784 198,440 1,1n,913 131,445 352,511
INTEREST EARNINGS 147,329 226,nl 248,9n 466,591 235,609 315,522
ALL OTHER REVENUES 174,917 876,556 211,n4 921,914 130,739 1,582,597
TOTAL REVENUES 6,976,933 12,177,091 6,761,070 15,335,770 5,743,474 12,111,795
OTHER FINANCING SOURCES BORROWING· BONDS ISSUED . . . . . . . . .... . ... . ... 143,765
• OTHER LONG-TERM DEBT . . . . . . . . .... 75,591 . ... 250,000
OTHER SOURCES . . . . . ... . . . . .... 914
OPERATING TRANSFERS IN· ENTERPRISE FUNDS - GOVERNMENTAL FUNDS .... 483,169 15,640 114,988
TOTAL REVENUES AND OTHER SOORCES 6,976,933 12,660,260 6,776,710 15,526,349 5,744,388 12,505,560

TABLE 3 CLASSIFICATION OF COUNTY EXPENDITURES
GOVERNMENTAL FUNDS FOR THE YEAR ENDED DECEMBER 31, 1992
LAC QUI PARLE LAKE LAKE OF THE WOCl>S LE SUEUR LINCOLN LYON
EXPENDITURES GENERAL GOVERNMENT· Current Expendftures 601,506 1,851,997 872,793 2,348,929 758,899 2,141,105 - Capftal outlay .... . ... . ... . ... 26,920 . ... TOTAL GENERAL GOVERNMENT 601,506 1,851,997 872,793 2,348,929 785,819 2,141,105 PUBLIC SAFETY
Sheriff 297,742 942,988 201,387 740,043 351,973 497,663 Correctfons 25,168 145,148 189,625 528,907 36,736 568,565 All Other 17,872 69,031 37,131 97,525 16,359 36,631 Capftal outlay .... . ... . ... . ... . ... . ... TOTAL PUBLIC SAFETY 340,782 ,, 157,167 428,143 1,366,475 405,068 1,102,859 STREETS AND HIGHIIAYS Adnlnfstratlon 92,878 299,163 212,856 206,441 155,455 293,724 Operation and Maintenance 1,031,m 1,m,693 806,879 2,431,439 915,582 1,693,763 Capftal outlay 1,944,183 1,025,321 2,968,808 2,462,697 1,583,476 3,183,441
TOTAL STREETS AND HIGHVAYS 3,074,838 3,097,177 3,988,543 5,100,577 2,654,513 5,170,928 SANITATION· Current Expenditures 120,869 696,860 600,017 129,116 68,622 473,508
- Capital outlay .... . ... . ... . ... . ... 294,435 TOTAL SANITATION 120,869 696,860 600,017 129,116 68,622 767,943
HUMAN SERVICES Income Maintenance 537,502 1,110,253 339,485 1,569,833 Social Services 1,218,767 1,665,499 433,504 3,476,594 Other Hunan Service Costs .... . ... . ... It ••• 653,525 1,725,006 Capital outlay .... . ... . ... ., ... . ... . ...
~ TOTAL HUMAN SERVICES 1,756,269 2,775,752 m,989 5,046,427 653,525 1,725,006
HEALTH - current Expenditures 49,441 216,215 56,444 569,412 42,630 126,897 - Capital outlay .... . ... . ... ., ... . ... . ...
TOTAL HEALTH 49,441 216,215 56,444 569,412 42,630 126,897 CULTURE AND RECREATION
libraries· current Expenditures 32,466 59,862 .... 198,836 13,383 126,887 - Capital OUtlay .... .... . ... oaa • .... . ...
Parks and Recreation· Current Expenditures 9,798 378,019 70,239 74.,288 138,843 136,219 - Capital outlay .... . ... . ... o••• .... ....
TOTAL CULTURE AND RECREATION 42,264 437,881 70,239 273,124 152,226 263,106 CONSERVATION OF NATURAL RESOURCES· Current Exp 449,034 468,812 45,393 393,137 289,660 665,830
• Capital outlay .... .... . ... .. ... . . . . . ... TOTAL CONSERVATION OF NATURAL RESOURCES 449,034 468,812 45,393 393,137 289,660 665,830
ECON<IU C DEVELOPMENT • Current Expend I tures 9,320 46,711 147,099 34,267 141,215 - capital outlay .... . ... .... 0 ••• . ...
TOTAL ECON<JUC DEVELOPMENT 9,320 46,711 147,099 34.,267 141,215 ALL OTHER· Current Expenditures 94,585 .... 114,687 0 ••• 198,754 149,045
- Capital outlay .... 53,607 . ... 75,591 . ... . ... DEBT SERVICE· Principal Paid on Bonds 65,000 140,000 265,000 630,000 330,000 130,000
- Other Long-term Debt 8,964 176,027 131,827 6,m .... 67,379 - Interest and Fiscal Charges 21,779 295,745 145,436 210.,425 209,680 46,093
TOTAL CURRENT EXPENDITURES 4,594,725 9,723,251 4,127,539 12,798,767 3,781,636 8,634,843 TOTAL CAPITAL OUTLAY 1,944,183 1,078,928 2,968,808 2,538,288 1,610,396 3,477,876 TOTAL DEBT SERVICE 95,743 611,m 542,263 847,198 539,680 243,472
TOTAL EXPENDITURES 6,634,651 11,413,951 7,638,610 16,184.,253 5,931,712 12,356,191 OTHER FINANCING USES
Debt Redeq:,t ion • Refunded Bonds Other Financing Uses Transfers to - Enterprise Funds
- Governnental Funds .... 483,169 15,640 114.,988 TOTAL EXPENDITURES AND OTHER USES 6,634,651 11,897,120 7,654,250 16,299.,241 5,931,712 12,356,191

TABLE 2 CLASSIFICATION OF COUNTY REVENUES
FOR THE YEAR ENDED DECEMBER 31, 1992
MCLEOD MAHNOMEN MARSHALL MARTIN MEEKER MILLE LACS
POPULATION (1992 Estimate) 32,645 5,068 10,870 22,812 21,030 18,993 NET TAXABLE TAX CAPACITY 12,722,369 1,867,879 7,713,878 16,727,557 9,392,305 6,725,324 1991 TAX LEVY (Payable in 1992) 5,420,631 1,482,340 1,852, 128 4,590,327 3,562,655 4,814,407
GOVERNMENTAL FUNDS REVENUES
PROPERTY TAXES 5,490,578 1,513,136 1,937,595 4,755,705 3,645,786 4,841,844
SPECIAL ASSESSMENTS 114,173 181,526 628,776 375,034 198,789 6,053
LICENSES AND PERMITS 38,912 3,847 93 1,967 7,865 72,377
FINES AND FORFEITS 171,499 37,895 33,617 110,194 17,343 115,946
INTERGOVERNMENTAL REVENUES
Federal Grants· Narcotics Control • Highways 6,086 . . . . .... . ... 339,341 10,000 • Hunan Services 1,289,742 559,527 694,669 .... 1,099,054 1,161,433 • All Other 71,826 41,923 330,690 116, 121 87,173 172,953
State Grants - Homestead Credit (HACA) 1,608,123 312,239 634,820 928,017 856,264 740,155
~ • Mobile Home Homestead Credit 29,123 1,074 4,002 .... 13,418 14,991 - Attached Machinery Afd - Taconite Homestead Credit · Disparity Reduction Aid 85,495 92,927 5,038 53,030 20,267 35,198 - Highways 2,544,419 2,443,605 1,949,873 2,756,942 3,147,147 4,085,242 • Hunan Servfces 1,912,282 663,664 771,814 .... 1,633,458 1,465,738 - Other 481,023 282,987 198,030 280,719 273,787 311, 125
Local Units Grants 1,154 51,697 .... . ... . ... 214,321
TOTAL INTERGOVERNMENTAL REVENUES 8,029,273 4,449,643 4,588,936 4, 134,829 7,469,909 8,211,156
CHARGES FOR SERVICES 1,586,757 214,544 680,827 669,704 1,369,530 796,474
INTEREST EARNINGS 526,693 38,238 247,444 367,677 211,m 213,664
ALL OTHER REVENUES 1,038,090 264,924 376,444 312,132 455,993 638,751
TOTAL REVENUES 16,995,975 6,703,753 8,493,732 10,727,242 13,382,992 14,896,265
OTHER FINANCING SOURCES BORROMING - BONDS ISSUED . . . . .... 330,000 763,817
- OTHER LONG-TERM DEBT . . . . . . . . .... . ... . ... 600,000
OTHER SOURCES
OPERATING TRANSFERS IN - ENTERPRISE FUNDS - GOVERNMENTAL FUNDS 12,972 . . . . .... 382,978 48,189 462,603
TOTAL REVENUES ANO OTHER SOURCES 17,008,947 6,703,753 8,823,732 11,874,037 13,431,181 15,958,868

TABLE 3 CLASSIFICATION OF COUNTY EXPENDITURES
FOR THE YEAR ENDED DECEMBER 31, 1992 GOVERNMENTAL FUNDS MCLEOO MAHNOMEN MARSHALL MARTIN MEEKER MILLE LACS
EXPENDITURES GENERAL GOVERNMENT· Current Expenditures 2,932,624 760,292 1,001,040 1,730,249 1,151,854 1,999,680
- Capital outlay .... . ... . ... 97,227 . ... . ... TOTAL GENERAL GOVERNMENT 2,932,624 760,292 1,001,040 1,827,F6 1,151,854 1,999,680
PUBLIC SAFETY Sheriff 1,026,952 355,602 570,267 966,320 930,732 789,449 Corrections 560,444 94,829 85,922 170,018 116,945 762,958 All Other 128,960 39,990 26,996 49,647 63,an 100,390 Capital outlay .... 49,116 . ... . ... . ... . ...
TOTAL PUBLIC SAFETY 1,716,356 539,537 STREETS AND HIGHWAYS
683,185 1,185,985 1,111,554 1,652,797
Adnlnistratlon 372,781 116,556 401,687 158,647 ,n,976 . 150,945 Operation and Maintenance 1,388,542 636,886 1,424,290 1,810,848 1,327,709 855,330 Capital outlay 2,939,432 2,130,650 910,753 2,679,211 3,082,501 3,907,251
TOTAL STREETS AND HIGHWAYS 4,700,755 2,884,092 2,736,730 4,648,706 4,588,186 4,913,526 SANITATION· Current Expenditures 307,124 213,601 301,645 179,615 624,363 332,422
- capital outlay .... . ... . ... . ... . ... . ... TOTAL SANITATION 307,124 213,601 301,645 179,615 624,363 332,422
HUMAN SERVICES Income Maintenance 1,501,910 685,923 831,659 .... 1,299,421 1,sn,663 Social Services 4,207,113 9n, 1so 1,274,537 .... 2,734,965 3,073,459 Other Hunan Service Costs .... . ... . ... 1,290,532 Capital outlay .... . ... . ... . ...
~ TOTAL HUMAN SERVICES 5,709,023 1,663,073 2,106,196 1,290,532 4,034,386 4,951,122
HEALTH - Current Expenditures 732,557 13,750 17,865 .... 616,873 493,127 - Capital outlay .... . ... . ... . ... . ... . ...
TOTAL HEALTH 732,557 13,750 17,865 .... 616,873 493,127 CULTURE AND RECREATION
Libraries - Current Expenditures 81,313 6,826 45,000 375,467 73,406 78,754 - Capital outlay .... .... . ... 94,212 . ... . ...
Parks and Recreation - Current Expenditures 207,874 18,641 81,239 41,842 80,352 2,500 - Capital Outlay .... . ... . ... . ... . ... . ...
TOTAL CULTURE AND RECREATION 289,187 25,467 126,239 511,521 153,758 81,254 CONSERVATION OF NATURAL RESOURCES· Current Exp 263,223 162,785 727,532 564,146 294,610 105,974
- capital outlay .... . ... . ... . ... . . . . . ... TOTAL CONSERVATION OF NATURAL RESOURCES 263,223 162,785 727,532 564,146 294,610 105,974
ECONOMIC DEVELOPMENT - Current Expenditures .... 39,503 193,864 123,945 7,750 - Capital outlay .... . ... . ... • di •• . ...
TOTAL ECONOMIC DEVELOPMENT .... 39,503 193,864 123,945 7,750 All OTHER· Current Expenditures 51,432 70,589 93,784 203,917 85,002 1,500
- capital outlay . . . . .... . ... • 0 •• . ... DEBT SERVICE - Principal Paid on Bonds 1,690,000 25,000 533,000 220,000 139,306
- Other Long-term Debt 400,000 137,367 68,793 35,000 66,595 - Interest and Fiscal Charges 215,134 46,780 180,955 87,001 42,433 33,412
TOTAL CURRENT EXPENDITURES 13,762,849 4,192,923 1,on,321 7,665,193 9,585,835 10,624,151 TOTAL CAPITAL OUTLAY 2,939,432 2,179,766 910,753 2,870,650 3,082,501 3,907,251 TOTAL DEBT SERVICE 2,305,134 209,147 782,748 342,001 248,334 33,412
TOTAL EXPENDITURES 19,007,415 6,581,836 8,770,828 10,an,844 12,916,670 14,564,814 OTHER FINANCING USES
Debt Reden.,tion - Refunded Bonds Other Financing Uses Transfers to - Enterprise Fl.l'lds
12,972 382,978 48,189 462,603 - Governnental Funds .... . ... TOTAL EXPENDITURES AND OTHER USES 19,020,387 6,581,836 8,770,828 11,260,822 12,964,859 15,027,417

TABLE 2 CLASSIFICATION OF COUNTY REVENUES
FOR THE YEAR ENDED DECEMBER 31, 1992
MORRISON MOWER MURRAY NICOLLET NOBLES NORMAN
POPULATION (1992 Estimate) 30,095 37,453 9,597 28,697 20,140 7,889 NET TAXABLE TAX CAPACITY 11,823,640 16,314,472 6,930,769 11,715,070 11,136,311 s,639,6n 1991 TAX LEVY (Payable In 1992) 6,458,080 7,888,922 2,055,982 5,785,784 3,587,336 1,965,793
GOVERNMENTAL FUNDS REVENUES
PROPERTY TAXES 6,823,552 8,022,194 2,078,360 6,033,290 3,702,663 2,057,891
SPECIAL ASSESSMENTS 706,709 274,656 288,010 290,269 91,000 815,467
LICENSES AND PERMITS 70,977 22,351 14,315 1,085 121,251 487
FINES AND FORFEITS 156,989 225,483 45,769 172,633 105,004 18,938
INTERGOVERNMENTAL REVENUES
Federal Grants - Narcotics Control .... . ... . ... . ... 29,999 - Highways 72,665 64,984 851 543,000 416,627 1,268 - Hunan Services 2,128,226 2,667,915 .... 1,520,167 1,229,316 462,136 • All Other 204,915 161,295 90,460 14,775 163,614 12,486
State Grants - Homestead Credit (HACA) 1,250,031 1,746,820 628,301 1,208,489 919,548 548,624
~ • Mobile Home Homestead Credit 18,004 .... . ... 16,649 . ... 1,880 • Attached Machinery Aid .... 49,748 • Taconite Homestead Credit - Disparity Reduction Aid 42,957 363,240 36,703 18,422 102,167 20, 158 - Highways 2,174,259 2,722,271 1,658,022 1,709,022 2,726,922 2,279,479 • Hunan Services 2,494,951 4,255,226 2,232 1,657,307 1,814, 1n 705,769 · Other 489,598 542,844 228,959 384,998 609,230 65,823
Local Units Grants 6,825 4,166 .... . ... 323,451
TOTAL INTERGOVERNMENTAL REVENUES 8,882,431 12,578,509 2,645,528 7,072,829 8,335,051 4,097,623
CHARGES FOR SERVICES 3,079,485 1,395,074 278,640 1,222,137 881,244 250,731
INTEREST EARNINGS 442,533 731,227 123, 122 234,337 298,751 130,282
ALL OTHER REVENUES 1,142,514 526,047 281,613 1,126,335 867,384 126,560
TOTAL REVENUES 21,305,190 23,775,541 5,755,357 16,152,915 14,402,348 7,497,979
OTHER FINANCING SOORCES BORROWING· BONDS ISSUED 3,865,000 .... 362,917
· OTHER LONG-TERM DEBT
OTHER SOURCES . . . . . ... 60,666 .... 1,518
OPERATING TRANSFERS IN· ENTERPRISE FUNDS .... . ... .. •.• • GOVERNMENTAL FUNDS 118,598 58,207 3,264 30,000 10,000 14,297
TOTAL REVENUES AND OTHER SOURCES 25,288,788 23,833,748 6,182,204 16,182,915 14,413,866 7,512,276
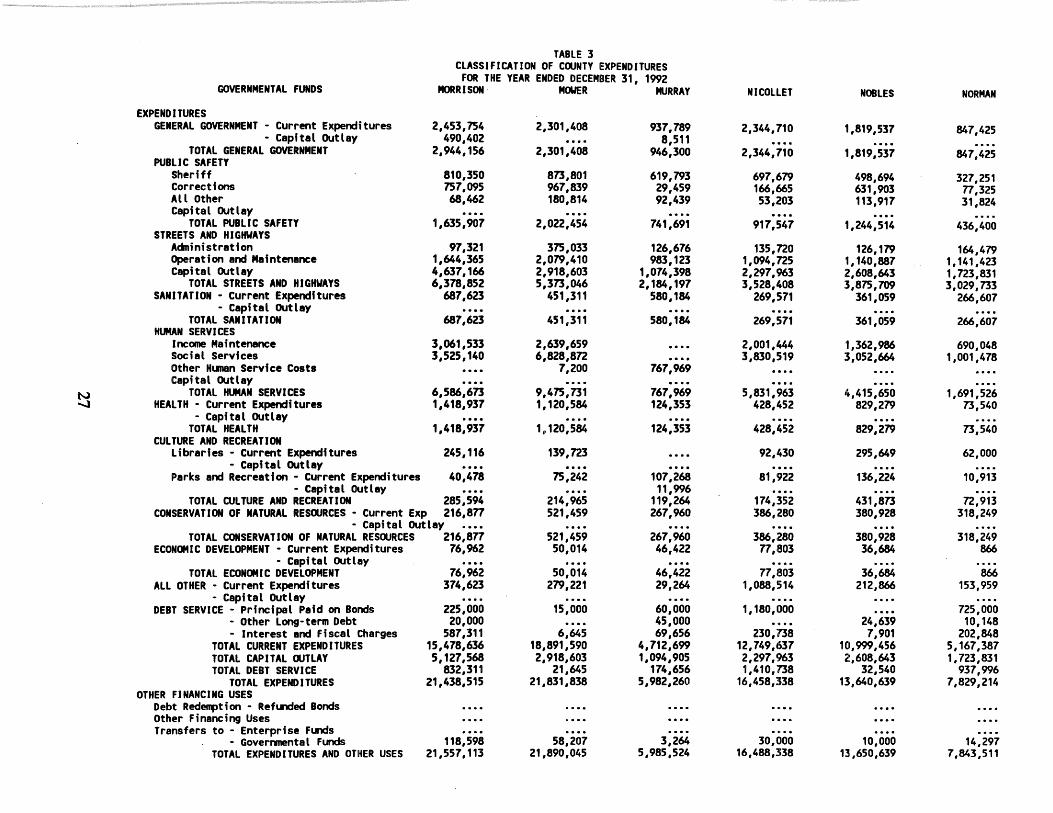
TABLE 3 CLASSIFICATION OF COUNTY EXPENDITURES
FOR THE YEAR ENDED DECEMBER 31, 1992 GOVERNMENTAL FUNDS MORRISON MOUER MURRAY NICOLLET NOBLES NORMAN
EXPENDITURES GENERAL GOVERNMENT - Current Expenditures 2,453,754 2,301,408 937,789 2,344,710 1,819,537 847,425
- Capital outlay 490,402 .... 8,511 . ... . ... . ... TOTAL GENERAL GOVERNMENT 2,944,156 2,301,408 946,300 2,344,710 1,819,537 847,425
PUBLIC SAFETY Sheriff 810,350 873,801 619,793 697,679 498,694 327,251 Corrections 757,095 967,839 29,459 166,665 631,903 n,325 All Other 68,462 180,814 92,439 53,203 113,917 31,824 Capital Outlay .... . ... . ... . ... . ... . ...
TOTAL PUBLIC SAFETY 1,635,907 2,022,454 STREETS AND HIGHWAYS
741,691 917,547 1,244,514 436,400
Adninistratlon 97,321 375,033 126,676 135,720 126,179 164,479 Operation and Maintenance 1,644,365 2,079,410 983,123 1,094,725 1,140,887 1,141,423 Capital Outlay 4,637,166 2,918,603 1,074,398 2,297,963 2,608,643 1,723,831
TOTAL STREETS AND HIGHWAYS 6,378,852 5,373,046 2, 184, 197 3,528,408 3,875,709 3,029,733 SANITATION - Current Expenditures 687,623 451,311 580,184 269,571 361,059 266,607
- Capital outlay .... . ... . ... . ... . ... . ... TOTAL SANITATION 687,623 451,311
HUMAN SERVICES 580,184 269,571 361,059 266,607
Income Maintenance 3,061,533 2,639,659 .... 2,001,444 1,362,986 690,048 Social Services 3,525,140 6,828,872 .... 3,830,519 3,052,664 1,001,478 Other Hunan Service Costs .... 7,200 767,969 Capital Outlay .... . ... . ...
!:j TOTAL HUMAN SERVICES 6,586,673 9,475,731 767,969 5,831,963 ,.,415,650 1,691,526 HEALTH - Current Expenditures 1,418,937 1,120,584 124,353 428,452 829,279 73,540
- Capital outlay .... . ... . ... . ... . ... . ... TOTAL HEALTH 1,418,937 1.,120,584 124,353 428,452 829,279 73,540
CULTURE AND RECREATION Libraries - current Expenditures 245,116 139,723 .... 92,430 295,649 62,000
- Capital Outlay .... . ... . ... . ... . ... . ... Parks and Recreation - Current Expenditures 40,478 75,242 107,268 81,922 136,224 10,913
- Capital outlay .... . ... 11,996 . ... . ... . ... TOTAL CULTURE AND RECREATION 285,594 214,965 119,264 174,352 431,873 72,913
CONSERVATION OF NATURAL RESOURCES - Current Exp 216,STT 521,459 267,960 386,280 380,928 318,249 - Capital outlay .... . ... . ... . ... . ... . ...
TOTAL CONSERVATION OF NATURAL RESOURCES 216,STT 521,459 267,960 386,280 380,928 318,249 ECONOMIC DEVELOPMENT - Current Expenditures 76,962 50,014 46,422 n,so3 36,684 866
- Capital outlay .... . ... . ... . ... . ... . ... TOTAL ECONOMIC DEVELOPMENT 76,962 50,014 46,422 77,803 36,684 866
ALL OTHER - Current Expenditures 374,623 279,221 29,264 1,088,514 212,866 153,959 - Capital outlay .... . . . . . ... . ... . ... . ...
DEBT SERVICE - Principal Paid on Bonds 225,000 15,000 60,000 1,180,000 .... 725,000 - Other Long-term Debt 20,000 .... 45,000 . ... 24,639 10, 148 - Interest and Fiscal Charges 587,311 6,645 69,656 230,738 7,901 202,848
TOTAL CURRENT EXPENDITURES 15,478,636 18,891,590 4,712,699 12,749,637 10,999,456 5,167,387 TOTAL CAPITAL OUTLAY 5,127,568 2,918,603 1,094,905 2,297,963 2,608,643 1,723,831 TOTAL DEBT SERVICE 832,311 21,645 174,656 1,410,738 32,540 937,996
TOTAL EXPENDITURES 21,438,515 21,831,838 5,982,260 16,458,338 13,640,639 7,829,214 OTHER FINANCING uses
Debt Redeq>tion - Refunded Bonds Other Financing Uses Transfers to - Enterprise Funds
118,598 58,207 - Governmental Funds 3,264 30,000 10,000 14,297 TOTAL EXPENDITURES AND OTHER USES 21,557,113 21,890,045 5,985,524 16,488,338 13,650,639 7,843,511

TABLE 2 CLASSIFICATION OF COONTY REVENUES
FOR THE YEAR ENDED DECEMBER 31, 1992
OLMSTED OTTER TAIL PENNINGTON PINE PIPESTONE POLK
POPULATION (1992 Estimate) 111,081 51, 137 13,252 21,755 10,440 32,692 NET TAXABLE TAX CAPACITY 63,390,107 23,739,345 4,351,970 9,784,790 4,585,224 18,876,218 1991 TAX LEVY (Payable fn 1992) 25,188,507 9,186,790 2,358,674 4,355,959 2,218,995 7,405,837
GOVERNMENTAL FUNDS REVENUES
PROPERTY TAXES 24,633,861 9,559,829 2,369,161 4,629,080 2,239,300 7,513,335
SPECIAL ASSESSMENTS 26,444 17,897 79,186 .... 69,259 321,514
LICENSES AND PERMITS 716,205 148,002 2,166 76,222 1,760 14,545
FINES AND FORFEITS 373,673 242,260 82,625 94,753 61,364 162,580
INTERGOVERNMENTAL REVENUES
Federal Grants· Narcotfcs Control 8,320 90,633 263 • Highways 742,688 580,626 .... 168,593 . ... 491,971 • Hunan Servfces 7,085,397 4,m,967 997,497 1,604,746 678,097 2,852,092 • All Other 545,381 183,308 18,792 440,305 23,568 92,901
State Grants· Homestead Credit (HACA) 4,884,909 1,939,203 622,918 619,324 608,746 1,243,001
~ - Mobile Home Homestead Credft .... 21,770 11,598 . ... .... 15,163 - Attached Machinery Aid . . . . .... . ... . ... . ... 65,167 - Taconite Homestead Credit . . . . .... . ... . ... . ... . ... • Disparfty Rec:luctfon Aid 20,038 22,816 125,228 1,386 123,228 321,027 • Highways ·4,115,315 7,676,960 1,n3, 169 4,258,578 2,021,897 4,509,769 • Hunan Servfces 7,755,ns 5,287,975 1,2n,941 2,044,889 786,231 3,906,501 - Other 1,845,233 370,940 258,599 884,973 169,406 266,354
Local Unfts Grants 2,954,767 55,670 425 4,055 11,616 10,000
TOTAL INTERGOVERNMENTAL REVENUES 29,957,776 21,007,868 5,031,430 10,026,849 4,422,789 13,m,946
CHARGES FOR SERVICES 5,910,047 2,525,139 955,507 1,127,751 597,268 1,322,657
INTEREST EARNINGS 3,091,963 987,685 211,475 343,402 192,817 359,854
ALL OTHER REVENUES ' 510,200 668,234 176,630 746,985 417,384 615,793
TOTAL REVENUES 65,220,169 35,156,914 8,908,180 17,045,042 8,001,941 24,084,224
OTHER FINANCING SOORCES BORROWING· BONDS ISSUED 16,5n,398 3,184,049 . . . . .... 1,447, 175
· OTHER LONG-TERM DEBT .... 122,261 182,146 547,855 . ... 167,853
OTHER SOORCES
OPERATING TRANSFERS IN· ENTERPRISE FUNDS . . . . 86,485 . . . . .... . ... 55,542 • GOVERNMENTAL FUNDS 2,849,194 12,028 51,661 365,292 155,115 890,157
TOTAL REVENUES AND OTHER SOORCES 84,641,761 38,561,737 9,141,987 17,958,189 9,604,231 25,197,776
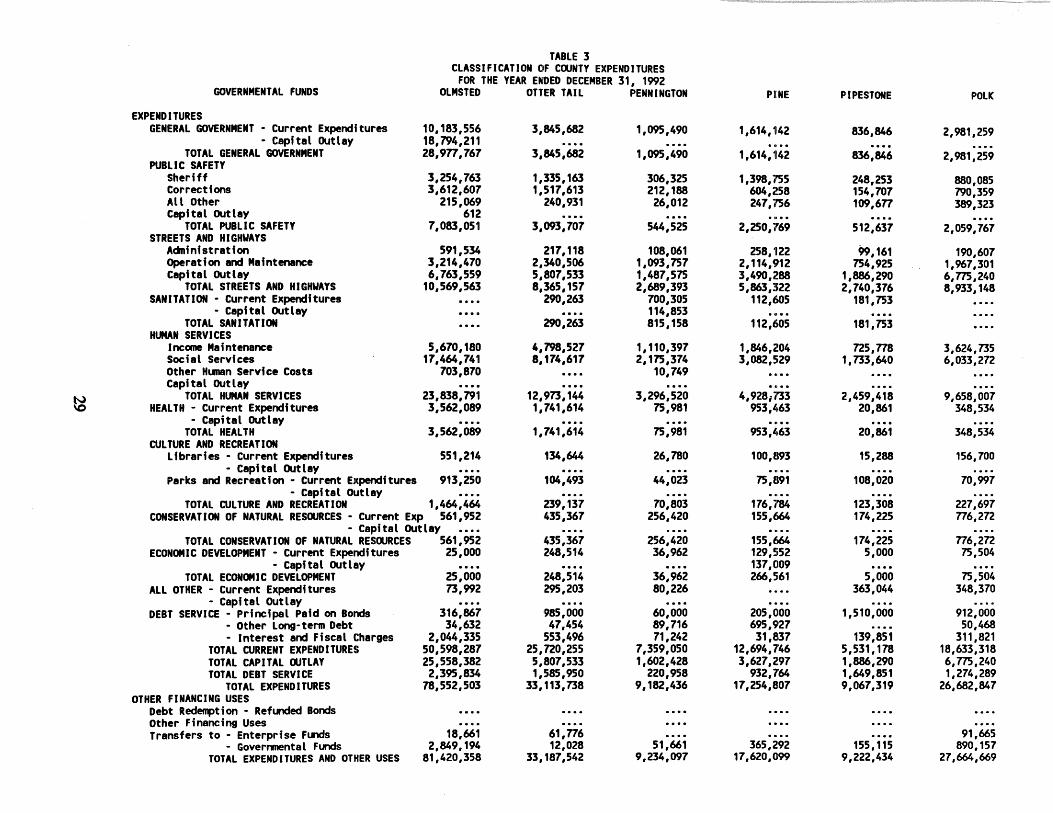
TABLE 3 CLASSIFICATION OF COONTY EXPENDITURES
FOR THE YEAR ENDED DECEMBER 31, 1992 GOVERNMENTAL FUNDS OLMSTED OTTER TAIL PENNINGTON PINE PIPESTONE POLK
EXPENDITURES GENERAL GOVERNMENT - Current Expenditures 10,183,556 3,845,682 1,095,490 1,614,142 836,846 2,981,259
- Capital outlay 18,794,211 .... . ... . .... . ... . ... TOTAL GENERAL GOVERNMENT 28,977,767 3,845,682
PUBLIC SAFETY 1,095,490 1,614,142 836,846 2,981,259
Sheriff 3,254,763 1,335,163 306,325 1,398,755 248,253 880,085 Corrections 3,612,607 1,517,613 212,188 604,258 154,707 790,359 All Other 215,069 240,931 26,012 247,756 109,677 389,323 Capt tal outlay 612 .... . ... . ... . ... . ...
TOTAL PUBLIC SAFETY 7,083,051 3,093,707 STREETS AND HIGHWAYS
544,525 2,250,769 512,637 2,059,767
Achinfstratfon 591,534 217,118 108,061 258,122 99,161 190,607 Operation and Maintenance 3,214,470 2,340,506 1,093,757 2,114,912 754,925 1,967,301 Capf tal outlay 6,763,559 5,807,533 1,487,575 3,490,288 1,886,290 6,m,240
TOTAL STREETS AND HIGHWAYS 10,569,563 8,365,157 2,689,393 5,863,322 2,740,376 8,933,148 SANITATION - Current Expenditures .... 290,263 700,305 112,605 181,753
- Capital outlay .... . ... 114,853 . .... . ... TOTAL SANITATION .... 290,263 815,158 112,605 181,753
HUMAN SERVICES Income Maintenance 5,670,180 4,798,527 1,110,397 1,846,204 n5,778 3,624,735 Social Services 17,464,741 8,174,617 2,175,374 3,082,529 1,733,640 6,033,272 Other Hunan Service Costs 703,870 .... 10,749 Capital outlay .... . ... . ...
~ TOTAL HUMAN SERVICES 23,838,791 12,973,144 3,296,520 4,928,733 2,459,418 9,658,007
HEALTH - Current Expenditures 3,562,089 1,741,614 75,981 953,463 20,861 348,534 - Capital outlay .... . ... . ... . ... . ... . ...
TOTAL HEALTH 3,562,089 1,741,614 75,981 953,463 20,861 348,534 CULTURE AND RECREATION
Libraries - Current Expenditures 551,214 134,644 26,780 100,893 15,288 156,700 - Capital outlay . . . . .... . ... • II •• .... . ...
Parks and Recreation - current Expenditures 913,250 104,493 44,023 75,891 108,020 70,997 - Capital outlay .... .... . ... • Cl •• .... . ...
TOTAL CULTURE AND RECREATION 1,464,464 239,137 .70,803 176,784 123,308 227,697 CONSERVATION OF NATURAL RESOURCES - Current Exp 561,952 435,367 256,420 155,664 174,225 776,2n
- capital outlay . . . . . ... .... . .... . ... . ... TOTAL CONSERVATION OF NATURAL RESOORCES 561,952 435,367 256,420 155,664 174,225 776,zn
ECONOMIC DEVELOPMENT - Current Expenditures 25,000 248,514 36,962 129,552 5,000 75,504 - capital outlay . . . . .... . ... 137,009 . ... . ...
TOTAL ECONOMIC DEVELOPMENT 25,000 248,514 36,962 266,561 5,000 75,504 ALL OTHER - Current Expenditures 73,992 295,203 80,226 .... 363,044 348,370
- Capital outlay . . . . . ... .... . ... . ... . ... DEBT SERVICE - Principal Paid on Bonds 316,867 985,000 60,000 205,000 1,510,000 912,000
- Other Long-term Debt 34,632 47,454 89,716 695,927 .... 50,468 - Interest and Fiscal Charges 2,044,335 553,496 71,242 31,837 139,851 311,821
TOTAL CURRENT EXPENDITURES 50,598,287 25,no,25s 7,359,050 12,694,746 5,531,178 18,633,318 TOTAL CAPITAL OUTLAY 25,558,382 5,807,533 1,602,428 3,627,297 1,886,290 6,m,240 TOTAL DEBT SERVICE 2,395,834 1,585,950 220,958 932,764 1,649,851 1,274,289
TOTAL EXPENDITURES 78,552,503 33,113,738 9,182,436 17,254,807 9,067,319 26,682,847 OTHER FINANCING USES
Debt Redeq:,tion - Refooded Bonds Other Financing Uses Transfers to - Enterprise Foods 18,661 61,776 .... . ... . ... 91,665
- Governnental Funds 2,849,194 12,028 51,661 365,292 155,115 890,157 TOTAL EXPENDITURES AND OTHER USES 81,420,358 33,187,542 9,234,097 17,620,099 9,222,434 27,664,669
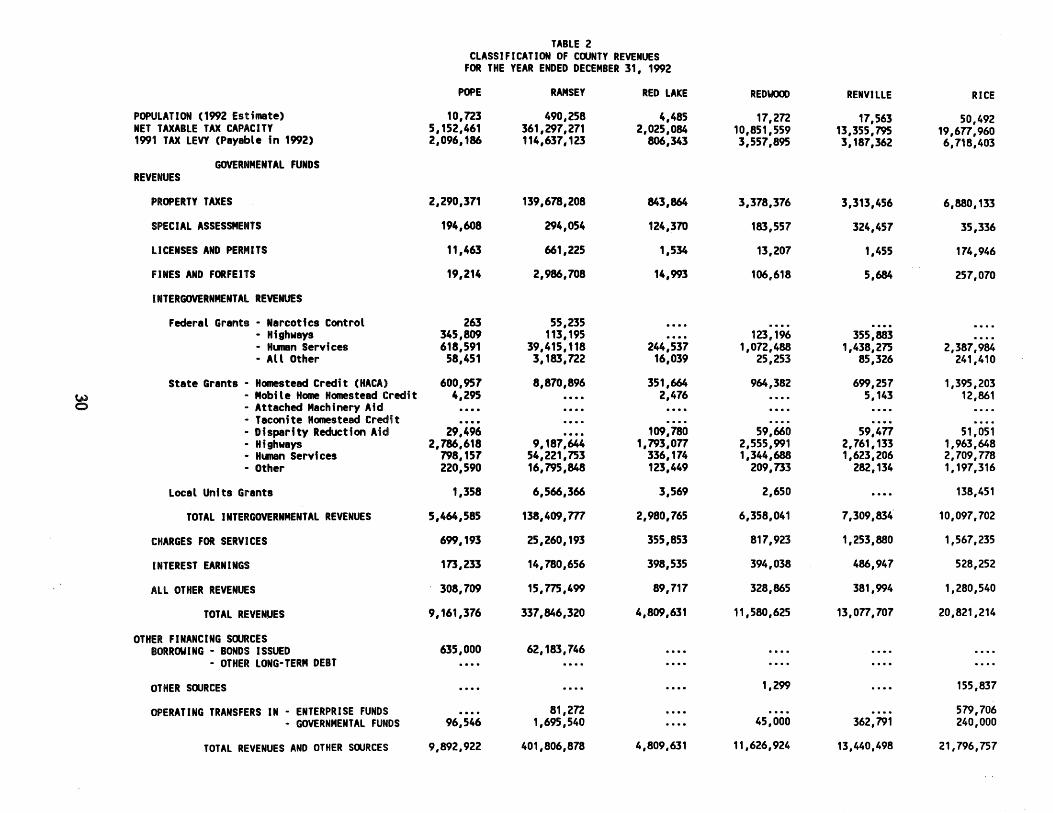
TABLE 2 CLASSIFICATION OF COUNTY REVENUES
FOR THE YEAR ENDED DECEMBER 31, 1992
POPE RAMSEY RED LAKE REDWOOD RENVILLE RICE
POPULATION (1992 Estimate) 10,n3 490,258 4,485 11,2n 17,563 50,492 NET TAXABLE TAX CAPACITY 5,152,461 361,297,271 2,025,084 10,851,559 13,355,795 19,677,960 1991 TAX LEVY (Payable in 1992) 2,096,186 114,637,123 806,343 3,557,895 3,187,362 6,718,403
GOVERNMENTAL FUNDS REVENUES
PROPERTY TAXES 2,290,371 139,678,208 843,864 3,378,376 3,313,456 6,880,133
SPECIAL ASSESSMENTS 194,608 294,054 124,370 183,557 324,457 35,336
LICENSES AND PERMITS 11,463 661,225 1,534 13,207 1,455 174,946
FINES AND FORFEITS 19,214 2,986,708 14,993 106,618 5,684 257,070
INTERGOVERNMENTAL REVENUES
Federal Grants· Narcotics Control 263 55,235 • Highways 345,809 113,195 .... 123,196 355,883 • Hunan Services 618,591 39,415,118 244,537 1,072,488 1,438,275 2,387,984 • All Other 58,451 3, 183,n2 16,039 25,253 85,326 241,410
State Grants - Homestead Credit (HACA) 600,957 8,870,896 351,664 964,382 699,257 1,395,203 ~ - Mobile Home Homestead Credit 4,295 .... 2,476 . ... 5,143 12,861 0 • Attached Machinery Aid
• Taconite Homestead Credit • Disparity Reduction Aid 29,496 .... 109,780 59,660 59,477 51,051 • Highways 2,786,618 9,187,644 1,793,077 2,555,991 2,761,133 1,963,648 • Hunan Services 798,157 54,221,753 336,174 1,344,688 1,623,206 2,709,778 - Other 220,590 16,795,848 123,449 209,733 282,134 1,197,316
Local Units Grants 1,358 6,566,366 3,569 2,650 .... 138,451
TOTAL INTERGOVERNMENTAL REVENUES 5,464,585 138,409,m 2,980,765 6,358,041 7,309,834. 10,097,702
CHARGES FOR SERVICES 699,193 25,260,193 355,853 817,923 1,253,880 1,567,235
INTEREST EARNINGS 173,233 14,780,656 398,535 394,038 486,947 528,252
All OTHER REVENUES 308,709 15,775,499 89,717 328,865 381,994 1,280,540
TOTAL REVENUES 9,161,376 337,846,320 4,809,631 11,580,625 13,077,707 20,821,214
OTHER FINANCING SOURCES BORROWING· BONDS ISSUED 635,000 62,183,746
· OTHER LONG-TERM DEBT
OTHER SOURCES . . . . . . . . .... 1,299 . ... 155,837
OPERATING TRANSFERS IN· ENTERPRISE FUNDS . . . . s1,2n . . . . .... . ... 579,706 · GOVERNMENTAL FUNDS 96,546 1,695,540 .... 45,000 362,791 240,000
TOTAL REVENUES AND OTHER SWRCES 9,892,922 401,806,878 4,809,631 11,626,924 13,440,498 21,796,757

TABLE 3 CLASSIFICATION OF COONTY EXPENDITURES
FOR THE YEAR ENDED DECEMBER 31, 1992 GOVERNMENTAL FUNDS POPE RAMSEY RED LAKE REDWOD RENVILLE RICE
EXPENDITURES GENERAL GOVERNMENT - current Expenditures 1,2s1,m 50,105,467 599,128 1,570,799 1,310,611 3,385,330
- capital outlay .... 26,450,274 . ... 328,525 530,557 . ... TOTAL GENERAL GOVERNMENT 1,2s1,m 76,555,741 599,128 1,899,324 1,841,168 3,385,330
PUBLIC SAFETY Sheriff 436,812 14,063,092 391,440 762,748 519,950 1,397,857 Corrections 128,317 26,215,328 42,926 88,n4 34,214 1,508,924 All Other 15,820 1,178,640 70,994 6,959 18,910 81,546 Capital outlay .... 3,902,307 . ... . ... . ... . ...
TOTAL PUBLIC SAFETY 580,949 45,359,367 505,360 858,481 573,074 2,988,327 STREETS AND HIGHWAYS
Actnfnistratfon 162,800 1,924,510 122,963 123,330 108,375 149,939 Operation and Maintenance 678,352 6,225,618 749,174 1,n1,284 2,957,867 1,598,266 Capital outlay 3,361,873 12,200,996 1,160,958 2,168,157 1,620,068 1,9n,4B
TOTAL STREETS AND HIGHWAYS 4,203,025 20,351,124 2,033,095 4,012,n1 4,686,310 3,no,61a SANITATION· Current Expenditures 238,731 4,735,383 103,750 389,099 260,212 69,500
- capital outlay .... 37,093 . ... 46,797 39,405 . ... TOTAL SANITATION 238,731 4,m,476 103,750 435,896 299,617 69,500
HUMAN SERVICES Income Maintenance 624,218 58,046,061 430,761 1, 196,656 1,780,604 2,868,995 Social Services 1,ln,104 98,386,574 321,439 2,618,434 2,779,492 5,412,422 Other Hunan Service Costs .... 14,234 . ... . ... . ... Capital outlay .... 141,986 . ... . ... 1,544
~ TOTAL HUMAN SERVICES 2,001,922 156,588,855 752,200 3,815,090 4,561,640 8,281,417 ..... HEALTH - Current Expenditures 428,827 13,110,903 19,000 . ... 586,678 1,714,067 - Capital outlay .... 23,808 . ... • 'JI •• 3,305 . ...
TOTAL HEALTH 428,827 13,134,711 19,000 .... "589,983 1,714,067 CULTURE AND RECREATION
Lfbrarfes - Current Expenditures 34,593 4,286,824 34,936 44,944 48,760 168,388 - Capital Outlay .... 4,896,:sn . ... . ... . ... . ...
Parks and Recreation· Current Expenditures 90,508 6,295,548 23,891 66,794 74,822 135,825 • Capital outlay .... 3,292,150 . ... 1,575
TOTAL CULTURE AND RECREATION 125,101 18,770,899 58,827 113,313 123,582 304,213 CONSERVATION OF NATURAL RESOORCES - Current Exp 210,311 663,128 254,197 410,954 703,719 257,782
• Capital outlay .... 25,557 . ... 8,816 . ... 459,246 TOTAL CONSERVATION OF NATURAL RESOORCES 210,311 688,685 254, 197 419,no 703,719 717,028
ECONOMIC DEVELOPMENT· Current Expenditures 1,299 3,200,885 24,739 24,429 .... 29,524 - Capital outlay .... 435 . ... . ... . ... . ...
TOTAL ECONOMIC DEVELOPMENT 1,299 3,201,320 24,739 24,429 .... 29,524 ALL OTHER· Current Expenditures 40,509 :.u3,541 9,144 .... 150,445
- Capital outlay .... . ... . ... . ... DEBT SERVICE~ Principal Paid on Bonds 55,000 4,320,000 275,000 390,000
- Other Long-term Debt .... 186,805 . ... 9,815 . ... 200,000 - Interest and Fiscal Charges 109,875 7,217,211 150,704 39,253 45,420 67,442
TOTAL CURRENT EXPENDITURES 5,n6,574 288,785,736 3,198,482 9,025,204 11,334,659 1s,ns,365 TOTAL CAPITAL OOTLAY 3,361,873 50,970,983 1,160,958 2,553,870 2,194,879 2,431,659 TOTAL DEBT SERVICE 164,875 11,724,016 425,704 439,068 45,420 267,442
TOTAL EXPENDITURES 9,253,322 351,480,735 4,785,144 12,018,142 13,574,958 21,4TT,466 OTHER FINANCING USES
Debt Redeq.,tion - Refunded Bonds Other Financing Uses Transfers to· Enterprise Funds .... 1,939,680 . ... . ... . ... 611,032
- Governnental Funds 96,546 1,695,540 .... 45,000 362,791 240,000 TOTAL EXPENDITURES AND OTHER USES 9,349,868 355,115,955 4,785,144 12,063,142 13,937,749 22,328,498

TABLE 2 CLASSIFICATION OF COUNTY REVENUES
FOR THE YEAR ENDED DECEMBER 31, 1992
ROCK ROSEAU ST. LOUIS SCOTT SHERBURNE SIBLEY
POPULATION (1992 Estimate) 9,750 15,295 199,260 61,960 44,949 14,336 NET TAXABLE TAX CAPACITY 5,687,213 6~303,106 68,711,115 38,152,295 53,017,178 7,041,686 1991 TAX LEVY (Payable fn 1992) 1,918,476 2,032,708 46,907,629 13,036,064 10,276,180 3,356,941
GOVERNMENTAL FUNDS REVENUES
PROPERTY TAXES 1,927,615 2,203,292 58,940,847 16,046,687 10,465,689 3,489,502
SPECIAL ASSESSMENTS 204,688 220,850 .... 71,935 34,391 373,040
LICENSES ANO PERMITS 1,965 2,250 127,058 687,131 92,996 12,8'39
FINES AND FORFEITS 47,962 64,981 691,775 264,541 408,678 56,473
INTERGOVERNMENTAL REVENUES
Federal Grants· Narcotics Control • Highways 79,915 585,554 2,726,910 3,682,446 264,292 • Hunan Services 459,468 570,368 18,876,166 3,171,868 1,893,768 799,878 • All Other 15,840 159,324 1,401,239 27,140 112,716 90,657
State Grants - Homestead Credft (HACA) 526,521 529,474 7,604,588 3,450,938 914,676 910,699 CH • Nobile Home Homestead Credft .... 18,789 74,115 31,541 6,798 5,908 N · Attached Machinery Aid .... . ... . ... 76,204
- Taconite Homestead Credit .... .... . ... . ... - Disparity Reduction Afd 28,640 2,799 7,616,328 14,484 7,304 77,343 - Highways 843,995 2,897,993 13,152,625 1,980,564 1,441,650 3,360,890 - Hunan Services 598,548 797,017 22,245,596 3,379,389 2,215,353 991,244 • Other 155,583 329,696 2,403,814 227,309 517,180 366,848
Local Units Grants . . . . .... 33,093 26,749 . ... 34,m
TOTAL INTERGOVERNMENTAL REVENUES 2,708,510 5,891,014 76,134,474 16,068,632 7,373,737 6,638,244
CHARGES FOR SERVICES 372,127 974,153 7,170,984 3,272,639 1,817,073 703,539
INTEREST EARNINGS 262,520 305,159 1,982,241 1,137,223 905,154 29,600
ALL OTHER REVENUES 233,348 251,980 5,242,847 1,621,947 1,385,084 172,002
TOTAL.REVENUES 5,758,735 9,913,679 150,290,226 39,170,735 22,482,802 11,475,239
OTHER FINANCING SOURCES BORROWING· BONDS ISSUED . . . . . ... .... 7,031,574
· OTHER LONG-TERM DEBT . . . . . . . . .... 718,449 250,000
OTHER SOURCES
OPERATING TRANSFERS IN· ENTERPRISE FUNDS . . . . .... 442,998 - GOVERNMENTAL FUNDS . . . . 100,255 882,040 .... 543,598 14,281
TOTAL REVENUES AND OTHER SOURCES 5,758,735 10,013,934 151,615,264 46,920,758 23,276,400 11,489,520

TABLE 3 CLASSIFICATION OF COUNTY EXPENDITURES
FOR THE YEAR ENDED DECEMBER 31, 1992 GOVERNMENTAL FUNDS ROCK ROSEAU ST. LOUIS SCOTT SHERBURNE SIBLEY
EXPENDITURES GENERAL GOVERNMENT - Current Expenditures 892,6n 967,297 17,184,975 7,735,154 4,485,245 1,655,746
- Capital outlay 26,115 .... 1,229,203 • 0 •• 79,860 37,735 TOTAL GENERAL GOVERNMENT 918,787 967,297 18,414,178 7,735,154 4,565,105 1,693,481
PUBLIC SAFETY Sheriff 312,651 618,977 5,556,175 1,745,124 1,884,623 533,799 Corrections 82,433 41,730 1,911,1n 2,334,601 1,415,486 132,643 All Other 26,741 30,660 2,984,576 755,835 183,761 27,401 Capital Outlay 2,000 .... 645,481 • o • • .... 13,552
TOTAL PUBLIC SAFETY 423,825 691,367 17,157,404 4,835,560 3,483,870 707,395 STREETS AND HIGHWAYS
Adninistratfon 101,234 147,099 4,280,674 353,395 260,686 350,679 Operation and Maintenance 1,164,233 1,588,Sn 15,371,469 1,795,389 765,566 1,360,540 Capital Outlay 520,662 2,734,589 12,415,142 8,123,218 1,337,976 3,345,629
TOTAL STREETS AND HIGHWAYS 1,786,129 4,470,560 32,067,285 10,2n,002 2,364,228 5,056,848 SANITATION - Current Expenditures 291,737 282,588 .... 652,155 280,329 133,219
- Capital Outlay 9,842 .... . ... . ., .. . ... . ... TOTAL SANITATION 301,579 282,588 .... 652,155 280,329 133,219
HUMAN SERVICES Income Maintenance 582,561 680,124 21,424,351 3,253,631 2,421,523 741,572 Social Services 1,161,430 1,244,938 46,821,670 6,413,851 4,560,083 2,004,169 Other Hunan Service Costa .... . ... . ... . ., .. 125,580 Capital Outlay .... .... 82,056 . ... . ...
~ TOTAL HUMAN SERVICES 1,743,991 1,925,062 68,328,077 9,667,482 7,107,186 2,745,741 ~ HEALTH - Current Expenditures 44,277 .... 5,928,282 522,632 670,050 701,476
- Capital Outlay . . . . .... 288 . ... . ... . ... TOTAL HEALTH 44,277 .... 5,928,570 522,632 670,050 701,476
CULTURE AND RECREATION Libraries - Current Expenditures 67,784 43,663 199,537 599,001 328,173 158,198
- Capital outlay .... .... . ... . ... . ... . ... Parks and Recreation - current Expenditures 414,193 61,123 186,070 281,000 118,050 23,769
- Capital outlay . . . . . ... • D • • .... . ... . ... TOTAL CULTURE AND RECREATION 481,977 104,786 385,607 880,001 446,223 181,967
CONSERVATION OF NATURAL RESOURCES - Current Exp 102,871 684,846 3,678,345 384,338 380,356 707,879 - Capital Outlay . . . . . ... 25,168 .... . ... . ...
TOTAL CONSERVATION OF NATURAL RESOURCES 102,871 684,846 3,703,513 384,338 380,356 707,879 ECONOMIC DEVELOPMENT - Current Expenditures 5,490 33,529 510,098 554,556 10,831 68,832
- Capital outlay . . . . . ... .... . ... . ... . ... TOTAL ECONOMIC DEVELOPMENT 5,490 33,529 510,098 554,556 10,831 68,832
ALL OTHER - Current Expenditures 40,855 84,323 . . . . .... 428,099 129,671 - Capital outlay . . . . . ... . . . . .... . ... . ...
DEBT SERVICE - Principal Paid on Bonds 110,000 .... 20,000 386,081 465,000 95,000 - Other Long-term Debt .... 126,590 942,423 318,121 250,000 170,000 - Interest and Fiscal Charges 10,222 15,349 804,443 618,443 64,636 79,535
TOTAL CURRENT EXPENDITURES 5,291,162 6,509,769 132,097,394 27,380,662 18,318,441 a,n9,593 TOTAL CAPITAL OUTLAY 558,619 2,734,589 14,397,338 8,123,218 1,417,836 3,396,916 TOTAL DEBT SERVICE 120,222 141,939 1,766,866 1,322,645 779,636 344,535
TOTAL EXPENDITURES 5,970,003 9,386,297 148,261,598 36,826,525 20,515,913 12,471,044 OTHER FINANCING USES
Debt Redeq,tion - Refunded Bonds . . . . . ... .... 7,031,574 Other Financing Uses Transfers to - Enterprise Funds
- Goverrmental Funds . . . . 100,255 882,040 .... 543,598 14,281 TOTAL EXPENDITURES ANO OTHER USES 5,970,003 9,486,552 149,143,638 43,858,099 21,059,511 12,485,325

TABLE 2 CLASSIFICATION OF COUNTY REVENUES
FOR THE YEAR ENDED DECEMBER 31, 1992
STEARNS STEELE STEVENS SWIFT TODD TRAVERSE
POPULATION (1992 Estimate) 122,240 31,087 10,592 10,616 23,402 4,383 NET TAXABLE TAX CAPACITY 52,784,923 14,604,547 4,754,235 5,165,093 6,725,358 3,797,654 1991 TAX LEVY (Payable In 1992) 19,798,614 4,717,902 2,179,950 2,638,159 4,399,867 1,589,824
GOVERNMENTAL FUNDS REVENUES
PROPERTY TAXES 20,528,568 4,908,263 2,224,627 2,699,084 4,486,059 1,622,000
SPECIAL ASSESSMENTS 265,766 135,881 190,657 545,405 4,140 4,120
LICENSES AND PERMITS 216,774 70,399 1,125 2,425 63,327 1,697
FINES AND FORFEITS 762,800 277,984 .... 2,677 99,966 -
INTERGOVERNMENTAL REVENUES
Federal Grants - Narcotics Control .... . . . . . ... . ... 194 - Highways 14,886 .... . ... 222,865 . ... 20,698 - Hunan Services 5,315,225 1,233,929 619,888 679,835 2,058,506 332,260 • All Other 1,603,263 95,147 20,553 37,237 170,989 6,201
State Grants· Homestead Credit (HACA) 4,325,033 .... 846,871 681,742 1,331,631 364,057 c.,.> • Mobile Home Homestead Credit 40,868 1,004,627 2,519 2,925 14,225 983 ~ - Attached Machinery Aid 46,227
• Taconite Homestead Credit .... • Disparity Rec:luctton Aid 70,682 42,377 82,036 106,709 100,092 26,312 • Highways 5,162,206 2,169,401 991,752 2,071,319 3,331,904 1,622,002 - Hunan Services 6,570,342 1,922,949 1,031,504 933,479 1,811,908 467,m • Other 1,717,574 430,970 103,109 330,994 1,131,139 108,004
Local Uni-ts Grants 9,112 47,221 .... 18,470 71,392
TOTAL INTERGOVERNMENTAL REVENUES 24,875,418 6,946,621 3,698,232 5,085,575 10,021,980 2,948,289
CHARGES FOR SERVICES 3,568,738 2,163,077 256,874 534,134 1,579,790 135,652
INTEREST EARNINGS 1,613,239 695,076 287,577 385,579 473,071 56,274
ALL OTHER REVENUES 3,004,914 255,411 543,877 499,933 , 1,174,577 194,790
TOTAL REVENUES 54,836,217 15,452,712 7,202,969 9,754,812 17,902,910 4,962,822
OTHER FINANCING SOURCES BORROWING· BONDS ISSUED 17,355,000 .... 718,159
• OTHER LONG-TERM DEBT . . . . . . . . . . . . .... . ... 11,980
OTHER SOURCES 348,645
OPERATING TRANSFERS IN· ENTERPRISE FUNDS · GOVERNMENTAL FUNDS 1,506,642 527,384 45,452 .... 126,075 839
TOTAL REVENUES AND OTHER SOURCES 74,046,504 15,980,096 7,966,580 9,754,812 18,028,985 4,975,641
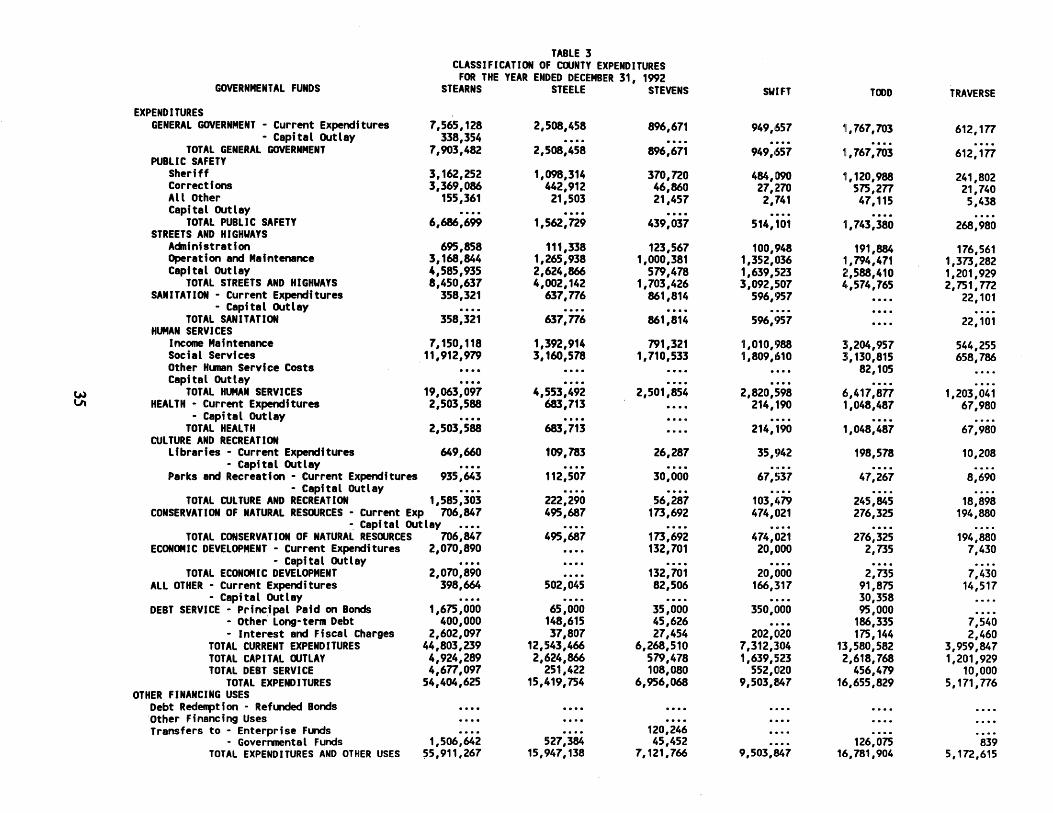
TABLE 3 CLASSIFICATION OF COUNTY EXPENDITURES
GOVERNMENTAL FUNDS FOR THE YEAR ENDED DECEMBER 31, 1992
STEARNS STEELE STEVENS S\IIFT TOOD TRAVERSE
EXPENDITURES GENERAL GOVERNMENT - Current Expenditures 7,565,128 2,508,458 896,671 949,657 1,767,703 612, 177
- Capital outlay 338,354 .... . ... . ... . ... . ... TOTAL GENERAL GOVERNMENT 7,903,482 2,508,458 896,671 949,657 1,767,703 612,177
PUBLIC SAFETY Sheriff 3,162,252 1,098,314 370,720 484,090 1,120,988 241,802 Corrections 3,369,086 442,912 46,860 27,270 575,277 21,740 All Other 155,361 21,503 21,457 2,741 47,115 5,438 Capital outlay .... . ... . ... . ... . ... . ...
TOTAL PUBLIC SAFETY 6,686,699 1,562,729 439,037 514,101 1,743,380 268,980 STREETS AND HIGHVAYS
Actnlnistration 695,858 111,338 123,567 100,948 191,884 176,561 Operation and Maintenance 3,168,844 1,265,938 1,000,381 1,352,036 1,794,471 1,373,282 Capital outlay 4,585,935 2,624,866 579,478 1,639,523 2,588,410 1,201,929
TOTAL STREETS AND HIGHVAYS 8,450,637 4,002,142 1,703,426 3,092,507 4,574,765 2,751,m SANITATION - Current Expenditures 358,321 637,776 861,814 596,957 .... 22,101
- Capital outlay .... . ... . ... . ... . ... . ... TOTAL SANITATION 358,321 637,776 861,814 596,957 .... 22,101
HUMAN SERVICES Income Maintenance 7,150,118 1,392,914 791,321 1,010,988 3,204,957 544,255 Social Services 11,912,979 3,160,578 1,710,533 1,809,610 3,130,815 658,786 Other Hunan Service Costs .... . ... . ... . ... 82,105 Capital outlay . . . . . ... .... . ... . ...
c.,.) TOTAL HUMAN SERVICES 19,063,097 4,553,492 2,501,854 2,820,598 6,417,877 1,203,041 VI HEALTH - Current Expenditures 2,503,588 683,713 .... 214,190 1,048,487 67,980
- Capital outlay .... . ... . ... . ... . ... . ... TOTAL HEALTH 2,503,588 683,713 .... 214,190 1,048,487 67,980
CULTURE AND RECREATION Libraries - current Expenditures 649,660 109,783 26,287 35,942 198,578 10,208
- capital outlay .... . . . . . ... • ti •• . ... . ... Parks and Recreation - Current Expenditures 935,643 112,507 30,000 67,537 47,267 8,690
- Capital outlay . . . . .... . ... • 0 •• . ... . ... TOTAL CULTURE AND RECREATION 1,585,303 222,290 . 56,287 103,479 245,845 18,898
CONSERVATION OF NATURAL RESOURCES - Current Exp 706,847 495,687 173,692 474,021 276,325 194,880 -: Capital outlay . . . . . ... .... • 0 •• . ... . ...
TOTAL CONSERVATION OF NATURAL RESOURCES 706,847 495,687 173,692 474,021 276,325 194,880 ECONOMIC DEVELOPMENT· Current Expenditures 2,070,890 .... 132,701 20,000 2,735 7,430
- capital outlay .... . . . . . ... . ... . ... . ... TOTAL ECONOMIC DEVELOPMENT 2,070,890 .... 132,701 20,000 2,735 7,430
ALL OTHER - Current Expenditures 398,664 502,045 82,506 166,317 91,875 14,517 - Capital outlay . . . . . ... .... . ... 30,358
DEBT SERVICE· Principal Paid on Bonds 1,675,000 65,000 35,000 350,000 95,000 - Other Long-term Debt 400,000 148,615 45,626 .... 186,335 7,540 - Interest and Fiscal Charges 2,602,097 37,807 27,454 202,020 175,144 2,460
TOTAL CURRENT EXPENDITURES 44,803,239 12,543,466 6,268,510 7,312,304 13,580,582 3,959,847 TOTAL CAPITAL OUTLAY 4,924,289 2,624,866 579,478 1,639,523 2,618,768 1,201,929 TOTAL DEBT SERVICE 4,677,097 251,422 108,080 552,020 456,479 10,000
TOTAL EXPENDITURES 54,404,625 15,419,754 6,956,068 9,503,847 16,655,829 5,171,776 OTHER FINANCING USES
Debt Redeq:,tion • Refuided Bonds Other Financing Uses Transfers to - Enterprise Funds . . . . .... 120,246
· Governmental Funds 1,506,642 527,384 45,452 .... 126,075 839 TOTAL EXPENDITURES AND OTHER USES ~5,911,267 15,947,138 7,121,766 9,503,847 16,781,904 5,172,615

TABLE 2 CLASSIFICATION OF COONTY REVENUES
FOR THE YEAR ENDED DECEMBER 31, 1992
WABASHA WADENA WASECA WASHINGTON WATONWAN WILKIN
POPULATION (1992 Estimate) 19,990 13,144 17,990 156,276 11,643 7,449 NET TAXABLE TAX CAPACITY 8,317,654 3,911,806 9,601,926 114,556,782 6,668,190 5,433,609 1991 TAX LEVY (Payable fn 1992) 3,365,717 2,325,295 4,559,319 27,749,508 2,861,191 2,311,968
GOVERNMENTAL FUNDS REVENUES
PROPERTY TAXES 3,406,084 2,434,469 4,539,564 34,153,422 2,870,885 2,332,088
SPECIAL ASSESSMENTS .... 166,696 51,711 . ... 23,472 160,401
LICENSES AND PERMITS 5,918 23,700 9,508 1,386,795 5,491 850
FINES AND FORFEITS 61,043 45,708 49,834 940,547 76,394 8,809
INTERGOVERNMENTAL REVENUES
Federal Grants· Narcotics Control . . . . .... . ... 395,622 • Highways 31,682 319,354 1,105 3,339 102,400 • Hunan Services 967,735 1,262,839 944,144 5,759,141 918,183 574,609 • All Other 39,314 118,687 89,169 1,106,961 23,290 16,298
State Grants· Homestead Credit (HACA) 703,689 442,212 1,127,792 5,497,369 866, 191 670,143 CJ.l • Mobile Home Homestead Credit .... 10,948 .... 37,484 0 ••• 5,430
°' • Attached Machinery Aid .... . . . . . ... 100,513 - Taconite Homestead Credit . . . . . . . . .... . ... • Disparity Reduction Afd 39,352 77,795 18,300 793 7,250 28,249 • Highways 1,885,338 1,774,272 2,839,640 2,071,624 1,853,097 2,521,421 • Hunan Services 1,342,796 1,690,397 1,024,854 6,944,457 1,104,795 782,008 - Other 452,334 224,454 371,275 2,871,013 196,568 197,706
Local Units Grants 960 16,771 .... 1,719,576 34,000 . ... TOTAL INTERGOVERNMENTAL REVENUES 5,463,200 5,937,729 6,416,279 26,507,892 5,105,774 4,795,864
CHARGES FOR SERVICES 466,952 716,098 404,416 6,310,750 1,372,739 449,943
INTEREST EARNINGS 163,998 93,850 579,120 4,346,235 160,763 245,019
ALL OTHER REVENUES 229,059 505,976 216,928 3,618,546 336,118 101,772
TOTAL REVENUES 9,796,254 9,924,226 12,267,360 77,264,187 9,951,636 8,094,746
OTHER FINANCING SOORCES BORROWING· BONDS ISSUED . . . . . . . . .... 23,446,525
• OTHER LONG-TERM DEBT 746,873 70,101 .... . ... . ... 10,000
OTHER SOORCES
OPERATING TRANSFERS IN· ENTERPRISE FUNDS • GOVERNMENTAL FUNDS 794,655 282,111 1,188,228 1,021,681 .... 14,210
TOTAL REVENUES AND OTHER SOORCES 11,337,782 10,276,438 13,455,588 101,732,393 9,951,636 8,118,956
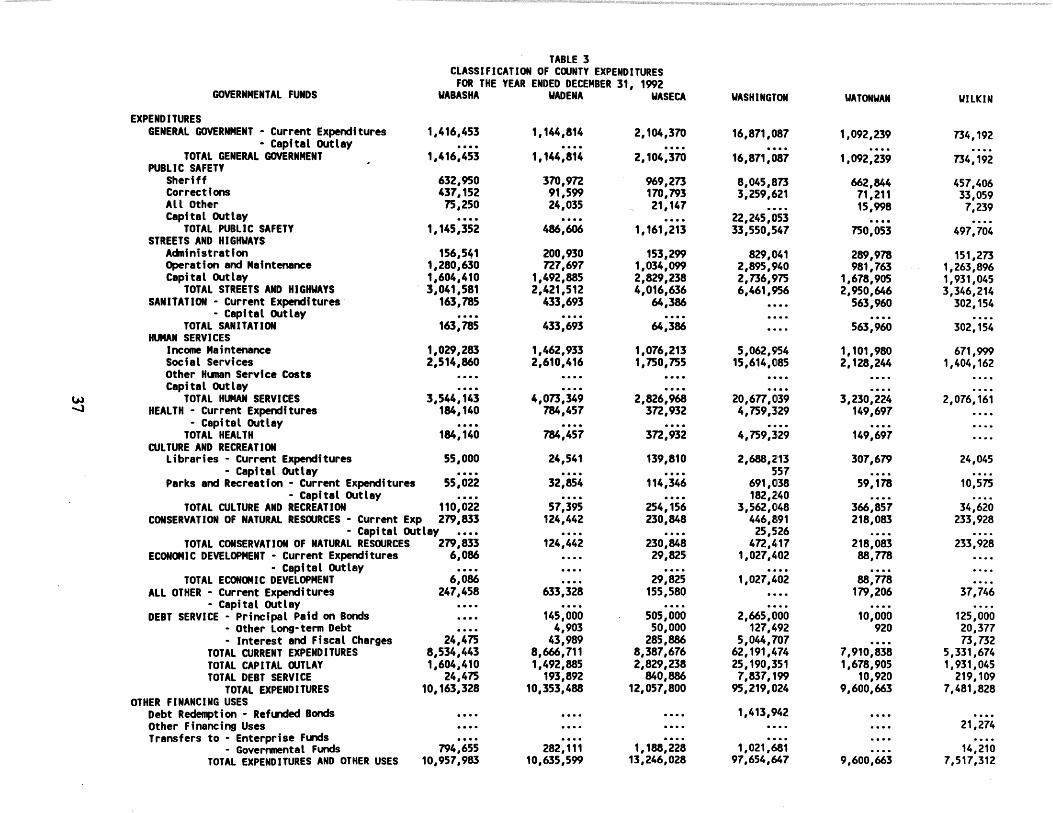
TABLE 3 CLASSIFICATION OF COUNTY EXPENDITURES
FOR THE YEAR ENDED DECEMBER 31, 1992 GOVERNMENTAL FUNDS UABASHA UADENA UASECA IIASHINGTON VATONIIAN IIILKIN
EXPENDITURES GENERAL GOVERNMENT· Current Expenditures 1,416,453 1,144,814 2,104,370 16,871,087 1,092,239 734,192
• Capital outlay .... . ... . ... . ... . ... . ... TOTAL GENERAL GOVERNMENT 1,416,453 1,144,814 2,104,370 16,871,087 1,092,239 734,192
PUBLIC SAFETY Sheriff 632,950 370,9n 969,273 8,045,873 662,844 457,406 Corrections 437,152 91,599 170,793 3,259,621 71,211 33,059 All Other 75,250 24,035 21, 147 .... 15,998 7,239 Capital outlay .... . ... . ... 22,245,053 . ... . ...
TOTAL PUBLIC SAFETY 1,145,352 486,606 STREETS AND HIGH\IAYS
1,161,213 33,550,547 750,053 497,704
Actninistratfon 156,541 200,930 153,299 829,041 289,978 151,273 Operation and Maintenance 1,280,630 n7,697 1,034,099 2,895,940 981,763 1,263,896 Capital outlay 1,604,410 1,492,885 2,829,238 2,736,975 1,678,905 1,931,045
TOTAL STREETS ANO HIGHWAYS 3,041,581 2,421,512 4,016,636 6,461,956 2,950,646 3,346,214 SANITATION· Current Expenditures· 163,785 433,693 64,386 .... 563,960 302,154
- Capital outlay .... . ... . ... . ... . ... . ... TOTAL SANITATION 163,785 433,693 64,386 .... 563,960 302,154
HUMAN SERVICES Income Maintenance 1,029,283 1,462,933 1,076,213 5,062,954 1,101,980 671,999 Social Services 2,514,860 2,610,416 1,750,755 15,614,085 2,128,244 1,404, 162 Other Hunan Service Costs Capital outlay
tu TOTAL HUMAN SERVICES 3,544,143 4,073,349 2,826,968 20,677,039 3,230,224 2,076,161 ....J HEALTH - Current Expenditures 184,140 784,457 3n,932 4,759,329 149,697
• Capital outlay .... . ... . ... . ... . ... TOTAL HEALTH 184,140 784,457 3n,932 4,759,329 149,697
CULTURE AND RECREATION Libraries - Current Expenditures 55,000 24,541 139,810 2,688,213 307,679 24,045
• Capital outlay .... . ... . ... 557 . . . . . ... Parks and Recreation - Current Expenditures 55,022 32,854 114,346 691,038 59,178 10,575
- Capital outlay .... . ... . ... 182,240 . . . . . ... TOTAL CULTURE ANO RECREATION 110,022 57,395 254,156 3,562,048 366,857 34,620
CONSERVATION OF NATURAL RESOURCES - Current Exp 279,833 124,442 230,848 446,891 218,083 233,928 • capital outlay .... . ... . ... 25,526 . . . . . ...
TOTAL CONSERVATION OF NATURAL RESOURCES 279,833 124,442 230,848 ,n,411 218,083 233,928 ECONOMIC DEVELOPMENT· Current Expenditures 6,086 .... 29,825 1,027,402 88,778
- capftal outlay .... . ... . ... . ... . ... TOTAL ECONOMIC DEVELOPMENT 6,086 .... 29,825 1,027,402 88,778
ALL OTHER· Current Expenditures 247,458 633,328 155,580 .... 179,206 37,746 - capital outlay .... . . . . . ... . ... . . . . . ...
DEBT SERVICE· Principal Paid on Bonds .... 145,000 505,000 2,665,000 10,000 125,000 - Other Long-tem Debt .... 4,903 50,000 127,492 920 20,377 • Interest and Fiscal Charges 24,475 43,989 285,886 5,044,707 .... 73,732
TOTAL CURRENT EXPENDITURES 8,534,443 8,666,711 8,387,676 62,191,474 7,910,838 5,331,674 TOTAL CAPITAL OUTLAY 1,604,410 1,492,885 2,829,238 25,190,351 1,678,905 1,931,045 TOTAL DEBT SERVICE 24,475 193,892 840,886 7,837,199 10,920 219,109
TOTAL EXPENDITURES 10,163,328 10,353,488 12,057,800 95,219,024 9,600,663 7,481,828 OTHER FINANCING USES
Debt Redeq,tion • Refunded Bonds . . . . . ... .... 1,413,942 Other Financing Uses . . . . . ... . . . . .... . ... 21,274 Transfers to - Enterprise Funds . . . . . ... . . . . .... . ... . ...
- Governmental Funds 794,655 282,111 1,188,228 1,021,681 .... 14,210 TOTAL EXPENDITURES AND OTHER USES 10,957,983 10,635,599 13,246,028 97,654,647 9,600,663 7,517,312

TABLE 2 CLASSIFICATION OF COUNTY REVENUES
FOR THE YEAR ENDED DECEMBER 31, 1992
WINONA WRIGHT YELLOW MEDICINE TOTAL
POPULATION (1992 Estimate) 48,113 70,984 11,589 4,469,450 NET TAXABLE TAX CAPACITY 18,062,178 44,907,595 6,494,920 3,017,444,957 1991 TAX LEVY (Payable In 1992) 6,748,699 13,688,354 2,m,892 989,221,703
GOVERNMENTAL FUNDS REVENUES
PROPERTY TAXES 6,804,m 13,700,307 2,828,653 1,074,371,366
SPECIAL ASSESSMENTS .... 93,490 341,468 16,674,558
LICENSES AND PERMITS 93,026 296,462 11,563 9,846,155
FINES AND FORFEITS 202,969 311,470 .... 18,894,117
INTERGOVERNMENTAL REVENUES
Federal Grants· Narcotics Control 525 44,946 .... .1,276,283 · Highways 18,207 260,403 636,727 27,510,005 • Hunan Services 2,592,417 4,112,257 931,396 272,208,364 • All Other 248,087 59,105 34,400 34,943,167
State Grants - Homestead Credit (HACA) 1,678,250 1,540,890 766,730 145,779,764 ~ - Mobile Home Homestead Credit .... 66,282 3,472 2,159,102 00 - Attached Machinery Aid . . . . .... . ... 1,890,848
- Taconite Homestead Credit .... . . . . . ... 169,170 - Disparity Reduction Aid 82,028 8,526 60,656 14,2n,104 - Highways 2,173,253 3,501,853 2,405,174 262,425,037 · Hunan Services 3,660,323 4,565,858 1,059,233 292,768,303 · Other 408,320 510,461 130,1n 161,744,471
Local Units Grants 19,059 . . . . .... 31,678,020
TOTAL INTERGOVERNMENTAL REVENUES 10,880,469 14,670,581 6,027,965 1,248,830,238
CHARGES FOR SERVICES 1,885,900 3,838,523 489,818 215,064,738
INTEREST EARNINGS 524,667 843,700 305,962 102,324,757
ALL OTHER REVENUES 324,478 622,920 200,489 123,344,na
TOTAL REVENUES 20,716,286 34,3n,4s3 10,205,918 2,809,350,707
OTHER FINANCING SOURCES BORROWING· BONDS ISSUED . . . . 4,365,000 .... 237,105,345
· OTHER LONG-TERM DEBT . . . . . ... .... 7,925,263
OTHER SOURCES . . . . . . . . .... 775,864
OPERATING TRANSFERS IN· ENTERPRISE FUNDS . . . . . . . . .... 1,663,207 · GOVERNMENTAL FUNDS 19,976 613,246 110,508 51,759,937
TOTAL REVENUES AND OTHER SOURCES 20,736,262 39,355,699 10,316,426 3,108,580,323

TABLE 3 CLASSIFICATION OF COUNTY EXPENDITURES
GOVERNMENTAL FUNDS FOR THE YEAR ENDED DECEMBER 31, 1992
WINONA WRIGHT YELLOW MEDICINE TOTAL
EXPENDITURES GENERAL GOVERNMENT· Current Expenditures 2,886,099 4,516,041 755,451 368,259,854
- Capital outlay 176,704 1,491,330 .... 67,025,345 TOTAL GENERAL GOVERNMENT 3,062,803 6,007,371 755,451 435,285,199
PUBLIC SAFETY Sheriff 986,077 3,567,702 303,531 134,431,561 Corrections 1, 174,423 1,669,319 298,321 154,053,375 All Other 42,431 160,791 13,200 66,194,917 capital outlay 133,656 .... . ... 42,027,196
TOTAL PUBLIC SAFETY 2,336,587 5,397,812 615,052 396,707,049 STREETS AND HIGHWAYS
Adninfstratfon 250,938 230,697 147,405 26,406,919 Operation and Maintenance 1,615,779 2,598,346 1,395,466 174,585,252 Capital outlay 1,271,053 3,815,848 2,338,469 278,472,409
TOTAL STREETS AND HIGHWAYS 3,137,770 6,644,891 3,881,340 479,464,580 SANITATION· Current Expenditures .... 480,431 121,524 38,833,875
- capital outlay .... . ... . ... 3,244,260 TOTAL SANITATION .... 480,431 121,524 42,078,135
HUMAN SERVICES Income Maintenance 2,537,886 3,563,787 912,858 361,792,843 Social Services 5,654,875 7,848,192 2,061,838 489,533,373 Other Hunan Service Costs .... . ... . ... 224,651,769 Capital outlay .... . ... . ... 7,704,834
~ TOTAL HUMAN SERVICES 8,192,761 11,411,979 2,974,696 1,083,682,819 \0 HEALTH - Current Expenditures 1,548,196 1,260,774 47,210 106,054,760
- Capital outlay .... . ... . ... 1,244,494 TOTAL HEALTH 1,548,196 1,260,774 47,210 107,299,254
CULTURE AND RECREATION Libraries - Current Expenditures 156,112 625,017 25,204 43,904,214
- Capital outlay .... . ... . ... 12,227,360 Parks and Recreation - Current Expendftures 64,387 548,711 51,792 26,034,480
- Capital outlay 27,077 20,545 .... 4,103,269 TOTAL CULTURE AND RECREATION 247,576 1,194,273 76,996 86,269,323
CONSERVATION OF NATURAL RESOORCES • Current Exp 234,845 392,711 475,721 41,701,441 - Capital outlay .... . ... . ... 545,653
TOTAL CONSERVATION OF NATURAL RESOORCES 234,845 392,711 475,721 42,247,094 ECONOMIC DEVELOPMENT· Current Expenditures 154,989 .... . ... 22,263,271
- capital outlay .... . ... . ... 3,896,390 TOTAL ECONOMIC DEVELOPMENT 154,989 .... . ... 26,159,661
ALL OTHER - Current Expenditures 316,242 333,219 42,889 17,343,543 - Capital outlay .... . ... . ... 424,299
DEBT SERVICE - Principal Paid on Bonds 230,000 500,000 851,000 44,634,407 - Other long-term Debt .... . ... 19,970 19,353,164 - Interest and Fiscal Charges 101,462 1,231,873 278,732 48,924,185
TOTAL CURRENT EXPENDITURES 17,623,279 27,795,738 6,652,410 2,296,045,447 TOTAL CAPITAL OOTLAY 1,608,490 5,327,723 2,338,469 420,915,509 TOTAL DEBT SERVICE 331,462 1,731,873 1,149,702 112,911,756
TOTAL EXPENDITURES 19,563,231 34,855,334 10,140,581 2,829,872,712 OTHER FINANCING USES
Debt Redeq,tion - Refl.l'lded Bonds .... . ... . ... 9,370,516 Other Financing Uses .... . . . . . ... 156,060 Transfers to - Enterprise Fll'lCfs .... . ... 9,135,383
- Governnental Funds 19,976 613,246 110,508 51,759,937 TOTAL EXPENDITURES AND OTHER USES 19,583,207 35,468,580 10,251,089 2,900,294,608
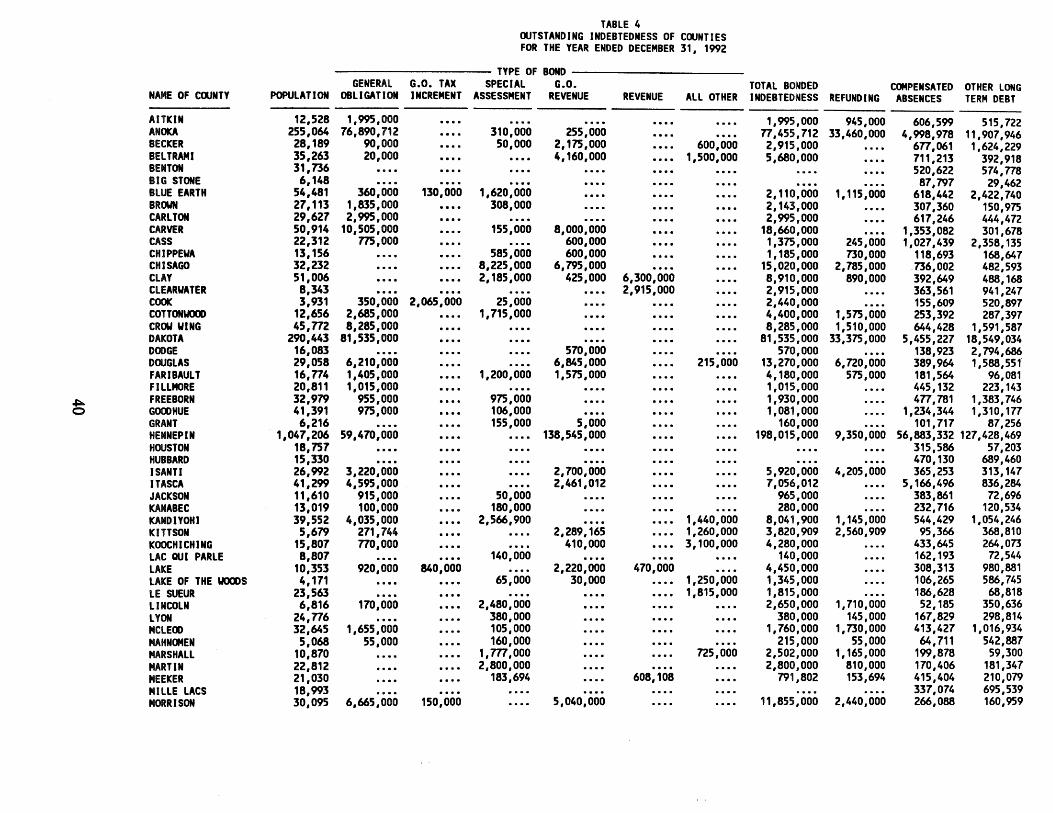
TABLE 4 OUTSTANDING INDEBTEDNESS OF COUNTIES FOR THE YEAR ENDED DECEMBER 31, 1992
TYPE OF BOND GENERAL G.O. TAX SPECIAL G.O. TOTAL BONDED COMPENSATED OTHER LONG
NAME OF COUNTY POPULATION OBLIGATION INCREMENT ASSESSMENT REVENUE REVENUE All OTHER INDEBTEDNESS REFUNDING ABSENCES TERM DEBT -AITKIN 12,528 1,995,000 .... . ... . ... . ... . ... 1,995,000 945,000 606,599 515,722 ANOKA 255,064 76,890,712 .... 310,000 255,000 . ... . ... n,4ss,112 33,460,000 4,998,978 11,907,946 BECKER 28,189 90,000 .... 50,000 2,175,000 . ... 600,000 2,915,000 . ... 6n,061 1,624,229 BELTRAMI 35,263 20,000 .... . ... 4,160,000 . ... 1,500,000 5,680,000 . ... 711,213 392,918 BENTON 31,736 .... . ... . ... . ... . ... . ... . ... . ... 520,622 574,ne BIG STONE 6,148 .... . ... . ... . ... . ... . ... . ... . ... 87,797 29,462 BLUE EARTH 54,481 360,000 130,000 1,620,000 .... . ... . ... 2,110,000 1,115,000 618,442 2,422,740 BROWN 27,113 1,835,000 .... 308,000 . ... . ... . ... 2,143,000 . ... 307,360 150,975 CARLTON 29,627 2,995,000 .... . ... . ... . ... . ... 2,995,000 . ... 617,246 444,472 CARVER 50,914 10,505,000 .... 155,000 8,000,000 . ... . ... 18,660,000 . ... 1,353,082 301,678 CASS 22,312 775,000 .... . ... 600,000 . ... . ... 1,375,000 245,000 1,027,439 2,358,135 CHIPPEWA 13,156 .... . ... 585,000 600,000 . ... . ... 1,185,000 730,000 118,693 168,647 CHISAGO 32,232 .... . ... 8,225,000 6,795,000 . ... . ... 15,020,000 2,785,000 .736,002 482,593 CLAY 51,006 .... . ... 2,185,000 425,000 6,300,000 . ... 8,910,000 890,000 392,649 488,168 CLEARWATER 8,343 . . . . .... . ... . ... 2,915,000 . ... 2,915,000 . ... 363,561 941,247 COOK 3,931 350,000 2,065,000 25,000 .... . ... . ... 2,440,000 . ... 155,609 520,897 COTTONWOOD 12,656 2,685,000 .... 1,715,000 . ... . ... . ... 4,400,000 1,575,000 253,392 287,397 CROii WING ,s,n2 8,285,000 .... . ... . ... . ... . ... 8,285,000 1,510,000 644,428 1,591,587 DAKOTA 290,443 81,535,000 .... . ... . ... . ... . ... 81,535,000 33,375,000 5,455,227 18,549,034 DODGE 16,083 . . . . .... . ... 570,000 . ... . ... 570,000 . ... 138,923 2,794,686 DOUGLAS 29,058 6,210,000 .... . ... 6,845,000 . ... 215,000 13,270,000 6,no,ooo 389,964 1,588,551 FARIBAULT 16,n4 1,405,000 .... 1,200,000 1,575,000 . ... . ... 4,180,000 575,000 181,564 96,081 FILLMORE 20,811 1,015,000 .... . ... . ... . ... . ... 1,015,000 . ... 445,132 223, 143
~ FREEBORN 32,979 955,000 .... 975,000 . ... . ... . ... 1,930,000 . ... 4n,1e1 1,383,746 0 GOODHUE 41,391 975,000 .... 106,000 . ... . ... . ... 1,081,000 . ... 1,234,344 1,310,1n
GRANT 6,216 . . . . .... 155,000 5,000 . ... . ... 160,000 . ... 101,717 87,256 HENNEPIN 1,047,206 59,470,000 .... . . . . 138,545,000 . ... . ... 198,015,000 9,350,000 56,883,332 127,428,469 HOUSTON 18,757 . . . . . ... .... . ... . ... . ... . ... . ... 315,586 57,203 HUBBARD 15,330 . . . . . ... .... . ... . ... . ... . ... . ... 470,130 689,460 ISANTI 26,992 3,220,000 . . . . . . . . 2,700,000 .... . ... 5,920,000 4,205,000 365,253 313,147 ITASCA 41,299 4,595,000 . . . . . ... 2,461,012 .... . ... 7,056,012 . ... 5,166,496 836,284 JACKSON 11,610 915,000 . . . . 50,000 . ... . ... .... 965,000 . ... 383,861 72,696 KANABEC 13,019 100,000 . . . . 180,000 .... . ... . ... 280,000 . ... 232,716 120,534 KANDIYOHI 39,552 4,035,000 . . . . 2,566,900 . . . . .... 1,440,000 8,041,900 1,145,000 544,429 1,054,246 KITTSON 5,679 271,744 . . . . . . . . 2,289,165 .... 1,260,000 3,820,909 2,560,909 95,366 368,810 KOOCHICHING 15,807 no,ooo . . . . . . . . 410,000 . ... 3,100,000 4,280,000 .... 433,645 264,073 LAC QUI PARLE 8,807 . . . . . . . . 140,000 . ... .... . ... 140,000 . ... 162,193 72,544 LAKE 10,353 920,000 840,000 . . . . 2,220,000 470,000 . ... 4,450,000 .... 308,313 980,881 LAKE OF THE woa:>S 4,171 . . . . . . . . 65,000 30,000 .... 1,250,000 1,345,000 . ... 106,265 586,745 LE SUEUR 23,563 . . . . . . . . . . . . . ... .... 1,815,000 1,815,000 . ... 186,628 68,818 LINCOLN 6,816 170,000 . . . . 2,480,000 . . . . .... . ... 2,650,000 1,710,000 52,185 350,636 LYON 24,n6 . . . . . . . . 380,000 . ... .... . ... 380,000 145,000 167,829 298,814 MCLEOD 32,645 1,655,000 . . . . 105,000 . . . . .... . ... 1,760,000 1,730,000 413,427 1,016,934 MAHNOMEN 5,068 55,000 . . . . 160,000 • •• 0 .... . ... 215,000 55,000 64,711 542,887 MARSHALL 10,870 . . . . . . . . 1,m,000 . . . . .... 725,000 2,502,000 1,165,000 199,878 59,300 MARTIN 22,812 . . . . . . . . 2,800,000 . . . . .... . ... 2,800,000 810,000 170,406 181,347 MEEKER 21,030 . . . . . . . . 183,694 . . . . 608,108 .... 791,802 153,694 415,404 210,079 MILLE LACS 18,993 . . . . . . . . . . . . . ... .... . ... . ... . ... 337,074 695,539 MORRISON 30,095 6,665,000 150,000 .... 5,040,000 . ... . ... 11,855,000 2,440,000 266,088 160,959

TABLE 4 OUTSTANDING INDEBTEDNESS OF COONTIES FOR THE YEAR ENDED DECEMBER 31, 1992
TYPE OF BONO GENERAL G.O. TAX SPECIAL G.O. TOTAL BONDED Cc»4PENSATED OTHER LONG NAME OF COONTY POPULATION OBLIGATION INCREMENT ASSESSMENT REVENUE REVENUE All OTHER INDEBTEDNESS REFUNDING ABSENCES TERM DEBT --
MOWER 37,453 .... .... 100,000 . ... . ... . ... 100,000 272,726 159,135 MURRAY 9,597 375,000 645,000 . ... .... . ... . ... . ... 1,020,000 .... 226,088 446,714 NICOLLET 28,697 2,565,000 .... 320,000 . ... . ... . ... 2,885,000 650,000 955,931 76,064
NOBLES 20,140 .... . ... .... . ... . ... . ... .... 257,742 175,159 NORMAN 7,889 .... . ... 2,065,000 . ... .... . ... 2,065,000 480,000 69,021 95,218 OLMSTED 111,081 .... . ... 90,000 69,905,000 21,555,000 .... 91,550,000 37,320,000 1,666,202 1,930,949 OTTER TAIL 51,137 20,000 .... 25,000 6,535,000 . ... 4,225,000 10,805,000 6,535,000 1,660,613 376,260 PENNINGTON 13,252 135,000 .... . ... 590,000 . ... . ... ns,ooo 365,000 89,215 413,708 PINE 21,755 130,000 .... . ... . ... . ... . ... 130,000 130,000 199,372 1,117,662 PIPESTONE 10,440 1,475,000 .... .... .... . ... .... 1,475,000 1,475,000 113,787 574,834 POLK 32,692 .... . ... 1,249,000 3,785,000 . ... 2,650,000 7,684,000 . ... 334,466 301,012 POPE 10,m 1,390,000 .... . ... . ... . ... . ... 1,390,000 635,000 148,784 56,755 RAMSEY 490,258 165,010,066 .... . ... . ... . ... . ... 165,010,066 55,565,000 15,649,520 2,471,459 RED LAKE 4,485 .... . ... 165,000 . ... . ... 2,045,000 2,210,000 120,000 61,964 88,123 REDIIOOO 11,2n .... . ... . ... . ... . ... . ... . ... . ... 351,328 115,712 RENVILLE 17,563 .... .... . ... . ... . ... . ... .... . ... 82,962 80,179 RICE 50,492 475,000 .... . ... 850,000 . ... . ... 1,325,000 . ... 679,048 562,797 ROCk 9,750 ..... . ... . ... . ... . ... . ... . ... . ... 214,915 256,363 ROSEAU 15,295 .... . ... . ... . . . . . ... . ... . ... . ... 314,710 132,286 ST. LOUIS 199,260 .... . . . . .... 8,630,000 . ... .... 8,630,000 3,005,000 7,317,425 17,384,970
.,::.. SCOTT 61,960 11,325,000 .... 145,000 .... . ... . ... 11,470,000 7,170,000 1,651,749 1,221,023 .- SHERBURNE 44,949 470,000 .... .... . ... . ... . ... 470,000 .... 486,905 . ... SIBLEY 14,336 .... .... 740,000 .... . ... . ... 740,000 530,000 341,134 443,878 STEARNS 122,240 12,310,000 .... 1,390,000 36,790,000 .... . ... 50,490,000 42,430,000 2,038,043 3,421,398 STEELE 31,087 .... .... 175,000 585,000 .... . ... 760,000 . ... 198,567 303,655 STEVENS 10,592 .... .... .... 880,000 .... . ... 880,000 . ... 217,371 257,829 SWIFT 10,616 .... .... 1,685,000 870,000 175,000 .... 2,730,000 .... 267,530 222,717 TODD 23,402 1,860,000 .... .... 275,000 . ... . ... 2,135,000 1,185,000 583,857 463,246 TRAVERSE 4,383 .... .... .... . ... .... . ... . ... . ... 160,262 .105, 146 VABASHA 19,990 .... . . . . .... .... .... . ... . ... . ... 417,616 804,489 IIADENA 13,144 595,000 . . . . .... 275,000 .... . ... 870,000 275,000 155,003 118,769 IIASECA 17,990 2,295,000 .... 5,000 .... .... 2,210,000 4,510,000 . ... sn,019 197,286 IIASHINGTON 156,276 50,675,000 1,080,000 1,21~,ooo . . . . .... . ... 58,965,000 23,290,000 1,957,717 35,636,520 VATONVAN 11,643 .... .... .... . ... . ... . ... . ... . ... 370,058 74,589 VILklN 7,449 350,000 . . . . 460,000 . ... .... . ... 810,000 . ... 109,247 87,314 VINONA 48,113 1,580,000 . . . . . ... 970,000 .... . ... 2,550,000 . ... 359,026 102,285 IIRIGHT 70,984 20,915,000
" .... .... 13,850,000 .... . ... 34,765,000 4,365,000 865,261 314,822
YELLOW MEDICINE 11,589 .... . . . . 742,300 . ... .... 2,205,000 2,947,300 85,000 172,762 68,741 -
TOTAL 4,469,450 sss,6n,s22 ,,26s,ooo ,s,112,s94 330,490,177 32,023,108 25,240,000 993,403,701295,004,603131,945,986 258,325,736 - [1) (2)
FOOTNOTE: [1) All OTHER INCLUDES BONDS PAYABLE FROM COUNTY STATE-AID STREET ALLOCATIONS [2) REFUNDING BONDS ARE ALSO CLASSIFIED BY TYPE OF BONO AND INCLUDED IN THE TOTAL BONDED INDEBTEDNESS.

TABLE 5 PUBLIC SERVICE ENTERPRISES
ANALYSIS OF HOSPITAL ENTERPRISE OPERATIONS - 1992
TRANSFERS
NAME OF COONTJ CHIPPEWA
STATEMENT OF INCOME AND EXPENSE TO/-FROM - DEBT SERVICE -FOOT OPERATING - NONOPERATING - NET INCOME PROPERTY FEDERAL STATE OTHER CAPITAL INTEREST PRINCIPAL NOTES POP. REVENUE EXPENSE INCOME REVENUE EXPENSE OR ·LOSS TAXES ~ GRANTS FUNDS OOTLAY BORROWING PAYMENTS PAYMENTS m- 13, 156 4,240,715 4,031,984 208,731 352,977 5,509 556,199 .... . ... . ... . ... 984,780 . ... 42,225 130,000
CLEARWATER 8,343 2,775,831 2,936,691 -160,860 5,503 .... -155,357 . ... . ... . ... . ... 1,812,341 2,915,000 61,286 59,782
COOK (2) 3,931 2,949,851 3,344,166 -394,315 347,709 .... -46,606 300,000 . ... . ... . ... 75,085
DOOGLAS 29,058 25,203,636 24,213,131 990,505 310,692 •••• 1,301,197 . . . . .... . ... . ... 1,848,519 . ... 410,920 1,620,996
GRANT 6,216 1,698,795 1,761,553 -62, 758 14,934 .... -47,824 . . . . . ... . ... . ... 55,624
HENNEPIN 1,047,206 225,146,626 250,888,437 -25,741,811 16,855,647 3,803,86412,690,028 14,234,522 150 2,311,889-4,667,956 7,713,224 •••• 3,673,873 1,293,290
ITASCA 41,299 19,274,649 18,208,219 1,066,430 630,442 •••• 1,696,872 .... .... . ... . ... 1,938, 173 . ... 52,434 290,994
KANABEC 13,019 6,033,079 5,668,462 364,617 188,603 .... 553,220 . . . . It ••• .... 4,379 174,128 . ... 11,291 148,843
MAHNOMEN (1] 5,068 873,436 1,255,022 -381,586 1,748 . . . . -379,838 . . . . . ... .... . ... 67,362 . ... 13,H6 13,509
MEEKER 21,030 s,nt,625 5,554,654 216,971 49,451 .... 266,422 . . . . . ... . ... . ... 1, no,m . ... 52,159 92,420
MURRAY 9,597 2,419,538 2,518,480 -98,942 38,665 . . . . -60,2n . ... . . . . .... . ... 73,632
OLMSTED 111,081 11,006,736 10,810,136 196,600 410,397 490,8n 116,120 . . . . . . . . .... . ... 208,612 . ... 474,082 556,640
PIPESTONE (2) 10,440 5,876,595 5,923,681 -47,086 287,849 . . . . 240,763 192,234 . . . . .... . ... 194,727 1,447,175 118,870 1,544,033
~ RENVILLI: 17,563 2,635,599 2,671,415 -35,816 38,967 . . . . 3,151 . ... . . . . .... . ... 81,244
N SWIFT [1J 10,616 2,748,032 2,687,244 60,788 66,349 1,196 125,941 . . . . . . . . . ... .... 54,199 .... 26,173 91,779
TOTAL 1,347,623 342,473,275 19,599,933 -8,520,045 150 -4,663,Sn 4,362,175 5,842,286 318,654,743 -23,818,532 4,301,446 14,726,756 2,311,889 17,052,429 4,936,789
FOOTNOTE: [1] HOSPITAL IS OPERATED JOINTLY BY A MUNICIPALITY AND THE COONTY. (2) THE NURSING HOME OPERATIONS ARE INCLUDED WITH THE HOSPITAL OPERATIONS.

TABLE 6 PUBLI~ SERVICE ENTERPRISES
ANALYSIS OF NURSING HM ENTERPRISE OPERATIONS - 1992
TRANSFERS STATEMENJ OF INCM AND EXPE TOI-FROM - OEBl SERVICE -NAME OF roo, OPERAJING - NONOPERATING - NET INCOME PROPEUY FEDERAL SJATE OTHER CAPITAL llllERESl PRINCIPAL COUNTY NOJES POPULAJION REVENUe EXPENSI INCtJff: REVENUE EXPENSE OR ·LOSS TAXES GRANTS GRANTS FUNDS OlJllAY IORROIIINO PAYMENTS PAYHENJS BECKER itt 28,189 1,574,661 1,544,414 30,253 4,050 ts,651 20,652 .... . ... . ... . ... 1,420 •••• 13,651 30,000
IEURAMI 35,261 J,746,MJ J,934,231 ·188, 188 14,506 104,711 ·278,395 6 .... . ... . ... 922,106 98,500 104,713 38,228
COOIC (2) 3,911 .... .... .... . ... . ... . ... . . ... .... . ... . ... . ... . ... . ... . ... DODGE 16,083 2,120,711 2,120,638 7J 20,698 21,900 -1, 129 .... . ... . ... . ... 36,962 . ... 20,432 55,000
IIUIIAltD m 15,330 2,627,088 2,640,187 •13,099 1,882 605 -11,822 .... . ... . ... . ... 65,134 . ... 605 4,659
ITASCA m 41,299 1,974,454 1,966,625 7,829 14,483 .... 22,312 . ... 1,359 . ... •••• 1,309,378 2,459,680
LAKE t1J 10,351 1,n2,,2a 1,711,194 8,714 10J,47J 71,138 40,869 41,266 .... .... . ... 16,711 . ... 70,683 90,000
MAHNOMEN (3) 5,068 1,184,381 1,058,106 126,275 .... .... 126,275
PENNINGJON m 13,252 1,945,513 1,949,394 -J,881 95,402 13,131 77,683 81,388 .... .... . ... 38,684 . ... 13,838 75,000
PIPElfONE (2) 10,UO
RAMSEY 490,258 6,651,559 6,988,304 ·336,745 .... J0,794 -367,539 .... .... . ... ·391,766 74,044 . ... 28,050 233,750
ST. LOUIi 199,260 11,e,1,n9 19,036,98Z -t,139,254 2,!48,145 203,468 1,206,123 2,54],]88 .... .... . ... 164,393 .... 186,291 1,090,000
e STEELE J1 ,087 J, 146,425 J,ooe,no 137,705 38,127 31,353 138,479 .... .... . ... . ... 280,535 207,690 37,353 160,000
lODD·VADENA m tl, 144 2,762,766 2,961,630 •198,864 29,207 20,802 ·190,459 .... .... . ... .... 34,765 . ... 20,802 50,000
JltAVERSE 4,383 t,594,858 t,552, 199 42,659 2,806 .... 45,465 .... . ... .... .... 46,767 -- --- --TOfAl 917,340 50,475,324 2,871,479 828,514 1,359 ·391,766 2,765,870 1,826,637
48,941,121 -1,526,50] 518,462 2,668,048 0 3,020,899 496,418 - -FOOTNOTEI (1J OPEltAllONS ARE FOlt fHE FISCAL YEAR END SEPlEMBER 30.
(2J THE NUllSINO NOME OPERATIONS ARE INCLUDED VITN JHE MOSPITAl OPERAJIONS. (3J NURSING 1tOHE II OPERAJED JOINTLY IY A HUNICIPALIJY AND THE COUNTY.
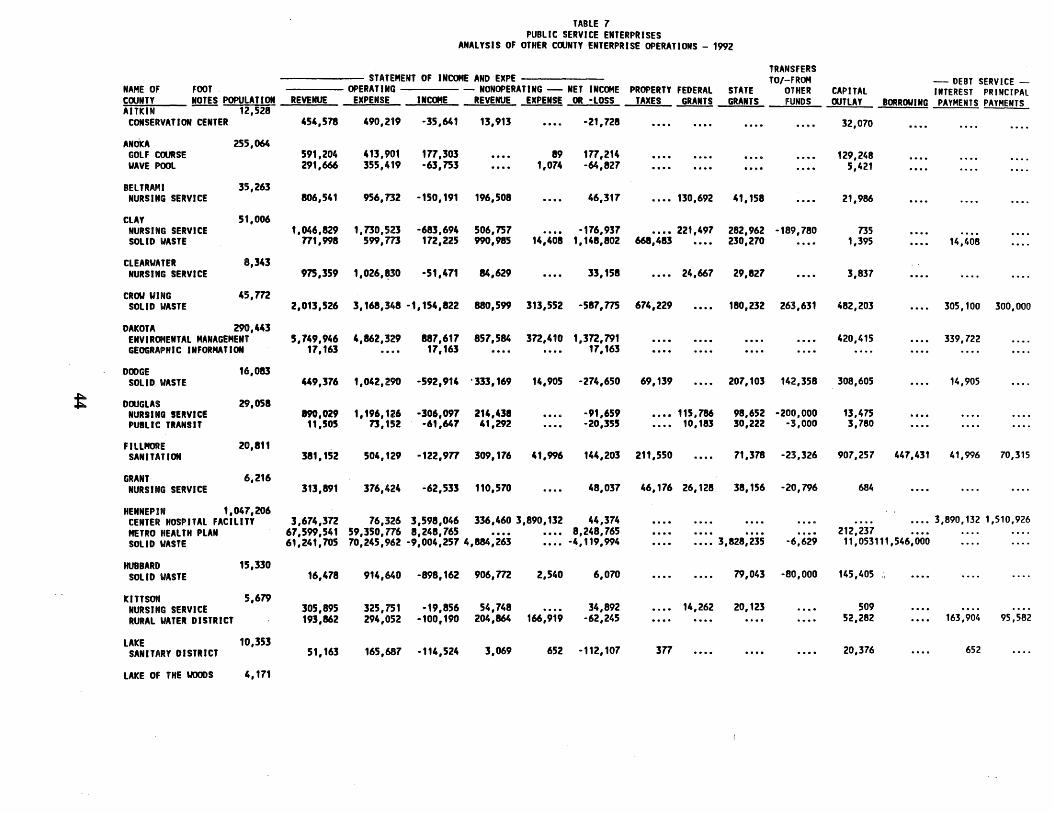
TABLE 7 PUBLIC SERVICE ENTERPRISES
ANALYSIS OF OTHER COONTY ENTERPRISE OPERATIONS - 1992
TRANSFERS STATEMENT OF INCOME ANO EXPE TO/-FROM - DEBT SERVICE -
NAME OF FOOT OPERATING - NONOPERATING - NET INCOME PROPERTY FEDERAL STATE OTHER CAPITAL INTEREST PRINCIPAL COONTY NOTES POPULATION REVENUE EXPENSE INCOME REVENUE EXPENSE OR ·LOSS TAXES ...§!MU! GRANTS FUNDS OOTLAY BORROWING _PAYMENTS PAYMENTS AITKIN 12,528
CONSERVATION CENTER 454,578 490,219 ·35,641 13,913 .... -21,n8 . ... . ... . ... . ... 32,070
ANOKA 255,064 GOLF COORSE 591,204 413,901 177,303 .... 89 177,214 . ... . ... . ... . ... 129,248 WAVE POOL 291,666 355,419 ·63,753 .... 1,074 -64,827 . ... . ... . ... . ... 5,421
BELTRAMI 35,263 NURSING SERVICE 806,541 956,732 ·150,191 196,508 .... 46,317 •••• 130,692 41,158 . ... 21,986
CLAY 51,006 NURSING SERVICE 1,046,829 1,730,523 ·683,694 506,757 ·176,937 •••• 221,497 282,962 ·189,780 735 SOLID WASTE 771,998 599,m 172,225 990,985 14,408 1,148,802 668,483 .... 230,270 . ... 1,395 . ... 14,408
CLEARWATER 8,343 NURSING SERVICE 975,359 1,026,~0 ·51,471 84,629 .... 33,158 . ... 24,667 29,827 . ... 3,837
CROW WING 45,m SOLID WASTE 2,013,526 3,168,348 ·1,154,822 880,599 313,552 ·587,775 674,229 .... 180,232 263,631 482,203 . ... 305,100 300,000
DAKOTA 290,443 ENVIROMENTAL MANAGEMENT 5,749,946 4,862,329 887,617 857,584 3n,410 1,3n, 791 .... . ... . ... . ... 420,415 . ... 339,722 GEOGRAPHIC INFORMATION 17, 163 . . . . 17, 163 .... . ... 17, 163
DODGE 16,083 SOLID WASTE 449,376 1,042,290 ·592,914 '333,169 14,905 -274,650 69,139 .... 207,103 142,358 308,605 . ... 14,905
t DOOGLAS 29,058 NURSING SERVICE 890,029 1,196,126 ·306,097 214,438 .... -91,659 •••• 115,786 98,652 -200,000 13,475 PUBLIC TRANSIT 11,505 73,152 ·61,647 41,292 .... -20,355 .... 10,183 30,222 -3,000 3,780
FILLMORE 20,811 SANITATION 381,152 504,129 ·122,977 309,176 41,996 144,203 211,550 .... 71,378 -23,326 907,257 447,431 41,996 70,315
GRANT 6,216 NURSING SERVICE 313,891 376,424 -62,533 110,570 .... 48,037 46,176 26,128 38,156 -20,796 684
HENNEPIN 1,047,206 CENTER HOSPITAL FACILITY 3,674,372 76,326 3,598,046 336,460 3,890,132 44,374 .... .... . ... . . . . . ... •••• 3,890,132 1,510,926 METRO HEALTH PLAN 67,599,541 59,350,776 8,248,765 8,248,765 .... . . . . . ... 212,237 SOLID WASTE 61,241,705 70,245,962 -9,004,257 4,884,263 •••• -4,119,994 .... • ••• 3,828,235 -6,629 11,053111,546,000
HUBBARD 15,330 SOLID WASTE 16,478 914,640 -898,162 906,m 2,540 6,070 .... . ... 79,043 -80,000 145,405
KITTSON 5,679 NURSING SERVICE 305,895 325,751 -19,856 54,748 . . . . 34,892 .... 14,262 20,123 . ... 509 RURAL WATER DISTRICT 193,862 294,052 ·100,190 204,864 166,919 -62,245 .... . ... . . . . . ... 52,282 . ... 163,904 95,582
LAKE 10,353 SANITARY DISTRICT 51, 163 165,687 -114,524 3,069 652 ·112, 107 377 .... . . . . . ... 20,376 . ... 652
LAKE OF THE WOODS 4,171

TABLE 7 PUBLIC SERVICE ENTERPRISES
ANALYSIS OF OVHER COUNTY ENTERPRISE OPERATIONS - 1992
TRANSFERS STATEMENT OF INCOME AND EXPE TO/-FROH NAME OF FOOT OPERATING - NONOPERATING - NET INCOME PROPERTY FEDERAL - DEBT SERVICE -STATE OTHER CAPITAL INTEREST PRINCIPAL COONTY NOTES POPULATION REVENUE EXPENSE INCM REVENUE EXPENSE OR ·LOSS TAXES GRANTS GRANTS FUNDS OOTlAY IIORROIIING PAYMENTS PAYME_NlS lAkE OF THE \ims 4,111
AMIUlANCE 56,881 70,144 ·1J,26J 42,020 .... 21,757 1,090 . ... . ... . ... 46,439 HEDICAl CllNIC 33,599 36,003 ·2,404 18,941 J,249 1J,Z88 475 .... . ... . ... 16,152 . ... 3,249 30,000 MAHNOMU 5,068 CllNIC 259,904 403,499 ·14],595 .... . ... -10,595 . ... . ... ••a II .... . ... . ... 535
HARSHAll 10,870 H·k RECOVERY CENTER 3',358 30,889 4,469 .... 3,400 1,069
OlMSTEO 111,081 CAMPUS 1,052,017 1,077,210 ·25, 193 420,417 482,422 ·87,191 .... . ... .... -10, 161 13,471 •••• 482,422 532,394 VASfE MANAGEMENT 1,462,686 6,159,499 1,603,117 J,814,'65 4,060,615 1,357,237 179,543 .... !562,789 -e,soo ,,,a4,4a1 1a,,a1,1e2 4,o43,1as11,21,,922
OTJEI lAll 51,137 VASTE MANAGEMENT 4,098,985 J,643,300 455,685 3,465 717 458,433 .... . ... . ... 24,709 164,406.
POlk 32,692 NURSING SERVICE 594,987 981 ,6]2 ·]86,645 306,4U J,774 -83,972 88,272 175,552 27,082 -91,665 2,808 VASTE MANAGEMENT 1,522,567 1,934,082 ·411,515 1,062,188 294,357 . 356,316 949,777 .... 65,924 55,542 451,256 . ... 286,387 255,000
RAMSEY 490,258 lAICE OIIASSO RESIDENCE J,462,432 3,696,989 ·234,557 .... 6,056 •240,613 . ... . ... . ... ·230,599 28,309
~ ltEDVOCX, 17,272 NUIISIN~ IHVIC! :su,u, 762,426 ·419,002 439,737 1,382 19,353 229,218 73,057 137,150 .... 1,213
RICE 50,4921
VAITE MANAGEMENT 2,001,179 t,656,731 3'4,'48 262,455 54,146 552,757 .... . ... 259,768 ·31,326 31,381 . ... 54, g6
ltOCIC 9,750 RUltAl VATER DISTRICT 209,566 261,735 ·52, 169 127,420 65,911 9,340 .... .... . ... . ... 22,547 . ... 65,911 1,318,224
ST. lOOIS 199,260 SOllD VASTE 4,201,370 4,173,935 27,435 1,m,,16 370,743 1,434,108 653,427 •••• 1,001,281 442,998 606,822 .... 365,005 280,000
SfEElE Jl,087 CIVIC CENTER 1'2,769 127,205 15,564 704 .... 16,268
SfEVENS 10,592 AHIUlANCE 172,289 225,791 ·53,502 11,000 .... ·42,502 .... . ... 11,000 -38,435 6,032 DAfA PROCESSING 393,288 349,668 JJ,620 .... 7,438 26,182 . ... .... .... .... 2,304 . ... 5,523 18,647 NURSING SERVICE 743,321 1,050,382 •307,061 148,782 .... ·158,279 .... n,692 53,346 -81,811 2,887
TODD 23,402· SOI.ID IIASTE 285,2'5 470,346 ·185, 131 360,277 .... 175,146 .... . ... 104,866 . ... 47,594
I •I
VASECA 17,990 84,208 108,236 11,378 64,253 9,614 SOI.ID IIASTE 384,534 360,506 24,028 .... . ... . ...
VllKIN 7,449 23,120 88,512 58,236 60,926 5,227 NURSING SERVICE 191,556 376,550 -184,994 208,114 .... ....
VINONA 48,113

TABLE 7 PUBLIC SERVICE ENTERPRISES
ANALYSIS OF OTHER CClJNTY ENTERPRISE OPERATIONS - 1992
TRANSFERS STATEMENT OF INCOME AND EXPE TO/-FROM - DEBT SERVICE -
NAME OF FOOT OPERATING - NONOPERATING - NET INCOME PROPERTY FEDERAL STATE OTHER CAPITAL INTEREST PRINCIPAL CClJNTY !!2!ll POPULATION REVENUE EXPENSE INCOME REVENUE EXPENSE OR -LOSS TAXES -9!lli! GRANTS FUNDS ClJTLAY BORROUING PAYMENTS PAYMENTS WINONA 48,113
SOLID WASTE 1,299,036 1,010,305 288,731 334,599 64,530 558,800 45 7,025 166,796 .... 345,708 . ... 64,530 910,000
WRIGHT 70,984 SOLID VASTE 1,732,516 1,590,718 141,798 58,698 501,131 -300,635 .... . ... .... . ... 1,101,281 . ... 487,280 13,160
--- --TOTAL 3,040,823 179,318,934 20,411,349 9,871,125 929,777 -86, 790 130,375,213 38,609,170
179,517,258 198,324 10,738,548 4,571,691 7,652,542 9,662,972 10,628,992
~

DEFINITION OF TERMS BORROWING - Includes the sale of bonds and notes, certificates of indebtedness, and tax anticipation certificates. Counties are restricted by law from borrowing for current expense.
CAPITAL OUTLAY - The purchase or construction of buildings, permanent improvements, equipment, machinery and land. Capital outlay varies from year to year based on the needs and resources of the counties.
CAPITAL PROJECTS FUND - A fund created to account for the financial resources that are used for the acquisition or construction of a fixed asset. An example of this fund type is a highway improvement fund.
CHARGES FOR SERVICES - Fees for activities of the governmental funds. These include rent of government buildings by individuals or organizations, road and bridge services, recreation fees, park fees, etc.
CONSERVATION OF NATURAL RESOURCES -Activities designed to conserve and develop such natural resources as water, soil, forests and minerals
CURRENT EXPENDITURES - Expenditures which benefit the current fiscal period. Expenditures included in this definition are salaries, pension contributions, operating expenses, etc.
DEBT SERVICE FUNDS - A fund to account for the collection of resources and payment of long-term debt principal and interest. An example of this fund type is the 1991 improvement bond.
ECONOMIC DEVELOPMENT - Expenditures associated with planning and providing adequate housing and redevelopment of substandard physical facilities. Expenditures directed toward developing an area or providing assistance and opportunity to persons and business for such development.
ENTERPRISE FUNDS - A fund established to account for operations financed and operated in a manner similar to private business, e.g., hospitals and nursing homes. The expenses of providing services are primarily financed by user charges.
FINES AND FORFEITS - Receipts from the payment of penalties for law violations, non-obseivance of contracts and forfeited deposits.
GENERAL FUND - The fund used to account for all financial resources not required to be accounted for in another fund. This fund is the main operating fund.
GENERAL GOVERNMENT - Expenditures related to the administration of the governmental unit.
47
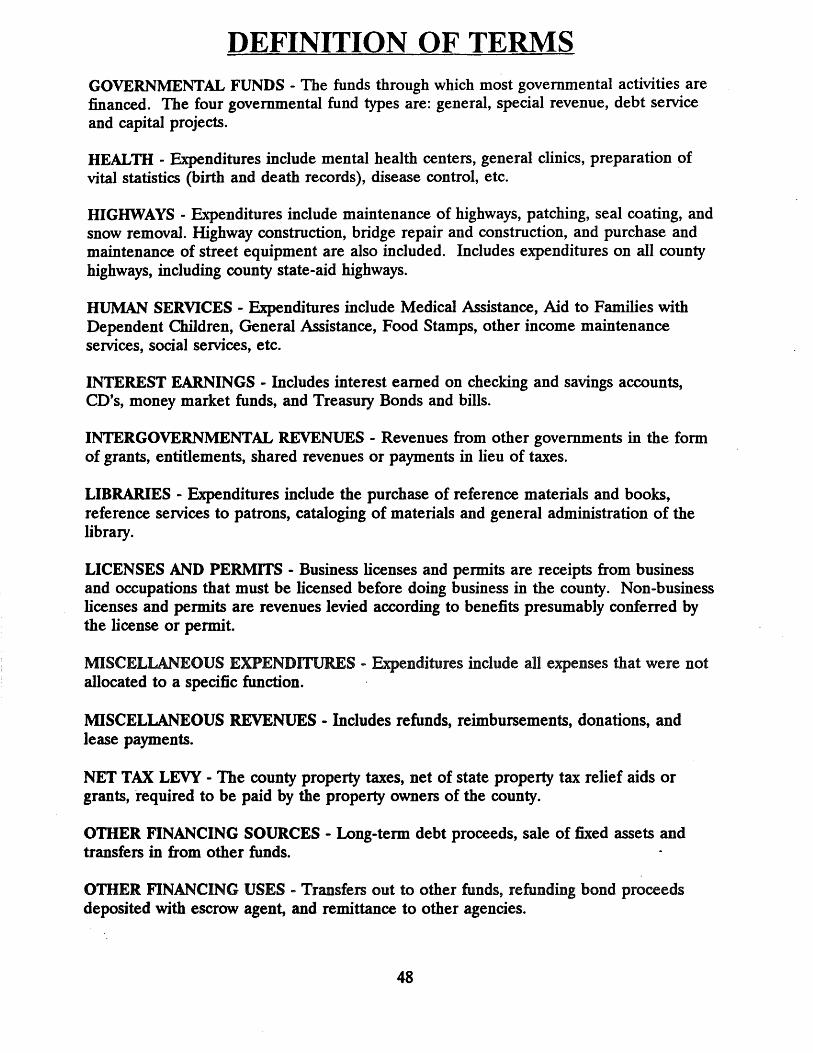
DEFINITION OF TERMS GOVERNMENTAL FUNDS - The funds through which most governmental activities are financed. The four governmental fund types are: general, special revenue, debt service and capital projects.
HEAL TH - Expenditures include mental health centers, general clinics, preparation of vital statistics (birth and death records), disease control, etc.
HIGHWAYS - Expenditures include maintenance of highways, patching, seal coating, and snow removal. Highway construction, bridge repair and construction, and purchase and maintenance of street equipment are also included. Includes expenditures on all county highways, including county state-aid highways.
HUMAN SERVICES - Expenditures include Medical Assistance, Aid to Families with Dependent Children, General Assistance, Food Stamps, other income maintenance services, social services, etc.
INTEREST EARNINGS - Includes interest earned on checking and savings accounts, CD's, money market funds, and Treasury Bonds and bills.
INTERGOVERNMENTAL REVENUES - Revenues from other governments in the form of grants, entitlements, shared revenues or payments in lieu of taxes.
LIBRARIES - Expenditures include the purchase of reference materials and books, reference services to patrons, cataloging of materials and general administration of the library.
LICENSES AND PERMITS - Business licenses and permits are receipts from business and occupations that must be licensed before doing business in the county. Non-business licenses and permits are revenues levied according to benefits presumably conferred by the license or permit.
MISCELLANEOUS EXPENDITURES - Expenditures include all expenses that were not allocated to a specific function.
MISCELLANEOUS REVENUES - Includes refunds, reimbursements, donations, and lease payments.
NET TAX LEVY - The county property taxes, net of state property tax relief aids or grants, required to be paid by the property owners of the county.
OTHER FINANCING SOURCES - Long-term debt proceeds, sale of fixed assets and transfers in from other funds.
OTHER FINANCING USES - Transfers out to other funds, refunding bond proceeds deposited with escrow agent, and remittance to other agencies.
48

DEFINITION OF TERMS PARKS AND RECREATION - Expenditures for park maintenance, mowing, planting and removal of trees. Recreation expenditures include festivals, bands, museums, community centers, cable TV, baseball fields, organized recreation activities, etc.
PUBLIC SAFE1Y - Expenditures for the sheriff, corrections, traffic safety, building inspections, civil defense, etc.
SANITATION - Expenditures include refuse collection and disposal, recycling, street cleaning, and weed and pest control.
SPECIAL ASSESSMENTS - A levy made against certain properties to defray all or part of the costs of a specific improvement, such as new sewer and water mains, deemed to benefit primarily those properties. The amount includes the penalties and interest paid on the assessments.
SPECIAL REVENUE FUNDS - A fund used to account for the proceeds of specific revenue sources that are restricted to expenditures for a specific purpose.
TAXABLE TAX CAPACI'IY - The tax capacity less the tax increment district value, less the fiscal disparities contribution value plus the fiscal disparities distribution value.
TAX CAPACI'IY - The value assigned to the property used to calculate the property taxes.
TAXES - Revenues include property taxes, penalties and interest on delinquent property taxes, fiscal disparities, forfeited tax sales, gravel taxes, and tax increment taxes if not shown separately.
TAX INCREMENTS - Taxes collected on tax-increment financing projects. Taxincrement financing is a tool which counties use to redevelop a portion of the county. The increase in taxes on the redeveloped area is used to cover the county costs associated with the project.
TOTAL EXPENDITURES - Includes current operating expenses, capital outlays and debt service principal and interest payments.
TOT AL REVENUES - Receipt of monies that increases the amount of available resources without creating a liability or a future payment. Borrowing and transfers between funds are not included in total revenues.
TRANSFERS - ENTERPRISE FUNDS - The transfer of available resources to or from public service enterprises. It is shown separately because enterprise funds is not included in the governmental funds.
TRANSFERS - GOVERNMENTAL FUNDS - The transfer of money between governmental fund types. The revenues and expenditures for these funds are always shown in the 'same tables.
49
RECENT REPORTS FROM THE OFFICE OF THE STATE AUDITOR RESEARCH AND INFORMATION DIVISION
• A Guide to City and County Fund Balances This annual report provides an overview of Minnesota cities' and counties' fund balances. It defines "fund balance" and identifies fund-balance trends. April 1994
• 1993 Criminal Forfeitures in the State of Minnesota This annual report describes the amount of property and cash seized by law enforcement agents in 1993 criminal forfeitures and what happens to the forfeited items. April 1994
• Securing Minnesota's Financial Future: Property Tax Reform in the 1990s This draft report analyzes Minnesota's property-tax and fiscal systems. It examines homeowner taxes, the distribution of tax base and state aid to local governments. February 1994
• Revenues, Expenditures and Debt of Minnesota Cities December 31, 1992 This annual report lists the sources and amounts of revenues, expenditures and outstanding debt for Minnesota cities during the most recent year. It is divided into one report for cities over 2,500 population and a second for cities under 2,500. It also examines enterprise operations. Feb. 1994
• An Analysis of Minnesota's Municipal Liquor Store Operations in 1992 This annual report details the sales and profits of Minnesota's 273 municipally-owned and operated liquor stores. December 14, 1993
• What is Minnesota Getting for Its Tax Dollars? Streets and Highways This report, one in a series on how Minnesota spends public dollars, examines what the state is getting for its above-average spending on roads. It compar~ Minnesota's highway expenditures, as well as the size, condition and performance of the road system, with other states. July 1, 1993
• 1992 Local _Government Lobbying Expenditures This annual report lists what local governments spend to lobby the Legislature and others. May 5, 1993
• Case Studies of Qty Spending: Explaining Differences in Per Capita Qty Expenditures This study explains how some cities operate with much lower expenditures per capita than similar cities. It is based on in-depth interviews with 19 Minnesota cities. April 30, 1993
• What is Minnesota Getting for Its Tax Dollars? Public Assistance Programs This report, one in a series on how Minnesota spends public dollars, examines what the state is getting for its above-average spending on health care programs, such .as Medicaid, and income maintenance programs such as Aid to Families with Dependent Children. April 22, 1993
• Revenues, Expenditures and Debt of the Towns in Minnesota February 29, 1992 This annual report lists the sources and amounts of revenues, expenditures and outstanding debt for Minnesota towns for the most recent fiscal year. April 15, 1993
• How is Minnesota Spending Its Tax Dollars? Elementary and Secondary Education This report, one in a series on how the state and local governments spend public dollars, examines spending for elementary and secondary education. It compares Minnesota's educational spending, as well as the results of that spending, with other states. January 21, 1993
. If you would like to receive one of these recent reports or others published by the Office of the State Auditor please call 612/296-7001.