Embed Size (px)
Citation preview

8/14/2019 Review Article 2.docx
http://slidepdf.com/reader/full/review-article-2docx 1/12
Review Article
The role of Flow Cytometry in the diagnosis of Acute Myeloid Leukaemias
Mervyn Monaheng 212131052
Department of Biomedical Sciences, Cape Peninsula University of Technology
October, 2013
8/14/2019 Review Article 2.docx
http://slidepdf.com/reader/full/review-article-2docx 2/12
Abstract
The role of Flow Cytometry in the diagnosis of Acute Myeloid Leukaemias is
presented herein. The goal here is to review the use of Immunophenotyping by flow
cytometry in the diagnosis of major haematological disorders falling under Acute
Myeloid Leukaemias with minimal consideration of their subgroups, The discussion
will focus not only on the use of flow cytometry in the differential diagnosis of a
particular disorder, but also link immunophenotypic, molecular, and cytogenetic data
in the description of important subgroups. Information regarding technical aspects of
instrumentation, normal distribution of surface antigens, and intense methodologies
are not extensively discussed.
Flow cytometry is most often used in the clinical laboratory for the purpose of
Immunophenotyping (i.e. using a rather small panel of monoclonal antibodies, which
detect lineage-specific antigens expressed on cells). This immunological
characterization by flow cytometry is routinely used to distinguish between AML and
acute lymphoblastic leukaemia (ALL). The markers used in the immunophenotypical
analysis of AML are the following, CD13, CD15, CD33, CD34, CD36, CD41, CD65,
CD11c (myeloid lineage), cytoplasmic CD3, CD11b, CD13c, CD14, cytoplasmic
CD22, MPO, TdTc, CD4, CD5, CD38, CD56, cytoCD79a, CD117, HLA-DR (not
lineage specific). Expression of each this markers is characterized by the percentage
of cells expressing this marker with the fluorescence level exceeding a background
threshold, determined with an isotype control. Basically Flow cytometry is used to
characterize leukemic blast cells.

8/14/2019 Review Article 2.docx
http://slidepdf.com/reader/full/review-article-2docx 3/12
Introduction
Hematologic malignancies (HM) are a group of neoplasms that arise through
malignant transformation of cells derived from the bone marrow. There is great
variety in this group of disorders and this reflect how complex normal hemopoiesis
can be. These malignancies are clonal disorders of hemopoietic stem cells whereby
an abnormal clone of cells multiplies autonomously, overwhelming the normal
process of hemopoiesis, and then resulting in tissues and organs infiltration, thereby
disturbing their normal physiological activities. The essential defect is believed to be
due to a genetic abnormality at the level of the hemopoietic stem cell. (Olaniyi, 2011)
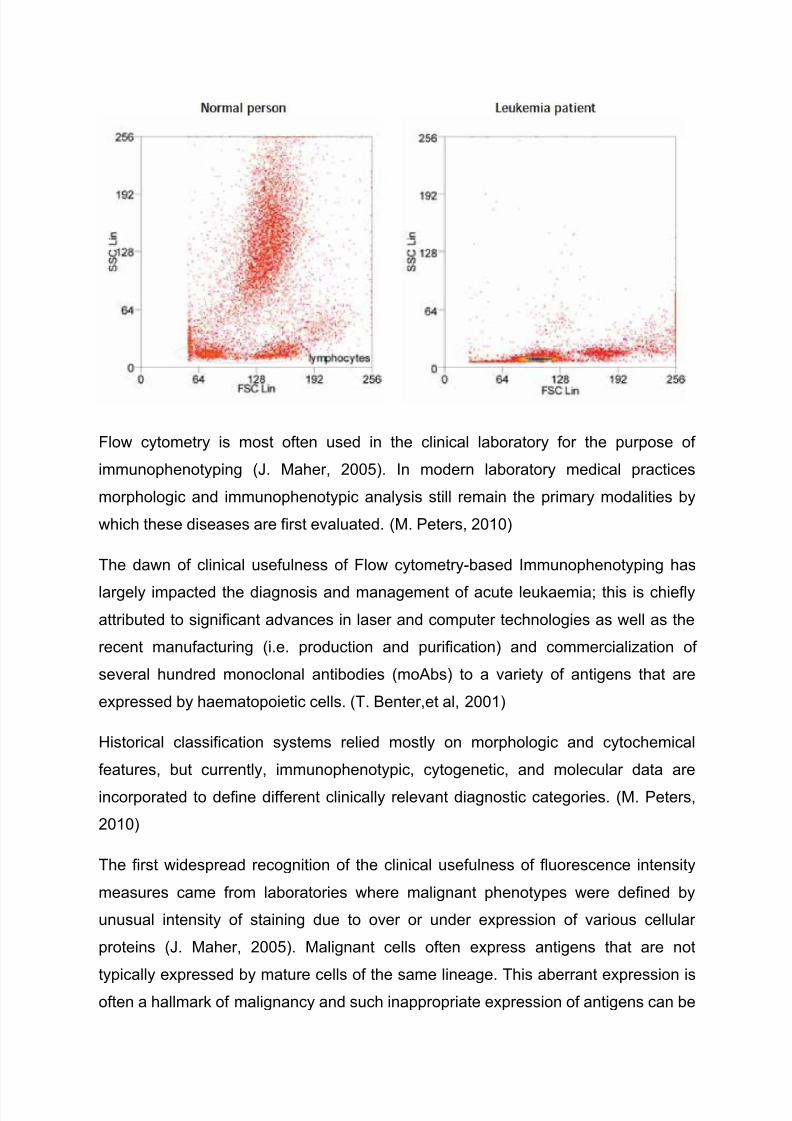
All normal cells express a variety of cell surface markers, depending on the specific
type of cell and its degree of maturation. However, abnormal growth such as seen in
haematological malignancies may interfere with the natural expression of these
markers resulting in overexpression of some and under-expression of others. Flow
cytometry can be used to immunophenotype cells and thereby distinguish between
healthy and diseased cells. It is not surprising that today immunophenotyping is one
of the major clinical applications of flow cytometry, and is essentially used to aid the
diagnosis of myelomas, lymphomas and Leukaemias. It can also be used to monitor
the effectiveness of clinical treatments. The differences between the blood profiles of
a healthy individual and one suffering from leukemia, for instance, are very dramatic.
This can be seen from the Forward Scatter (FSC) v Side Scatter (SSC) plots in
Figure 1. In the healthy person the cell types are clearly defined, whereas blood from
a leukaemia patient is abnormal and does not follow the ordinary profile.
8/14/2019 Review Article 2.docx
http://slidepdf.com/reader/full/review-article-2docx 4/12
8/14/2019 Review Article 2.docx
http://slidepdf.com/reader/full/review-article-2docx 5/12
8/14/2019 Review Article 2.docx
http://slidepdf.com/reader/full/review-article-2docx 6/12
The recent WHO classification of AML has placed emphasis on morphological,
immunophenotypic and molecular features, As such, AML is now also classified
according to specific recurrent cytogenetic abnormalities, and these are often directly
associated with specific immunophenotypic profiles, in other words
Immunophenotypic data also correlates reasonably well with the new WHO
classification. In cases of AML, where such genetic abnormalities are not evident,
these are described according to their degree of differentiation and/or differentiation
along monocytic, megakaryocytic or erythroid lineages. As such, the
immunophenotype is indispensable in characterization of the leukaemic cells in the
same way as its utilization in the FAB system. (Ian Chant, 2005)
Despite the fact that no single marker alone allows accurate lineage assignment,
analysis with panels of antibodies allows division of hematologic tumors into various,
very detailed subtypes. (Gorczyca, 2008)
Immunophenotyping by flow cytomctry has been instrumental in recognizing
minimally differentiated AML (AML-MO), acute megakaryoblastic leukaemia (AML-
M7), and AML co-expressing lymphoid-ussociated antigens.It has also been
particularly helpful in distinguishing AML with monocytic differentiation from AML-
MO/M1 or AML subtypes with granulocytic differentiation (i.e. AML-M2/M3) (T.
Benter et al, 2001)
Thanks be to Multiparameter (four- or six-color) flow cytometry analysis which allows
simultaneous evaluation of several markers on a single cell, facilitating accurate
characterization of the analyzed populations (Gorczyca, 2008) for determining the
blast lineage as well as for detecting aberrant antigenic profiles that may prove
useful for disease monitoring, (M. Peters, 2010). This technology provides quick and
detailed determination of antigen expression profiles in acute Leukaemias which, in
union with morphologic assessment, often suggests a conclusive diagnosis or
narrow differential diagnosis.
Now, at least four to six cellular antigens can be measured simultaneously in
combination with two intrinsic parameters, such as cytoplasmic complexity and cell
size by leukaemic blast light scatter properties (i.e. forward and side scatter
characteristics, FSC and SSC) Immunophenotyping by multiparameter flowcytometry has emerged as the best method for immunodiagnosis of haematopoietic
8/14/2019 Review Article 2.docx
http://slidepdf.com/reader/full/review-article-2docx 7/12
malignancies, largely replacing immunocytochemical microscopic analysis.
(T.Benter, 2001)
Methodology
Flow cytometry analysis requires fresh (unfixed) material. Types of specimen
suitable for flow cytometry include blood, bone marrow aspirates (and fresh core
biopsy), fresh tissue samples (excisional or core biopsies), fine needle aspirates, and
body fluids, (Gorczyca, 2008) although in general, the best results are achieved with
fluid-based specimens. (M. Peters, 2010) In the flow cytometry protocol, the sample
containing leukocyte population suspended in cell culture medium is incubated with
antibodies conjugated to a variety of fluorochromes, preceded by red blood cell lysis with ammonium chloride, washing, fixation in paraformaldehyde, and flow cytometry
analysis. Whole blood lysis is the most commonly used technique for sample
preparation. (Gorczyca, 2008)
Finally, the samples are scanned by the flow cytometry instrument, and the resultant
data histograms saved for evaluation. (M. Peters, 2010)
Monoclonal antibodies used in flow cytometry are conjugated with fluorochromes,
which are excited or stimulated by laser(s). The commonest fluorochromes excited at
488 nm (argon laser) include fluorescein isothiocyanate (FITC), phycoerythrin (PE),
propidium iodide (PI), 7-amino-actinomcyin D (7-AAD), peridin-chlorophyll-A-protein
(PerCP), and dimers of thiazole orange (TOT-1).
fluorescently labeled antibodies are bound to cell surface receptors, and their
presence on the cell is most often defined in bivariate terms of positive or negative,
with a cutoff set relative to a nonstaining control population
Immunologists from the far corners of the world who have produced monoclonal
antibodies directed to surface molecules on cells, these are usually functional
molecules reflecting the state of cellular differentiation. Every so often they meet to
compare the specificities of their reagents in international workshops, these has
resulted in discovery of a cluster of monoclonals are found to react with the same
polypeptide, they clearly represent a series of reagents defining a given marker and
they label it with a CD (cluster of differentiation) number. Up to date there are nowover 250 CD specificities assigned, With the impressive number of monoclonal
8/14/2019 Review Article 2.docx
http://slidepdf.com/reader/full/review-article-2docx 8/12
antibodies to hand, highly detailed phenotypic analysis of single-cell populations is
now a practical proposition.( A. Rabson, 2005)
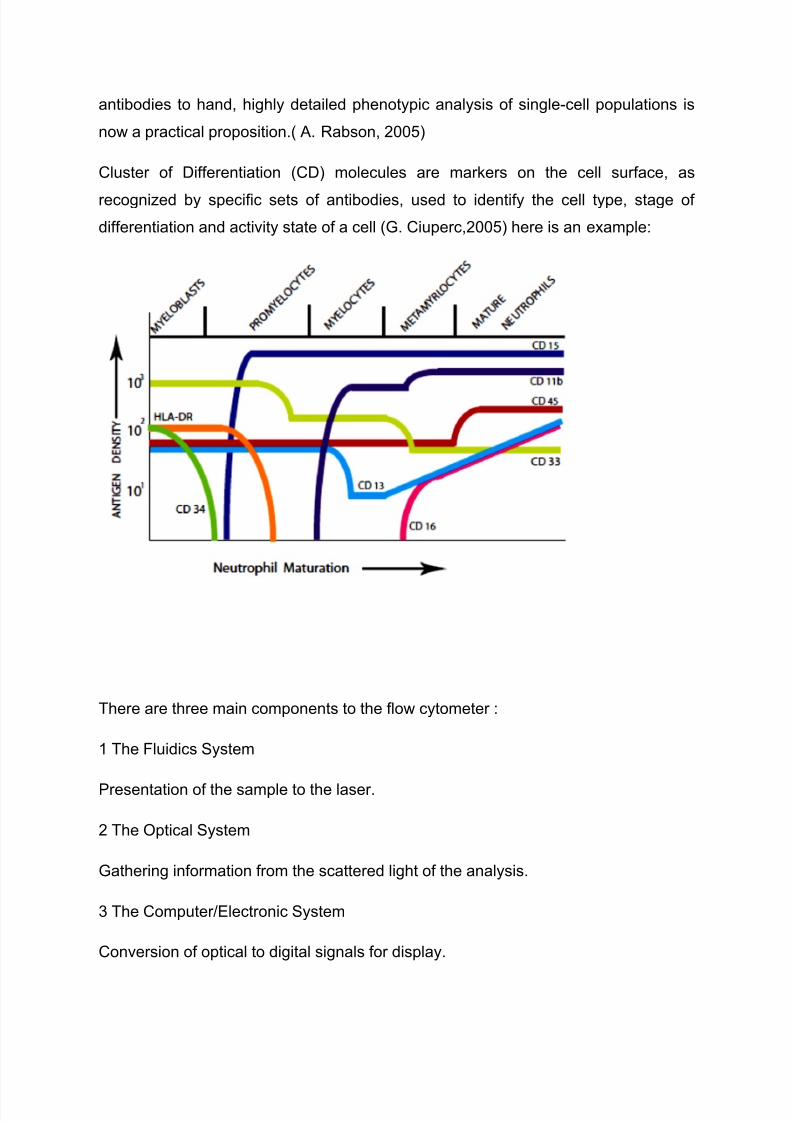
Cluster of Differentiation (CD) molecules are markers on the cell surface, as
recognized by specific sets of antibodies, used to identify the cell type, stage of
differentiation and activity state of a cell (G. Ciuperc,2005) here is an example:
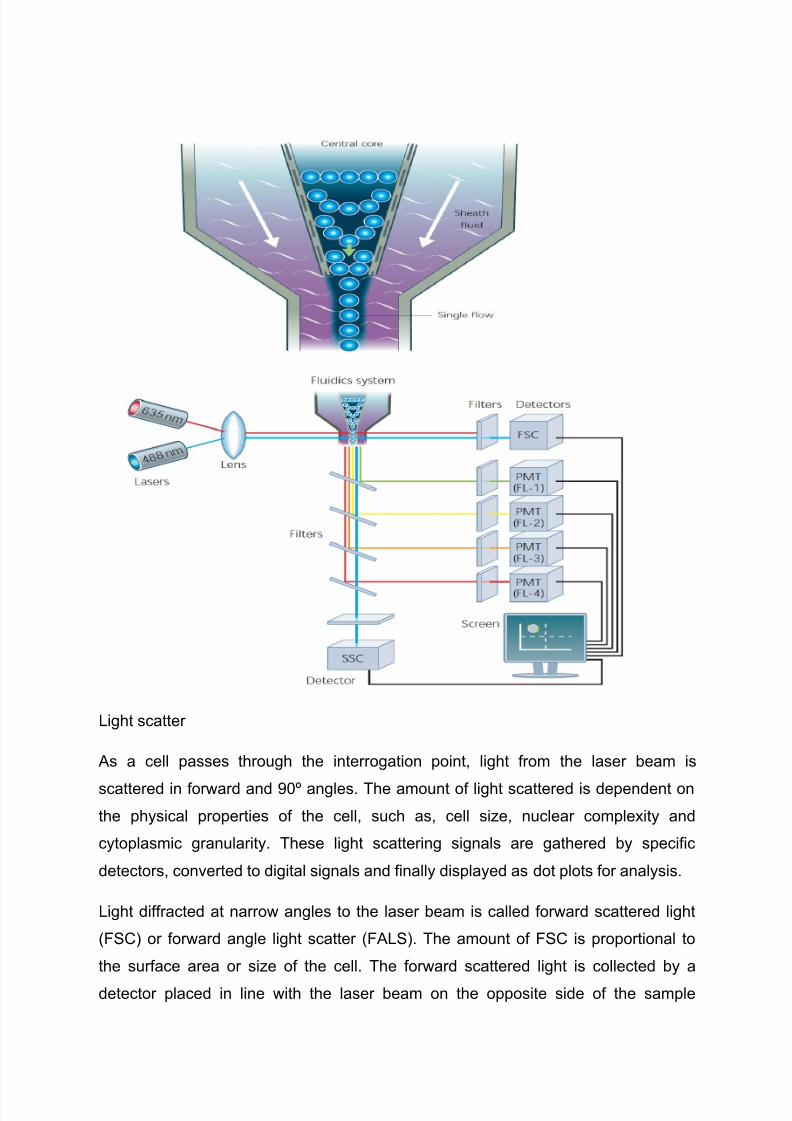
There are three main components to the flow cytometer :
1 The Fluidics System
Presentation of the sample to the laser.
2 The Optical System
Gathering information from the scattered light of the analysis.
3 The Computer/Electronic System
Conversion of optical to digital signals for display.
8/14/2019 Review Article 2.docx
http://slidepdf.com/reader/full/review-article-2docx 9/12
Light scatter
As a cell passes through the interrogation point, light from the laser beam is
scattered in forward and 90º angles. The amount of light scattered is dependent on
the physical properties of the cell, such as, cell size, nuclear complexity and
cytoplasmic granularity. These light scattering signals are gathered by specific
detectors, converted to digital signals and finally displayed as dot plots for analysis.
Light diffracted at narrow angles to the laser beam is called forward scattered light
(FSC) or forward angle light scatter (FALS). The amount of FSC is proportional to
the surface area or size of the cell. The forward scattered light is collected by a
detector placed in line with the laser beam on the opposite side of the sample

8/14/2019 Review Article 2.docx
http://slidepdf.com/reader/full/review-article-2docx 10/12
stream. Some light will pass through the cell membrane and is refracted and
reflected by cytoplasmic organelles or nucleus of the cell. This light is collected by a
photodiode positioned at approximately 90º to the laser beam and is known as side
scattered light (SSC). Side scattered light is proportional to the granularity or internal
complexity of the cell (Figure 2.4).
Together, FSC and SSC signals provide information on the physical properties of the
cells allowing differentiation of cells within a heterogeneous population, for example
the differentiation of white blood cells (Figure 2.5).
8/14/2019 Review Article 2.docx
http://slidepdf.com/reader/full/review-article-2docx 11/12
8/14/2019 Review Article 2.docx
http://slidepdf.com/reader/full/review-article-2docx 12/12
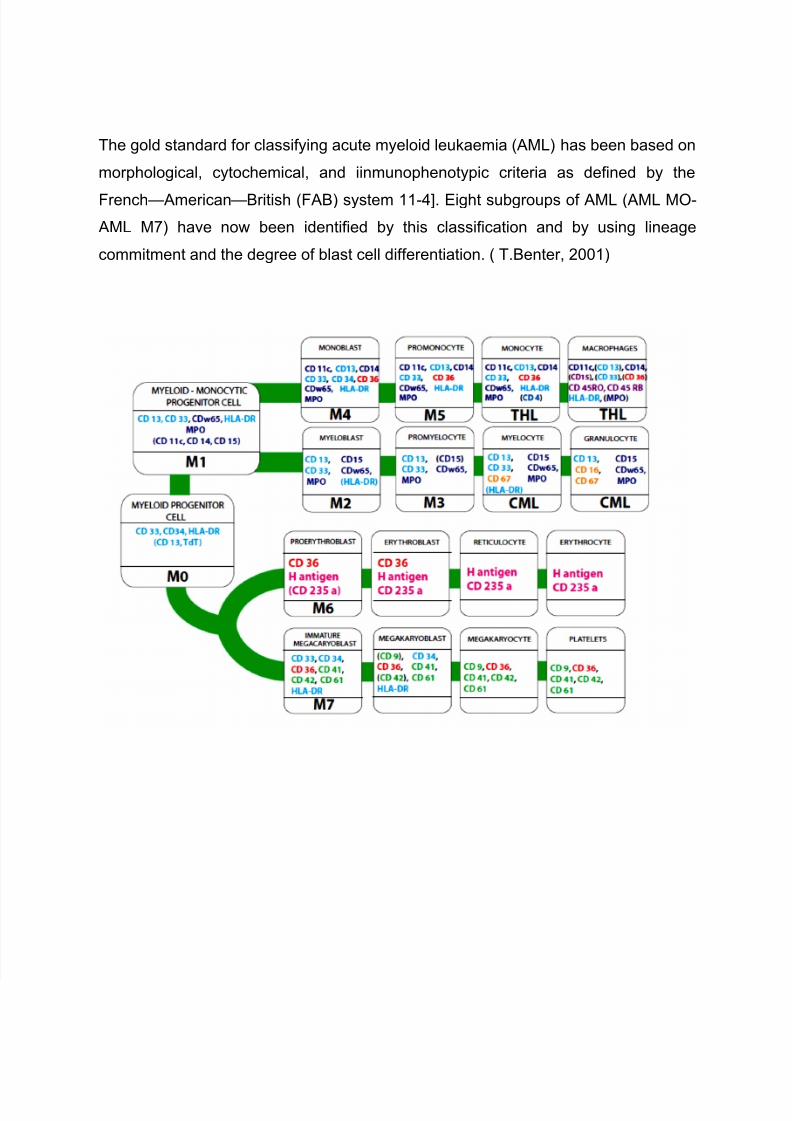
The gold standard for classifying acute myeloid leukaemia (AML) has been based on
morphological, cytochemical, and iinmunophenotypic criteria as defined by the
French—
American—
British (FAB) system 11-4]. Eight subgroups of AML (AML MO-
AML M7) have now been identified by this classification and by using lineage
commitment and the degree of blast cell differentiation. ( T.Benter, 2001)