Embed Size (px)
Citation preview
REVIEW
Comparative LC-MS: A landscape of peaks and valleys
Antoine H. P. America and Jan H. G. Cordewener
Plant Research International, Wageningen University and Research Centres, Wageningen, The Netherlands
Quantitative proteomics approaches using stable isotopes are well-known and used in many labsnowadays. More recently, high resolution quantitative approaches are reported that rely on LC-MS quantitation of peptide concentrations by comparing peak intensities between multiple runsobtained by continuous detection in MS mode. Characteristic of these comparative LC-MS pro-cedures is that they do not rely on the use of stable isotopes; therefore the procedure is oftenreferred to as label-free LC-MS. In order to compare at comprehensive scale peak intensity data inmultiple LC-MS datasets, dedicated software is required for detection, matching and alignmentof peaks. The high accuracy in quantitative determination of peptide abundancies provides animpressive level of detail. This approach also requires an experimental set-up where quantitativeaspects of protein extraction and reproducible separation conditions need to be well controlled.In this paper we will provide insight in the critical parameters that affect the quality of the resultsand list an overview of the most recent software packages that are available for this procedure.
Received: July 15, 2007Revised: November 1, 2007
Accepted: November 1, 2007
Keywords:
Alignment / Comparative LC-MS / Label-free / Quantitative proteomics / Software
Proteomics 2008, 8, 731–749 731
1 Introduction
The huge complexity, enormous concentration range anddynamic nature of the proteome present great technologicalchallenges for proteomic research. The physiological statusof a cell or organism is dictated by a multitude of regulatoryprocesses taking place at several levels. The steady state con-centration of each protein, the balance of its synthesis andturn-over rate, protein cleavages and other modifications,interactions with a network of binding partners, localisationwithin the cell; all affect the effective activity of each proteinand, in total, the status of the organism.
To gain insight of this complex regulatory network and toidentify those components that have major influence is thegoal of many proteomics studies. Biomarker identification is
aiming at the selection of those cellular components that areconsistently correlated with a particular physiological statuslike development or disease [1–4]. Biomarker discoveryessentially comes down to detect consistent differenceswithin a large number of samples. The technological chal-lenge in biomarker discovery is to develop an efficient meth-od for detailed and reproducible detection of as many com-ponents as possible, preferable in a quantitative manner.
LC-MS has evolved into a powerful procedure for detailedidentification as well as quantification of complex proteomicsamples. As opposed to 2-DE, where samples are separatedat the protein level, LC-MS analysis is mostly performed atthe peptide level [5, 6]. Protein extracts are treated with pro-tease (trypsin) in order to convert the sample into a complexmixture of peptides, which can be analysed in detail with MS.For analysis of highly complex protein mixtures a multi-dimensional separation is often applied, where the first di-mension separation can be performed either at the proteinlevel (before trypsin treatment) [7–9] or at the peptide level[10–12].
While initially most proteomics research was limited tothe detection of qualitative differences in protein composi-tion between samples, nowadays the accuracy of modern MSanalysis enables detailed detection of quantitative differenceseven down to relative ratios of two or less [13–18]. This review
Correspondence: Dr. Twan America, Plant Research Interna-tional, Wageningen University and Research Centres, PO Box16, 6700AA Wageningen, The NetherlandsE-mail: [email protected]: 131-317-418-094
Abbreviations: AMT, accurate mass-time; AMRT, accurate massretention time pair; PCA, principal components analysis; PMT,peptide mass-time; Rt, retention time
DOI 10.1002/pmic.200700694
© 2008 WILEY-VCH Verlag GmbH & Co. KGaA, Weinheim www.proteomics-journal.com

732 A. H. P. America and J. H. G. Cordewener Proteomics 2008, 8, 731–749
is intended to provide an overview of recent approaches inquantitative LC-MS analysis that are based on a quantitativecomparison of peak patterns between samples, mostly with-out the use of stable-isotope labels.
2 Quantitative proteomics
Most of the quantitative proteomics approaches by MS utiliseisotopic labels as a reference for either relative or even abso-lute quantification. Stable isotopes can be introduced in vivo,by feeding cells or an entire organism with a medium en-riched with stable isotopes [19]. Alternatively, the isotope canbe introduced into the proteins after extraction from the sam-ple, using a covalent coupling reagent that contains either thenatural or the heavy form of the isotope [20–22]. Isotopelabeling enables multiplexing. By mixing the differentlylabeled samples before analysis (or even before extraction)experimental procedures can be performed on the mixture ofsamples. Quantification of changes in protein concentrationis then performed by comparing the signal intensities of pep-tide ions containing the stable isotope versus the natural com-pound [23–25]. Any errors in the sample handling, extraction,separation and detection equally affect both samples at thesame rate and thus are compensated by the parallel analysis.Quantitative proteomics approaches using stable isotopes arewell-known and used in many labs nowadays.
Many quantification methods using stable isotope pro-cedures require MS/MS detection of peptides in order toidentify the sequence and by that the corresponding isotope-labeled mass peak. This is especially so for the in vivo labeledsamples, where the mass shift of the peptide is dependent onthe number of incorporated isotope molecules, which is dic-tated by the peptide sequence [26–31].
The detection coverage of a complex peptide mixtureusing LC-MS/MS approaches is limited, however. Thesequential procedure of selecting peptides for fragmentation,one by one, while they are eluting from an HPLC column,confers a maximum to the number of peptides that can beselected in a certain amount of time. Depending on theacquisition speed of the mass-spectrometer in use, one tofive fragmentation spectra can be collected per second. Giventhe complex nature of the proteome, a tryptic digest of aprotein extract (coming from an affinity enriched sample upto a total tissue extract) may contain from a few hundred upto some hundreds of thousands of peptides. The detectioncoverage is at stake, even more so in the latter case.
Chromatographic separation upfront to the MS detectionstep has no capacity to separate such complex peptide mix-tures at baseline level. Overlap of multiple eluting peptide isthe result. In highly complex peptide mixtures several ten-folds of different peptides may be co-eluting at any momentin time. Multidimensional separation procedures help toimprove resolution of detection, however, at the cost of thenumber of samples that can be analysed in a practical way[8–12, 32, 33].
Data dependent MS/MS detection can therefore result inundersampling of complex peptide mixtures [34]. In addi-tion, depending on the software and parameters used fordata dependent MS/MS acquisition, the set of selected pep-tides is actually biased to the most abundant peptides in thesample. Liu et al. presented and tested a statistical model forfrequency of peptide selection for MS/MS [34]. Theydemonstrated that of the abundant classes of proteins 80 to98% were detected in a triplicate 2-D LC-LC-MS/MS experi-ment. However of the lower abundance classes of proteins(which are the majority) only 10 to 25% were detected at all.In the same study it was shown that the frequency of MS/MSselection could actually be used as a quantitative measure forthe relative peptide abundance. This principle led to analternative procedure for label-free quantitation, called spec-tral counting. A normalised spectral abundance factor wasused as measure for relative peptide quantitation [17, 34–37].
On the other hand, quantitation procedures that rely onMS (in contrast to MS/MS) detection are much less con-strained by the peptide selection process, since peak resolu-tion in MS mode is actually very high. Hundreds of co-elut-ing masses can be detected per single MS scan. As such, tensof thousands of peptides can be detected in a single LC-MSrun. On this principle, quantitative approaches are developedthat rely on LC-MS quantitation of peptide concentrations bycomparing peak intensities between multiple runs obtainedby continuous detection in MS mode (see Table 1) [13–16, 33,38–53]. Characteristic of these comparative LC-MS proce-dures is that they do not rely on MS/MS or the use of stableisotopes, though in many cases would be compatible withthe use of stable isotopes.
Old et al. performed a detailed comparison of the spectralcounting versus the peak intensity procedure for proteinquantification in a multidimensional LC-MS/MS setup [17].They demonstrated that peak intensity measurements dis-played more accurate estimates of protein ratios. The sensi-tivity of peak detection was limited in their case to thosepeptides selected for MS/MS. In more recent comparativeLC-MS procedures all peaks detected above noise level in MSmode can be quantified as described in this review.
In this paper we will describe in more detail the proce-dures that are applied in the approach of (label-free) com-parative LC-MS using peak intensity for peptide quantita-tion. We will provide insight in the criticical parameters thataffect the quality of the results and list an overview of themost recent software packages that are available for this pro-cedure.
3 Comparative LC-MS
Comparative LC-MS approaches rely on the observation thatthe peak intensity (or better: peak volume as detected in LC-MS mode) in most cases is proportional to the concentrationof the peptide in the sample [13, 15, 54, 55]. So, determiningthe peak volume for each mass peak and comparing these
© 2008 WILEY-VCH Verlag GmbH & Co. KGaA, Weinheim www.proteomics-journal.com

Proteomics 2008, 8, 731–749 Bioinformatics 733
volume data between multiple LC-MS runs of differentsamples will provide a comprehensive quantitative overviewof thousands of peptide concentrations between the samples.From this overview, a selection list of differential peptidescan be produced for subsequent targeted fragmentation byLC-MS/MS in order to obtain sequence information of theselected peptides.
Though this principle may sound very straightforward,in reality this approach imposes some practical constraintsin experimental approach as well as technical constraints tothe instrumentation and the processing software, alsoreviewed in [56, 57]. A detailed and accurate quantitation of amaximum number of detected mass peaks requires pre-ferably a high resolution mass spectrometer and a highly re-producible (nano)HPLC separation procedure. Experimentaldrifts in m/z and retention time (Rt) significantly complicatethe direct comparison of multiple LC-MS datasets. In orderto compare at comprehensive scale peak intensity data be-tween samples dedicated software is required. Several stepsin data processing are performed: Peaks have to be dis-tinguished from background noise and from neighbouringpeaks (peak detection). Peak integration produces peak vol-ume data. Deconvolution takes care of charge detection anddetection (removal) of isotope patterns. And most important,chromatographic alignment of elution profiles is required inorder to correctly match the corresponding mass peaks be-tween multiple LC-MS runs. Finally normalisation proce-dures enable a more accurate matching and quantitation be-tween multiple samples. For correct quantitative analysis,
correct peak detection and peak matching is crucial. There-fore the quality of the alignment software is a key parameterin the comparative LC-MS procedure. This will be discussedin more detail below in this article.
A typical workflow of the analytical procedure for com-parative LC-MS is depicted in Fig.1a. Protein extracts fromdifferent samples are digested by protease (mostly trypsin) toprepare complex peptide mixtures. An aliquot of the peptidemixture per sample is injected into the LC-MS system. Theremainder of the sample digest is used for replicate injec-tions and for future (targeted) LC-MS/MS analyses. DuringLC-MS acquisition the mass spectrometer is set, in mostcases, to acquire MS spectra only. A high frequency of MSspectra is required in order to obtain enough chromato-graphic resolution for the analysis software to be able to per-form correct peak detection and peak integration. After peakdetection and alignment is performed by the LC-MS analysissoftware, a quantitative comparison between samples willenable the selection of those peaks that display differentialbehaviour between samples. As data are collected in MSmode only, the identity (sequence) of the selected peaks is yetunknown at this stage. For this, another aliquot of the sam-ple is injected in the LC-MS system, where the mass spec-trometer now is instructed to selectively collect MS/MS datafrom these differential masses which are enlisted in a so-called include list. In this approach the quantitative infor-mation and the identification information are collected inseparate LC-MS acquisitions, which may complicate the dataanalysis. On the other hand, the advantage is that MS/MS
Figure 1. (A) Typical workflow ofthe analytical procedure forcomparative LC-MS is given.Depending on the MS hardwaresituation, MS/MS spectra can becollected in parallel or sequen-tially to the LC-MS acquisition.Targeted LC-MS/MS selection isbased on include list informa-tion composed after quantita-tive difference analysis. (B)Overview of the data processingworkflow. Not all processingsteps are provided in some soft-ware packages. The order ofprocessing also differs betweenpackages.
© 2008 WILEY-VCH Verlag GmbH & Co. KGaA, Weinheim www.proteomics-journal.com

734 A. H. P. America and J. H. G. Cordewener Proteomics 2008, 8, 731–749
collection is selectively triggered for those peptides that areactually of interest because of their differential occurrence.In recent approaches, concurrent acquisition of MS and MS/MS data is possible, such as in MS systems with parallelacquisition (i.e. FT-ICR or FT-OrbiTrap), where the MS/MSspectra are collected in the ion trap, in parallel to the MSacquisition in the FT detector. The alternate scanningapproach, as developed by Waters Corporation, where alter-nating MS scans with low and high collision are acquired,provides another means of collecting intensity as well asidentification data in a single LC-MS run [16, 58, 59].Whereas the MS/MS information collected during the LC-MS run will not contain complete sequence information forall differential peptides, the limited amount of MS/MSinformation can also be used as landmark information in thealignment procedure (see section 4.5 below) [60].
As comparative LC-MS provides highly detailed, quanti-tative results, statistical analysis can be performed on thedata. This requires replicate injections per sample. For this,multiple runs of LC-MS should be performed under nearidentical conditions. Drifts in Rt should be minimised (samecolumn, same gradient, preferably temperature controlled).The use of a reference protein digest as internal standardspiked into each sample will improve on the accuracy byintensity normalisation (and in some cases peak matching)between multiple samples [16, 58, 59]. Internal referencepeptides can also be used for standardisation of mass and Rt,in order to compare datasets that were collected at a differentmoment (under different separation conditions) see section4.6 below.
Comparative LC-MS is a relatively recent procedure. Forgood quality results an optimal combination of practicalprocedure and good quality data processing is required. Foroptimal data processing it is important to understand theparameters that influence the results of data extraction. Inrecent years several software packages have been presented.An overview of LC-MS alignment software for proteomicsapplications (as currently known to the author) is presentedin Table 1. These software packages use different algorithmsfor data processing. Not all of these have been described in alldetail. In the remainder of this article we will describe thedifferent steps in data processing, comparing the differentalgorithms.
4 Software
A first classification of the software can be made with respectto its availability; open-source, commercial and custom (in-house) packages. Quite a number of open source (or freelyavailable (academic) packages) have been described in litera-ture. Many of these packages are still in a (relatively early)stage of development. Other packages, like MetAlign,MSight, MsInspect, PEPPeR, SuperHirn and VIPER are fullyoperational, such that analysis of complex peptide LC-MSdatasets have been reported in literature and that the soft-
ware has more or less clear (and easy to install) user interfacecomponents. Recently, a number of commercial packageshave reached the market. Whereas also these packages areopen for improvement, user interface and data processingalgorithms appear to be more evolved. More attention hasbeen paid to make the programme accessible to novel users.A small number of packages have been described in litera-ture that are custom built in a commercial setting, and arenot (yet?) available to the MS users’ public (see Table 1).
4.1 Data format
Discrimination can be made as to the input format that isused by the software. The commercial packages SIEVE andPLGS Expression, developed by MS hardware providers, areable to directly process the raw file format as produced by theMS hardware. This is an advantage, as no data conversionprocessing is required. At the same time this limits the use ofthe software to one particular “brand” of MS data. On theother hand, open source packages in most cases use themzXML format as a generic data format, for which severalconverter modules are available [79, 80]. This broadens theapplicability of the software. However, a disadvantage ofmzXML format is the considerable increase in data size (circa3–5 fold) and processing time required for data conversion.As a single LC-MS raw data file from a 90 min gradient elu-tion can be circa 1 Gb in size, its mzXML counterpart can beup to 5 Gb in size, after circa 1 h of conversion calculation. Amedium sized LC-MS experiment, containing for example20 LC-MS runs, then will result in 20 Gb (raw) plus 100 Gbadditional (mzXML) data, even prior to any data analysis.This not only puts constraints on the data storage capacity, italso puts strong requirements on memory managenementfor the processing PC, in order to be able to process theselarge size data files. Most recently, the Proteomics StandardsInitiative is developing a new format intended to replace themzXML and mzData formats [81]. The new format will benamed mzML, and should allow compressed file formats forcompressed peaklists. However, data export and importfilters of any existing programs need be adapted in order tomake this format usable in practice.
4.2 Peak detection
A flow scheme of the different data processing steps isrepresented in Fig. 1b. In most packages peak detection andfeature extraction is the first step in data processing. A fea-ture is defined as a collection of m/z peaks that are derivedfrom the same molecular ion, as result of 13C isotope dis-tribution and/or multiple charge states distributed overmultiple consecutive MS scans as result of chromatographicelution. This step involves noise filtering (smoothing), back-ground subtraction, peak detection and grouping of m/zpeaks over multiple consecutive MS scans for each detectedpeak. This step results in a large reduction in data size, as theraw data format is converted from a continuous data format
© 2008 WILEY-VCH Verlag GmbH & Co. KGaA, Weinheim www.proteomics-journal.com
Proteomics 2008, 8, 731–749 Bioinformatics 735
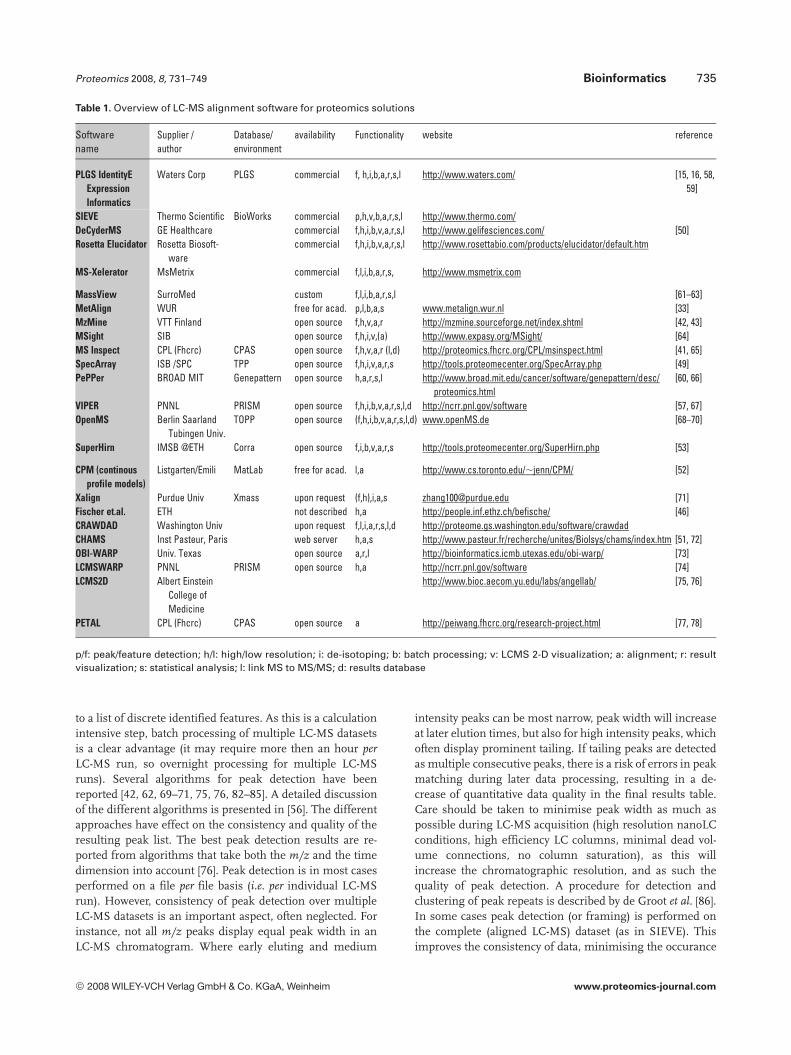
Table 1. Overview of LC-MS alignment software for proteomics solutions
Softwarename
Supplier /author
Database/environment
availability Functionality website reference
PLGS IdentityEExpressionInformatics
Waters Corp PLGS commercial f, h,i,b,a,r,s,l http://www.waters.com/ [15, 16, 58,59]
SIEVE Thermo Scientific BioWorks commercial p,h,v,b,a,r,s,l http://www.thermo.com/DeCyderMS GE Healthcare commercial f,h,i,b,v,a,r,s,l http://www.gelifesciences.com/ [50]Rosetta Elucidator Rosetta Biosoft-
warecommercial f,h,i,b,v,a,r,s,l http://www.rosettabio.com/products/elucidator/default.htm
MS-Xelerator MsMetrix commercial f,l,i,b,a,r,s, http://www.msmetrix.com
MassView SurroMed custom f,l,i,b,a,r,s,l [61–63]MetAlign WUR free for acad. p,l,b,a,s www.metalign.wur.nl [33]MzMine VTT Finland open source f,h,v,a,r http://mzmine.sourceforge.net/index.shtml [42, 43]MSight SIB open source f,h,i,v,(a) http://www.expasy.org/MSight/ [64]MS Inspect CPL (Fhcrc) CPAS open source f,h,v,a,r (l,d) http://proteomics.fhcrc.org/CPL/msinspect.html [41, 65]SpecArray ISB /SPC TPP open source f,h,i,v,a,r,s http://tools.proteomecenter.org/SpecArray.php [49]PePPer BROAD MIT Genepattern open source h,a,r,s,l http://www.broad.mit.edu/cancer/software/genepattern/desc/
proteomics.html[60, 66]
VIPER PNNL PRISM open source f,h,i,b,v,a,r,s,l,d http://ncrr.pnl.gov/software [57, 67]OpenMS Berlin Saarland
Tubingen Univ.TOPP open source (f,h,i,b,v,a,r,s,l,d) www.openMS.de [68–70]
SuperHirn IMSB @ETH Corra open source f,i,b,v,a,r,s http://tools.proteomecenter.org/SuperHirn.php [53]
CPM (continousprofile models)
Listgarten/Emili MatLab free for acad. l,a http://www.cs.toronto.edu/,jenn/CPM/ [52]
Xalign Purdue Univ Xmass upon request (f,h),i,a,s [email protected] [71]Fischer et.al. ETH not described h,a http://people.inf.ethz.ch/befische/ [46]CRAWDAD Washington Univ upon request f,l,i,a,r,s,l,d http://proteome.gs.washington.edu/software/crawdadCHAMS Inst Pasteur, Paris web server h,a,s http://www.pasteur.fr/recherche/unites/Biolsys/chams/index.htm [51, 72]OBI-WARP Univ. Texas open source a,r,l http://bioinformatics.icmb.utexas.edu/obi-warp/ [73]LCMSWARP PNNL PRISM open source h,a http://ncrr.pnl.gov/software [74]LCMS2D Albert Einstein
College ofMedicine
http://www.bioc.aecom.yu.edu/labs/angellab/ [75, 76]
PETAL CPL (Fhcrc) CPAS open source a http://peiwang.fhcrc.org/research-project.html [77, 78]
p/f: peak/feature detection; h/l: high/low resolution; i: de-isotoping; b: batch processing; v: LCMS 2-D visualization; a: alignment; r: resultvisualization; s: statistical analysis; l: link MS to MS/MS; d: results database
to a list of discrete identified features. As this is a calculationintensive step, batch processing of multiple LC-MS datasetsis a clear advantage (it may require more then an hour perLC-MS run, so overnight processing for multiple LC-MSruns). Several algorithms for peak detection have beenreported [42, 62, 69–71, 75, 76, 82–85]. A detailed discussionof the different algorithms is presented in [56]. The differentapproaches have effect on the consistency and quality of theresulting peak list. The best peak detection results are re-ported from algorithms that take both the m/z and the timedimension into account [76]. Peak detection is in most casesperformed on a file per file basis (i.e. per individual LC-MSrun). However, consistency of peak detection over multipleLC-MS datasets is an important aspect, often neglected. Forinstance, not all m/z peaks display equal peak width in anLC-MS chromatogram. Where early eluting and medium
intensity peaks can be most narrow, peak width will increaseat later elution times, but also for high intensity peaks, whichoften display prominent tailing. If tailing peaks are detectedas multiple consecutive peaks, there is a risk of errors in peakmatching during later data processing, resulting in a de-crease of quantitative data quality in the final results table.Care should be taken to minimise peak width as much aspossible during LC-MS acquisition (high resolution nanoLCconditions, high efficiency LC columns, minimal dead vol-ume connections, no column saturation), as this willincrease the chromatographic resolution, and as such thequality of peak detection. A procedure for detection andclustering of peak repeats is described by de Groot et al. [86].In some cases peak detection (or framing) is performed onthe complete (aligned LC-MS) dataset (as in SIEVE). Thisimproves the consistency of data, minimising the occurance
© 2008 WILEY-VCH Verlag GmbH & Co. KGaA, Weinheim www.proteomics-journal.com

736 A. H. P. America and J. H. G. Cordewener Proteomics 2008, 8, 731–749
of missing datapoints. A drawback of the SIEVE algorithm,on the other hand, is that it uses a fixed sized frame for peakdetection, which does not seem to be apropriate for quanti-fying peaks with varying peak widths.
4.3 LC-MS visualisation
Although not absolutely necessary for comparative LC-MSanalysis, visualisation of the LC-MS dataset (raw or mzXMLdata) in combination with the detected LC features can pro-vide a detailed insight in the quality of the LC-MS separationas well as of the quality of the feature detection (see Fig. 2).Complications like extensive peak tailing (chromatographicsaturation), strong ion suppression effects, or unequal dis-tribution of peak separation and peak overlap (due to non-optimal elution gradient profile) are evident in an LC-MSvisualisation. The software packages MsInspect, MSight,VIPER, SpecArray and DecyderMS provide full-featuredvisualisation tools for zoomable inspection of the LC-MS data.Also the quality of feature detection can be evaluated in an LC-MS visualisation. Completeness, uniqueness, and resolutionof feature detection and charge detection can be scrutinised,which may help in optimising the peak detection parametersettings. However, the alignment capacity of MsInspect,Msight and SpecArray is currently limited, such that thesepackages enable comparison of only a few LC-MS runs.
On the other hand, the high complexity of multipleprotein digests constrains the visual inspection mainly to aglobal (and subjective) quality control. The sheer size of themultiple LC-MS data will not allow detailed inspection orcorrection of all detected features. The user needs to trustthe detection algorithm, once the optimal peak detectionparameters have been determined, A more robust qualityevaluation of the total data analysis procedure should beperformed by statistical evaluation of the results [56] (seeSection 4.4). Piening et al. have described a quality controlmetrics approach for assessing the accuracy of featuredetection in the absence of completely annotated data sets[87].
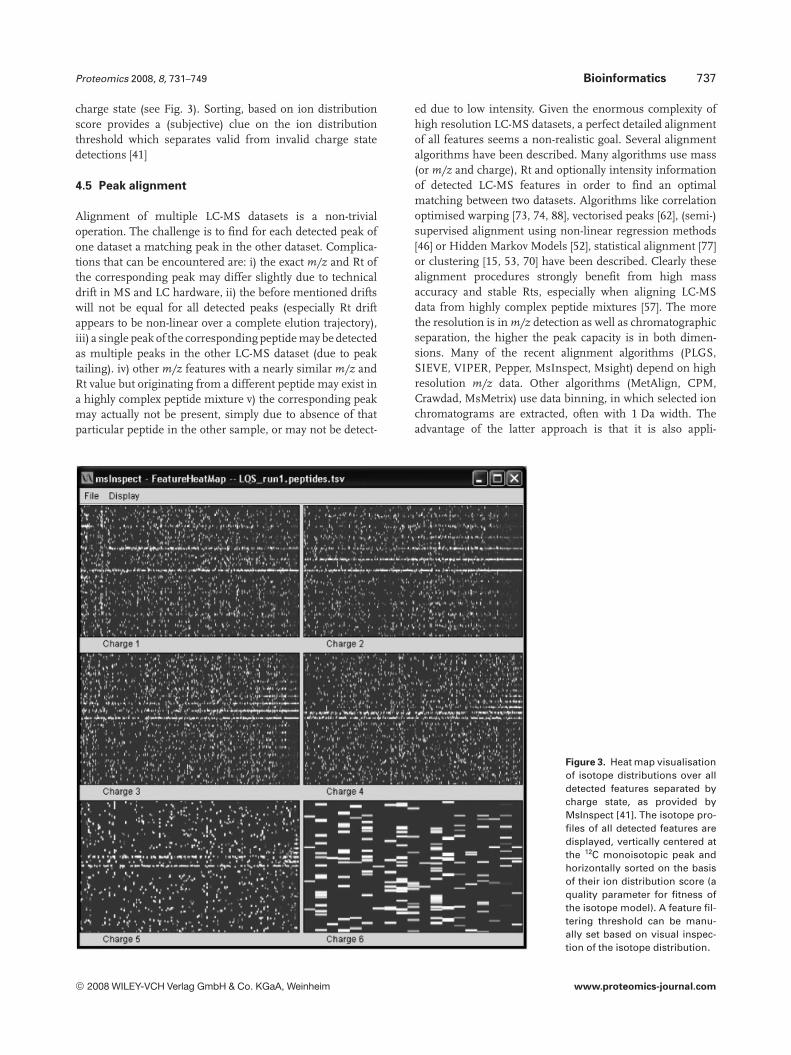
4.4 Feature filtering
Some packages provide feature filtering options, in order toremove low quality features from a dataset, before enteringthe alignment procedure. Parameters like minimal peakintensity, quality of isotope distribution, consistency ofcharge detection, chromatographic elution shape can beused to remove low quality detected features, which wouldcomplicate (and possibly disturb) a correct alignment ofmultiple LC-MS feature lists. Again, visualisation may helpin selecting filter settings. MsInspect provides a sorted heat-map visualisation of all isotope distributions classified by
Figure 2. An example is given of LC-MS visualisation using the MSight program in this case. LC-MS peak patterns can be visualised in 2-Dor 3-D views, possibly in two colour overlay. A 2-D visualisation of peak pattern in m/z and Rt dimension provides a good overview ofseparation quality. Zoom view provides information about resolution. (source: MSight users manual, with permission from the ProteomeInformatics Group, Swiss Institute of Bioinformatics) [64]
© 2008 WILEY-VCH Verlag GmbH & Co. KGaA, Weinheim www.proteomics-journal.com
Proteomics 2008, 8, 731–749 Bioinformatics 737
charge state (see Fig. 3). Sorting, based on ion distributionscore provides a (subjective) clue on the ion distributionthreshold which separates valid from invalid charge statedetections [41]
4.5 Peak alignment
Alignment of multiple LC-MS datasets is a non-trivialoperation. The challenge is to find for each detected peak ofone dataset a matching peak in the other dataset. Complica-tions that can be encountered are: i) the exact m/z and Rt ofthe corresponding peak may differ slightly due to technicaldrift in MS and LC hardware, ii) the before mentioned driftswill not be equal for all detected peaks (especially Rt driftappears to be non-linear over a complete elution trajectory),iii) a single peak of the corresponding peptide may be detectedas multiple peaks in the other LC-MS dataset (due to peaktailing). iv) other m/z features with a nearly similar m/z andRt value but originating from a different peptide may exist ina highly complex peptide mixture v) the corresponding peakmay actually not be present, simply due to absence of thatparticular peptide in the other sample, or may not be detect-
ed due to low intensity. Given the enormous complexity ofhigh resolution LC-MS datasets, a perfect detailed alignmentof all features seems a non-realistic goal. Several alignmentalgorithms have been described. Many algorithms use mass(or m/z and charge), Rt and optionally intensity informationof detected LC-MS features in order to find an optimalmatching between two datasets. Algorithms like correlationoptimised warping [73, 74, 88], vectorised peaks [62], (semi-)supervised alignment using non-linear regression methods[46] or Hidden Markov Models [52], statistical alignment [77]or clustering [15, 53, 70] have been described. Clearly thesealignment procedures strongly benefit from high massaccuracy and stable Rts, especially when aligning LC-MSdata from highly complex peptide mixtures [57]. The morethe resolution is in m/z detection as well as chromatographicseparation, the higher the peak capacity is in both dimen-sions. Many of the recent alignment algorithms (PLGS,SIEVE, VIPER, Pepper, MsInspect, Msight) depend on highresolution m/z data. Other algorithms (MetAlign, CPM,Crawdad, MsMetrix) use data binning, in which selected ionchromatograms are extracted, often with 1 Da width. Theadvantage of the latter approach is that it is also appli-
Figure 3. Heat map visualisationof isotope distributions over alldetected features separated bycharge state, as provided byMsInspect [41]. The isotope pro-files of all detected features aredisplayed, vertically centered atthe 12C monoisotopic peak andhorizontally sorted on the basisof their ion distribution score (aquality parameter for fitness ofthe isotope model). A feature fil-tering threshold can be manu-ally set based on visual inspec-tion of the isotope distribution.
© 2008 WILEY-VCH Verlag GmbH & Co. KGaA, Weinheim www.proteomics-journal.com

738 A. H. P. America and J. H. G. Cordewener Proteomics 2008, 8, 731–749
cable to lower resolution MS data such as from ion trapinstruments. However, this is at the expense of peak capacityand the risk of peak misalignment. On the other hand, sur-prisingly large tolerance to chromatographic drift has beendemonstrated by some of these algorithms, see Fig. 4 [33, 62].
The before mentioned procedures fully rely on LC-MS-only data. This approach strongly relies on similarity be-tween LC-MS datasets. Large deviations in peak pattern dueto either changes in sample composition or drifts in Rt orm/z-value of peptides severely complicate the alignmentprocess. Alignment of LC-MS data from different fractions ina multidimensional LC-MS separation is very complicated, ifnot impossible in this approach. Some programmes firstperform a similarity clustering of LC-MS data directly basedon the signal level, actually before peak detection and align-ment [51]. In this way the most similar datasets are aligned toeach other first [53]. In a very recent approach peptide ele-ments (features) in combination with raw data are alignedacross all LC-MS runs simultaneous using statistical meth-ods, without time-warping. This improves symmetry withindatasets and prevents missing datapoints [52, 77].
Alternative approaches have been described that com-bine information from LC-MS with MS/MS information.These approaches rely on data acquisition modes with fastalternate switching between MS and MS/MS mode, such aspossible with modern ion trap and Q-TOF instruments, or(semi)parallel acquisition, as possible with iontrap-FT-MS oriontrap-Orbitrap instruments. In these approaches the MS/MS spectra with confidently identified peptide sequencesprovide a time based framework on which the LC-MS(/MS)data can be roughly aligned. A (more detailed) refinement ofthe alignment is then subsequently performed on the highdensity LC-MS datasets using the MS/MS alignment as astarting point [46, 60, 73]. This procedure enables also align-ment of LC-MS datasets that display large difference, such assubsequent fractions from a multidimensional separation.The data analysis approach developed in the group of Smith
provides a combination of a peptide mass-time (PMT) data-base, loaded with a large collection of high confidence MS/MS peptide identifications coupled to a quantitative accuratemass-time (AMT) alignment approach which is thenmatched to the PMT database in order to link quantificationinformation to previously identified peptides [40, 45, 57, 67,89](see Fig. 1b). For the matching of these databases Rt nor-malisation is essential (see Section 4.6). Also in thisapproach, LC-MS features for which differential expressionhas been quantified, but no identification exists, due toabsence in the PMT database, will be listed in an “attention”or “include” list (listing m/z and Rt per feature) for targetedMS/MS collection in a follow-up LC-MS/MS acquisition. Theadvantage of such a database matching approach is thatinformation collected from multiple experiments can belinked. A PMTcollection is build for a particular organism ortissue, using multiple high frequency MS/MS acquisitionexperiments, acquired during or separately from the quanti-tative LC-MS runs. The coverage of the PMT data growswhile more MS/MS runs are acquired. The AMT approachthen is performed on multiple samples for quantitativeanalysis preferably using high resolution TOF or FTMS. Ofmajor importance here is a high accuracy of mass and (nor-malised) Rt for both types of acquisitions, as these two pa-rameters are the only link between the two databases.
An interesting (alternative) approach of parallel frag-mentation and quantification analysis has been reported bySilva et al. [16] and Vissers et al. [59], making use of the alter-nate scanning approach (IdentityE) developed by WatersCorporation. In this approach, the QTOF mass spectrometeralternately switches between a low collision and (ramped)high collision energy in the collision cell in front of the TOFMS detector. Where the low energy scan provides accuratem/z, charge, Rt and peak intensity information, the highenergy scan provides fragmentation information from nearlyall co-eluting peptides, as there is no m/z selection in the 1st
quadrupole in front of the collision cell. The fragmentation
Figure 4. Rt difference plot. Thedifference in Rt is plotted foreach peak that is matched with apeak in the reference LC-MSdataset. As many different peaksper timepoint are matched withsimilar retention drift a narrowband distribution is observed.Outlier datapoints are due tomismatching or error in peakdetection. Retention time drift isclearly a non-linear phenom-enon. Figure reproduced from[33].
© 2008 WILEY-VCH Verlag GmbH & Co. KGaA, Weinheim www.proteomics-journal.com
Proteomics 2008, 8, 731–749 Bioinformatics 739
information is used for a high coverage sequence identifica-tion of co-eluting peptides [59], but it can also be used as ad-ditional information for alignment between different LC-MSdatasets. The fragmentation information provides additionalclues as to the peptide identity, such that incorrect alignmentof similar m/z - Rt pairs between different runs can beminimised.
The result of an alignment algorithm is the production ofa match table, also called accurate mass Rt pair (AMRT) table(PLGS, VIPER) or peptide array (MsInspect, SpecArray). Insuch a table feature parameters like m/z, charge, Mw, Rt,intensity, volume and possibly peptide sequence informa-tion, etc. are listed in columns per LC-MS experiment. Eachrow then contains a set of features (peptides) that arematched between these LC-MS experiments. If a feature isnot detected or not matched in a particular LC-MS dataset,this will result in missing data fields in the AMRT table.Within replicate LC-MS runs, the number of missing datafields should be minimal. In other words: the replicatenumber (=occurrence/replicate) should be maximal as, inprinciple, peaks should be detected and matched for each ofthe replicate injections [77, 86].
For many software packages this is the endpoint of theanalysis. The table can be exported as delimited text file to beanalysed further in other data analysis packages, like Excel orother statistics software. Some packages provide options forquality evaluation and optimisation, as mentioned below. Asoftware package like R [90] (open source) can be used forstatistics analysis. Visualisation software for multivariatedata analysis like Spotfire DecisionSite [91], GeneMath [92]or other micro-array data analysis packages, like SAM [93, 94]or TM4MeV [95–97], can be very helpful in evaluating globaldata quality as well as selecting the differential peptide fea-tures (see Section 4.7).
4.6 Normalisation
The result of peak detection and alignment is a large table ofpeak intensity values coupled to (detected) mass, charge andRt values. Advanced datafiltering and processing proceduresare required to correct, refine and filter the data in order toextract meaningful information. Normalisation and trans-formation of quantitative data is essential for correction ofglobal errors in data quality. Global drifts occur at variouslevels during and between multiple MS acquisitions. Nor-malisation procedures can correct for these drifts, in order toimprove the accuracy of quantitative results and to standar-dise the results, such that matching and comparison be-tween multiple experiments is improved. Normalisation canbe applied to mass (m/z or Mw values) (recalibration), Rt (Rtnormalisation) and/or peptide abundance (peak intensity orvolume). Normalisation of mass is in some cases performedalready in the alignment algorithm, as calibration to aninternal reference (e.g. the lock-spray calibration in WatersCorporation PLGS). In other cases this could be performedafterwards. Linear transformations per LCMS dataset can
correct for a global calibration error [65]. However, more fineresolved calibration functions can be derived from the masserrors calculated between experimental and theoretical massfor those peaks for which sequence information has beencollected (in case MS/MS or MSE data have been acquired).
Rt normalisation, or standardisation, is a more dramaticcorrection, as the Rt is dependent on many factors (e.g. col-umn condition, temperature, eluent gradient and pumpcondition). In the implementation of the PMT and AMTdatabase system the observed retention (or elution) time isregressed to a predicted normalised elution time based onheuristic models predicting the normalised elution timefrom the peptide sequence identified by MS/MS [98]. Pre-diction of peptide Rt in relation to their amino acid sequencehas been modeled on the basis of a collection of identifiedMS/MS spectra [99, 100]. More recently, a support vectorregression algorithm was presented which can be applied onlocal LC-MS/MS datasets in order to train a Rt model basedon experimental data obtained from the same system as usedfor quantitative LC-MS acquisition [101].
Normalisation of peptide abundance data is probably themost essential for improvement of the quantitative accuracyof the experiment. Abundance normalisation will correct forbias due to errors in sample size, possibly sample carry-overand drifts in ionisation and detector efficiencies. Differentprocedures for normalisation can be applied. Normalisationvalues can be calculated on the basis of a global distributionfor all detected features (like sum, average or median of allintensities per run), or calculated from a specific sub-set offeatures, for instance from a spiked protein that is used asinternal standard [16, 58, 59], or a set of “household’ proteins.In most cases a global correction factor for the complete LC-MS dataset is applied, though a local correction factor forintensity maybe more applicable just as for mass and Rtnormalisation [52, 56]. A detailed discussion on normal-isation and statistical evaluation of comparative LC-MS datais presented in [56] and [102].
Callister et al. compared the effects of different normal-isation procedures for quantitative LC-MS datasets and con-cluded that global (or centralised) normalisation and linearregression normalisation worked best in most cases. Notably,the performance of different normalisation procedures var-ies per type of experimental samples and is also different de-pendent on the criterium that is used to characterise theperformance (i.e. CV or Local Pooled Error). So preferably,the best procedure should be selected per experimental data-set [102]. Careful consideration should be taken whether, andto what threshold, outlier datapoints should be excludedfrom the calculation of the normalisation factor. Further-more, scaling of abundance data is important in order tobring the distribution of datapoints more closely to a normaldistribution. This is especially important when parametricstatistical tests (like Students T-test) are used for differenceanalysis [103, 104]. In many cases a logarithmic transforma-tion is used for variance stabilisation, see also Fig 5. How-ever, more dedicated log-transformations have been pro-
© 2008 WILEY-VCH Verlag GmbH & Co. KGaA, Weinheim www.proteomics-journal.com

740 A. H. P. America and J. H. G. Cordewener Proteomics 2008, 8, 731–749
posed for micro-array data analysis that could also be appliedto LC-MS data [105–107]. Anderle et al. have tested the var-iance dependence in relation to peak intensity and developeda two-component (or quadratic) error model. For log-trans-formed intensities the variance converges to a constant valueat high intensities. Whereas at low intensity values the effectof Poisson noise becomes increasingly dominant [61], seealso Fig. 5e.
4.7 Data quality evaluation
As mentioned above, matching of (as many as possible) massfeatures across multiple LC-MS datasets is essential for
quantitative comparison. The quality of the used peak detec-tion and alignment algorithms, with respect to aspects as res-olution, accuracy, completeness and consistency, is of pre-mium importance for the correctness of the resulting quanti-tative matching table. So, the quality of these processing stepsshould be evaluated, in order to provide insight in the cor-rectness of the results and, possibly, to provide clues as to theadjustment of user settings for the different parameters.
Different methods can be used for data evaluation.Visualisation is a powerful tool, be it subjective, for inspec-tion of data quality, where trends, outliers or errors canbecome evident. More objective clues can be obtained usingstatistical analysis.
© 2008 WILEY-VCH Verlag GmbH & Co. KGaA, Weinheim www.proteomics-journal.com

Proteomics 2008, 8, 731–749 Bioinformatics 741
Figure 5. Examples of distribution plots for evaluation of the quantitive reproducibility of replicate LC-MS datasets and evaluation of dif-ferences. Peptide mixtures derived from tomato leaf extracellular extracts were analysed in 5-fold replicate on an LTQ-OrbiTrap system andpeak frames were detected and quantified with the SIEVE algorithm. The two samples were extracted from two different plants (a resisitant(R) versus a susceptible (S) plant 10 days after inoculation with a plant infectious fungus). A total of 25 160 peaks were detected andquantified by reporting the maximum intensity per peak. NB. Peaks are not de-isotoped nor deconvoluted by SIEVE. Peak intensity datawere transformed to 10log scale and centered by subtracting the average 10log value of all peaks per replicate. CV and Students T-test,testing difference between the R and S sample between five replicates were calculated on the 10log transformed data.(America et al. unpublished data)(A)Scatterplot of peak intensities of a single S LC-MS dataset (run #2) versus the average intensities per peak frame of the 5-fold replicate S
dataset. A very narrow distribution along the diagonal is observed, covering circa four orders of magnitude in intensity.(B) Scatterplot of the average peak intensities of 5-fold replicate LC-MS injections of the two different samples S versus R. A much broader
distribution is observed, due to the differences between the two samples. A”cloud” of dots can be seen below the diagonal indicatingpeaks with increased intensity in the susceptible (infected) plant.
(C) Scatterplot of the ratio of peak intensities of samples S versus R plotted against the average replicate intensities of sample S. The samecloud of “upregulated peaks” is visible in the top middle of the plot.
(D)Scatterplot of distribution of 10log of the T-test p-value versus the ratios of peak intensity S/R. Clearly, centering of the data (by thechosen method) is not perfect, evidenced by the skewness to the left of the plot. This is also visible in plot c.
(E) Distribution plot of the CV and the distribution of average intensity within a 5-fold replicate injection of the sample S. The 10log trans-formation brings the intensity distribution close to gaussian (bottom panel). An inverse relation between peak intensity (x-axis) and CV(y-axis) is observed (middle panel). The peaks with high CV are mostly of very low intensity (left panel).
(note: colour shading from dark to light in all panels is dictated by the 10log[p] of the T-test, as visible in d. Figures are produced in SpotfireDecisionSite)
As mentioned in Section 4.3, visualisation of LC-MS peakintensities and detected features provides insight in thequality of actual LC separation as well as the feature detec-tion algorithm, at a global view (Fig. 2). Isotope distributionplots, such as the heat maps provided in MsInspect (Fig. 3),deliver insight in the correctness of charge state detectionand help in the selection of filter settings in order to removelow quality assignments.
The quality of alignment can be visualised in an Rt driftplot (Fig.4). Here the shift in Rt between two LC-MS runs isplotted versus the Rt (or scan number) for each matched peakpair. Since in most cases, the drift in Rt is equal for all co-
eluting peptides, such a plot should display a narrow dis-tribution of data points in a band fluctuating around the zerodrift value. A broad distribution indicates non-consistency inpeak matching either due to errors in peak matching itselfand/or due to errors in peak detection.
Another major quality parameter is the technical repro-duciblity of the quantitative approach. Scatterplots of peakintensity data (on a logarithmic scale) within replicate datashould display a narrow distribution of datapoints on thediagonal (Fig. 5a). This plot enables easy selection of outlierdatapoints in deviating from the (majority of) correctly quan-tified datapoints that are overlapping on the diagonal line. In
© 2008 WILEY-VCH Verlag GmbH & Co. KGaA, Weinheim www.proteomics-journal.com
742 A. H. P. America and J. H. G. Cordewener Proteomics 2008, 8, 731–749
contrast, a scatterplot projecting (within replicates average)peak intensity data between different samples gives a repre-sentation of the amount of quantitative differences betweenthese samples (Fig. 5b). A plot of intensity ratio between twosamples versus the peak intensity indicates whether differ-ential peaks are mainly of low or high intensity (Fig. 5c). Thisplot also gives a good impression of the quality of the normal-isation. The plot should be centered on the middle of the ratioplot. If not, other normalisation procedures should be con-sidered (e.g. linear regression). A plot of intensity ratio versusthe T-test value (here on log scale) also enables a good selec-tion of significant differential peaks, and gives an indicationof the normalisation quality (Fig. 5d). This can also be eval-uated by analysing the SD of quantitation within replicateinjections of identical samples [56, 102]. A plot displaying CV(=SD/average) versus the average of peak intensity (withinreplicates) (Fig. 5e) gives a good impression of the relationbetween peak intensity and quantitative reproducibility aswell as the dynamic range of the quantitative dataset. Not sur-prisingly, the CV increases at low peak intensities due to a de-crease of the S/N. A total distribution histogram of CV valuesprovides a good impression of the total quantitative repro-ducibility of the complete analysis (Fig. 5e). Outliers in quan-titation (or CV) at high peak intensity are mostly due to errorsin peak detection or matching.These outliers should be mini-mised (filtered or preferably corrected, if possible). Outliers atlow peak intensity can be due to errors in alignment or inquantitation resulting from low S/N.
Removal or filtering of data points with non-consistentretention time drift values or large CV values from the resultslist would seem a possibility. However, this may lead toremoval of (important) valid datapoints that may negativelyaffect total data quality (and increase the number of missingdata points). Missing values can significantly affect sub-sequent statistical analysis and machine learning algorithms[78]. Procedures exist to estimate these values as accuratelyas possible from neighbouring datapoints [108, 109]. A betterapproach is to optimise peak detection and matching pa-rameters, or even recluster the match table in order to repairerrors in peak detection and matching [86]. A manual cor-rection of the match table is not a practical solution, due tothe sheer size of the data table (and the risk of subjectivity).Although the use of multiple parameter settings in thealignment software offers the flexibility to adopt and opti-mise the different processing algorithms to fit with the spe-cific characteristics of the provided LC-MS data, it holds therisk of subjectivity in data analysis. Furthermore, if a largenumber of parameters need to be set, the effect of each par-ticular parameter on the final data quality may becomeobscure. This may lead to more or less intuitive trial anderror or, even worse, neglecting the parameters (usingdefaults) which may not be optimal at all. Algorithms whereimportant parameter settings are automatically extracted bydata extraction routines (as in PLGS) are preferred. Opti-mally these settings should then be provided in a parametertable, open for adjustment by the (advanced) user.
4.8 Difference analysis and biomarker detection
If the quality of the match table is satisfactory, the analysiscan proceed to perform difference analysis between groupsof samples, or classification of samples. Classification ofsamples is actually based on the collective quantitative be-haviour of a large number of peptide abundances, whereasdifference analysis uses filtering procedures to select thosefeatures that are consistently different in abundance betweensamples, which are potential biomarkers [52, 104, 110–112].For difference analysis univariate statistics can be used. Stu-dents T-test or ANOVA (on log-transformed abundance data)are often used for selecting differential features [61, 103,104]. An interesting projection plot is the p-value versus log(-ratio) plot (see Fig. 5d), as it enables the visual selection of themost significant and most differential features. For uni-variate statistics analysis, like Students T-test or ANOVA, acorrection for multiple hypothesis testing should pre-ferentially be performed. For example, on a list of 10 000features a p-value threshold of 0.01 in theory may result in100 false positive selected features (in addition to a certainpercentage of true positives). To correct for this, statisticalmethods have been developed to control this False-Dicovery-Rate [18, 113–115].
Advanced machine learning procedures have beenreported and compared for classification and differenceanalysis (feature selection) of MS data sets [111, 116–119]. Inmany approaches these have been applied to compareMALDI or SELDI data [120–125]. The availability of largescale (many samples) studies with comparative LC-MS is stilllimited, probably due to the more complicated nature of LC-MS alignment [126]. However, recent studies of multiplereplicate LC-MS analyses have assessed the capacity of dif-ference analysis versus classification [18, 52, 61]. Listgartenet al. demonstrate that classification (e.g. Control versusspiked, or healthy versus diseased) is actually a much easiertask than a complete, or perfect, finding of all actual abun-dance differences. The replicate number of analyses (notunexpectedly) has a strong effect on the precision-recall (truepositive rate versus false positive rate) ratio [127], with areplicate of five presenting a practical compromise [52].Clearly, the quality of the alignment procedure in combina-tion with the resolution and precision of the acquired datawill have a strong influence on the efficiency of differencedetection (precision-recall ratio). So, a performance testshould be done in each practical experimental situation.
Depending on the LC-MS method used, it is possible thatthe identification of the selected differential peptides isalready available (as with PMT database, or parallel MS/MSacquisition, see Fig. 1b). In the other scenario where quanti-tative LC-MS is performed without any knowledge about theidentity of the selected features, a targeted MS/MS approachshould be followed in order to enable identification of therespective peptides (Fig. 1a). A list of selected features is thenmade, containing m/z, Rt and possibly charge information,which is loaded as “include” or “attention” list into the MS
© 2008 WILEY-VCH Verlag GmbH & Co. KGaA, Weinheim www.proteomics-journal.com

Proteomics 2008, 8, 731–749 Bioinformatics 743
acquisition control software. Provided that the targeted pep-tides elute within a user selected window of the given selec-tion, MS/MS acquisition will be triggered to collect frag-mentation information from which the sequence of theselected peptide can be derived (by database searching or denovo sequencing) [33, 45, 128]. For low abundance peptides,injection of a larger amount of sample may be required inorder to provide enough ion intensity for MS/MS detection.Detection sensitivity in MS/MS mode is much less than inMS mode, as the peptide fragments are distributed over alarge number of peaks in the MS/MS spectrum. Coupling ofpeptide MS/MS identification results to previous LC-MSpeak abundance data may not be a trivial task, as Rt may driftbetween the LC-MS runs. Rt normalisation (see Section 4.6)will improve the matching between these different datasets(AMT vs. PMT database).
4.9 Multivariate analysis
A clear advantage of the comparative procedure is that itenables the comparison of a large number of LC-MS datasetsat a time. Provided that experimental conditions have beenoptimised for resolution and reproducibility in separation, alarge number of samples can be analysed in consecutive runson the LC-MS system. The LC-MS analysis software willalign the resulting datasets as long as there is sufficientoverlap in composition of the peptide mixtures, such thatenough anchor points for the alignment can be determined.Such multi-sample analysis enables the set-up of time courseexperiments, or the analysis of a large cohort of experimentalgroups (e.g. patients and control individuals). The quantita-tive output from such type of analysis can be analysed withmultivariate statistics procedures, similar as currently donewith micro-array experiments.
Multivariate data analysis has been reported with datafrom LC-MS experiments in several reports [33, 129–131].Recently, Prakash et al. have presented a software tool,named Chaorder, that implements principles similar tomultivariate analysis, in order to assess reproducibility andsimilarity characteristics of multiple LC-MS data [72]. Basedon the alignment algorithm CHAMS [51] a similarity matrixis produced, in which the pairwise similarity of each set ofcomplete raw LC-MS data is represented. A 2-D projection ofthe (normalised) Euclidian distances between the differentLC-MS data provide insight in the similarity metrics betweendatasets, and as such can visualise (unexpected) biases ortrends in data, that may not easily be observed from thecomplete set of results.
Principal components analysis (PCA) and/or hier-archical clustering provide a good means to visualise thesimilarities between samples in relation to the differencesbetween classes of samples. PCA provides a multi-dimen-sional reprojection of the multivariate data, in such a waythat the largest level of variation is plotted in the x-dimen-sion. The distance between datapoints is a measure for thevariance between the data. Figure 6 displays a PCA plot from
Figure 6. PCA plot based on peptide abundance data collectedfrom 18 aligned RP-LC-MS runs using MetAlign. Three fractionsfrom a SCX fractionation (numbered 27, 28 and 29) were ana-lysed from protein extracts from green (G) and red (R) tomato.The AMRT data were centered on the average and normalised bydividing by the root mean square value per LC-MS dataset. Thepanel shows the position of each complete LC-MS dataset withinthe first two principal components. The small histogram insertshows the percentage of total variation covered per principalcomponent. A clear separation of the three different SCX frac-tions and the different plant samples (G versus R) is displayed,while the triplicate datasets cluster very closely together persample (Example taken from [33]).
a SCX fractionation experiment of tryptic peptides from greenand red tomato fruits. This example shows that the technicalvariation between replicate injections is much smaller thenthe actual variation between the different samples.
Modern variations on PCA exist such as hierarchical PCA[132], or Independent Component Analysis [133–135] whichreveal indepent sources of variation within multivariate data.Data from different experiments or different measurementscan be integrated via multivariate analysis [136]. Integrationof quantitative proteomics data with metabolomics and/ormicro-array data provide a promising approach in biomarkerdiscovery and systems biology [137].
Expression plots or heat maps in combination with hier-archical clustering can provide a clustering of multiple pep-tides that display similar quantitative behaviour within thedataset. It is expected that multiple peptides per protein willdisplay very similar quantitative behaviour, and will end inthe same clusters [49, 59, 112, 126, 135, 138]. On the otherhand, if changes in PTM or multiple isoforms with differentexpression profiles exist, some peptides from the same pro-tein will end up in a different expression cluster as themajority of its “sister” peptides. As such, comparative LC-MSanalysis is not confined to global changes in composition,but also enables the detection of quantitative differences inhigh detail.
© 2008 WILEY-VCH Verlag GmbH & Co. KGaA, Weinheim www.proteomics-journal.com
744 A. H. P. America and J. H. G. Cordewener Proteomics 2008, 8, 731–749
5 Experimental considerations
Comparative LC-MS as quantitative proteomics procedureextracts quantitative information per experimental sampleout of each indivual LC-MS dataset. This implies that anyerrors due to experimental and technical deviations will addup to the final quantitative information. This enforces someprecautions in experimental design in order to guaranteeoptimal quality of the results from which significant conclu-sions can be drawn. General considerations for the design ofexperiment should be considered, just as for other (quanti-tative) experimental procedures [106, 115, 123]. Any experi-mental sample preparation procedure should be performedwith quantitative reproducibility, as much as possible. Theuse of internal standard proteins, which can be spiked at anearly point of sample preparation, will provide referencepoints in the final dataset, on which the matching as well asquantitative information can be calibrated. Furthermore, theacquisition of quantitative LC-MS data should preferably beperformed in a consecutive series of measurements, in orderto minimise drifts in (chromatographic) separation as well as(MS) detection. Control LC-MS runs (i.e.. with only the spikesample) should be performed intermittently between experi-mental runs in order to enable quality control during thecomplete series of analysis [72]. Comparison of datasets thathave been acquired at different time points (e.g. separated byweeks) can be quite limited due to unexpected changes inseparation conditions (like temperature, buffer compositionor even column condition). The use of internal referencemarkers and also the use of fragmentation information asanchor points for Rt normalisation will provide more toler-ance and accuracy in matching. While comparative LC-MS,often referred to as label-free LC-MS, enables quantitativeanalysis without the use of stable-isotope labeling, it actuallycan profit from the use of a stable isotope labeled sample asan internal reference. Such an internal reference could be astandardised control sample, mixed with each experimentalsample. Its use will provide a large number of referencepoints to which mass, Rt and peak intensity can be calibratedthroughout the LC-MS datasets. While using the high reso-lution feature detection algorithms developed for compara-tive LC-MS the quantitative accuracy will improve evenmore, with this high density reference points.
How complex can a protein sample be to be analysed bycomparative LC-MS? As mentioned before, the resolution inseparation and MS detection both have a strong influence onthe total peak capacity. So, ultra-high resolution will have thestrongest detection power [12, 45, 139]. It is difficult to pre-sent a general advice. In our experiment, displayed in Fig. 5,circa 25 000 peaks (non-deisotoped nor deconvoluted) weredetected from a relatively “simple” extracellular extract,revealing circa 300 spots on a 2-D gel (data not shown). Whendeisotoped and deconvoluted, these data would approxi-mately point to 5000 peptide features. More complex proteinmixtures can produce more then 100 000 peptides. Thesecannot all be resolved in a single 1-D LC-MS run. A compro-
mise should be decided upon between the enhanced peakdetection of multidimensional LC separation upfront of theMS analysis [138], versus the associated increase in numberof LC-MS runs (with the associated increase in data com-plexity). On the other hand, succesfull comparative bio-marker studies have been reported from complete humanserum samples, without further enrichment, using nanoLC-QTOF equipment [59]. Here the more intense peptide fea-tures will dominate the analysis, which does not necessarilypreclude success. As in many -omics experiments, differencedetection and classification does not imply that we detect alldifferences. This is acceptable as long as the detected differ-ences are significant and reproducible.
6 Conclusion
Comparative LC-MS is a relatively recent approach in quan-titative proteomics analysis. Software tools, which are essen-tial for this procedure, are still in development and haveroom for improvement. User interface and calculation effi-ciency of the processing workflow can be improved in manycases. More importantly, the integration of data at the level ofMS and MS/MS from multiple experiments needs moretransparent implementation in database systems. The toler-ances for drift, especially in the Rt domain, are (in mostcases) tight, which enforce a relatively strong control ofseparation conditions in the experimental set-up. On theother hand, the high accuracy in quantitative determinationof peptide abundances at an impressive level of detailrequires an experimental set-up where quantitative aspectslike protein extraction efficiencies and sample stability needto be well controlled. At the current state already, it appearsthat the quantitative reproducibility of technical replicates isin many cases much better than experimental reproducibility[61, 140].
In conclusion, with improvements in the efficiency of thedata analysis workflow, comparative LC-MS has a tre-mendous potential for application in biomarker detectionanalysis due to its high level of detail, its quantitative accu-racy and its capacity for large scale applications. Successfulapplications in biomedical biomarker discovery have recentlybeen reported in the field of breast cancer [126, 138], Gaucherdisease [59] and proteinurea [131]. We are truly confident thatmany will follow.
We acknowledge the collaboration with Dr. Hans Vissers ofWaters Corporation for the UPLC-QTOF data and evaluation ofthe Expression Informatics module of ProteinLynx Global Server,and the collaboration with Dr. Wilfried Voorhorst of ThermoFisher Scientific for the LTQ-OrbiTrap data and evaluation of theSIEVE software.
We acknowledge the funding of the projects “Quantitativeproteomics” for Antoine America and Jan H. G. Cordewener aspart of the Netherlands Proteomics Centre and the Centre for
© 2008 WILEY-VCH Verlag GmbH & Co. KGaA, Weinheim www.proteomics-journal.com

Proteomics 2008, 8, 731–749 Bioinformatics 745
Biosystems and Genomics, both of which are part of the Nether-lands Genomics Initiative/Netherlands Organization for Scien-tific Research.
The authors have declared no conflict of interest.
7 References
[1] Veenstra, T. D., Conrads, T. P., Hood, B. L., Avellino, A. M. etal., Biomarkers: Mining the biofluid proteome. Mol. Cell.Proteomics 2005, 4, 409–418.
[2] Ackermann, B. L., Hale, J. E., Duffin, K. L., The role of massspectrometry in biomarker discovery and measurement.Curr. Drug Metab. 2006, 7, 525–539.
[3] Kussmann, M., Raymond, F., Affolter, M., OMICS-drivenbiomarker discovery in nutrition and health. J. Biotechnol.2006, 124, 758–787.
[4] Powell, D. W., Merchant, M. L., Link, A. J., Discovery of reg-ulatory molecular events and biomarkers using 2D capillarychromatography and mass spectrometry. Expert Rev. Prote-omics 2006, 3, 63–74.
[5] Whiteaker, J. R., Zhang, H., Eng, J. K., Fang, R. et al., Head-to-head comparison of serum fractionation techniques. J. Pro-teome Res. 2007, 6, 828–836.
[6] Stasyk, T., Huber, L. A., Zooming in: fractionation strategiesin proteomics. Proteomics 2004, 4, 3704–3716.
[7] Sharma, S., Simpson, D. C., Tolic, N., Jaitly, N. et al., Prote-omic profiling of intact proteins using WAX-RPLC 2-Dseparations and FTICR mass spectrometry. J. Proteome Res.2007, 6, 602–610.
[8] Sheng, S., Chen, D., Van Eyk, J. E., Multidimensional liquidchromatography separation of intact proteins by chromato-graphic focusing and reversed phase of the human serumproteome: optimization and protein database. Mol. Cell.Proteomics 2006, 5, 26–34.
[9] Chen, E. I., Hewel, J., Felding-Habermann, B., Yates, J. R.,3rd, Large scale protein profiling by combination of proteinfractionation and multidimensional protein identificationtechnology (MudPIT). Mol. Cell. Proteomics 2006, 5, 53–56.
[10] Wolters, D. A., Washburn, M. P., Yates, J. R., 3rd, An auto-mated multidimensional protein identification technologyfor shotgun proteomics. Anal. Chem. 2001, 73, 5683–5690.
[11] Washburn, M. P., Wolters, D., Yates, J. R., 3rd, Large-scaleanalysis of the yeast proteome by multidimensional proteinidentification technology. Nat. Biotechnol. 2001, 19, 242–247.
[12] Shen, Y., Jacobs, J. M., Camp, D. G., 2nd,Fang, R. et al.,Ultra-high-efficiency strong cation exchange LC/RPLC/MS/MS for high dynamic range characterization of the humanplasma proteome. Anal. Chem. 2004, 76, 1134–1144.
[13] Roy, S. M., Anderle, M., Lin, H., Becker, C. H., Differentialexpression profiling of serum proteins and metabolites forbiomarker discovery. Int. J. Mass Spectrom. 2004, 238, 163–171.
[14] Higgs, R. E., Knierman, M. D., Gelfanova, V., Butler, J. P.,Hale, J. E., Comprehensive label-free method for the relativequantification of proteins from biological samples. J. Pro-teome Res. 2005, 4, 1442–1450.
[15] Silva, J. C., Denny, R., Dorschel, C. A., Gorenstein, M. et al.,Quantitative proteomic analysis by accurate mass retentiontime pairs. Anal. Chem. 2005, 77, 2187–2200.
[16] Silva, J. C., Denny, R., Dorschel, C., Gorenstein, M. V. et al.,Simultaneous qualitative and quantitative analysis of theEscherichia coli proteome: A sweet tale. Mol. Cell. Proteom-ics 2006, 5, 589–607.
[17] Old, W. M., Meyer-Arendt, K., Aveline-Wolf, L., Pierce, K. G.et al., Comparison of label-free methods for quantifying hu-man proteins by shotgun proteomics. Mol. Cell. Proteomics2005, 4, 1487–1502.
[18] Cho, H., Smalley, D. M., Theodorescu, D., Ley, K., Lee, J. K.,Statistical identification of differentially labeled peptidesfrom liquid chromatography tandem mass spectrometry.Proteomics 2007, 7, 3681–3692.
[19] Ong, S. E., Blagoev, B., Kratchmarova, I., Kristensen, D. B. etal., Stable isotope labeling by amino acids in cell culture,SILAC, as a simple and accurate approach to expressionproteomics. Mol. Cell. Proteomics 2002, 1, 376–386.
[20] Flory, M. R., Griffin, T. J., Martin, D., Aebersold, R., Advancesin quantitative proteomics using stable isotope tags. TrendsBiotechnol. 2002, 20, S23–S29.
[21] Moritz, B., Meyer, H. E., Approaches for the quantification ofprotein concentration ratios. Proteomics 2003, 3, 2208–2220.
[22] Julka, S., Regnier Fred, E., Recent advancements in differ-ential proteomics based on stable isotope coding. Brief.Funct. Genomic. Proteomic. 2005, 4, 158–177.
[23] Moulder, R., Filen, J. J., Salmi, J., Katajamaa, M. et al., Acomparative evaluation of software for the analysis of liquidchromatography-tandem mass spectrometry data from iso-tope coded affinity tag experiments. Proteomics 2005, 5,2748–2760.
[24] Li, X. J., Zhang, H., Ranish, J. A., Aebersold, R., Automatedstatistical analysis of protein abundance ratios from datagenerated by stable-isotope dilution and tandem massspectrometry. Anal. Chem. 2003, 75, 6648–6657.
[25] Zhang, X., Hines, W., Adamec, J., Asara, J. M. et al., Anautomated method for the analysis of stable isotope label-ing data in proteomics. J. Am. Soc. Mass Spectrom. 2005,16, 1181–1191.
[26] Krijgsveld, J., Ketting, R. F., Mahmoudi, T., Johansen, J. etal., Metabolic labeling of C. elegans and D. melanogaster forquantitative proteomics. Nat. Biotechnol. 2003, 21, 927–931.
[27] Gehrmann, M. L., Hathout, Y., Fenselau, C., Evaluation ofmetabolic labeling for comparative proteomics in breastcancer cells. J. Proteome Res. 2004, 3, 1063–1068.
[28] Wu, C. C., MacCoss, M. J., Howell, K. E., Matthews, D. E.,Yates, J. R., 3rd, Metabolic labeling of mammalian organ-isms with stable isotopes for quantitative proteomic analy-sis. Anal. Chem. 2004, 76, 4951–4959.
[29] Beynon, R. J., Pratt, J. M., Metabolic labeling of proteins forproteomics. Mol. Cell. Proteomics 2005, 4, 857–872.
[30] Lafaye, A., Labarre, J., Tabet, J. C., Ezan, E., Junot, C., Liquidchromatography-mass spectrometry and 15N metaboliclabeling for quantitative metabolic profiling. Anal. Chem.2005, 77, 2026–2033.
[31] Snijders, A. P., de Vos, M. G., Wright, P. C., Novel approachfor peptide quantitation and sequencing based on 15N and13C metabolic labeling. J. Proteome Res. 2005, 4, 578–585.
© 2008 WILEY-VCH Verlag GmbH & Co. KGaA, Weinheim www.proteomics-journal.com

746 A. H. P. America and J. H. G. Cordewener Proteomics 2008, 8, 731–749
[32] Tong, W., Link, A., Eng, J. K., Yates, J. R., 3rd, Identificationof proteins in complexes by solid-phase microextraction/multistep elution/capillary electrophoresis/tandem massspectrometry. Anal. Chem. 1999, 71, 2270–2278.
[33] America, A. H. P., Cordewener, J. H. G., van Geffen, M. H. A.,Lommen, A. et al., Alignment and statistical difference anal-ysis of complex peptide data sets generated by multi-dimensional LC-MS. Proteomics 2006, 6, 641–653.
[34] Liu, H., Sadygov, R. G., Yates, J. R., A model for randomsampling and estimation of relative protein abundance inshotgun proteomics. Anal. Chem. 2004, 76, 4193–4201.
[35] Ishihama, Y., Oda, Y., Tabata, T., Sato, T. et al., Exponentiallymodified protein abundance index (emPAI) for estimation ofabsolute protein amount in proteomics by the number ofsequenced peptides per protein. Mol. Cell. Proteomics 2005,4, 1265–1272.
[36] Zybailov, B., Mosley, A. L., Sardiu, M. E., Coleman, M. K. etal., Statistical analysis of membrane proteome expressionchanges in Saccharomyces cerevisiae. J. Proteome Res.2006, 5, 2339–2347.
[37] Paoletti, A. C., Parmely, T. J., Tomomori-Sato, C., Sato, S. etal., Quantitative proteomic analysis of distinct mammalianMediator complexes using normalized spectral abundancefactors. Proc. Natl. Acad. Sci. USA 2006, 103, 18928–18933.
[38] Wiener, M. C., Sachs, J. R., Deyanova, E. G., Yates, N. A.,Differential mass spectrometry: a label-free LC-MS methodfor finding significant differences in complex peptide andprotein mixtures. Anal. Chem. 2004, 76, 6085–6096.
[39] Radulovic, D., Jelveh, S., Ryu, S., Hamilton, T. G. et al.,Informatics platform for global proteomic profiling and bio-marker discovery using liquid chromatography-tandemmass spectrometry. Mol. Cell. Proteomics 2004, 3, 984–997.
[40] Pasa-Tolic, L., Masselon, C., Barry, R. C., Shen, Y., Smith, R.D., Proteomic analyses using an accurate mass and time tagstrategy. Biotechniques 2004, 37, 621–624, 626–633, 636.
[41] Bellew, M., Coram, M., Fitzgibbon, M., Igra, M. et al., A suiteof algorithms for the comprehensive analysis of complexprotein mixtures using high-resolution LC-MS. Bioinfor-matics 2006, 22, 1902–1909.
[42] Katajamaa, M., Oresic, M., Processing methods for differ-ential analysis of LC/MS profile data. BMC Bioinformatics2005, 6, 179.
[43] Katajamaa, M., Miettinen, J., Oresic, M., MZmine: Toolboxfor processing and visualization of mass spectrometrybased molecular profile data. Bioinformatics 2006, 22, 634–636.
[44] Katajamaa, M., Oresic, M., Data processing for mass spec-trometry-based metabolomics. J. Chromatogr. A 2007, 1158,318–328.
[45] Fang, R., Elias, D. A., Monroe, M. E., Shen, Y. et al., Differ-ential label-free quantitative proteomic analysis of Shewa-nella oneidensis cultured under aerobic and suboxic condi-tions by accurate mass and time tag approach. Mol. Cell.Proteomics 2006, 5, 714–725.
[46] Fischer, B., Grossmann, J., Roth, V., Gruissem, W. et al.,Semi-supervised LC/MS alignment for differential proteom-ics. Bioinformatics 2006, 22, e132–140.
[47] Ono, M., Shitashige, M., Honda, K., Isobe, T. et al., Label-freequantitative proteomics using large peptide data sets gen-erated by nanoflow liquid chromatography and mass spec-trometry. Mol. Cell. Proteomics 2006, 5, 1338–1347.
[48] Wang, G., Wu, W. W., Zeng, W., Chou, C. L., Shen, R. F.,Label-free protein quantification using LC-coupled ion trapor FT mass spectrometry: Reproducibility, linearity, andapplication with complex proteomes. J. Proteome Res.2006, 5, 1214–1223.
[49] Li, X. J., Yi, E. C., Kemp, C. J., Zhang, H., Aebersold, R., Asoftware suite for the generation and comparison of peptidearrays from sets of data collected by liquid chromatography-mass spectrometry. Mol. Cell. Proteomics 2005, 4, 1328–1340.
[50] Johansson, C., Samskog, J., Sundstrom, L., Wadensten, H.et al., Differential expression analysis of Escherichia coliproteins using a novel software for relative quantitation ofLC-MS/MS data. Proteomics 2006, 6, 4475–4485.
[51] Prakash, A., Mallick, P., Whiteaker, J., Zhang, H. et al., Signalmaps for mass spectrometry-based comparative proteom-ics. Mol. Cell. Proteomics 2006, 5, 423–432.
[52] Listgarten, J., Neal, R. M., Roweis, S. T., Wong, P., Emili, A.,Difference detection in LC-MS data for protein biomarkerdiscovery. Bioinformatics 2007, 23, e198–204.
[53] Mueller, L. N., Rinner, O., Schmidt, A., Letarte, S. et al.,SuperHirn - a novel tool for high resolution LC-MS-basedpeptide/protein profiling. Proteomics 2007, 7, 3470–3480.
[54] Schmidt, A., Karas, M., Dulcks, T., Effect of different solutionflow rates on analyte ion signals in nano-ESI MS, or: whendoes ESI turn into nano-ESI? J. Am. Soc. Mass Spectrom.2003, 14, 492–500.
[55] Shen, Y., Zhao, R., Berger, S. J., Anderson, G. A. et al., High-efficiency nanoscale liquid chromatography coupled on-linewith mass spectrometry using nanoelectrospray ionizationfor proteomics. Anal. Chem. 2002, 74, 4235–4249.
[56] Listgarten, J., Emili, A., Statistical and computational meth-ods for comparative proteomic profiling using liquid chro-matography-tandem mass spectrometry. Mol. Cell. Prote-omics 2005, 4, 419–434.
[57] Zimmer, J. S., Monroe, M. E., Qian, W. J., Smith, R. D.,Advances in proteomics data analysis and display using anaccurate mass and time tag approach. Mass Spectrom. Rev.2006, 25, 450–482.
[58] Silva, J. C., Gorenstein, M. V., Li, G. Z., Vissers, J. P.,Geromanos, S. J., Absolute quantification of proteins byLCMSE: A virtue of parallel MS acquisition. Mol. Cell. Prote-omics 2006, 5, 144–156.
[59] Vissers, J. P., Langridge, J. I., Aerts, J. M., Analysis andquantification of diagnostic serum markers and protein sig-natures for Gaucher disease. Mol. Cell. Proteomics 2007, 6,755–766.
[60] Jaffe, J. D., Mani, D. R., Leptos, K. C., Church, G. M. et al.,PEPPeR, a platform for experimental proteomic patternrecognition. Mol. Cell. Proteomics 2006, 5, 1927–1941.
[61] Anderle, M., Roy, S., Lin, H., Becker, C., Joho, K., Quantifyingreproducibility for differential proteomics: noise analysis forprotein liquid chromatography-mass spectrometry of hu-man serum. Bioinformatics 2004, 20, 3575–3582.
[62] Hastings, C. A., Norton, S. M., Roy, S., New algorithms forprocessing and peak detection in liquid chromatography/mass spectrometry data. Rapid Commun. Mass Spectrom.2002, 16, 462–467.
[63] Roy, S. M., Becker, C. H., Quantification of proteins andmetabolites by mass spectrometry without isotopic label-ing. Methods Mol. Biol. 2007, 359, 87–105.
© 2008 WILEY-VCH Verlag GmbH & Co. KGaA, Weinheim www.proteomics-journal.com

Proteomics 2008, 8, 731–749 Bioinformatics 747
[64] Palagi, P. M., Walther, D., Quadroni, M., Catherinet, S. et al.,MSight: An image analysis software for liquid chromatog-raphy-mass spectrometry. Proteomics 2005, 5, 2381–2384.
[65] May, D., Fitzgibbon, M., Liu, Y., Holzman, T. et al., A platformfor accurate mass and time analyses of mass spectrometrydata. J. Proteome Res. 2007, 6, 2685–2694.
[66] Leptos, K. C., Sarracino, D. A., Jaffe, J. D., Krastins, B.,Church, G. M., MapQuant: Open-source software for large-scale protein quantification. Proteomics 2006, 6, 1770–1782.
[67] Smith, R. D., Anderson, G. A., Lipton, M. S., Pasa-Tolic, L. etal., An accurate mass tag strategy for quantitative and high-throughput proteome measurements. Proteomics 2002, 2,513–523.
[68] Kohlbacher, O., Reinert, K., Gropl, C., Lange, E. et al., TOPP–the OpenMS proteomics pipeline. Bioinformatics 2007, 23,e191–197.
[69] Lange, E., Gropl, C., Reinert, K., Kohlbacher, O., Hildebrandt,A., High-accuracy peak picking of proteomics data usingwavelet techniques. Pac. Symp. Biocomput. 2006, 243–254.
[70] Lange, E., Gropl, C., Schulz-Trieglaff, O., Leinenbach, A. etal., A geometric approach for the alignment of liquid chro-matography-mass spectrometry data. Bioinformatics 2007,23, i273–281.
[71] Zhang, X., Asara, J. M., Adamec, J., Ouzzani, M., Elma-garmid, A. K., Data pre-processing in liquid chromatogra-phy-mass spectrometry-based proteomics. Bioinformatics2005, 21, 4054–4059.
[72] Prakash, A., Piening, B., Whiteaker, J., Zhang, H. et al.,Assessing bias in experiment design for large scale massspectrometry-based Quantitative proteomics. Mol. Cell.Proteomics 2007, 6, 1741–1748.
[73] Prince, J. T., Marcotte, E. M., Chromatographic alignment ofESI-LC-MS proteomics data sets by ordered bijective inter-polated warping. Anal. Chem. 2006, 78, 6140–6152.
[74] Jaitly, N., Monroe, M. E., Petyuk, V. A., Clauss, T. R. et al.,Robust algorithm for alignment of liquid chromatography-mass spectrometry analyses in an accurate mass and timetag data analysis pipeline. Anal. Chem. 2006, 78, 7397–7409.
[75] Du, P., Angeletti, R. H., Automatic deconvolution of isotope-resolved mass spectra using variable selection and quan-tized peptide mass distribution. Anal. Chem. 2006, 78, 3385–3392.
[76] Du, P., Sudha, R., Prystowsky, M. B., Angeletti, R. H., Datareduction of isotope-resolved LC-MS spectra. Bioinfor-matics 2007, 23, 1394–1400.
[77] Wang, P., Tang, H., Fitzgibbon, M. P.,McIntosh, M. et al., Astatistical method for chromatographic alignment of LC-MSdata. Biostatistics 2007, 8, 357–367.
[78] Wang, P., Tang, H., Zhang, H., Whiteaker, J. et al., Normal-ization regarding non-random missing values in high-throughput mass spectrometry data. Pac. Symp. Bio-comput. 2006, 11, 315–326.
[79] Pedrioli, P. G., Eng, J. K., Hubley, R., Vogelzang, M. et al., Acommon open representation of mass spectrometry dataand its application to proteomics research. Nat. Biotechnol.2004, 22, 1459–1466.
[80] mzXML, http://tools.proteomecenter.org/mzXMLschema.php
[81] mzML, http://www.psidev.info/index.php?q=node/257
[82] Du, P., Kibbe, W. A., Lin, S. M., Improved peak detection inmass spectrum by incorporating continuous wavelet trans-form-based pattern matching. Bioinformatics 2006, 22,2059–2065.
[83] Morris, J. S., Brown, P. J., Herrick, R. C., Baggerly, K. A.,Coombes, K. R., Bayesian analysis of mass spectrometryproteomic data using wavelet-based functional mixed mod-els. Biometrics 2007, published on-line 20 Sep 2007, DOI10.1111/j.1541-042.2007.00895.
[84] Windig, W., Smith, W. F., Chemometric analysis of complexhyphenated data. Improvements of the component detec-tion algorithm. J. Chromatogr. A 2007, 1158, 251–257.
[85] Zhang, Z., Marshall, A. G., A universal algorithm for fast andautomated charge state deconvolution of electrospraymass-to-charge ratio spectra. J. Am. Soc. Mass Spectrom.1998, 9, 225–233.
[86] Groot, J. C. W. d., Fiers, M. W. E. J., Ham, R. C. H. J. v.,America, A. H. P., Post-aligment Clustering Procedure(PACP) for comparative quantitative proteomics LC-MSdata. Proteomics 2008, 8, 32–36.
[87] Piening, B. D., Wang, P., Bangur, C. S., Whiteaker, J. et al.,Quality control metrics for LC-MS feature detection toolsdemonstrated on Saccharomyces cerevisiae proteomic pro-files. J. Proteome Res. 2006, 5, 1527–1534.
[88] Bylund, D., Danielsson, R., Malmquist, G., Markides, K. E.,Chromatographic alignment by warping and dynamic pro-gramming as a pre-processing tool for PARAFAC modellingof liquid chromatography-mass spectrometry data. J. Chro-matogr. A 2002, 961, 237–244.
[89] Lipton, M. S., Pasa-Tolic, L., Anderson, G. A., Anderson, D. J.et al., Global analysis of the Deinococcus radiodurans pro-teome by using accurate mass tags. Proc. Natl. Acad. Sci.USA 2002, 99, 11049–11054.
[90] R-project, www.r-project.org
[91] DecisionSite, http://www.spotfire.com/products/decisionsite.cfm
[92] GeneMath, http://www.applied-maths.com/genemaths/genemaths.htm
[93] SAM, http://www-stat.stanford.edu/,tibs/SAM/
[94] Subramanian, A., Tamayo, P., Mootha, V. K., Mukherjee, S. etal., Gene set enrichment analysis: A knowledge-basedapproach for interpreting genome-wide expression profiles.Proc. Natl. Acad. Sci. USA 2005, 102, 15545–15550.
[95] Saeed, A. I., Bhagabati, N. K., Braisted, J. C., Liang, W. et al.,TM4 microarray software suite. Methods Enzymol. 2006,411, 134–193.
[96] Sturn, A., Quackenbush, J., Trajanoski, Z., Genesis: Clusteranalysis of microarray data. Bioinformatics 2002, 18, 207–208.
[97] Storey, J. D., Tibshirani, R., Statistical methods for identify-ing differentially expressed genes in DNA microarrays.Methods Mol. Biol. 2003, 224, 149–157.
[98] Strittmatter, E. F., Kangas, L. J., Petritis, K., Mottaz, H. M. etal., Application of peptide LC retention time information in adiscriminant function for peptide identification by tandemmass spectrometry. J. Proteome Res. 2004, 3, 760–769.
[99] Krokhin, O. V., Craig, R., Spicer, V., Ens, W. et al., Animproved model for prediction of retention times of tryptic
peptides in ion pair reversed-phase HPLC: Its application to
© 2008 WILEY-VCH Verlag GmbH & Co. KGaA, Weinheim www.proteomics-journal.com
748 A. H. P. America and J. H. G. Cordewener Proteomics 2008, 8, 731–749
protein peptide mapping by off-line HPLC-MALDI MS. Mol.Cell. Proteomics 2004, 3, 908–919.
[100] Petritis, K., Kangas, L. J., Yan, B., Monroe, M. E. et al.,Improved peptide elution time prediction for reversed-phase liquid chromatography-MS by incorporating pep-tide sequence information. Anal. Chem. 2006, 78, 5026–5039.
[101] Klammer, A. A., Yi, X., MacCoss, M. J., Noble, W. S.,Improving tandem mass spectrum identification usingpeptide retention time prediction across diverse chroma-tography conditions. Anal. Chem. 2007, 79, 6111–6118.
[102] Callister, S. J., Barry, R. C., Adkins, J. N., Johnson, E. T. etal., Normalization approaches for removing systematicbiases associated with mass spectrometry and label-freeproteomics. J. Proteome Res. 2006, 5, 277–286.
[103] Karp, N. A., Lilley, K. S., Design and analysis issues inquantitative proteomics studies. Proteomics 2007, 7, 42–50.
[104] Urfer, W., Grzegorczyk, M., Jung, K., Statistics for prote-omics: A review of tools for analyzing experimental data.Proteomics 2006, 6, 48–55.
[105] Durbin, B. P., Rocke, D. M., Variance-stabilizing transfor-mations for two-color microarrays. Bioinformatics 2004,20, 660–667.
[106] Rocke, D. M., Design and analysis of experiments with highthroughput biological assay data. Semin. Cell Dev. Biol.2004, 15, 703–713.
[107] Quackenbush, J., Microarray data normalization andtransformation. Nat. Genet. 2002, 32, 496–501.
[108] Sehgal, M. S., Gondal, I., Dooley, L. S., Collateral missingvalue imputation: A new robust missing value estimationalgorithm for microarray data. Bioinformatics 2005, 21,2417–2423.
[109] Kim, H., Golub, G. H., Park, H., Missing value estimation forDNA microarray gene expression data: local least squaresimputation. Bioinformatics 2005, 21, 187–198.
[110] Tibshirani, R., Hastie, T., Narasimhan, B., Chu, G., Diag-nosis of multiple cancer types by shrunken centroids ofgene expression. Proc. Natl. Acad. Sci. USA 2002, 99, 6567–6572.
[111] Tibshirani, R., Hastie, T., Narasimhan, B., Soltys, S. et al.,Sample classification from protein mass spectrometry, by‘peak probability contrasts’. Bioinformatics 2004, 20, 3034–3044.
[112] Varshavsky, R., Gottlieb, A., Linial, M., Horn, D., Novelunsupervised feature filtering of biological data. Bioinfor-matics 2006, 22, e507–513.
[113] Dudoit, S., Shaffer, J. P., Boldrick, J. C., Multiple hypothesisTtesting in microarray experiments. Stat. Sci. 2003, 18, 71–103.
[114] Storey, J. D., Tibshirani, R., Statistical significance for gen-omewide studies. Proc. Natl. Acad. Sci. USA 2003, 100,9440–9445.
[115] Karp, N. A., McCormick, P. S., Russell, M. R., Lilley, K. S.,Experimental and statistical considerations to avoid falseconclusions in proteomics studies using differential in-gelelectrophoresis. Mol. Cell. Proteomics 2007, 6, 1354–1364.
[116] Geurts, P., Fillet, M., de Seny, D., Meuwis, M. A. et al., Pro-teomic mass spectra classification using decision treebased ensemble methods. Bioinformatics 2005, 21, 3138–3145.
[117] Levner, I., Feature selection and nearest centroid classifi-cation for protein mass spectrometry. BMC Bioinformatics2005, 6, 68.
[118] Zhang, X., Lu, X., Shi, Q., Xu, X. Q. et al., Recursive SVMfeature selection and sample classification for mass-spec-trometry and microarray data. BMC Bioinformatics 2006, 7,197.
[119] Hendriks, M. M., Smit, S., Akkermans, W. L., Reijmers, T. H.et al., How to distinguish healthy from diseased? Classifi-cation strategy for mass spectrometry-based clinical pro-teomics. Proteomics 2007, 7, 3672–3680.
[120] Belluco, C., Petricoin, E. F., Mammano, E., Facchiano, F. etal., Serum proteomic analysis identifies a highly sensitiveand specific discriminatory pattern in stage 1 breast cancer.Ann. Surg. Oncol. 2007, 14, 2470–2476.
[121] Petricoin, E. F., Ardekani, A. M., Hitt, B. A., Levine, P. J. et al.,Use of proteomic patterns in serum to identify ovariancancer. Lancet 2002, 359, 572–577.
[122] Petricoin, E. F., 3rd, Ornstein, D. K., Paweletz, C. P., Arde-kani, A. et al., Serum proteomic patterns for detection ofprostate cancer. J. Natl. Cancer Inst. 2002, 94, 1576–1578.
[123] Hu, J., Coombes, K. R., Morris, J. S., Baggerly, K. A., Theimportance of experimental design in proteomic massspectrometry experiments: some cautionary tales. Brief.Funct. Genomic. Proteomic. 2005, 3, 322–331.
[124] Yasui, Y., Pepe, M., Hsu, L., Adam, B. L., Feng, Z., Partiallysupervised learning using an EM-boosting algorithm. Bio-metrics 2004, 60, 199–206.
[125] Wagner, M., Naik, D., Pothen, A., Protocols for diseaseclassification from mass spectrometry data. Proteomics2003, 3, 1692–1698.
[126] Ru, Q. C., Zhu, L. A., Silberman, J., Shriver, C. D., Label-freesemiquantitative peptide feature profiling of human breastcancer and breast disease sera via two-dimensional liquidchromatography-mass spectrometry. Mol. Cell. Proteom-ics 2006, 5, 1095–1104.
[127] Karp, N. A., Spencer, M., Lindsay, H., O’Dell, K., Lilley, K. S.,Impact of replicate types on proteomic expression analy-sis. J. Proteome Res. 2005, 4, 1867–1871.
[128] Masselon, C., Pasa-Tolic, L., Tolic, N., Anderson, G. A. et al.,Targeted comparative proteomics by liquid chromatogra-phy-tandem Fourier ion cyclotron resonance mass spec-trometry. Anal. Chem. 2005, 77, 400–406.
[129] Weckwerth, W., Wenzel, K., Fiehn, O., Process for the inte-grated extraction, identification and quantification ofmetabolites, proteins and RNA to reveal their co-regulationin biochemical networks. Proteomics 2004, 4, 78–83.
[130] Gaspari, M., Verhoeckx, K. C., Verheij, E. R., van der Greef,J., Integration of two-dimensional LC-MS with multivariatestatistics for comparative analysis of proteomic samples.Anal. Chem. 2006, 78, 2286–2296.
[131] Kemperman, R. F., Horvatovich, P. L., Hoekman, B., Reij-mers, T. H. et al., Comparative urine analysis by liquidchromatography-mass spectrometry and multivariate sta-tistics: Method development, evaluation, and applicationto proteinuria. J. Proteome Res. 2007, 6, 194–206.
[132] Kong, S. W., Pu, W. T., Park, P. J., A multivariate approachfor integrating genome-wide expression data and biologi-cal knowledge. Bioinformatics 2006, 22, 2373–2380.
© 2008 WILEY-VCH Verlag GmbH & Co. KGaA, Weinheim www.proteomics-journal.com

Proteomics 2008, 8, 731–749 Bioinformatics 749
[133] Scholz, M., Gatzek, S., Sterling, A., Fiehn, O., Selbig, J.,Metabolite fingerprinting: Detecting biological features byindependent component analysis. Bioinformatics 2004, 20,2447–2454.
[134] Scholz, M., Selbig, J., Visualization and analysis of molec-ular data. Methods Mol. Biol. 2007, 358, 87–104.
[135] Steuer, R., Morgenthal, K., Weckwerth, W., Selbig, J., Agentle guide to the analysis of metabolomic data. MethodsMol. Biol. 2007, 358, 105–126.
[136] Weckwerth, W., Metabolomics: from pattern recognition tobiological interpretation. Drug Discov. Today 2005, 10,1551–1558.
[137] Searls, D. B., Data integration: challenges for drug dis-covery. Nat. Rev. Drug Discov. 2005, 4, 45–58.
[138] Patwardhan, A. J., Strittmatter, E. F., Camp, D. G., 2nd,Smith, R. D., Pallavicini, M. G., Quantitative proteomeanalysis of breast cancer cell lines using 18O-labeling andan accurate mass and time tag strategy. Proteomics 2006,6, 2903–2915.
[139] Shen, Y., Tolic, N., Masselon, C., Pasa-Tolic, L. et al., Ultra-sensitive proteomics using high-efficiency on-line micro-SPE-nanoLC-nanoESI MS and MS/MS. Anal. Chem. 2004,76, 144–154.
[140] Wang, W., Zhou, H., Lin, H., Roy, S. et al., Quantification ofproteins and metabolites by mass spectrometry withoutisotopic labeling or spiked standards. Anal. Chem. 2003,75, 4818–4826.
© 2008 WILEY-VCH Verlag GmbH & Co. KGaA, Weinheim www.proteomics-journal.com