Embed Size (px)
Citation preview
Review of Asset Allocation2012 Capital Market Assumptions
State Universities Retirement System of IllinoisState Universities Retirement System of IllinoisJune 14, 2012
Exhibit 1
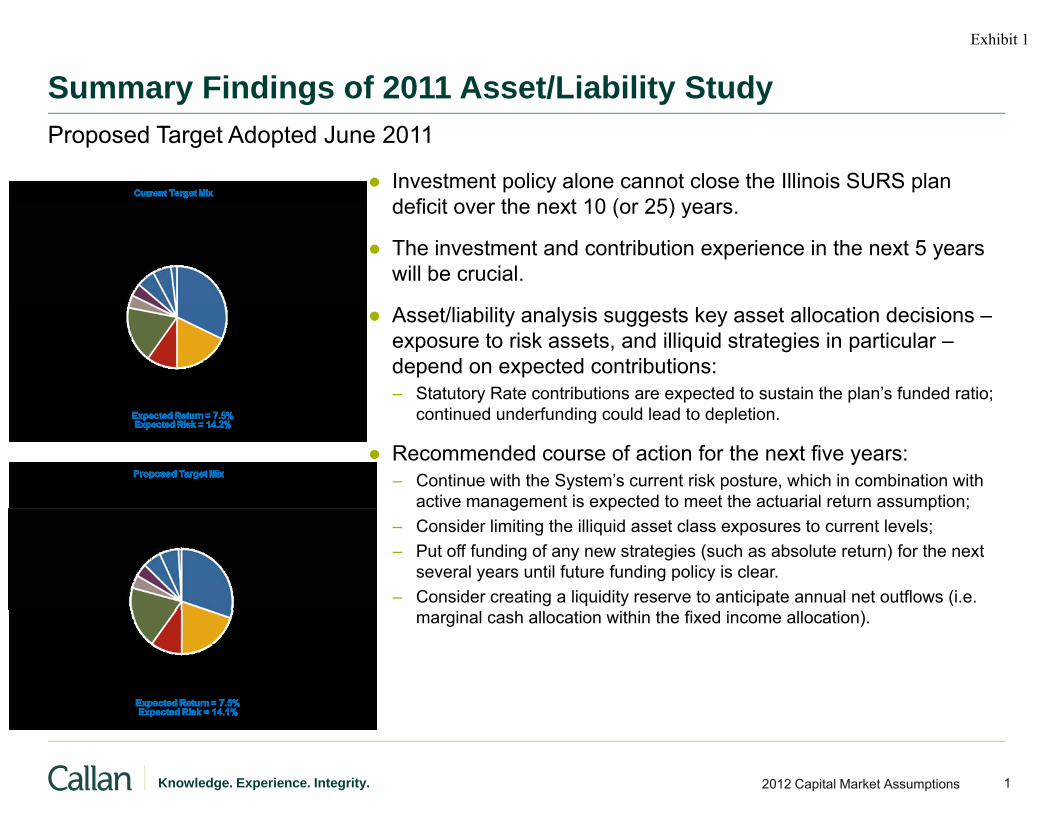
Summary Findings of 2011 Asset/Liability Studyy g y yProposed Target Adopted June 2011
● Investment policy alone cannot close the Illinois SURS plan deficit over the next 10 (or 25) yearsdeficit over the next 10 (or 25) years.
● The investment and contribution experience in the next 5 years will be crucial.
● Asset/liability analysis suggests key asset allocation decisions –exposure to risk assets, and illiquid strategies in particular –depend on expected contributions: – Statutory Rate contributions are expected to sustain the plan’s funded ratio;
continued underfunding could lead to depletion.
● Recommended course of action for the next five years:– Continue with the System’s current risk posture, which in combination with
active management is expected to meet the actuarial return assumption;g p p ;– Consider limiting the illiquid asset class exposures to current levels;– Put off funding of any new strategies (such as absolute return) for the next
several years until future funding policy is clear.– Consider creating a liquidity reserve to anticipate annual net outflows (i.e.
marginal cash allocation within the fixed income allocation).
12012 Capital Market AssumptionsKnowledge. Experience. Integrity.
Exhibit 1
2012 Capital Market Projections – Diminished Expectationsp j p
● 2011 began with the economy growing slowly but steadily and the capital markets were poised for
Economic Growth Continues But Market Remains Wary; Outlook Downgraded
● 2011 began with the economy growing slowly but steadily, and the capital markets were poised for modest growth.
● Everything appeared to unravel in the spring:– Stimulus “disappeared” and the inventory cycle stopped short.– Economic reports seemed to suddenly weaken – jobs spending housingEconomic reports seemed to suddenly weaken jobs, spending, housing.– Japan suffered the ravages of a tsunami and nuclear disaster.– Europe’s sovereign debt crisis worsened.– Arab Spring raised hopes, fears and geopolitical volatility.– Federal budget debacle led to a downgrade of U.S. sovereign debt.– Consumer business and investor confidence evaporated– Consumer, business and investor confidence evaporated.
● Capital markets freaked out, driven by politics and emotion rather than economics.– Equity hammered mercilessly through Q3 2011, retail investors fled risk, Treasuries rallied.– Interest rates headed even lower.
Q3 d Q4 i t t d t t b lid th j b k t i d C● Q3 and Q4 economic reports turned out to be solid, even the job market improved. Consumers released pent-up demand at Christmas, contradicting gloomy sentiment. However…
● Confidence in U.S. and European policy-making has hit new lows.– The U.S. debt-ceiling outcome kicked the can down the road. January 2013 features a triple-header of fiscal policy
events:events:● Expiration of Bush income tax cuts,● Expiration of payroll tax cut,● Automatic spending cuts triggered in the absence of Congressional action.
● “Temporary shocks” have lost credibility as explanation of softer global growth. Weakness looks longer-lasting; potential long term trend growth may be moving to a new lower plane
22012 Capital Market AssumptionsKnowledge. Experience. Integrity.
lasting; potential long-term trend growth may be moving to a new, lower plane.
Exhibit 1
The Economy and the Capital Market Outlooky p
C ll ’ tl k● Callan’s outlook:– Inflation will likely drift higher, but not immediately. Painfully low interest rates will persist, now that the
Fed has “guaranteed” low rates through 2013, and “believes” rates will remain low through 2014. We expect interest rates to rise gradually after 2013.Hi t i i l t ill b h d t hi th h t di d th l– Historic nominal return averages will be hard to achieve over the short, medium and even the longer run.
– Stocks rallied in the fourth quarter of 2011, saving the results for the year. However, prospects for above-trend growth are weak; companies are strong enough to attain trend profit growth, but not a lot more.
– The housing market has yet to truly hit bottom, despite mortgage rates at an all-time low. The “shadow inventory” of homes yet to foreclose still hangs over the marketinventory of homes yet to foreclose still hangs over the market.
– The chance that we could see another leg down on housing is one of the greatest risk to the economy, and to a deflationary spiral.
– Other key risks include a hard landing in China, and the destabilizing potential for the dissolution of the euro The European recession is already factored into market expectations but the potential exists foreuro. The European recession is already factored into market expectations, but the potential exists for trouble in the Chinese economy to send Europe into a deeper decline.
– The dollar should face substantial downward pressure as a result of U.S. fiscal and monetary policy. The problem, of course, is what other currency can take the dollar’s place?
– The path to a rational set of long-term capital market outcomes is likely through an ugly shorter termThe path to a rational set of long term capital market outcomes is likely through an ugly shorter term period of rising interest rates, capital losses in fixed income, and volatile equity markets.
32012 Capital Market AssumptionsKnowledge. Experience. Integrity.
Exhibit 1
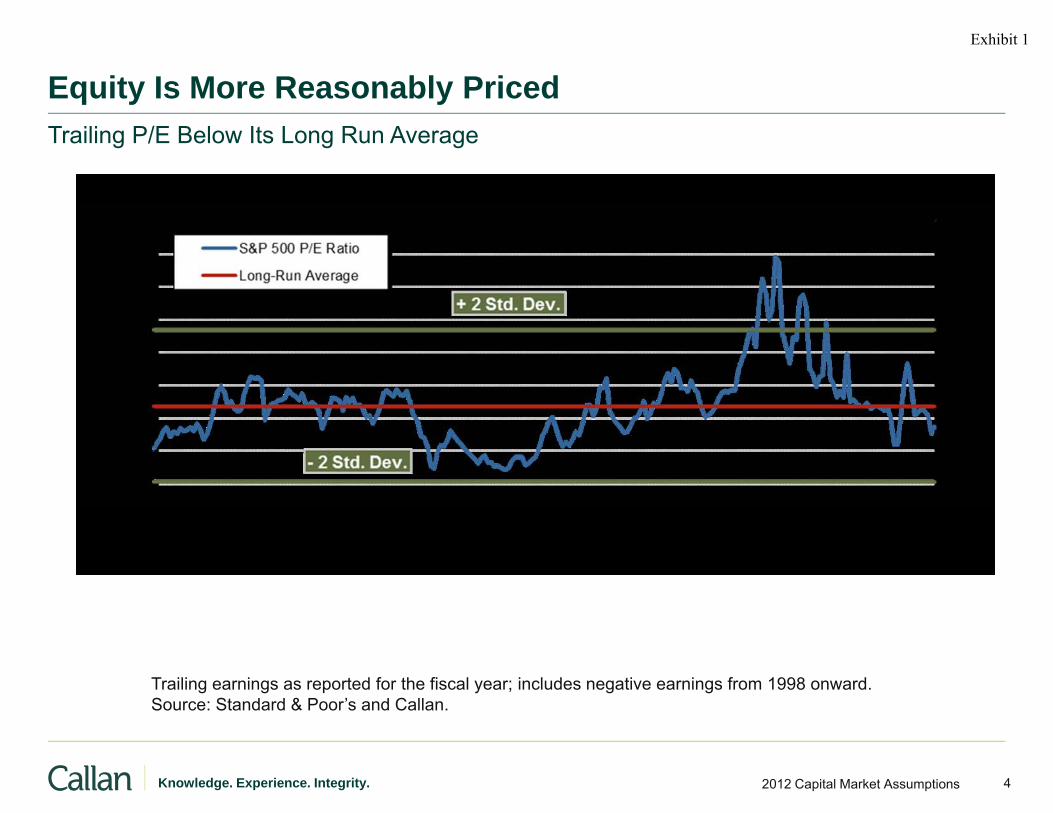
Equity Is More Reasonably Pricedq y yTrailing P/E Below Its Long Run Average
Trailing earnings as reported for the fiscal year; includes negative earnings from 1998 onward.Source: Standard & Poor’s and Callan.
42012 Capital Market AssumptionsKnowledge. Experience. Integrity.
Exhibit 1
Building US Equity Expectationsg q y p
Di id d i ld lik l t t t l l● Dividend yields likely to stay near current levels.– Financing uncertainty continues so cash unlikely to be returned to investors.– Fixed income yields expected to remain exceptionally low.
● Equity valuations moderate to attractive after market angst during 2010 and 2011 even after● Equity valuations moderate to attractive after market angst during 2010 and 2011, even after incorporating rally in Q1 2012.
● Corporate profits near long-term growth rate.– Companies may be able to sustain trend or above trend profit growth even in a weak recovery.p y p g y
● Company balance sheets are strong, but no one is eager to spend. Large cash holdings are a drag on ROE.
● Consumption still dominates economic growth● Consumption still dominates economic growth.– Unemployment high but finally declining,– Wealth depleted,– Deleveraging continues,
S i l i h d– Savings replenished.
● Exports remain strong, in spite of strengthening dollar but impact muted by size of economy.
● Have we entered a new era of lower trend growth in GDP?
52012 Capital Market AssumptionsKnowledge. Experience. Integrity.
Exhibit 1
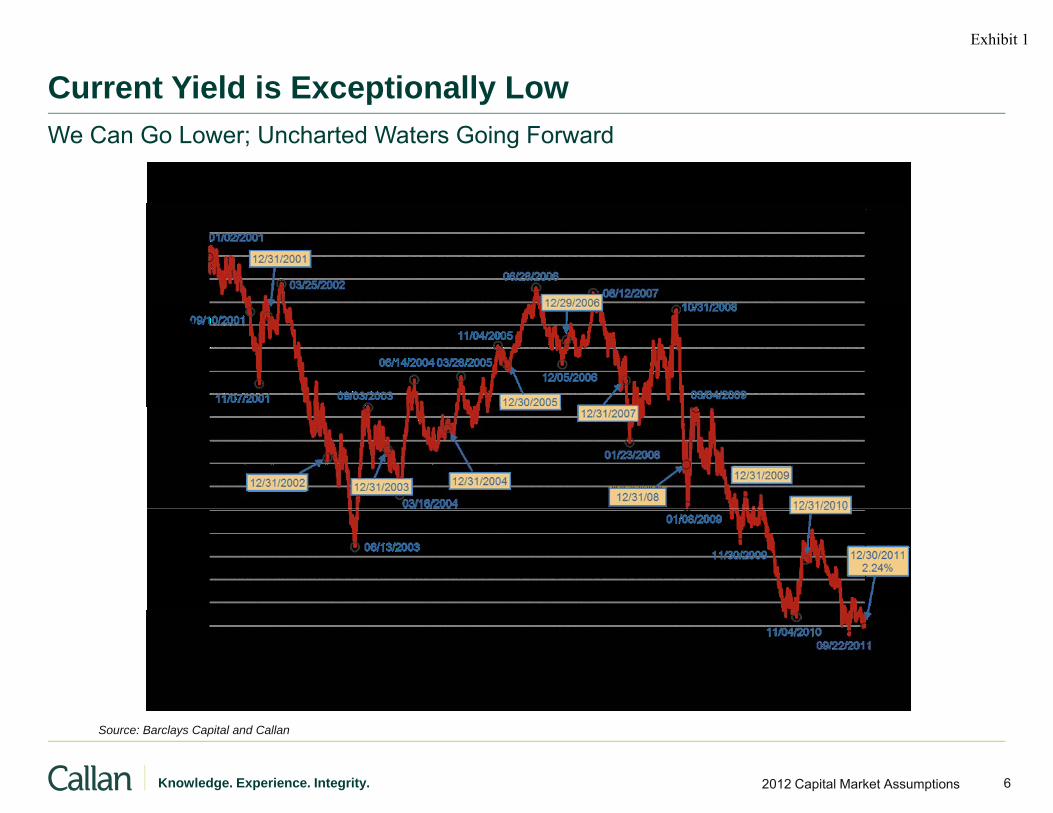
Current Yield is Exceptionally Lowp yWe Can Go Lower; Uncharted Waters Going Forward
62012 Capital Market AssumptionsKnowledge. Experience. Integrity.
Source: Barclays Capital and Callan
Exhibit 1
Building Fixed Income Expectationsg p
2011 lt t th i i t t t f ll b d k t t d 7 8%● 2011 results yet another surprise – interest rates fell, broad market generated 7.8% return (BC Aggregate).– Credit event of 2011: downgrade of U.S. Treasury debt by S&P.– Result of downgrade: a flight to quality. Treasuries rallied. The market speaks.g g q y p
● The path to future return matters:– Inflation– Composition of the market– Expected spreads and risk premiums– Current yields – level, slope of the yield curve.
● Hard to be enthusiastic about fixed income returns given current yields, environment and likely economic path to growth.– Calling the bottom of the “long term” interest rate cycle has been perilous. Nevertheless, the risk that rates
will move higher is likely greater than the potential for rates to move lower.
72012 Capital Market AssumptionsKnowledge. Experience. Integrity.
Exhibit 1
2012 Capital Market Expectationsp p
B d t d d t 3 25% d f 3 75% W t i t t t t i lik l ft
Changes From 2011
● Bond returns reduced to 3.25%, down from 3.75%. We expect interest rates to rise, likely after 2013, resulting in capital loss before higher yields kick in. We expect cash yields to reach 3.0% and 10-year Treasury yields to reach 5% by the end of our ten-year projection.
● Project an upward sloping yield curve but only a slim risk premium for bonds over cash (0 5%)● Project an upward sloping yield curve, but only a slim risk premium for bonds over cash (0.5%).
● Building equity returns from long-term fundamentals, we find it hard to get to 8%: 2.5-3.0% real GDP growth, which means 5-5.5% nominal earnings growth, 2% dividend yield. Nothing expected from the “buyback yield”. Equity suffered in the broad flight to quality in 2011, particularly outside the U.S., and looks reasonably priced, but is it “cheap”? Broad U.S. equity expectations are reduced 25 bps, from 8.0% to 7.75%. Broad non-U.S. equity returns are decreased by a similar amount.
E it i k i d t fl t t i d liti l t i t i f d● Equity risk increased to reflect greater economic and political uncertainty going forward.
● Real estate return reduced to 6.4% from 6.75%, reflecting income returns holding up at 5-6% but reduced expectations for appreciation.
● Hedge fund expectations of T-bill plus 2.75% suggests a return of 5.5%.
82012 Capital Market AssumptionsKnowledge. Experience. Integrity.
Exhibit 1
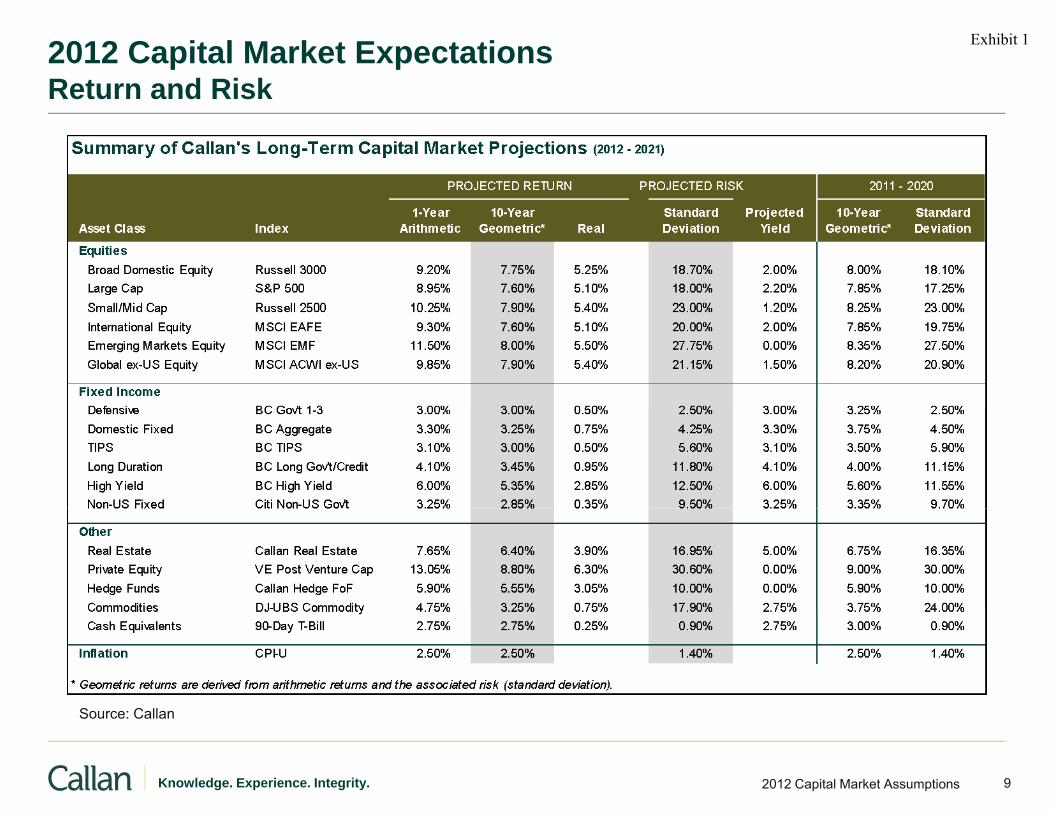
2012 Capital Market ExpectationsReturn and Risk
Source: Callan
92012 Capital Market AssumptionsKnowledge. Experience. Integrity.
Source: Callan
Exhibit 1
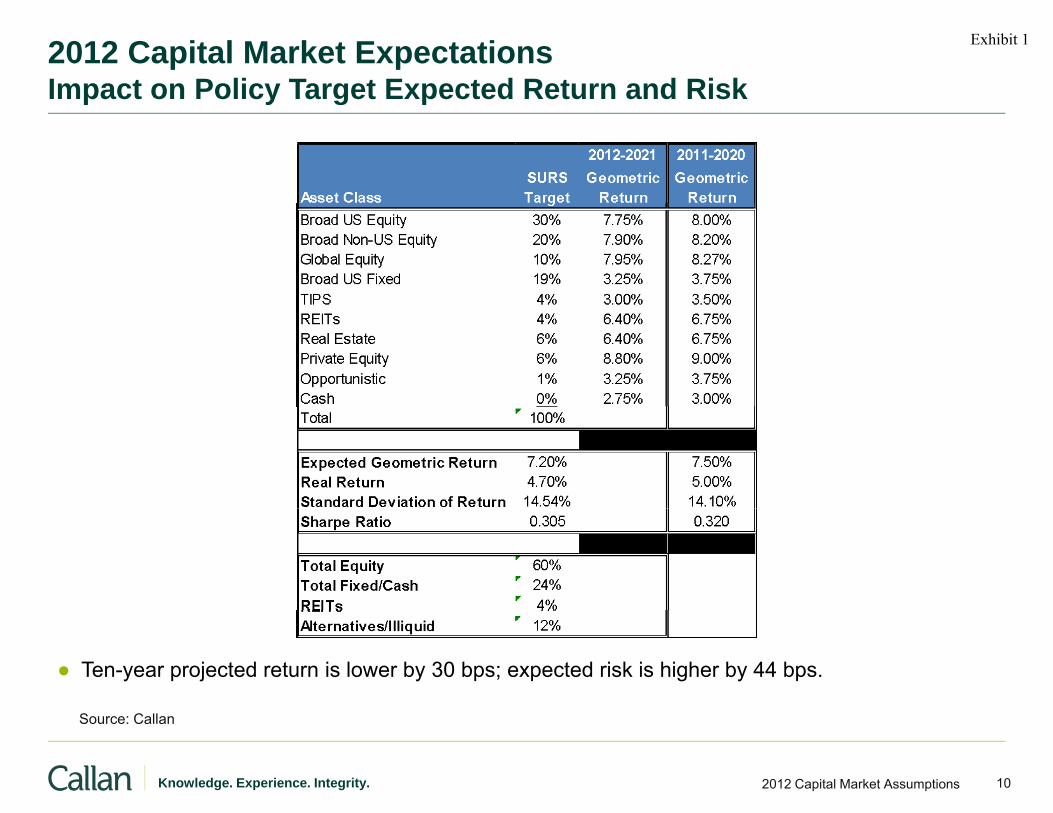
2012 Capital Market ExpectationsImpact on Policy Target Expected Return and Riskp y g p
● Ten-year projected return is lower by 30 bps; expected risk is higher by 44 bps.
102012 Capital Market AssumptionsKnowledge. Experience. Integrity.
Source: Callan
Exhibit 1
Long-Term Vision and Short-Term Realityg y
● Fallout of 2012 capital market expectations: how to make investors unhappy in 3 easy numbers?● Fallout of 2012 capital market expectations: how to make investors unhappy in 3 easy numbers?– Bonds close to 3%,– Stocks below 8%,– 60/40 at or below 7%…
O 2012 b fl i i f h f i fl i d f h i l k● Our 2012 numbers reflect our optimism for the economy, for inflation, and for the capital markets.
● Potential danger (once the flight to quality passes) – investors will take on additional risk to compensate for capital market returns that are likely to be well below historical averages. We do not believe investors are likely to be compensated for such risk taking in the shorter term.
● Fixed income is a conundrum for investors. No other investment offers the same anchor to windward and protection in a flight to quality. Yet low yields and the prospect for rising rates (eventually) spell dismal returns.– How does one keep invested in fixed income – a prudent investor’s anchor to windward -when we all KNOW it’s
going to lose money while interest rates rise?
● Stocks are now cheaper, a benefit available to disciplined rebalancing.
● Other strategies to manage risk:A ti t i it d fi d i t t k d t f t iti d t t i l til– Active management in equity and fixed income to take advantage of opportunities and protect in a volatile environment.
– Global opportunities in equity and debt; yields, currency.– Absolute return strategies, both long-only and hedged.
112012 Capital Market AssumptionsKnowledge. Experience. Integrity.
Exhibit 1
Time Horizon for Capital Market Expectations and Asset-Liability Analysisy y
O ti i l h l t li biliti d il h ld i t i l● Open, active pension plans have very long term liabilities, and necessarily should maintain a long term perspective for investment strategy (assuming adequate funding).
● Callan’s asset-liability analysis typically focuses on a planning cycle of 5-10 years, incorporating current market conditions and the path from these short term conditions to long termcurrent market conditions and the path from these short term conditions to long term expectations.
● Over much of Callan’s history, the difference between our shorter-term expectations and our long term numbers was modest; for most planning purposes our short term and long term expectations were the same.
● Current conditions, particularly in the fixed income markets, suggest substantial difference in capital market expectations depending on time horizon, and the path from the current conditions t th l t t tito the long term expectations.
● Recall the theme of the current Callan 10-year projections: The path to a rational set of long-term capital market outcomes is likely through an ugly shorter term period of rising interest rates, capital losses in fixed income and volatile equity marketscapital losses in fixed income, and volatile equity markets.
122012 Capital Market AssumptionsKnowledge. Experience. Integrity.
Exhibit 1
Appendix ILong-term Historical Perspective
132012 Capital Market AssumptionsKnowledge. Experience. Integrity.
Exhibit 1
10-Year vs. 30-Year Capital Market Expectationsp p
O 30 ti h i it l k t t ti ld f l● Over a 30-year time horizon, our capital market expectations would reference long-term historical mean results, with an overlay of informed judgment. Key elements to consider:– Nominal returns
I fl ti– Inflation– Real returns– Risk premia – bonds over cash, stocks over bonds, long duration over short– Long term underlying economic growth (real GDP).
C● Current expectations:– Stocks: 7.75% nominal, 5.25% real, 4.50% premium over bonds– Bonds: 3.25% nominal, 0.75% real, 0.50% premium over cash– Cash: 2.75% nominal, 0.25% real
Inflation: 2 5%– Inflation: 2.5%– Underlying economic growth (real GDP) – 2 to 3% per year.
● Long-term (30-year) expectations:– Stocks: 9.5% nominal, 6.5% real, 4.5% premium over bonds– Bonds: 5% nominal, 2% real, 1% premium over cash– Cash: 4% nominal, 1% real– Inflation: 3.0%– Underlying economic growth (real GDP) – 3 to 3.5% per year.
142012 Capital Market AssumptionsKnowledge. Experience. Integrity.
Exhibit 1
10-Year vs. 30-Year Capital Market Expectationsp p
U d C ll ’ t 5 10 t ti t i l i tit ti l li t t i i t● Under Callan’s current 5-10 year expectations, a typical institutional policy target mix is not expected to generate an annual return anywhere near 8.0%; even 7.0% will be a challenge.– Assumed returns for pension valuations are usually between 7% and 8%.
● Substantially greater exposure to risk assets than the typical policy mix would be required to● Substantially greater exposure to risk assets than the typical policy mix would be required to generate an 8% return over the 5-10 year horizon, potentially in conflict with many investors’ expressed tolerance for risk.
● Appealing to expectations with a 30-year time horizon, a typical institutional policy mix may pp g p y yp p y yindeed be expected to generate an 8% return. However, long-term perspective must be maintained. The path to a long-term 8% return will include extended periods of returns above the 8% (the 1990s, 2003-2007) and periods below the 8% (the decade that encompasses the 2003-07 period).p )
152012 Capital Market AssumptionsKnowledge. Experience. Integrity.
Exhibit 1
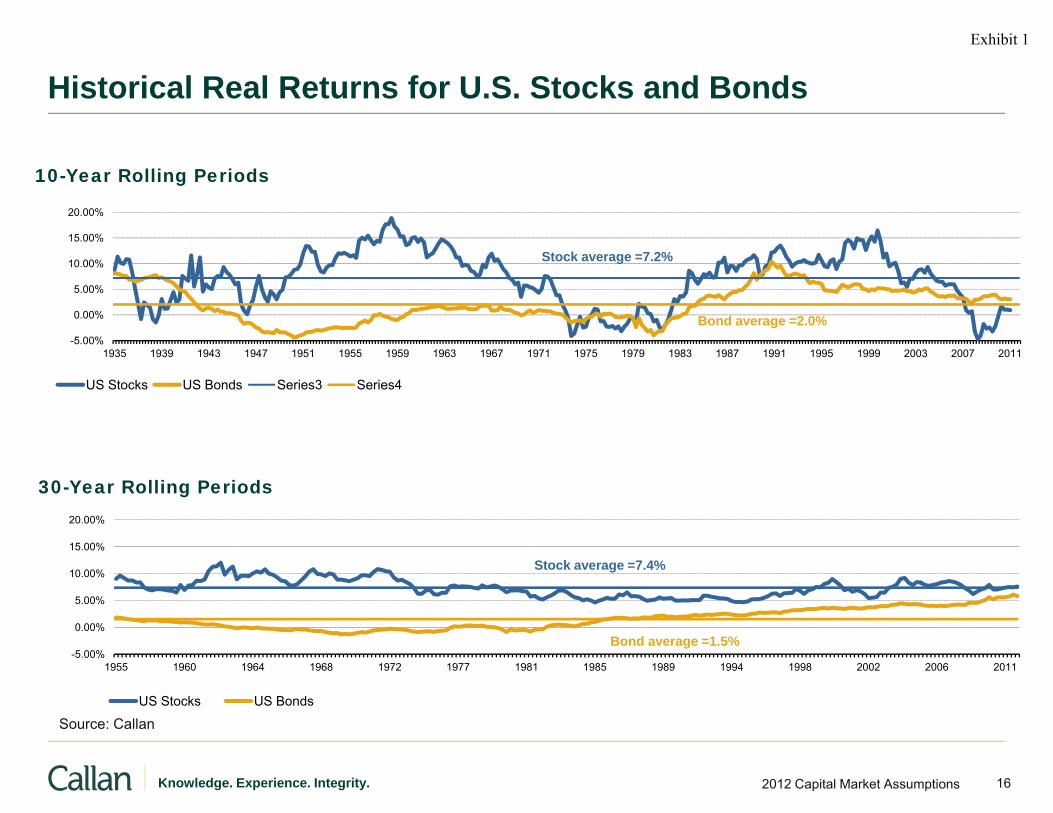
Historical Real Returns for U.S. Stocks and Bonds
10-Year Rolling Periods
5.00%
10.00%
15.00%
20.00%
Stock average =7.2%
-5.00%
0.00%
1935 1939 1943 1947 1951 1955 1959 1963 1967 1971 1975 1979 1983 1987 1991 1995 1999 2003 2007 2011
US Stocks US Bonds Series3 Series4
Bond average =2.0%
30-Year Rolling Periods
5.00%
10.00%
15.00%
20.00%
Stock average =7.4%
-5.00%
0.00%
1955 1960 1964 1968 1972 1977 1981 1985 1989 1994 1998 2002 2006 2011
US Stocks US Bonds
Bond average =1.5%
162012 Capital Market AssumptionsKnowledge. Experience. Integrity.
Source: Callan
Exhibit 1
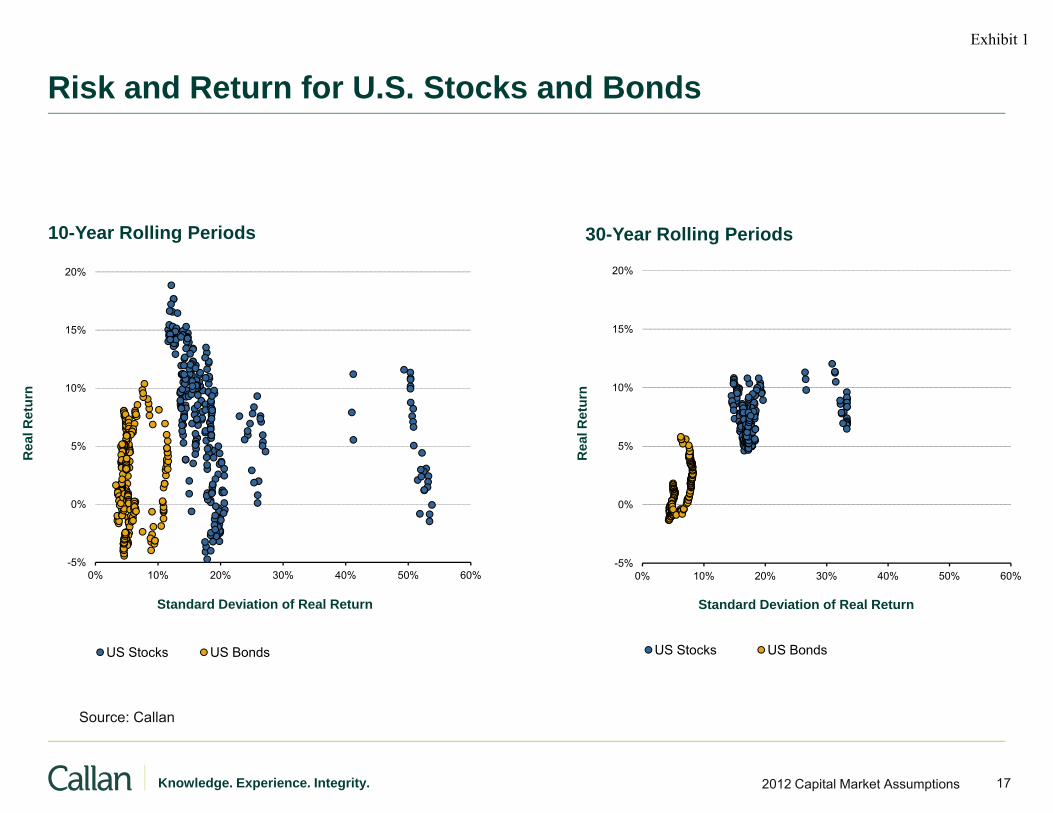
Risk and Return for U.S. Stocks and Bonds
20%
10-Year Rolling Periods
20%
30-Year Rolling Periods
10%
15%
urn 10%
15%
urn
0%
5%
Rea
l Ret
0%
5%
Rea
l Ret
-5%0% 10% 20% 30% 40% 50% 60%
Standard Deviation of Real Return
-5%0% 10% 20% 30% 40% 50% 60%
Standard Deviation of Real Return
US Stocks US Bonds US Stocks US Bonds
S C ll
172012 Capital Market AssumptionsKnowledge. Experience. Integrity.
Source: Callan
Exhibit 1
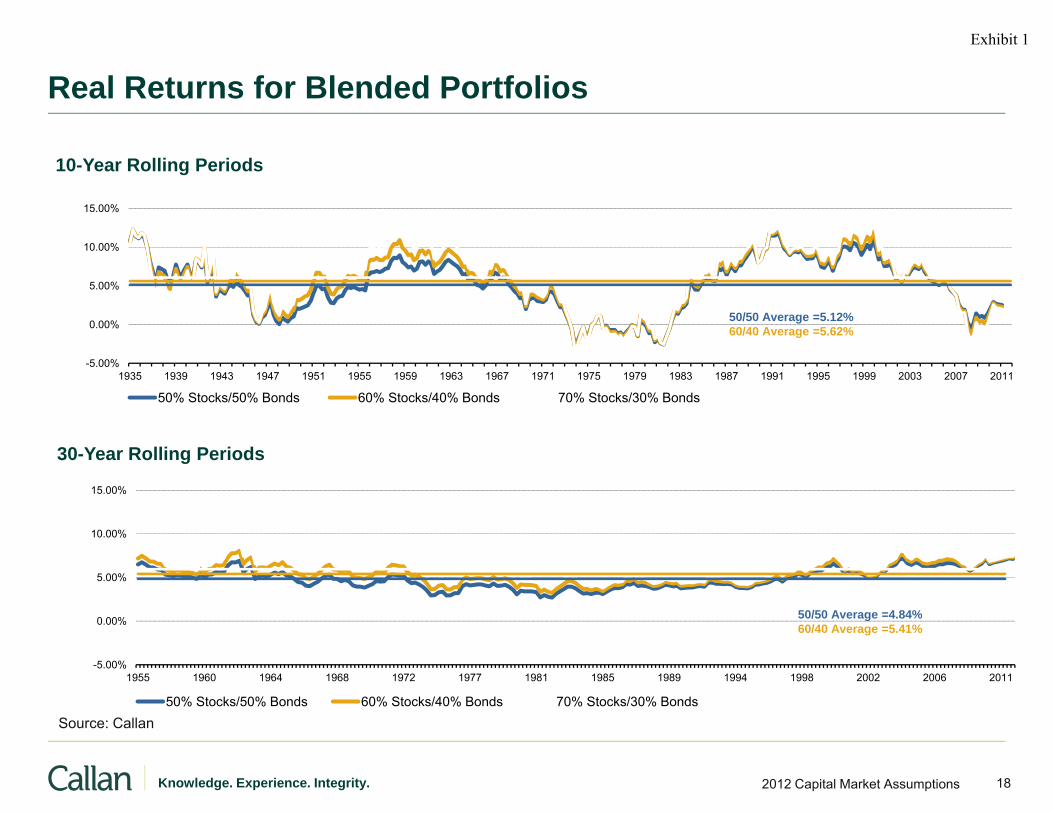
Real Returns for Blended Portfolios
10-Year Rolling Periods
5.00%
10.00%
15.00%
-5.00%
0.00%
1935 1939 1943 1947 1951 1955 1959 1963 1967 1971 1975 1979 1983 1987 1991 1995 1999 2003 2007 2011
50% Stocks/50% Bonds 60% Stocks/40% Bonds 70% Stocks/30% Bonds
50/50 Average =5.12%60/40 Average =5.62%70/30 Average =6.07%
15.00%
30-Year Rolling Periods
5.00%
10.00%
50/50 A 4 84%
-5.00%
0.00%
1955 1960 1964 1968 1972 1977 1981 1985 1989 1994 1998 2002 2006 2011
50% Stocks/50% Bonds 60% Stocks/40% Bonds 70% Stocks/30% Bonds
50/50 Average =4.84%60/40 Average =5.41%70/30 Average =5.95%
182012 Capital Market AssumptionsKnowledge. Experience. Integrity.
Source: Callan
Exhibit 1
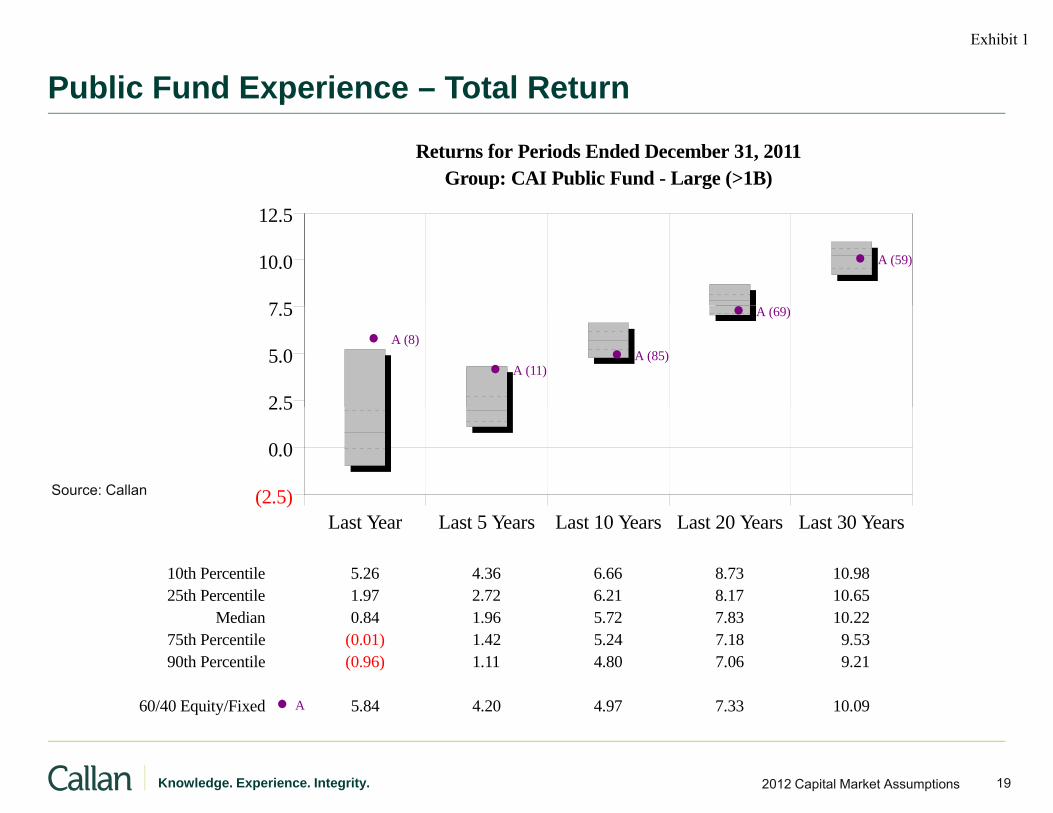
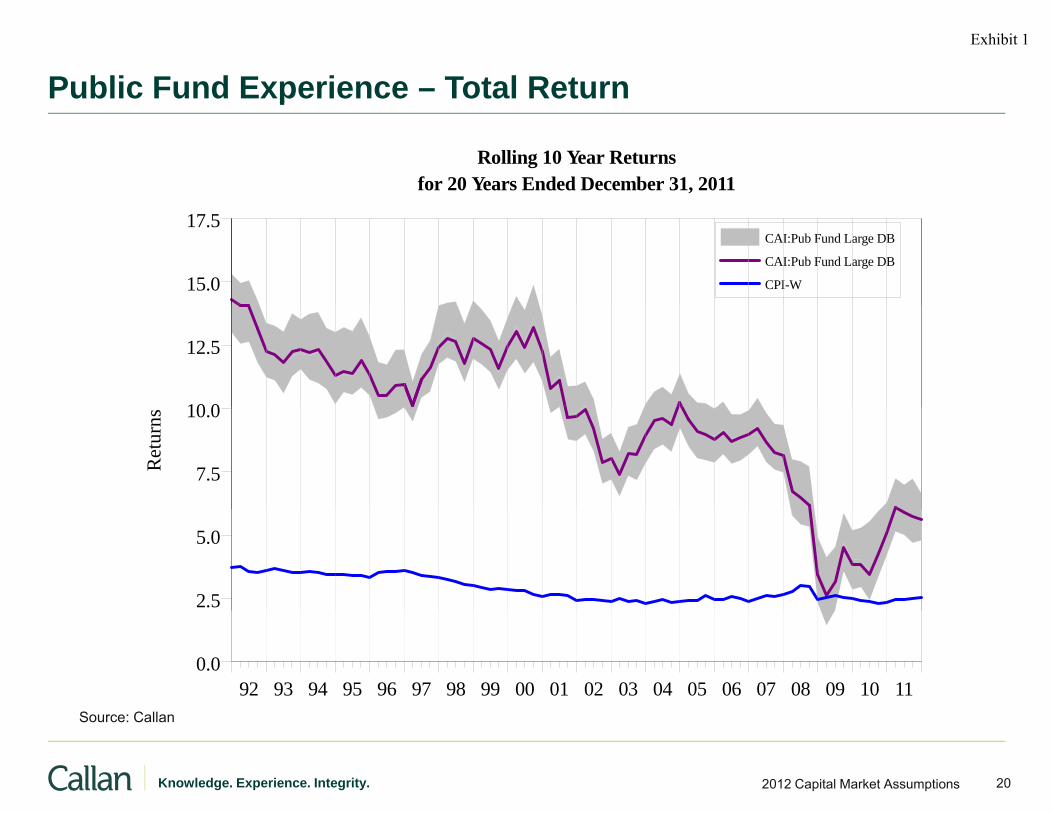
Public Fund Experience – Total Returnp
Group: CAI Public Fund - Large (>1B)Returns for Periods Ended December 31, 2011
7 5
10.0
12.5
A (59)
2 5
5.0
7.5A (8)
A (11)A (85)
A (69)
(2.5)
0.0
2.5
Source: Callan
Last Year Last 5 Years Last 10 Years Last 20 Years Last 30 Years
10th Percentile 5.26 4.36 6.66 8.73 10.9825th Percentile 1.97 2.72 6.21 8.17 10.65
Median 0.84 1.96 5.72 7.83 10.2275th Percentile (0.01) 1.42 5.24 7.18 9.5390th Percentile (0.96) 1.11 4.80 7.06 9.21
60/40 Equity/Fixed A 5.84 4.20 4.97 7.33 10.09
192012 Capital Market AssumptionsKnowledge. Experience. Integrity.
q y
Exhibit 1
Public Fund Experience – Total Returnp
for 20 Years Ended December 31, 2011Rolling 10 Year Returns
15.0
17.5CAI:Pub Fund Large DB
CAI:Pub Fund Large DB
CPI-W
10 0
12.5
7.5
10.0
Ret
urns
2.5
5.0
92 93 94 95 96 97 98 99 00 01 02 03 04 05 06 07 08 09 10 110.0
S C ll
202012 Capital Market AssumptionsKnowledge. Experience. Integrity.
Source: Callan
Exhibit 1
Appendix IIAdditional Capital Market Analysis
212012 Capital Market AssumptionsKnowledge. Experience. Integrity.
Exhibit 1
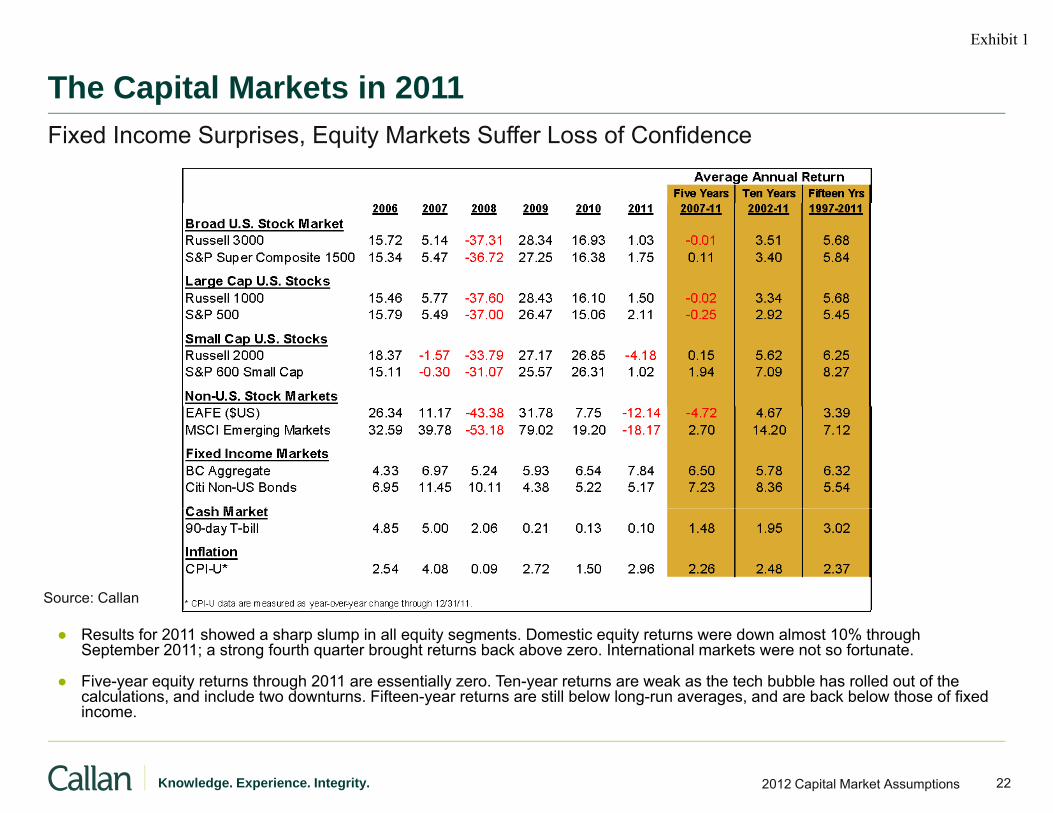
The Capital Markets in 2011pFixed Income Surprises, Equity Markets Suffer Loss of Confidence
Source: Callan
● Results for 2011 showed a sharp slump in all equity segments. Domestic equity returns were down almost 10% through September 2011; a strong fourth quarter brought returns back above zero. International markets were not so fortunate.
● Five-year equity returns through 2011 are essentially zero. Ten-year returns are weak as the tech bubble has rolled out of the calculations, and include two downturns. Fifteen-year returns are still below long-run averages, and are back below those of fixed income
222012 Capital Market AssumptionsKnowledge. Experience. Integrity.
income.
Exhibit 1
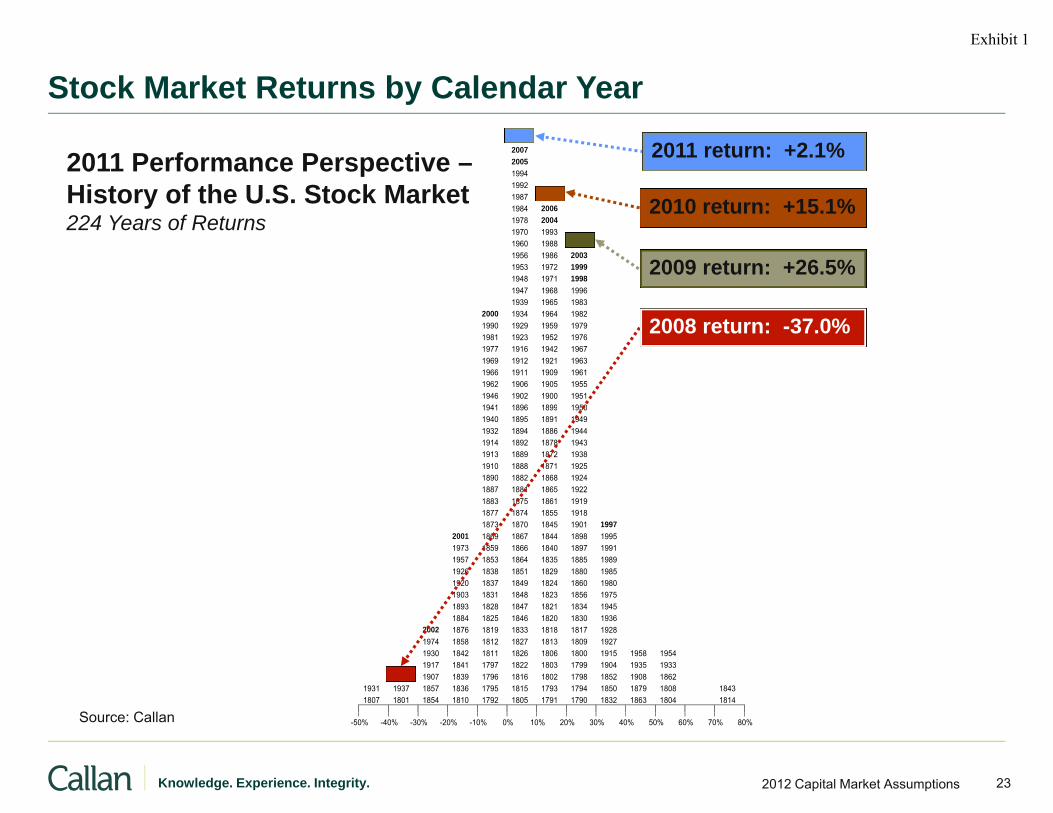
Stock Market Returns by Calendar Yeary
2011 Performance Perspective –History of the U.S. Stock Market
2011 2007 2005
1994 1992 1987 2010 2010 return: +15 1%
2011 return: +2.1%
sto y o t e U S Stoc a et224 Years of Returns
1984 2006 1978 2004 1970 1993
1960 1988 2009 1956 1986 2003 1953 1972 1999
1948 1971 1998 1947 1968 1996 1939 1965 1983
2010 return: +15.1%
2009 return: +26.5%
2000 1934 1964 1982 1990 1929 1959 1979 1981 1923 1952 1976
1977 1916 1942 1967 1969 1912 1921 1963 1966 1911 1909 1961
1962 1906 1905 1955 1946 1902 1900 1951 1941 1896 1899 1950
2008 return: -37.0%
1941 1896 1899 1950 1940 1895 1891 1949
1932 1894 1886 1944 1914 1892 1878 1943
1913 1889 1872 1938 1910 1888 1871 1925 1890 1882 1868 1924
1887 1881 1865 1922 1883 1875 1861 1919 1877 1874 1855 1918
1873 1870 1845 1901 1997 2001 1869 1867 1844 1898 1995 1973 1859 1866 1840 1897 1991
1957 1853 1864 1835 1885 1989 1926 1838 1851 1829 1880 1985 1920 1837 1849 1824 1860 1980
1903 1831 1848 1823 1856 1975 1893 1828 1847 1821 1834 1945 1884 1825 1846 1820 1830 1936
2002 1876 1819 1833 1818 1817 1928 1974 1858 1812 1827 1813 1809 1927 1930 1842 1811 1826 1806 1800 1915 1958 1954
1917 1841 1797 1822 1803 1799 1904 1935 1933 2008 1907 1839 1796 1816 1802 1798 1852 1908 1862
1931 1937 1857 1836 1795 1815 1793 1794 1850 1879 1808 1843 1807 1801 1854 1810 1792 1805 1791 1790 1832 1863 1804 1814
S C ll
232012 Capital Market AssumptionsKnowledge. Experience. Integrity.
-50% -40% -30% -20% -10% 0% 10% 20% 30% 40% 50% 60% 70% 80% Source: Callan
Exhibit 1
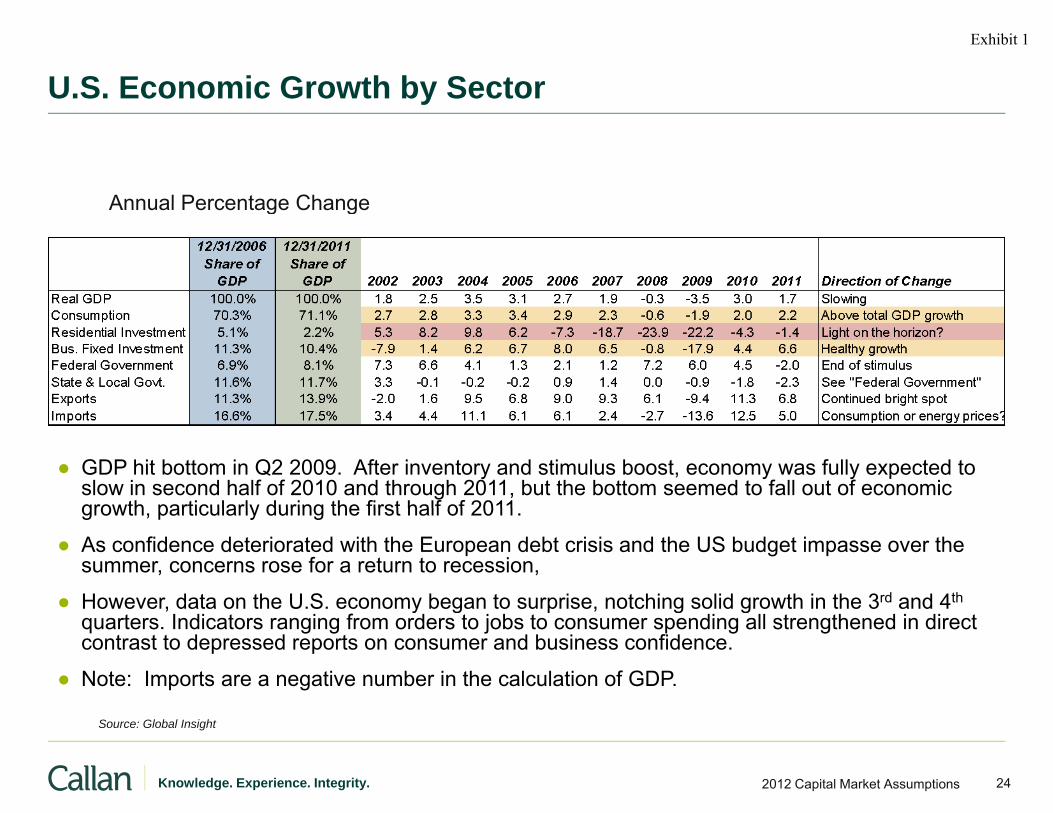
U.S. Economic Growth by Sectory
Annual Percentage ChangeAnnual Percentage Change
● GDP hit bottom in Q2 2009. After inventory and stimulus boost, economy was fully expected to slow in second half of 2010 and through 2011, but the bottom seemed to fall out of economic growth particularly during the first half of 2011growth, particularly during the first half of 2011.
● As confidence deteriorated with the European debt crisis and the US budget impasse over the summer, concerns rose for a return to recession,
● However, data on the U.S. economy began to surprise, notching solid growth in the 3rd and 4th, y g p , g gquarters. Indicators ranging from orders to jobs to consumer spending all strengthened in direct contrast to depressed reports on consumer and business confidence.
● Note: Imports are a negative number in the calculation of GDP.
242012 Capital Market AssumptionsKnowledge. Experience. Integrity.
Source: Global Insight
Exhibit 1
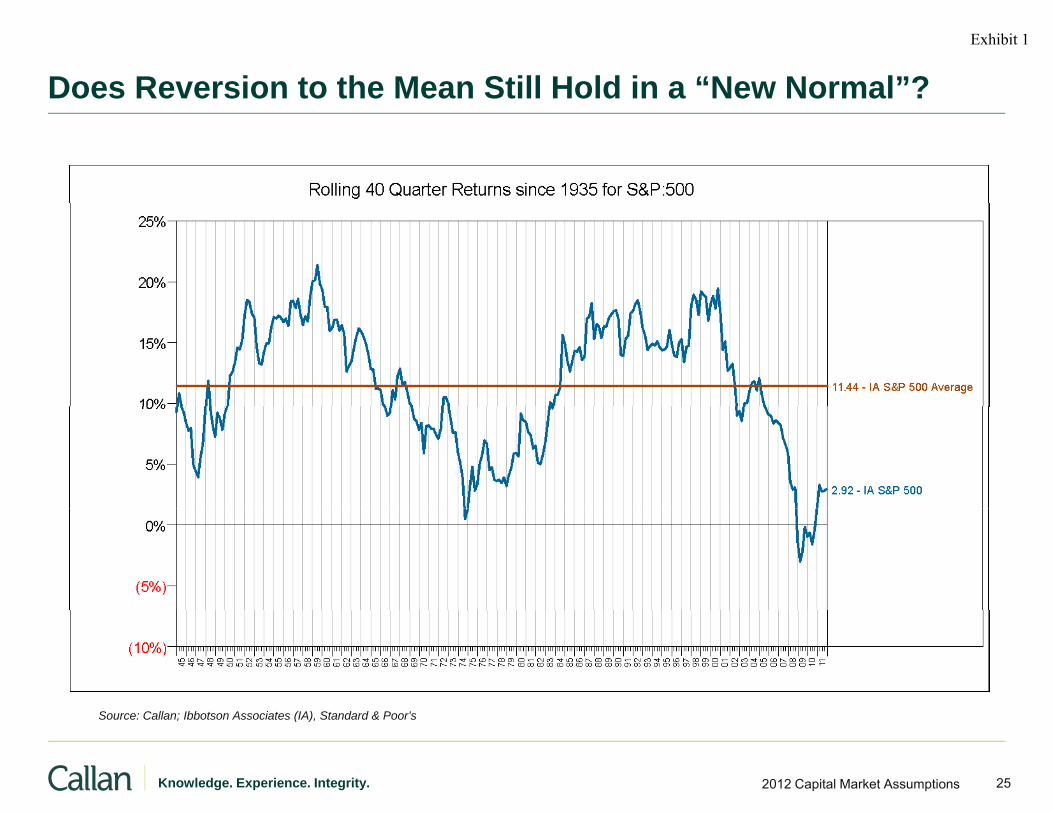
Does Reversion to the Mean Still Hold in a “New Normal”?
S C ll Ibb t A i t (IA) St d d & P ’
252012 Capital Market AssumptionsKnowledge. Experience. Integrity.
Source: Callan; Ibbotson Associates (IA), Standard & Poor’s
Exhibit 1
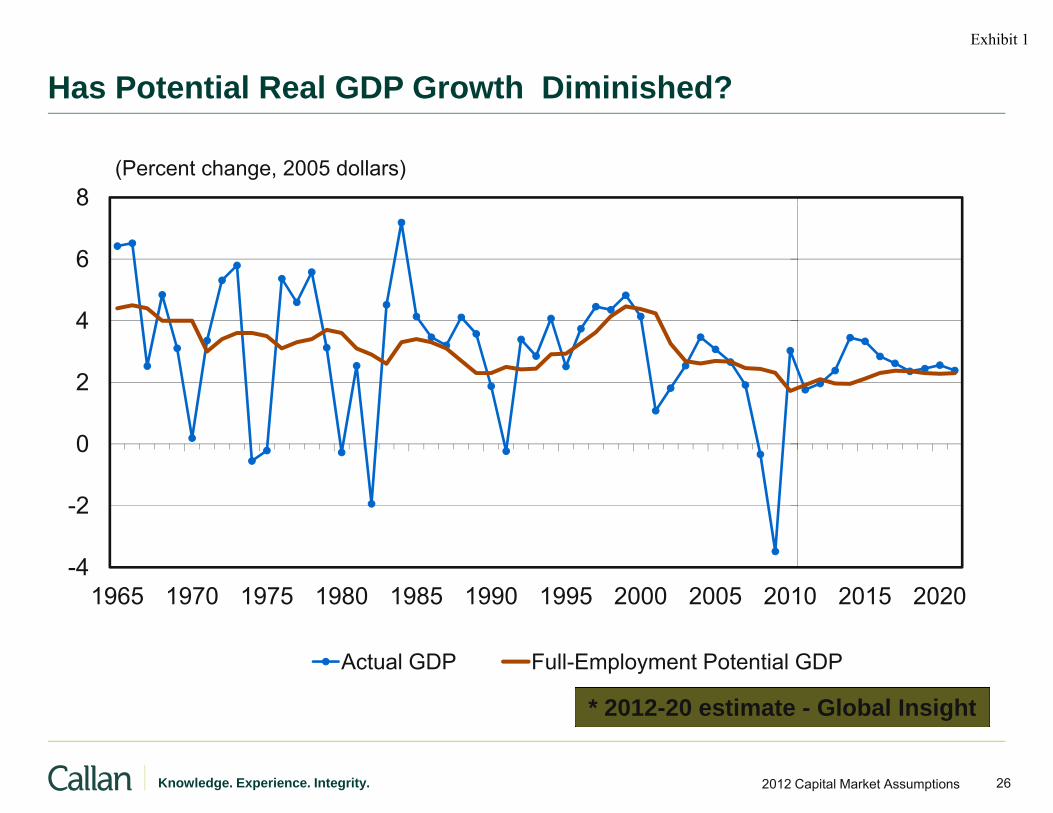
Has Potential Real GDP Growth Diminished?
8(Percent change, 2005 dollars)
6
8
2
4
-2
0
-4
2
1965 1970 1975 1980 1985 1990 1995 2000 2005 2010 2015 2020
Actual GDP Full-Employment Potential GDP
* 2012-20 estimate - Global Insight
262012 Capital Market AssumptionsKnowledge. Experience. Integrity.
2012 20 estimate Global Insight
Exhibit 1
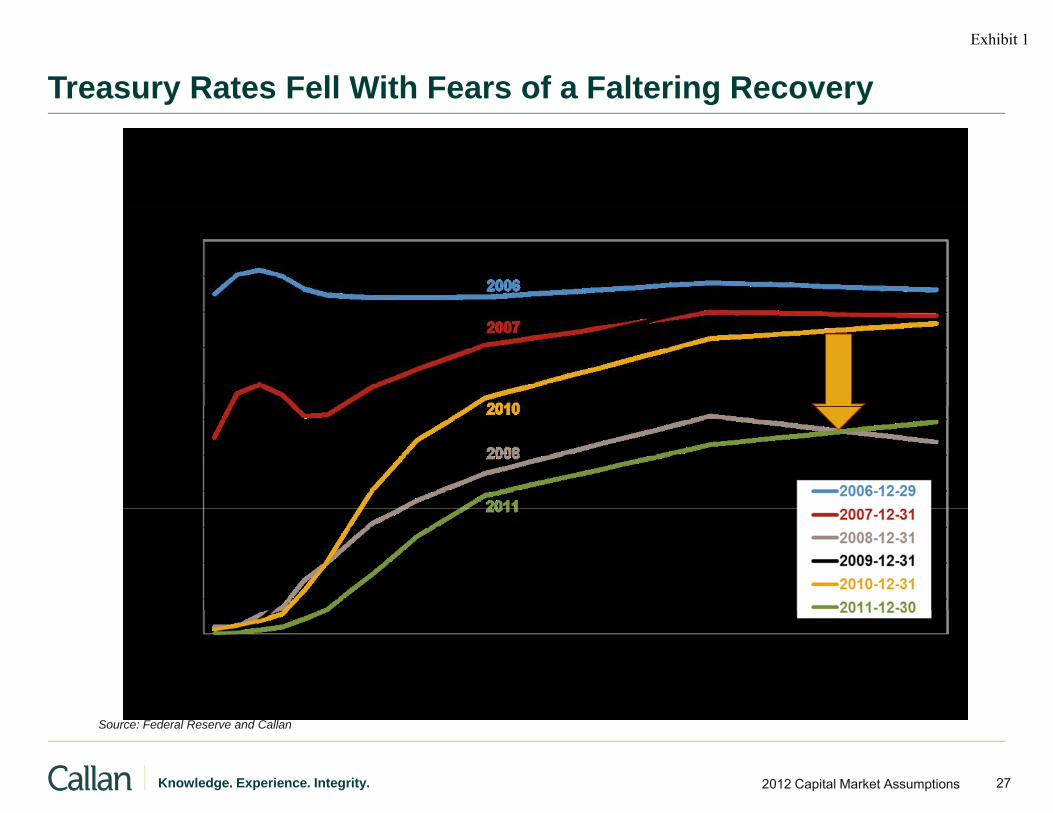
Treasury Rates Fell With Fears of a Faltering Recoveryy g y
272012 Capital Market AssumptionsKnowledge. Experience. Integrity.
Source: Federal Reserve and Callan
Exhibit 1
What Will The Fed Do?
Th F d i i d it h d t d 2 7% 2 9% th f 2011 3 3% 3 7% f 2012● The Fed is worried; it had expected 2.7%-2.9% growth for 2011, 3.3%-3.7% for 2012.
● 2011 came in at 1.7%.
● Global Insight (and consensus) forecast now: 2.0% (2012), 2.4% (2013).
● Fed has used its prime ammunition already.
● Fed “believes rates will remain very low until the end of 2014”.
● Market assumes no hike before 2014.
● Hurdle for QE III is high – but we may clear it.
282012 Capital Market AssumptionsKnowledge. Experience. Integrity.
Exhibit 1
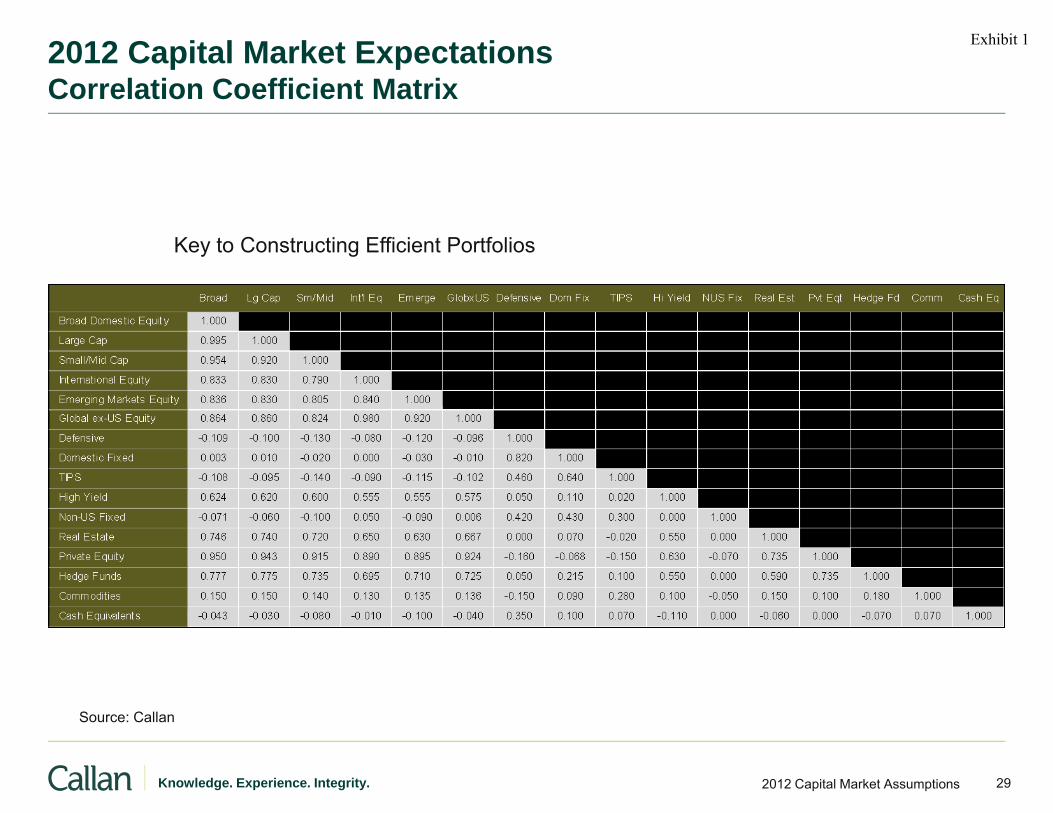
2012 Capital Market ExpectationsCorrelation Coefficient Matrix
Key to Constructing Efficient Portfolios
S C ll
292012 Capital Market AssumptionsKnowledge. Experience. Integrity.
Source: Callan
Exhibit 1