Embed Size (px)
Citation preview

Capital Market
Assumptions Update Quarter 4, 2015
Prepared by the Asset and Risk Modelling Team
Distribution Technology
10 February 2016

Capital Market Assumptions Update, Q4 2015
ii
Contents 1 Introduction .................................................................................................................................... 1
2 Investment assumptions ................................................................................................................. 2
3 Assumption methodology ............................................................................................................... 3
3.1 Price inflation .......................................................................................................................... 3
3.2 Volatilities and correlations .................................................................................................... 3
3.3 Expected returns ..................................................................................................................... 3
4 Strategic asset allocation .............................................................................................................. 10
5 Efficient frontier ............................................................................................................................ 11
6 Risk profile boundaries ................................................................................................................. 12
Appendix A : Asset classes on risk / reward space ............................................................................... 13
Appendix B : Changes in assumptions per asset classes ....................................................................... 14
Appendix C : DT allocation - projections ............................................................................................... 16
Appendix D : Total expense ratio ......................................................................................................... 18

Capital Market Assumptions Update, Q4 2015
iii
Figures Figure 1: UK gilt yield curve .................................................................................................................... 4
Figure 2: UK index-linked gilt yield curve ................................................................................................ 5
Figure 3: Breakeven Inflation .................................................................................................................. 5
Figure 4: Investment grade credit spreads ............................................................................................. 6
Figure 5: Nominal sovereign yields ......................................................................................................... 6
Figure 6: Nominal yields .......................................................................................................................... 7
Figure 7: Efficient frontier ..................................................................................................................... 11
Figure 8: Asset class assumptions on the risk/reward space ................................................................ 13
Figure 9: Changes in asset class returns ............................................................................................... 14
Figure 10: Changes in asset class volatilities ......................................................................................... 15
Tables Table 1: Investment assumptions ........................................................................................................... 2
Table 2: UK gilt yields .............................................................................................................................. 4
Table 3: Index-linked gilt yields ............................................................................................................... 5
Table 4: Equity assumptions ................................................................................................................... 8
Table 5: Strategic asset allocations ....................................................................................................... 10
Table 6: Risk boundaries ....................................................................................................................... 12
Table 9: Total expense ratios ................................................................................................................ 18

Capital Market Assumptions Update, Q4 2015
1
1 Introduction
This report presents the quarterly review of the financial planning assumptions used within the
Distribution Technology (DT) Planning and Sales and Services Platform (“the Platform”). These
assumptions are used within the Platform to:
Build model portfolios;
Define the portfolio efficient frontier; and
Forecast portfolio outcomes
The review is based on index data analysed up to the end of December 2015 (Q4 2015) and
incorporates the views of major supranational entities where appropriate.
The assumptions and resulting asset allocations have been created with a view that they will be used
in a long term context. This means in the short term, pricing anomalies may exist that change the
relative attractiveness of an asset class.
DT provides this analysis on the understanding that investors will gain access to the outputs through
a regulated advice process. The decision regarding which asset class to include in an investor’s
portfolio as well as the amount to include should be made by advisers with the necessary Financial
Conduct Authority (FCA) permission to give advice on investments in consultation with their client.
DT accepts no liability in respect of any advice given to investors relating to investment strategies or
the purchase of specific products.
The following sections set out the methods that have been adopted and the data used in the analysis
to derive the assumptions.

Capital Market Assumptions Update, Q4 2015
2
2 Investment assumptions
Table 1 provides the real and nominal expected returns assumptions for this quarter as well as the
volatility assumptions.
Real expected
returns (% pa)
Nominal expected
returns (% pa) Volatility (% pa)
Cash -0.6% 1.9% 1.5%
UK corporate bonds 1.2% 3.7% 6.4%
UK index-linked gilts -0.7% 1.8% 7.6%
International bonds -0.7% 1.8% 8.2%
UK gilts -0.2% 2.3% 6.0%
Global high yield bonds 3.6% 6.1% 10.8%
UK equity 4.3% 6.8% 14.0%
Europe ex UK equity 4.5% 7.0% 19.1%
North American equity 4.1% 6.6% 15.2%
Japanese equity 2.8% 5.3% 16.2%
Asia Pacific ex Japan equity 5.6% 8.1% 18.6%
Emerging Market equity 6.5% 9.0% 21.2%
UK commercial property 2.2% 4.7% 10.7%
Commodities 3.4% 5.9% 20.4%
Absolute return 1.0% 3.5% 8.6%
Unclassified 2.0% 4.5% 7.2%
Table 1: Investment assumptions

Capital Market Assumptions Update, Q4 2015
3
3 Assumption methodology
3.1 Price inflation
We use the assumption of 2.5% for the expected rate of future price inflation. This is 0.5% above the
Bank of England’s inflation target of 2% for CPI inflation. The Bank’s measure excludes mortgages
and for our purposes we have decided that it would be prudent to allow an extra margin for retail
investors. The assumption is also consistent with the FCA’s intermediate inflation assumption set out
in COBS 13 Annex 21.
3.2 Volatilities and correlations
As in previous reviews, the correlations and volatilities have been derived from real monthly
historical index data denominated in Sterling.
The methodology for deriving volatility and correlation assumptions has been retained. The time
period used for assessing volatility is based on a 15 year rolling period for each representative index.
3.3 Expected returns
3.3.1 UK gilts
The estimate for the expected nominal return on conventional Gilts is derived from the yield to
maturity of the Barclays All Maturities Gilts Index. The nominal yield at 31 December 2015 has
increased by approximately 20 bps this quarter to 2.3% pa, resulting in an expected return of -0.2%
pa in real terms.
An All Maturity Index has been selected for the Gilts analysis because it best represents the
portfolios that are used within the Platform. It is also assumed that the duration of the portfolio is
held relatively constant through a managed fund environment and it is not held as an individual
security whose duration would decrease over time.
The table below sets out the nominal yields on Gilts for a range of maturities as at the review date.
1 The handbook can be located at http://fshandbook.info/FS/html/FCA/COBS/13/Annex2

Capital Market Assumptions Update, Q4 2015
4
Up to 5 years 5 - 10 years 10 - 15 years Over 15 years All stocks
Number 13 9 3 16 41
Nominal yield
(% pa) 1.0% 1.7% 2.2% 2.6% 2.3%
Table 2: UK gilt yields
Figure 1: UK gilt yield curve
Figure 1 above shows the change in the UK yield curve over the quarter. There has been a general
increase in yields across all terms during the quarter.
3.3.2 Index-linked gilts
Yields for Index-linked gilts (“ILGs”) are quoted based on inflation assumptions of 0% and 5%. Over
the quarter, yields have increased, particularly at the short end of the curve.
To arrive at the yield for 2.5% inflation, linear interpolation has been used. Based on this method,
the expected real return for this quarter is -0.7% pa, an increase of 10bps since last quarter.
The following table sets out the yields on ILGs for a range of maturities as at the review date.

Capital Market Assumptions Update, Q4 2015
5
Up to 5 years 5 to 15 years Over 15 years All stocks
Number 4 7 15 26
Yield on 0% inflation (%pa) -0.7% -0.6% -0.7% -0.7%
Yield on 5% inflation (%pa) -1.5% -0.7% -0.7% -0.7%
Interpolated yield on 2.5%
inflation (%pa) -1.1% -0.6% -0.7% -0.7%
Table 3: Index-linked gilt yields
Figure 2: UK index-linked gilt yield curve
There has been a general increase in real yields over the quarter across all terms.
Figure 3 below shows how Breakeven Inflation has changed over the quarter. There have been no
significant changes to inflation expectations over the quarter.
Figure 3: Breakeven Inflation
1Y 2Y 3Y 4Y 5Y 6Y 7Y 8Y 9Y 10Y 12Y 15Y 20Y 25Y 30Y 40Y 50Y
-1.4
-1.2
-1.0
-0.8
-0.6
-0.4
-0.2
0.0
Nom
inal Y
ield
(%
)
Term (months)
UK Index-linked Curve (Q4 2015)
UK Index-linked Curve (Q3 2015)
5Y6Y7Y8Y9Y10Y 12Y 15Y 20Y 25Y 30Y 40Y 50Y
2
2.5
3
3.5
4
No
min
al Y
ield
Term
Interpolated Breakeven Inflation (Q4 2015)
Interpolated Breakeven Inflation (Q3 2015)

Capital Market Assumptions Update, Q4 2015
6
3.3.3 UK corporate bonds
There has been little change in corporate yields over the quarter; the small rise in gilt yields was
matched by an equivalent fall in credit spreads.
The nominal yield for UK Corporate Bonds this quarter is currently at 3.5%. We assume the same
default probability as previously, resulting in an expected return of 1.2% pa.
Figure 4: Investment grade credit spreads
3.3.4 International bonds
The broad market index that is used to represent International Bonds has a large exposure to high
quality sovereigns. This quarter, real yields for the index rose by approximately 15bps, which has
increased our expected real return assumption to -0.7% pa.
Figure 5: Nominal sovereign yields
0
200
400
600
800
1000
1200
Dec 09 Jun 10 Dec 10 Jun 11 Dec 11 Jun 12 Dec 12 Jun 13 Dec 13 Jun 14 Dec 14 Jun 15 Dec 15
Cre
dit
Sp
rea
dd
s (
bp
s)
AAA Rated AA Rated A Rated BBB Rated High yield
0%
1%
2%
3%
4%
5%
Dec 09 Jun 10 Dec 10 Jun 11 Dec 11 Jun 12 Dec 12 Jun 13 Dec 13 Jun 14 Dec 14 Jun 15 Dec 15
No
min
al Y
ield
UK Gilt All Maturities Germany All Maturities US Treasury All Maturities

Capital Market Assumptions Update, Q4 2015
7
3.3.5 Global high yield bonds
The nominal yield on the Barclays Capital Global High Yield Bond Index has increased by about 0.3%
this quarter to 8.2% pa. Therefore, taking into account the default risk, the assumption for Global
High Yield bonds is increased to 3.6% pa in real terms this quarter.
Figure 6: Nominal yields
0%
4%
8%
12%
Dec 09 Jun 10 Dec 10 Jun 11 Dec 11 Jun 12 Dec 12 Jun 13 Dec 13 Jun 14 Dec 14 Jun 15 Dec 15
No
min
al Y
ield
Global High Yield Bonds UK Gilt All Maturities US Treasury All Maturities

Capital Market Assumptions Update, Q4 2015
8
3.3.6 Equities
The DT platform splits equities into geographical regions. The following indices are used to calculate
volatilities and correlations for equities:
MSCI UK Equity Total Return Index
MSCI Europe ex UK Equity Total Return Index
MSCI North American Equity Total Return Index
MSCI Japanese Equity Total Return Index
MSCI Asia Pacific ex Japan Equity Total Return Index
MSCI Emerging Market Equity Total Return Index
The methodology for generating expected returns incorporates the earnings yield via the payout
ratio, as well as taking into account the regional dividend yields, GDP and inflation forecasts. Our
research indicates that this method is more comprehensive as it captures any share buybacks over
time as well as the actual payment of dividends. We have used consensus data, sourced from
Bloomberg, for regional GDP and inflation forecasts. These consensus forecasts include contributions
from various Investment Banks, consultancies and other local agencies.
Table 4 gives the Q4 2015 real and nominal assumptions for all equity regions.
Equity regions Real expected returns (% pa) Nominal expected returns (% pa)
UK equity 4.3% 6.8%
Europe ex UK equity 4.5% 7.0%
North American equity 4.1% 6.6%
Japanese equity 2.8% 5.3%
Asia Pacific ex Japan equity 5.6% 8.1%
Emerging Market equity 6.5% 9.0%
Table 4: Equity assumptions
There have been reductions in expectations across all geographical regions, driven by both a
decrease in the dividend payout expectations and lower growth expectations. This has been more
pronounced in the more volatile equity regions, such as Asia Pacific ex Japan and emerging markets.

Capital Market Assumptions Update, Q4 2015
9
3.3.7 Cash
We have retained the methodology of using the yield on 5-15 years Index-Linked Gilts (at the 10 year
breakeven inflation point) for deriving the Cash assumption. This results in a real assumption
of -0.6% pa and a nominal assumption of 1.9% pa.
3.3.8 Property
For property the risk premium over Gilts has been maintained. Since there has been an increase in
yields for Gilts this quarter, the assumption for UK commercial property has similarly increased to
2.2% pa.
3.3.9 Commodities
The assumption for commodities is in line with the global growth forecast from IMF, as research
indicates that commodity prices are highly correlated with global growth. The IMF global growth
forecast has reduced its predictions for 2016, and hence the real assumption for commodities is
reduced to 3.4% pa.
3.3.10 Absolute return
We retain the same risk premium over gilts of 1.2% pa, resulting in a real return assumption of
1.0% pa.
3.3.11 Unclassified
The unclassified asset class is based on an equally weighted combination of UK Gilts and UK Equity
and forms a medium level of risk. We also assume that this asset class is uncorrelated to all other
asset types. This quarter the assumption for this asset class is 2.0% pa in real terms.

Capital Market Assumptions Update, Q4 2015
10
4 Strategic asset allocation
The assumptions in this update note are used in two distinct ways; for constructing an efficient frontier from which investors can select an asset allocation
that suits their risk appetite and to forecast the distribution of investment outcomes for a given asset allocation strategy.
Table 5 shows the current strategic asset allocations which were implemented in October 2015 for each risk profile (“RP”). No changes are proposed to
asset allocations this quarter.
Risk profile Cash
UK
Corporate
Bonds
UK Index
Linked
Bonds
Inter-
national
Bonds UK Gilts
Global
High Yield
Bonds UK Equity
Europe Ex
UK Equity
North
American
Equity
Japanese
Equity
Asia Pacific
ex Japan
Equity
Emerging
Market
Equity
UK
Property Commodities
Absolute
Return
1 100% - - - - - - - - - - - - - -
2 41% 13% 5% 6% 13% 5% 12% - - - - - 5% - -
3 10% 23% 7% 7% 16% 5% 15% - 9% - - - 8% - -
4 5% 27% 5% - 8% 6% 22% 5% 9% 5% - - 8% - -
5 - 24% - - 5% 6% 28% 5% 14% 5% 6% - 7% - -
6 - 19% - - - 5% 31% 5% 9% 5% 10% 11% 5% - -
7 - 5% - - - 5% 35% 5% 7% 5% 16% 17% 5% - -
8 - - - - - 5% 23% 5% 5% 5% 22% 30% 5% - -
9 - - - - - - 16% 5% 5% 5% 26% 43% - - -
10 - - - - - - 5% - 5% - 27% 63% -
Table 5: Strategic asset allocations

Capital Market Assumptions Update, Q4 2015
5 Efficient frontier
The current asset allocations are plotted on the risk-reward space using the Q4 2015 assumptions as
seen in Figure 7. We also show how these allocations were positioned using the previous
assumptions, as at 30 September 2015.
Figure 7: Efficient frontier
RP 1 RP 2 RP 3 RP 4 RP 5 RP 6 RP 7 RP 8 RP 9 RP 10
-2.0%
-1.0%
0.0%
1.0%
2.0%
3.0%
4.0%
5.0%
6.0%
7.0%
0.00% 2.10% 4.20% 6.30% 8.40% 10.50% 12.60% 14.70% 16.80% 18.90% 21.00%
Exp
ect
ed
re
turn
(%
pa)
Volatility (%pa)
Previous assumptions Revised assumptions
Capital Market Assumptions Update, Q4 2015
12
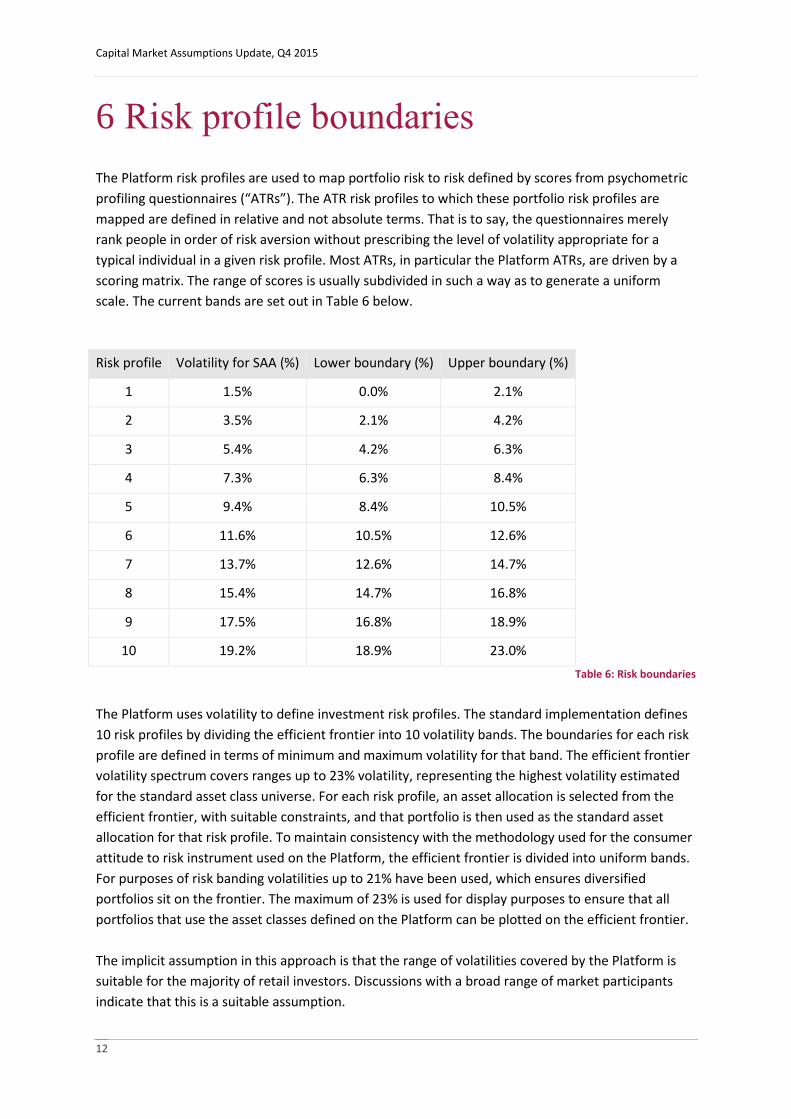
6 Risk profile boundaries
The Platform risk profiles are used to map portfolio risk to risk defined by scores from psychometric
profiling questionnaires (“ATRs”). The ATR risk profiles to which these portfolio risk profiles are
mapped are defined in relative and not absolute terms. That is to say, the questionnaires merely
rank people in order of risk aversion without prescribing the level of volatility appropriate for a
typical individual in a given risk profile. Most ATRs, in particular the Platform ATRs, are driven by a
scoring matrix. The range of scores is usually subdivided in such a way as to generate a uniform
scale. The current bands are set out in Table 6 below.
Risk profile Volatility for SAA (%) Lower boundary (%) Upper boundary (%)
1 1.5% 0.0% 2.1%
2 3.5% 2.1% 4.2%
3 5.4% 4.2% 6.3%
4 7.3% 6.3% 8.4%
5 9.4% 8.4% 10.5%
6 11.6% 10.5% 12.6%
7 13.7% 12.6% 14.7%
8 15.4% 14.7% 16.8%
9 17.5% 16.8% 18.9%
10 19.2% 18.9% 23.0%
Table 6: Risk boundaries
The Platform uses volatility to define investment risk profiles. The standard implementation defines
10 risk profiles by dividing the efficient frontier into 10 volatility bands. The boundaries for each risk
profile are defined in terms of minimum and maximum volatility for that band. The efficient frontier
volatility spectrum covers ranges up to 23% volatility, representing the highest volatility estimated
for the standard asset class universe. For each risk profile, an asset allocation is selected from the
efficient frontier, with suitable constraints, and that portfolio is then used as the standard asset
allocation for that risk profile. To maintain consistency with the methodology used for the consumer
attitude to risk instrument used on the Platform, the efficient frontier is divided into uniform bands.
For purposes of risk banding volatilities up to 21% have been used, which ensures diversified
portfolios sit on the frontier. The maximum of 23% is used for display purposes to ensure that all
portfolios that use the asset classes defined on the Platform can be plotted on the efficient frontier.
The implicit assumption in this approach is that the range of volatilities covered by the Platform is
suitable for the majority of retail investors. Discussions with a broad range of market participants
indicate that this is a suitable assumption.

Capital Market Assumptions Update, Q4 2015
Appendix A: Asset classes on risk / reward space
Figure 8 shows each asset class return on the risk / reward chart.
Figure 8: Asset class assumptions on the risk/reward space
Cash
UK Corporate Bonds
UK Index-Linked Gilts
International Bonds
UK Gilts
UK Equity
Europe ex UK Equity
North American Equity
Japanese Equity
AsiaPac ex Japan Equity
Emerging Market Equity
UK Commercial Property
Commodities
Absolute return
Global High Yield Bonds
Unclassified
-2.0%
-1.0%
0.0%
1.0%
2.0%
3.0%
4.0%
5.0%
6.0%
7.0%
8.0%
0.0% 2.1% 4.2% 6.3% 8.4% 10.5% 12.6% 14.7% 16.8% 18.9% 21.0% 23.1%
Exp
ecte
d r
eal re
turn
%p
a
Volatility %pa

Capital Market Assumptions Update, Q4 2015
14
Appendix B: Changes in assumptions per asset classes
Figure 9 shows the expected real returns over the last four quarters for all asset classes. Figure 10 shows the change in volatility expectations.
Figure 9: Changes in asset class returns
CashUK Corporate
BondsUK Index-
Linked GiltsInternational
BondsUK Gilts
Global HighYield Bonds
UK EquityEurope ex UK
Equity
NorthAmerican
Equity
JapaneseEquity
AsiaPac exJapan Equity
EmergingMarket Equity
UKCommercial
PropertyCommodities
AbsoluteReturn
Unclassified
Q1 2015 -1.0% 0.5% -0.9% -1.1% -0.5% 2.4% 4.4% 4.0% 4.1% 2.7% 5.4% 6.2% 1.9% 3.8% 0.7% 2.0%
Q2 2015 -0.8% 1.1% -0.9% -0.8% -0.1% 2.5% 4.3% 4.3% 4.0% 2.9% 5.6% 6.3% 2.3% 3.8% 1.1% 2.1%
Q3 2015 -0.8% 1.2% -0.8% -0.9% -0.4% 3.4% 4.4% 4.6% 4.3% 3.0% 5.9% 6.7% 2.0% 3.5% 0.8% 2.0%
Q4 2015 -0.6% 1.2% -0.7% -0.7% -0.2% 3.6% 4.3% 4.5% 4.1% 2.8% 5.6% 6.5% 2.2% 3.4% 1.0% 2.0%
-2.0%
-1.0%
0.0%
1.0%
2.0%
3.0%
4.0%
5.0%
6.0%
7.0%
8.0%
Exp
ecte
d R
etu
rns

Capital Market Assumptions Update, Q4 2015
Figure 10: Changes in asset class volatilities
CashUK Corporate
BondsUK Index-
Linked GiltsInternational
BondsUK Gilts
Global HighYield Bonds
UK EquityEurope ex UK
Equity
NorthAmerican
Equity
JapaneseEquity
AsiaPac exJapan Equity
EmergingMarket Equity
UKCommercial
PropertyCommodities
AbsoluteReturn
Unclassified
Q1 2015 1.5% 6.3% 7.5% 8.3% 5.9% 10.8% 13.8% 19.0% 15.5% 16.8% 18.6% 21.4% 11.5% 21.3% 8.7% 7.1%
Q2 2015 1.5% 6.4% 7.5% 8.3% 6.0% 10.9% 13.9% 19.0% 15.5% 16.8% 18.5% 21.4% 12.3% 20.9% 8.8% 7.1%
Q3 2015 1.5% 6.4% 7.6% 8.3% 6.0% 10.8% 14.0% 19.0% 15.3% 16.4% 18.6% 21.3% 11.9% 20.9% 8.7% 7.2%
Q4 2015 1.5% 6.4% 7.6% 8.2% 6.0% 10.8% 14.0% 19.1% 15.2% 16.2% 18.6% 21.2% 10.7% 20.4% 8.6% 7.2%
0.0%
5.0%
10.0%
15.0%
20.0%
25.0%
Vo
lati
lity

16
Appendix C: DT allocation -
projections
The following tables show the potential losses and gains which have been calculated for each risk
profile, based on an initial investment of £10,000. We have applied the effect of the Total Expense
Ratios as set out in Appendix F. For each risk level we show a range of percentile outcomes, based
on the 5th, 50th and 95th percentiles2.
2 Percentiles are used to give a measure of confidence for a particular outcome. So for a 95
th percentile
outcome, we would expect actual returns to remain below this with 95% confidence.
Risk profile 1
Value after 1 year 5 years 10 years 20 years
5th percentile £9,600 £8,900 £8,300 £7,200
50th percentile £9,900 £9,500 £8,900 £8,000
95th percentile £10,100 £10,000 £9,700 £8,900
Risk profile 2
Value after 1 year 5 years 10 years 20 years
5th percentile £9,400 £8,700 £8,100 £7,300
50th percentile £10,000 £9,800 £9,700 £9,400
95th percentile £10,500 £11,200 £11,600 £12,100
Risk profile 3
Value after 1 year 5 years 10 years 20 years
5th percentile £9,200 £8,300 £7,700 £7,000
50th percentile £10,000 £10,100 £10,200 £10,400
95th percentile £10,900 £12,300 £13,400 £15,400
Risk profile 4
Value after 1 year 5 years 10 years 20 years
5th percentile £9,000 £8,000 £7,400 £6,900
50th percentile £10,100 £10,400 £10,800 £11,600
95th percentile £11,300 £13,500 £15,700 £19,700
Risk profile 5
Value after 1 year 5 years 10 years 20 years
5th percentile £8,700 £7,600 £7,000 £6,500
50th percentile £10,100 £10,600 £11,300 £12,800
95th percentile £11,800 £14,900 £18,200 £25,000

Risk profile 6
Value after 1 year 5 years 10 years 20 years
5th percentile £8,500 £7,200 £6,600 £6,100
50th percentile £10,200 £10,800 £11,800 £13,900
95th percentile £12,200 £16,300 £21,000 £31,400
Risk profile 7
Value after 1 year 5 years 10 years 20 years
5th percentile £8,200 £6,800 £6,200 £5,700
50th percentile £10,200 £11,000 £12,100 £14,700
95th percentile £12,600 £17,800 £23,900 £38,400
Risk profile 8
Value after 1 year 5 years 10 years 20 years
5th percentile £8,000 £6,500 £5,800 £5,300
50th percentile £10,200 £11,100 £12,400 £15,400
95th percentile £13,000 £19,100 £26,500 £45,200
Risk profile 9
Value after 1 year 5 years 10 years 20 years
5th percentile £7,800 £6,100 £5,300 £4,700
50th percentile £10,200 £11,200 £12,600 £15,800
95th percentile £13,400 £20,500 £29,600 £52,900
Risk profile 10
Value after 1 year 5 years 10 years 20 years
5th percentile £7,600 £5,800 £5,000 £4,400
50th percentile £10,300 £11,300 £12,800 £16,500
95th percentile £13,800 £21,900 £32,700 £61,700

18
Appendix D: Total expense ratio
The table below shows the Total Expense Ratios (“TER”) used in the production environment.
Asset classes Total Expense Ratio (%)
Cash 0.5%
UK Corporate Bonds 1.1%
UK Index Linked Gilts 0.5%
International Bonds 1.3%
UK Gilts 0.6%
Global High Yield Bonds 1.0%
UK Equity 1.6%
Europe ex UK Equity 1.7%
North American Equity 1.6%
Japanese Equity 1.7%
Asia Pacific ex Japan Equity 1.7%
Emerging Market Equity 1.8%
UK Commercial Property 1.6%
Commodities 1.6%
Absolute return 1.2%
Table 7: Total expense ratios

Basis of Preparation and Use
You should not rely on this information in making an investment decision and it does not constitute a recommendation or advice in the
selection of a specific investment or class of investments.
The information does not indicate a promise, forecast or illustration of future volatility or returns. The outputs represent a range of
possible indications of volatility and returns for various collections of asset classes. Distribution Technology Limited (“DT”) is not liable for
the data in respect of direct or consequential loss attaching to the use of or reliance upon this information.
DT does not warrant or claim that the information in this document or any associated form is compliant with obligations governing the
provision of advice or the promotion of products as defined by the Financial Services Act.
Copyright
© Distribution Technology Ltd 2015 onwards. All rights reserved.
No part of this publication may be reproduced, stored in a retrieval system, or transmitted in any form or any means, electronic or
mechanical, including photocopying and recording for any purpose other than the purchaser’s personal use without the prior written
permission of DT.
Source of information
Bank of England, Barclays Capital Inc., Bloomberg LLC, Heriot Watt University Gilt database, International Monetary Fund (IMF),
Investment Property Databank, Markit iBoxx and Office of National Statistics
Trademarks
DT may have patents or pending patent applications, trademarks, copyrights or other intellectual property rights covering subject matter
in this document. The furnishing of this document does not give you any license to these patents, trademarks, copyrights or other
intellectual property rights except as expressly provided in any written license agreement from DT.
All other companies and product names are trademarks or registered trademarks of their respective holders.
www.distribution-technology.com