Embed Size (px)
Citation preview
PricewaterhouseCoopers, ABN 52 780 433 757 Freshwater Place, 2 Southbank Boulevard, SOUTHBANK VIC 3006, GPO Box 1331, MELBOURNE VIC 3001 T: 61 3 8603 1000, F: 61 3 8603 1999, www.pwc.com.au Liability limited by a scheme approved under Professional Standards Legislation.
The Acting General Manager
Ryde City Council
DX 8403
Ryde
Dear Roy, Review of Council’s Financial Sustainability You have requested that I summarise the main points from my presentations to Council workshops on 24 May and 10 June. The main points are summarised below:
1. Counci’ls current financial position based on the financial indicators in Note 13 to the 2013 financial statements is considered sound. All indicators improved against the previous year and the only ratio below the accepted benchmark was the Building and Infrastructure Renewals Ratio. At 94% (benchmark 100%) it was improving and at the top of the group of NSROC councils that Ryde was compared with.
2. Information relating to the condition of infrastructure was less reliable. Special Schedule 7 to the 2013 financial statements indicated a decreasing backlog ($86m in 2011 to $55m in 2013) and more actual spending on asset maintenance ($11m) than was required ($5m). When these issues were queried it was established that the decreasing backlog was a result of reducing the replacement cost of assets and extending their useful lives rather than through an improvement in their condition. The maintenance ‘over’ funding was in fact an error and a funding shortfall actually exists.
3. Based on information currently available the backlog is estimated at $69m when all assets are
considered. Also there is considered to be a $2m funding shortfall in asset maintenance and an $8m funding shortfall in asset renewals. Overall, management is suggesting that a funding injection of $10m would greatly assist in stabilising asset conditions.
4. Council has modelled a number of scenarios involving different funding injections and their
impact on the operating result and asset backlog over 10 years:
- Scenario 1 assumes no change to current funding levels and projects resultant operating losses and a backlog of around $300m in 10 years.
- Scenario 2 assumes additional funding of $10m through a SRV ($7.5m) and cost savings ($2.5m) and projects the operating results into surplus but still leaves a $200m backlog in 10 years.
- Scenario 3 assumes additional funding of $18m through a SRV ($15.5m) and cost savings ($2.5m) and projects the operating results into surplus but still leaves a $100m backlog in 10 years.
2
5. I have some concerns regarding the accuracy of these projections particularly as they relate to the backlog. These concerns are:
asset condition ratings are not all current – road condition ratings for example are 6 years old.
model assumptions are too simplistic in terms of how assets move through their condition ratings.
inconsistent definitions around how backlog is defined and when intervention is required.
modelling has not been tested against historical trends.
management involved in asset and financial modelling are not confident in the projected outcomes.
On this basis I suggest the modelling needs to be re-done with more accurate condition data and revised assumptions around the definition of backlog and how assets move through their condition ratings.
6. The comparison of Ryde’s operational statistics against Hornsby, Kuringai, Willoughby and North Sydney councils did not identify any significant cost or employment inefficiencies which would indicate major savings could be achieved.
7. Based on the information I have examined and a physical inspection of Council’s infrastructure, it appears that Council needs more funding for asset renewal and maintenance. The impact that a $10m funding injection may have on stabilising asset conditions cannot be accurately projected at this time and more work needs to be done on the asset and financial modelling to establish this.
Please contact the writer on 0414 570 748 if you require addition information. Yours sincerely, Dennis Banicevic
Consultant
City of Ryde
Assessment of Financial Sustainability
Dennis Banicevic - PwC
pwc.com.au
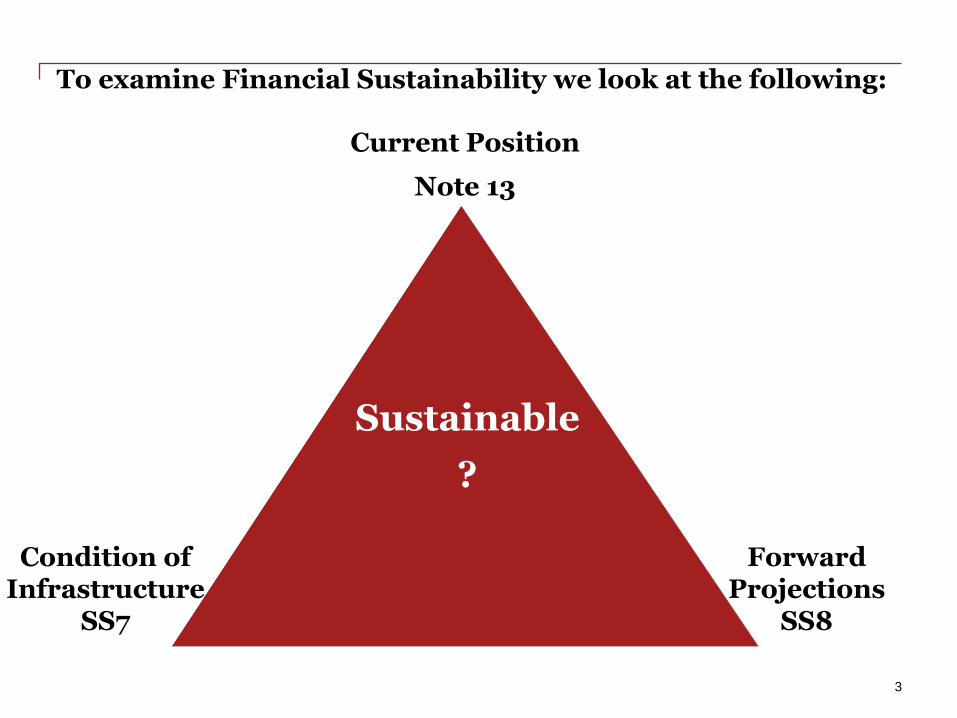
You have requested we evaluate the current financial sustainability of Council.
2
3
Sustainable
?
To examine Financial Sustainability we look at the following:
Current Position
Note 13
Forward Projections
SS8
Condition of Infrastructure
SS7
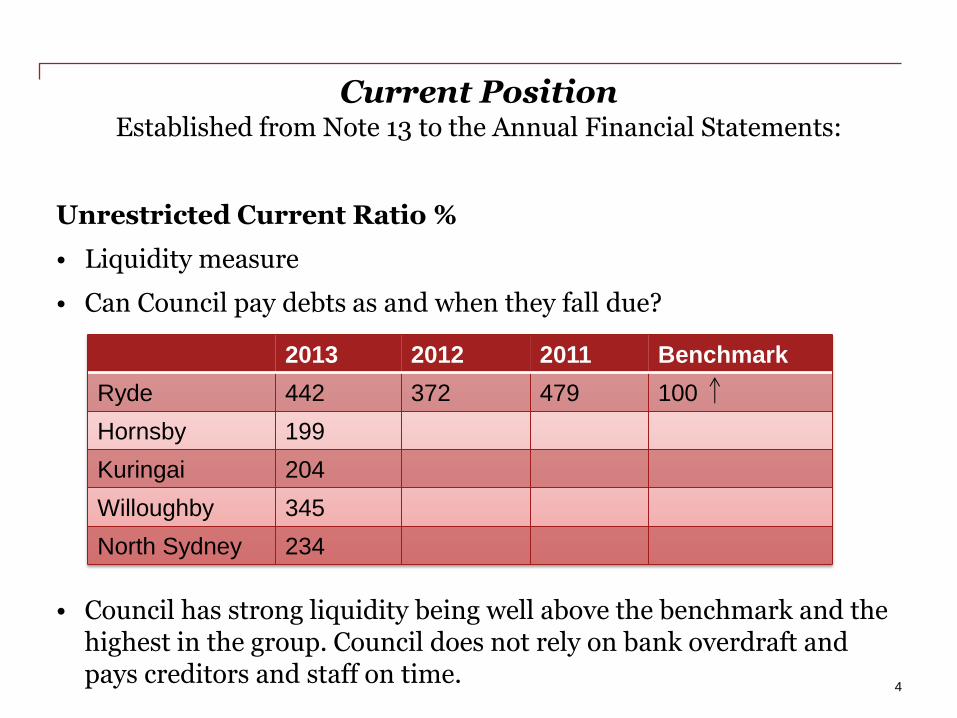
Current Position Established from Note 13 to the Annual Financial Statements:
Unrestricted Current Ratio %
• Liquidity measure
• Can Council pay debts as and when they fall due?
• Council has strong liquidity being well above the benchmark and the highest in the group. Council does not rely on bank overdraft and pays creditors and staff on time.
4
2013 2012 2011 Benchmark
Ryde 442 372 479 100
Hornsby 199
Kuringai 204
Willoughby 345
North Sydney 234
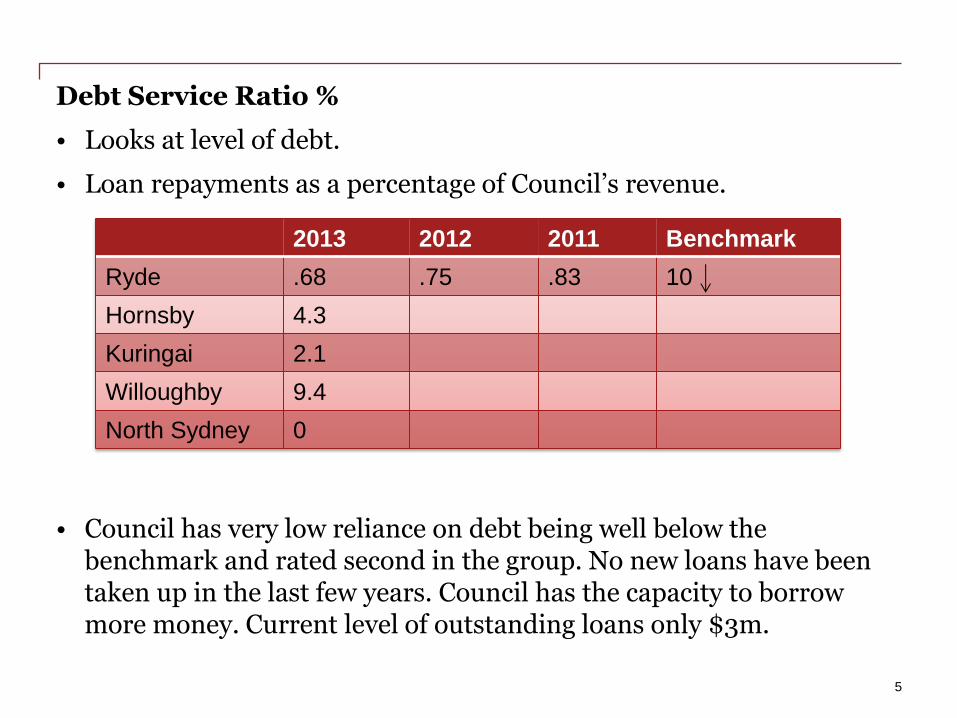
Debt Service Ratio %
• Looks at level of debt.
• Loan repayments as a percentage of Council’s revenue.
• Council has very low reliance on debt being well below the benchmark and rated second in the group. No new loans have been taken up in the last few years. Council has the capacity to borrow more money. Current level of outstanding loans only $3m.
5
2013 2012 2011 Benchmark
Ryde .68 .75 .83 10
Hornsby 4.3
Kuringai 2.1
Willoughby 9.4
North Sydney 0
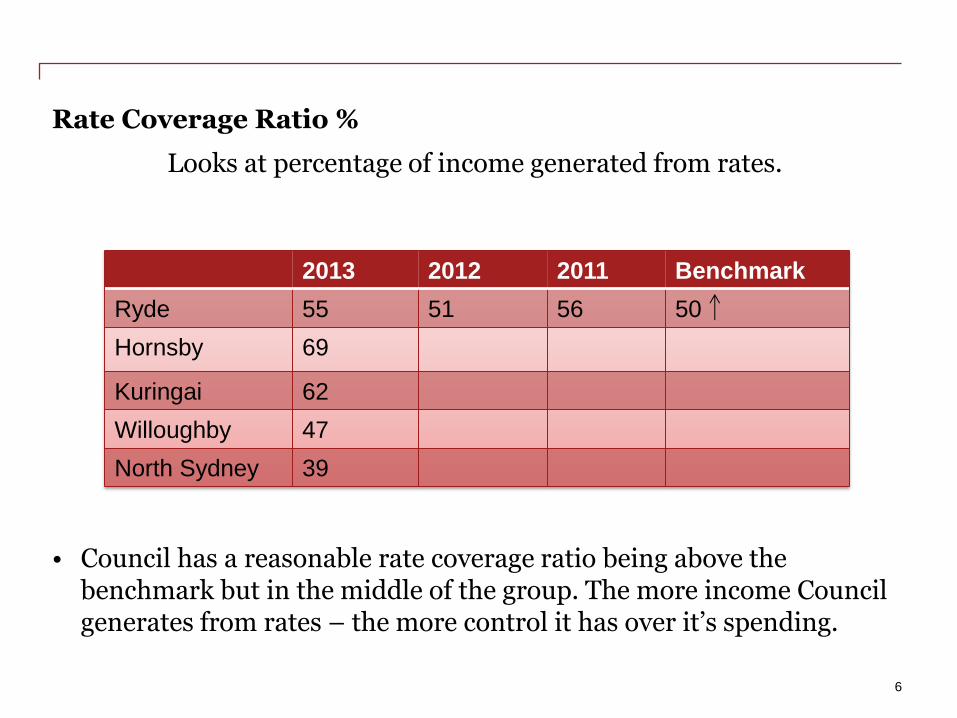
Rate Coverage Ratio %
Looks at percentage of income generated from rates.
• Council has a reasonable rate coverage ratio being above the benchmark but in the middle of the group. The more income Council generates from rates – the more control it has over it’s spending.
6
2013 2012 2011 Benchmark
Ryde 55 51 56 50
Hornsby 69
Kuringai 62
Willoughby 47
North Sydney 39
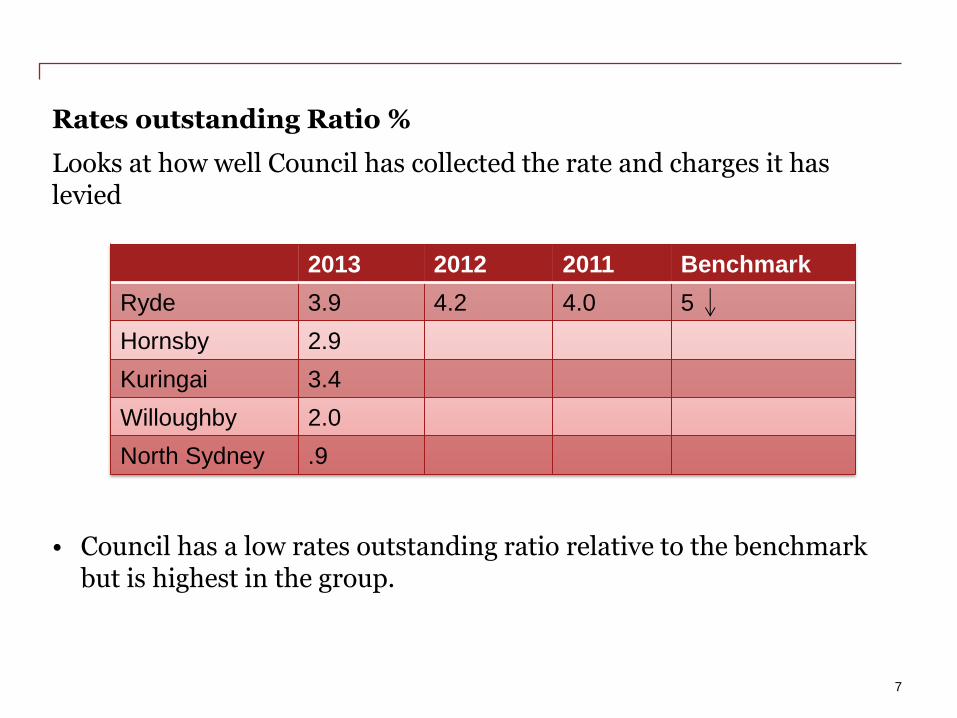
Rates outstanding Ratio %
Looks at how well Council has collected the rate and charges it has levied
• Council has a low rates outstanding ratio relative to the benchmark but is highest in the group.
7
2013 2012 2011 Benchmark
Ryde 3.9 4.2 4.0 5
Hornsby 2.9
Kuringai 3.4
Willoughby 2.0
North Sydney .9
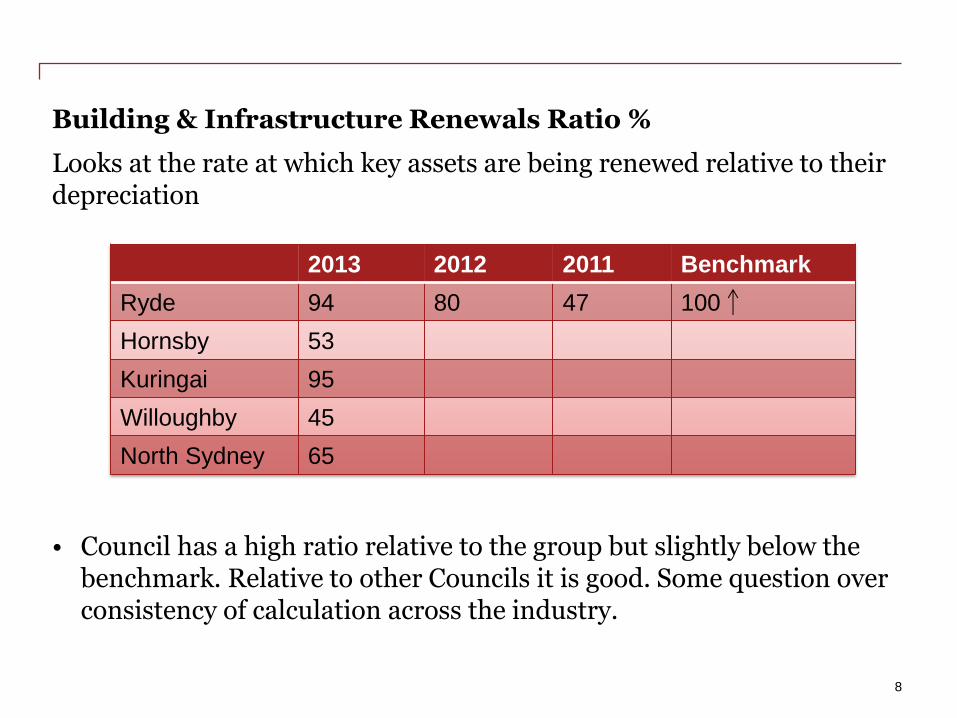
Building & Infrastructure Renewals Ratio %
Looks at the rate at which key assets are being renewed relative to their depreciation
• Council has a high ratio relative to the group but slightly below the benchmark. Relative to other Councils it is good. Some question over consistency of calculation across the industry.
8
2013 2012 2011 Benchmark
Ryde 94 80 47 100
Hornsby 53
Kuringai 95
Willoughby 45
North Sydney 65
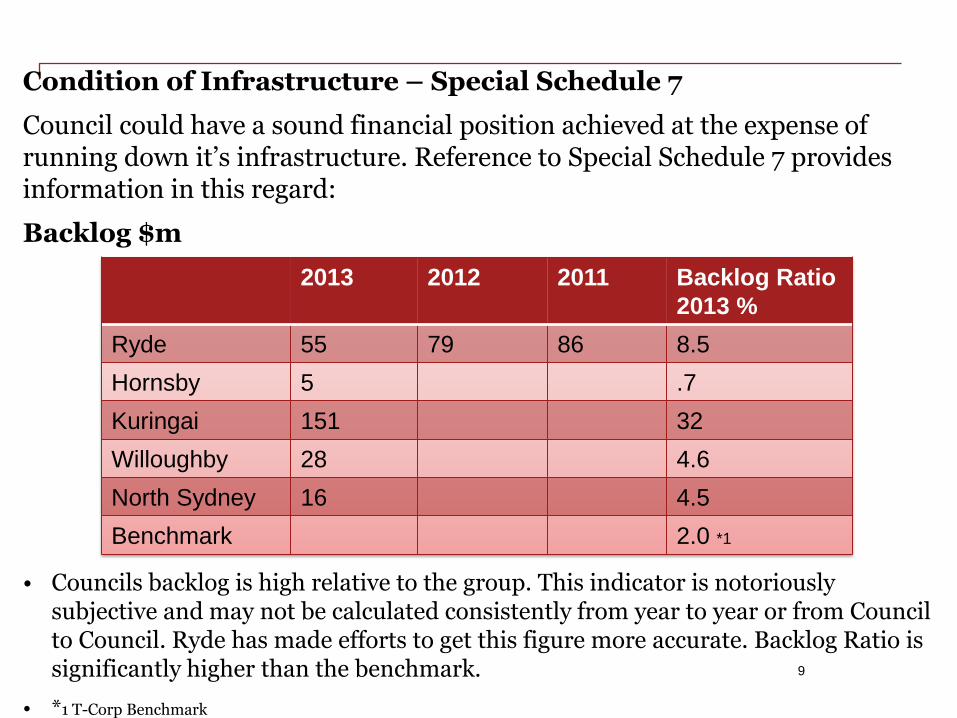
Condition of Infrastructure – Special Schedule 7
Council could have a sound financial position achieved at the expense of running down it’s infrastructure. Reference to Special Schedule 7 provides information in this regard:
Backlog $m
• Councils backlog is high relative to the group. This indicator is notoriously subjective and may not be calculated consistently from year to year or from Council to Council. Ryde has made efforts to get this figure more accurate. Backlog Ratio is significantly higher than the benchmark.
• *1 T-Corp Benchmark
9
2013 2012 2011 Backlog Ratio
2013 %
Ryde 55 79 86 8.5
Hornsby 5 .7
Kuringai 151 32
Willoughby 28 4.6
North Sydney 16 4.5
Benchmark 2.0 *1
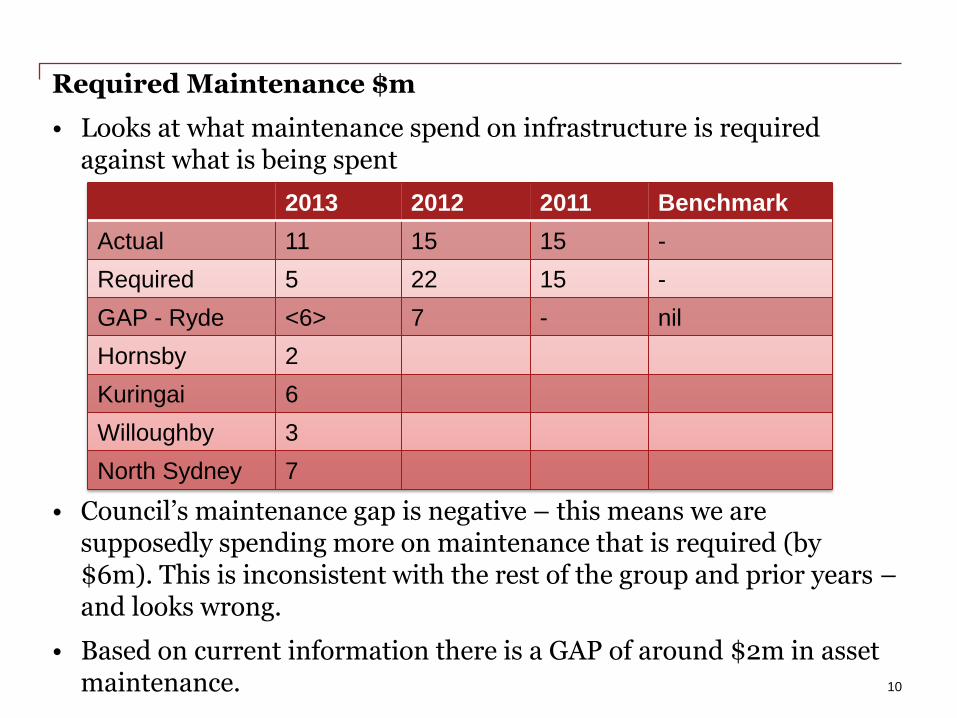
Required Maintenance $m
• Looks at what maintenance spend on infrastructure is required against what is being spent
• Council’s maintenance gap is negative – this means we are supposedly spending more on maintenance that is required (by $6m). This is inconsistent with the rest of the group and prior years – and looks wrong.
• Based on current information there is a GAP of around $2m in asset maintenance.
10
2013 2012 2011 Benchmark
Actual 11 15 15 -
Required 5 22 15 -
GAP - Ryde <6> 7 - nil
Hornsby 2
Kuringai 6
Willoughby 3
North Sydney 7
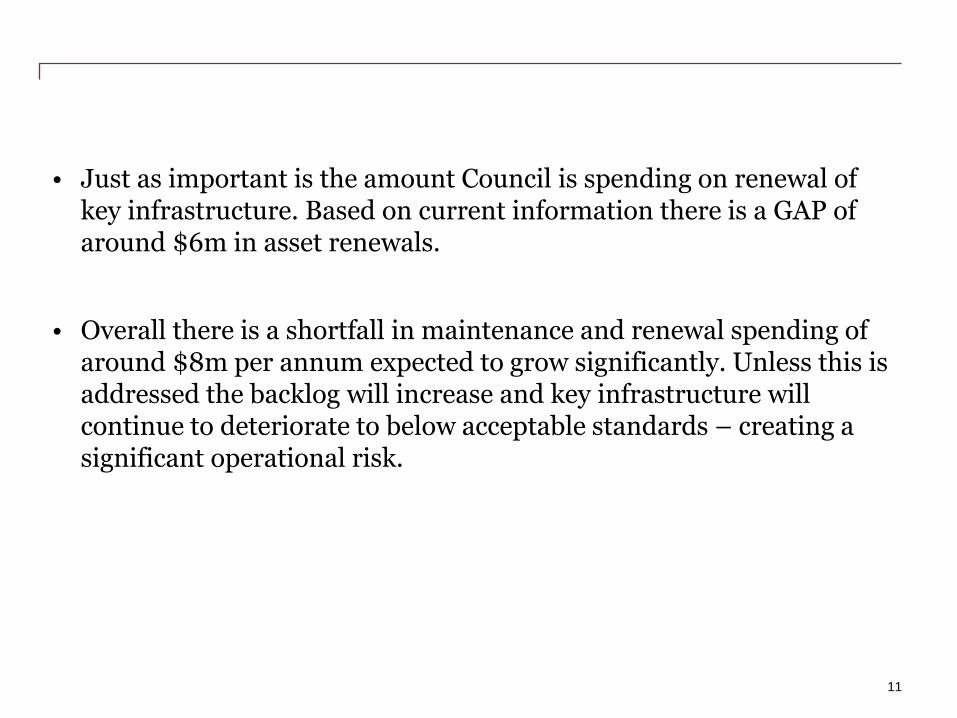
• Just as important is the amount Council is spending on renewal of key infrastructure. Based on current information there is a GAP of around $6m in asset renewals.
• Overall there is a shortfall in maintenance and renewal spending of around $8m per annum expected to grow significantly. Unless this is addressed the backlog will increase and key infrastructure will continue to deteriorate to below acceptable standards – creating a significant operational risk.
11
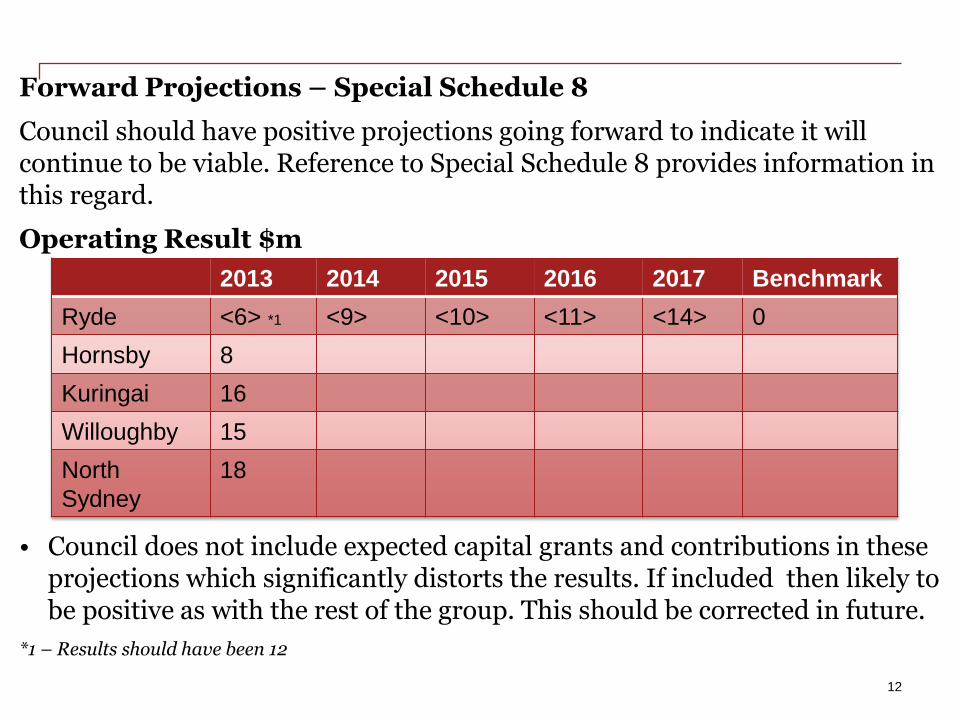
Forward Projections – Special Schedule 8
Council should have positive projections going forward to indicate it will continue to be viable. Reference to Special Schedule 8 provides information in this regard.
Operating Result $m
• Council does not include expected capital grants and contributions in these projections which significantly distorts the results. If included then likely to be positive as with the rest of the group. This should be corrected in future.
*1 – Results should have been 12
12
2013 2014 2015 2016 2017 Benchmark
Ryde <6> *1 <9> <10> <11> <14> 0
Hornsby 8
Kuringai 16
Willoughby 15
North
Sydney
18
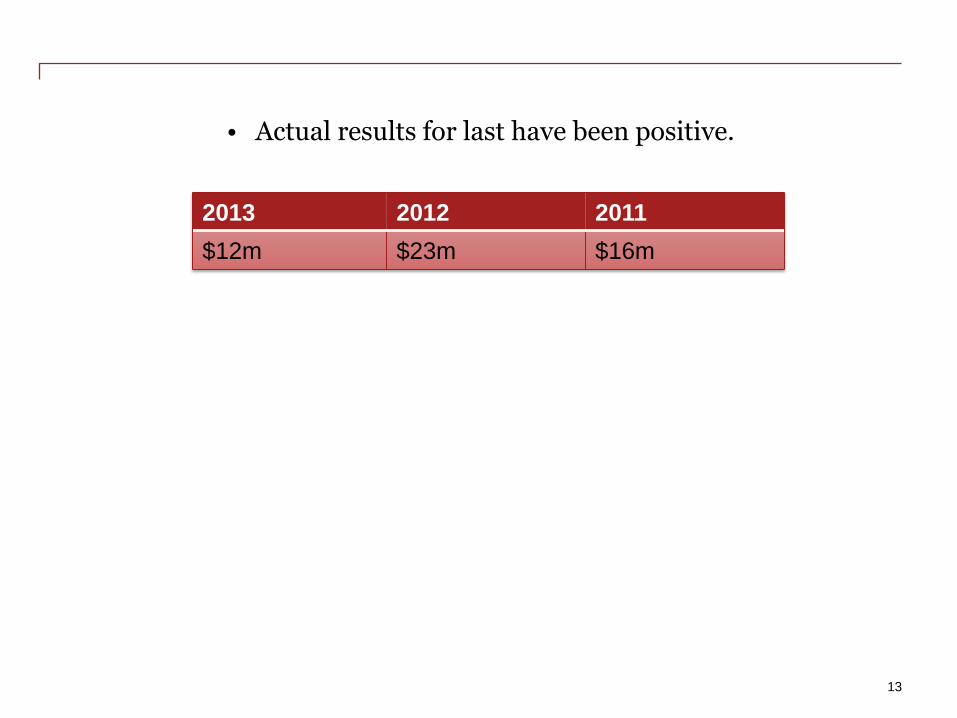
• Actual results for last have been positive.
13
2013 2012 2011
$12m $23m $16m
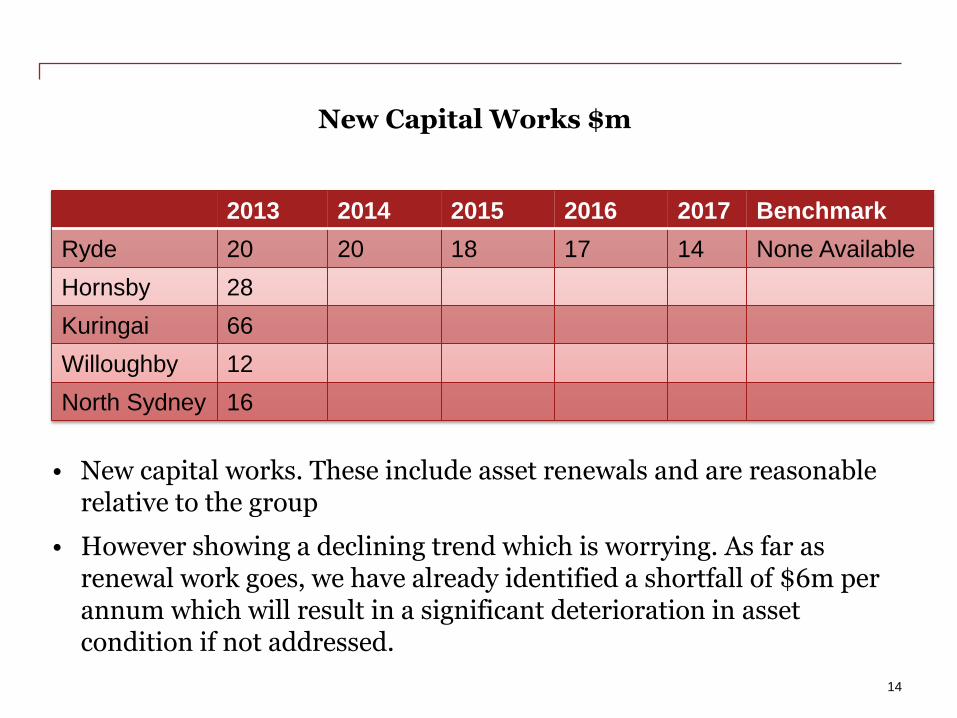
New Capital Works $m
• New capital works. These include asset renewals and are reasonable relative to the group
• However showing a declining trend which is worrying. As far as renewal work goes, we have already identified a shortfall of $6m per annum which will result in a significant deterioration in asset condition if not addressed.
14
2013 2014 2015 2016 2017 Benchmark
Ryde 20 20 18 17 14 None Available
Hornsby 28
Kuringai 66
Willoughby 12
North Sydney 16
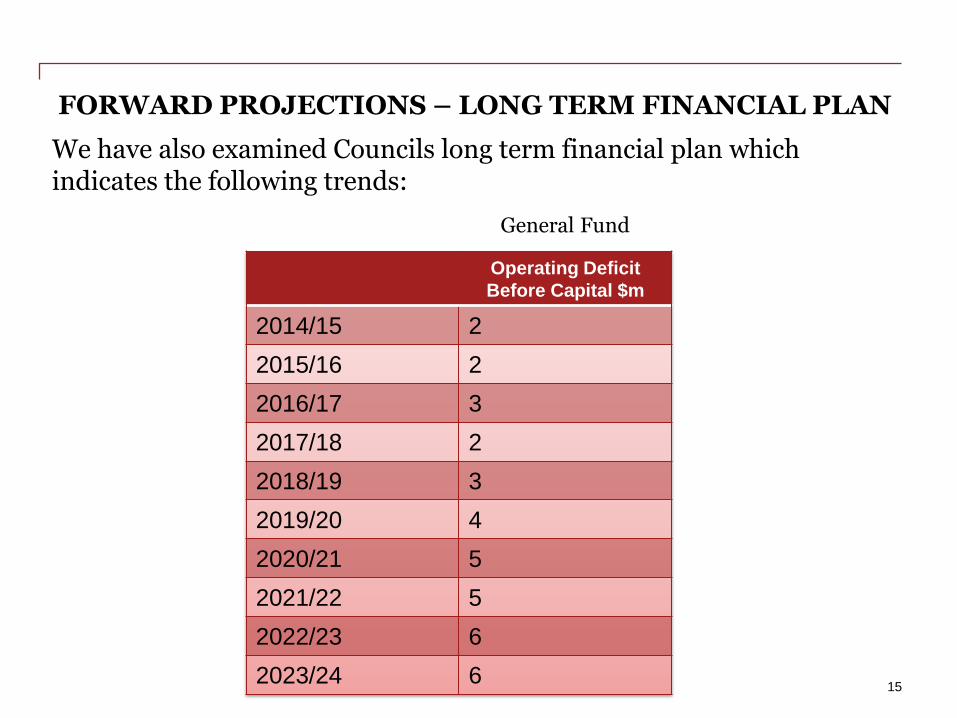
FORWARD PROJECTIONS – LONG TERM FINANCIAL PLAN
We have also examined Councils long term financial plan which indicates the following trends:
15
Operating Deficit
Before Capital $m
2014/15 2
2015/16 2
2016/17 3
2017/18 2
2018/19 3
2019/20 4
2020/21 5
2021/22 5
2022/23 6
2023/24 6
General Fund
• The Operating Result before capital is the key indicator which determines if Council has enough recurrent income to cover it’s recurrent costs.
16
Conclusion
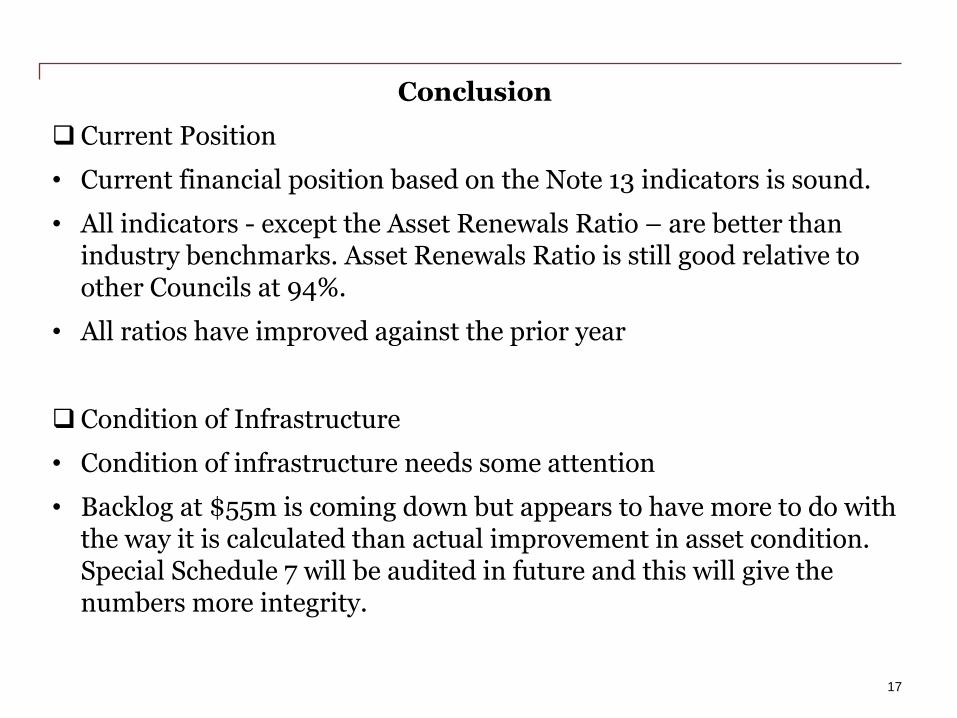
Current Position
• Current financial position based on the Note 13 indicators is sound.
• All indicators - except the Asset Renewals Ratio – are better than industry benchmarks. Asset Renewals Ratio is still good relative to other Councils at 94%.
• All ratios have improved against the prior year
Condition of Infrastructure
• Condition of infrastructure needs some attention
• Backlog at $55m is coming down but appears to have more to do with the way it is calculated than actual improvement in asset condition. Special Schedule 7 will be audited in future and this will give the numbers more integrity.
17
Conclusion (cont)
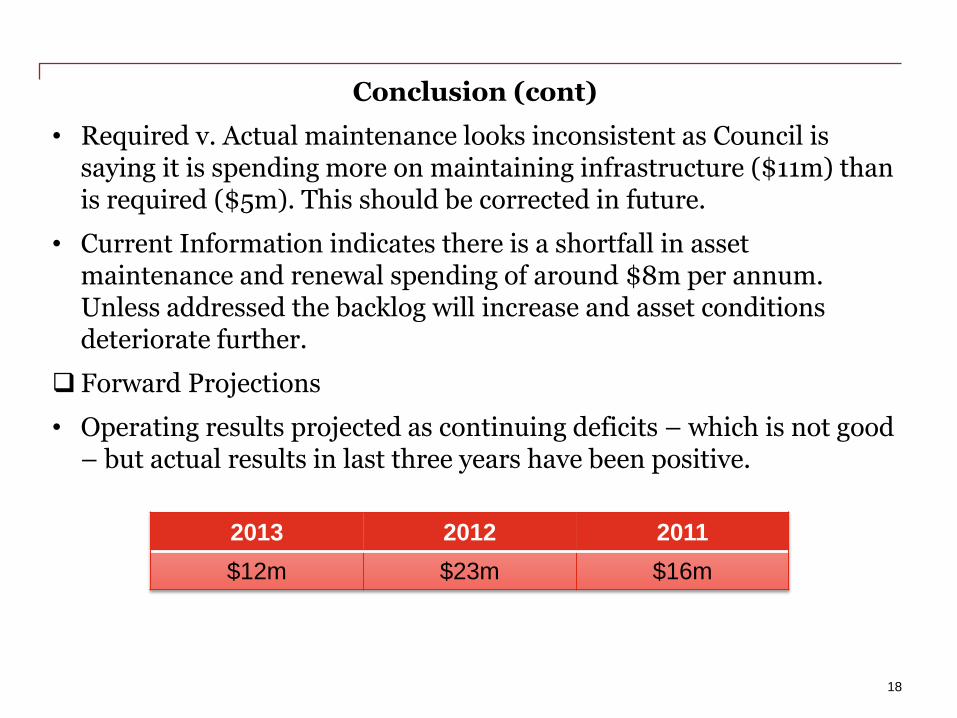
• Required v. Actual maintenance looks inconsistent as Council is saying it is spending more on maintaining infrastructure ($11m) than is required ($5m). This should be corrected in future.
• Current Information indicates there is a shortfall in asset maintenance and renewal spending of around $8m per annum. Unless addressed the backlog will increase and asset conditions deteriorate further.
Forward Projections
• Operating results projected as continuing deficits – which is not good – but actual results in last three years have been positive.
18
2013 2012 2011
$12m $23m $16m
Conclusion (cont)
• Projections do not include expected capital grants and contributions – so present a distorted picture. The should be corrected in future.
• Important indicator is the operating result before capital grants and contributions. These have been projected as deficits over the next 10 years which is not sustainable. It means that Council is not raising sufficient recurrent income to cover its recurrent costs.
Overall, Council’s current financial position is sound but forward projections indicate a deteriorating trend due mainly to insufficient funding for asset renewal and maintenance. This under funding has resulted in a significant infrastructure backlog which is projected to grow substantially as asset conditions deteriorate further. Council will need a significant revenue injection to correct these adverse trends.
19
Ryde City Council
Update on Financial Sustainability Review 10 June 2014
www.pwc.com.au
PwC
Council asked PwC to assess the current financial position of council and the long term financial
plan to determine if Ryde was financially sustainable. Also to look at how Ryde compared
to other NSROC Councils
2
10 June 2014 Ryde City Council
PwC
PwC presented some preliminary views at the Council workshop on 24 May 2014. These were:
Based on the Performance Indicators presented in Council’s 2013 Financial Statements, the Council was
in a sound financial position:
- Council had strong liquidity and low debt levels. All indicators had improved against the previous year. The Renewal Ratio was a little below benchmark but at the top of the group of Councils we compared Ryde with.
The condition of infrastructure appeared to be an issue in 2013 with a reported backlog of $55m but with some inconsistency in the maintenance gap reported. The backlog was too high at 8.5% of the NBV of the roads, drainage and buildings. The maintenance gap of negative $6m was plainly wrong.
There was some doubt over the accuracy of SS7 – particularly as the backlog was reported as declining despite requests by management for an additional $10m in funding for renewal and maintenance.
We needed to look more closely at this issue.
a
b
3
10 June 2014 Ryde City Council
PwC
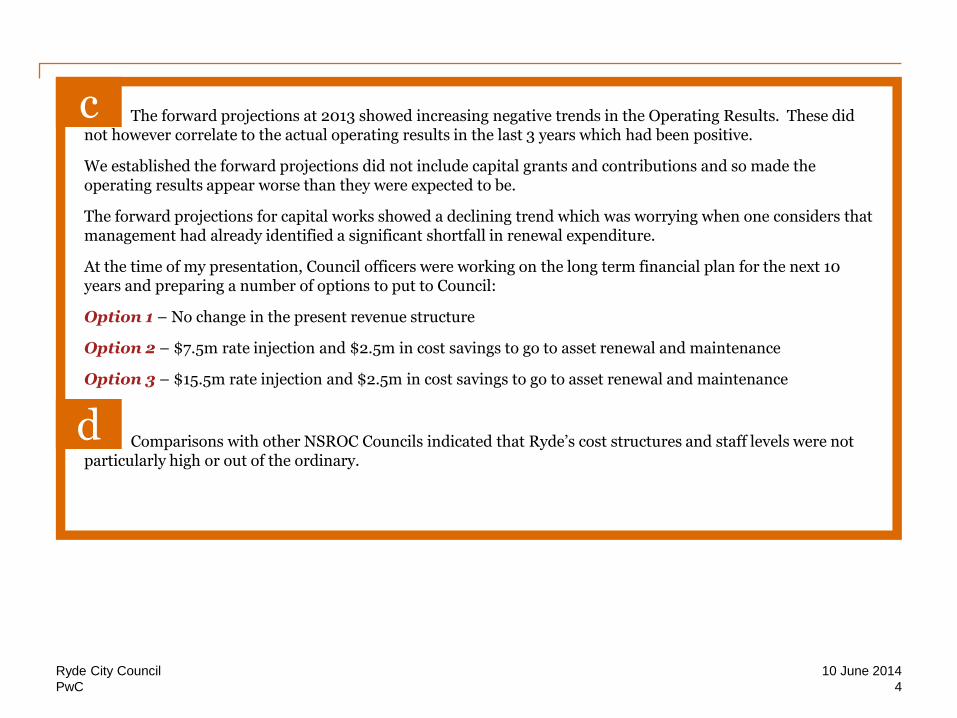
The forward projections at 2013 showed increasing negative trends in the Operating Results. These did
not however correlate to the actual operating results in the last 3 years which had been positive.
We established the forward projections did not include capital grants and contributions and so made the operating results appear worse than they were expected to be.
The forward projections for capital works showed a declining trend which was worrying when one considers that management had already identified a significant shortfall in renewal expenditure.
At the time of my presentation, Council officers were working on the long term financial plan for the next 10 years and preparing a number of options to put to Council:
Option 1 – No change in the present revenue structure
Option 2 – $7.5m rate injection and $2.5m in cost savings to go to asset renewal and maintenance
Option 3 – $15.5m rate injection and $2.5m in cost savings to go to asset renewal and maintenance
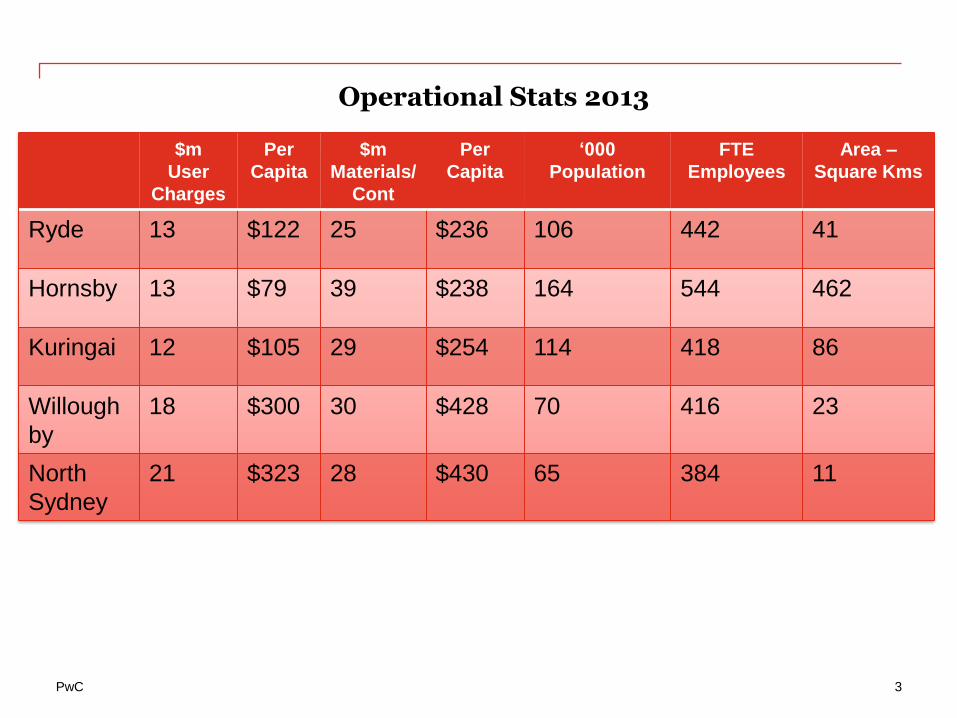
Comparisons with other NSROC Councils indicated that Ryde’s cost structures and staff levels were not particularly high or out of the ordinary.
c
d
4
10 June 2014 Ryde City Council
PwC
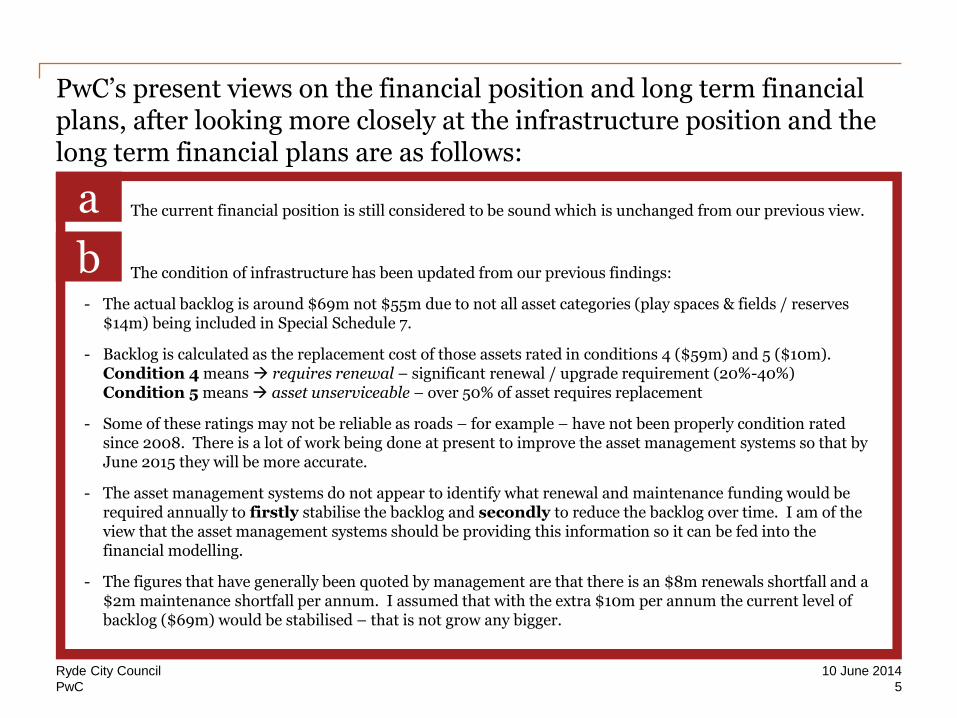
PwC’s present views on the financial position and long term financial plans, after looking more closely at the infrastructure position and the long term financial plans are as follows:
The current financial position is still considered to be sound which is unchanged from our previous view.
The condition of infrastructure has been updated from our previous findings:
- The actual backlog is around $69m not $55m due to not all asset categories (play spaces & fields / reserves $14m) being included in Special Schedule 7.
- Backlog is calculated as the replacement cost of those assets rated in conditions 4 ($59m) and 5 ($10m). Condition 4 means requires renewal – significant renewal / upgrade requirement (20%-40%) Condition 5 means asset unserviceable – over 50% of asset requires replacement
- Some of these ratings may not be reliable as roads – for example – have not been properly condition rated since 2008. There is a lot of work being done at present to improve the asset management systems so that by June 2015 they will be more accurate.
- The asset management systems do not appear to identify what renewal and maintenance funding would be required annually to firstly stabilise the backlog and secondly to reduce the backlog over time. I am of the view that the asset management systems should be providing this information so it can be fed into the financial modelling.
- The figures that have generally been quoted by management are that there is an $8m renewals shortfall and a $2m maintenance shortfall per annum. I assumed that with the extra $10m per annum the current level of backlog ($69m) would be stabilised – that is not grow any bigger.
a
b
5
10 June 2014 Ryde City Council
PwC
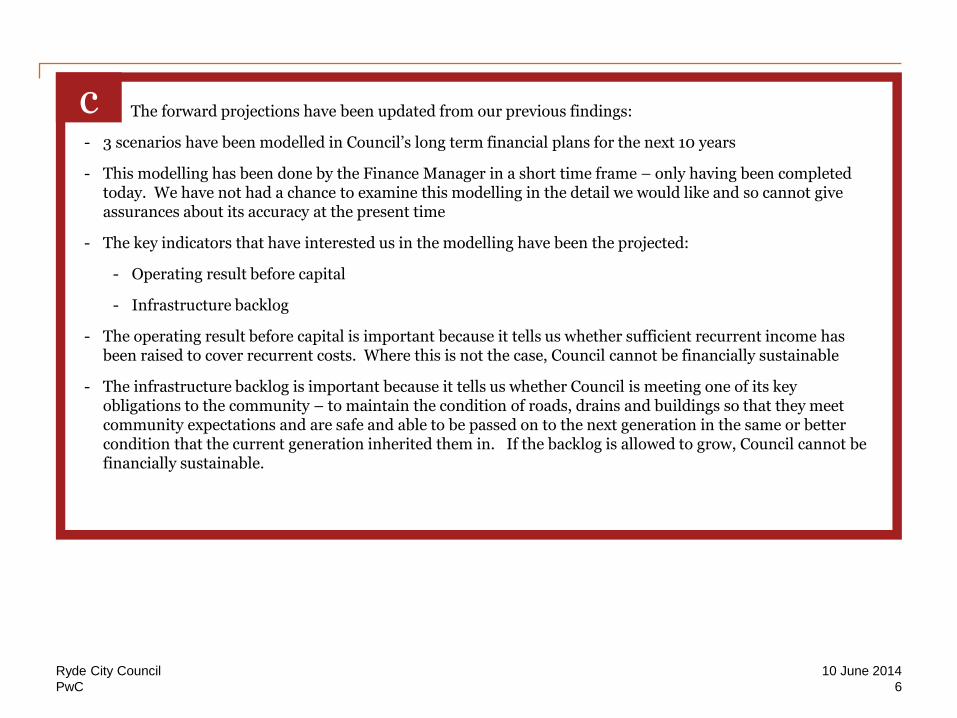
The forward projections have been updated from our previous findings:
- 3 scenarios have been modelled in Council’s long term financial plans for the next 10 years
- This modelling has been done by the Finance Manager in a short time frame – only having been completed today. We have not had a chance to examine this modelling in the detail we would like and so cannot give assurances about its accuracy at the present time
- The key indicators that have interested us in the modelling have been the projected:
- Operating result before capital
- Infrastructure backlog
- The operating result before capital is important because it tells us whether sufficient recurrent income has been raised to cover recurrent costs. Where this is not the case, Council cannot be financially sustainable
- The infrastructure backlog is important because it tells us whether Council is meeting one of its key obligations to the community – to maintain the condition of roads, drains and buildings so that they meet community expectations and are safe and able to be passed on to the next generation in the same or better condition that the current generation inherited them in. If the backlog is allowed to grow, Council cannot be financially sustainable.
c
6
10 June 2014 Ryde City Council
PwC
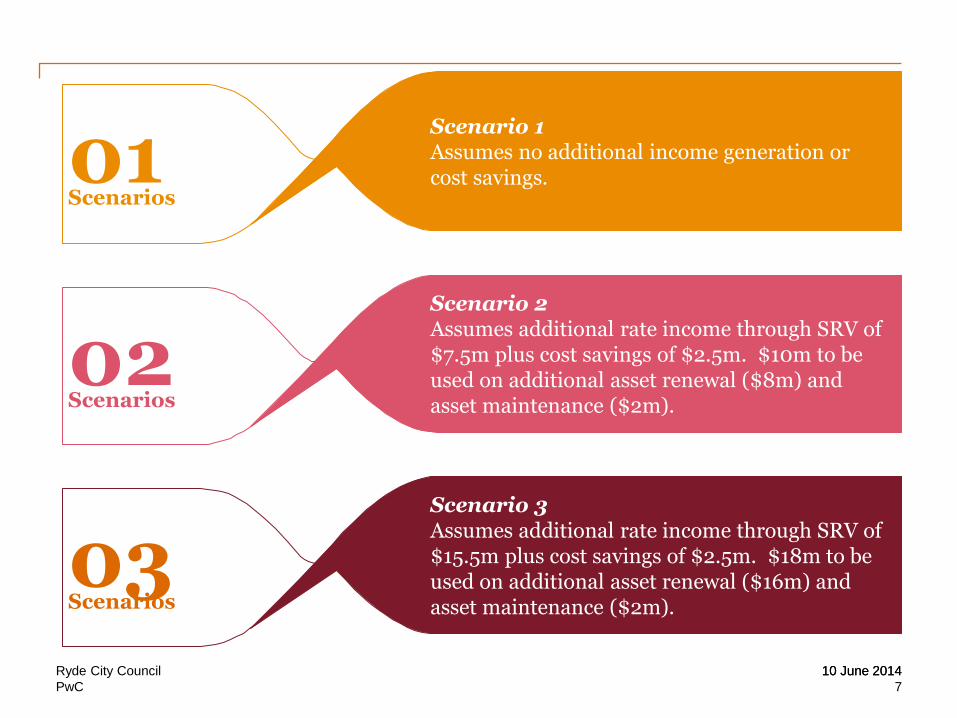
Scenario 1 Assumes no additional income generation or cost savings.
Scenarios 01
Scenario 2 Assumes additional rate income through SRV of $7.5m plus cost savings of $2.5m. $10m to be used on additional asset renewal ($8m) and asset maintenance ($2m). Scenarios
02
Scenario 3 Assumes additional rate income through SRV of $15.5m plus cost savings of $2.5m. $18m to be used on additional asset renewal ($16m) and asset maintenance ($2m). Scenarios
03 10 June 2014
7
10 June 2014 Ryde City Council
PwC
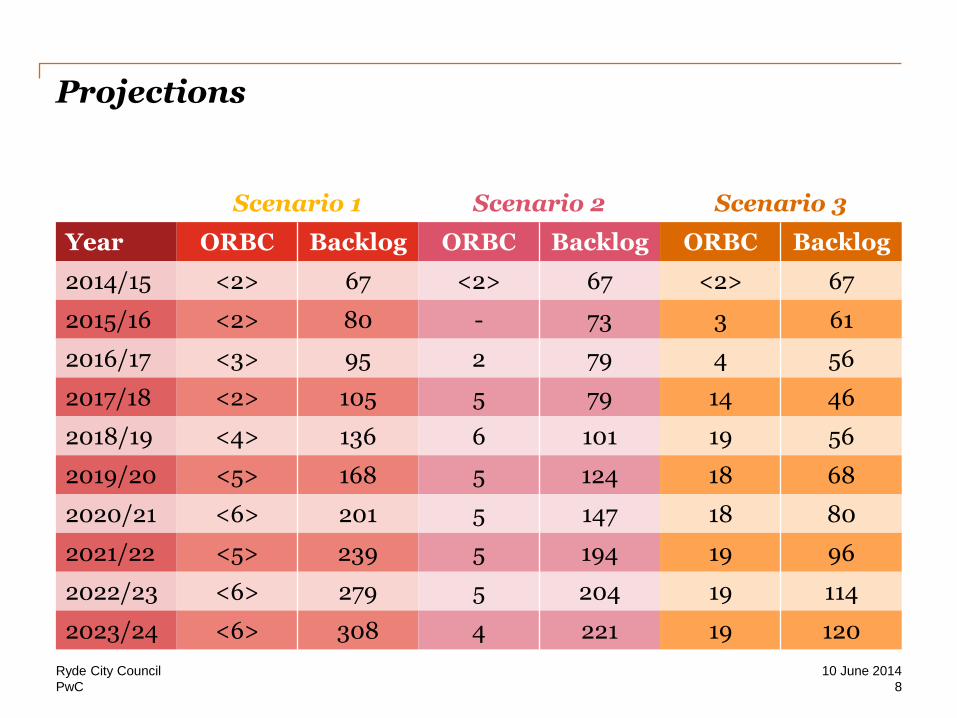
Projections
Scenario 1 Scenario 2 Scenario 3
Year ORBC Backlog ORBC Backlog ORBC Backlog
2014/15 <2> 67 <2> 67 <2> 67
2015/16 <2> 80 - 73 3 61
2016/17 <3> 95 2 79 4 56
2017/18 <2> 105 5 79 14 46
2018/19 <4> 136 6 101 19 56
2019/20 <5> 168 5 124 18 68
2020/21 <6> 201 5 147 18 80
2021/22 <5> 239 5 194 19 96
2022/23 <6> 279 5 204 19 114
2023/24 <6> 308 4 221 19 120
8
10 June 2014 Ryde City Council
PwC
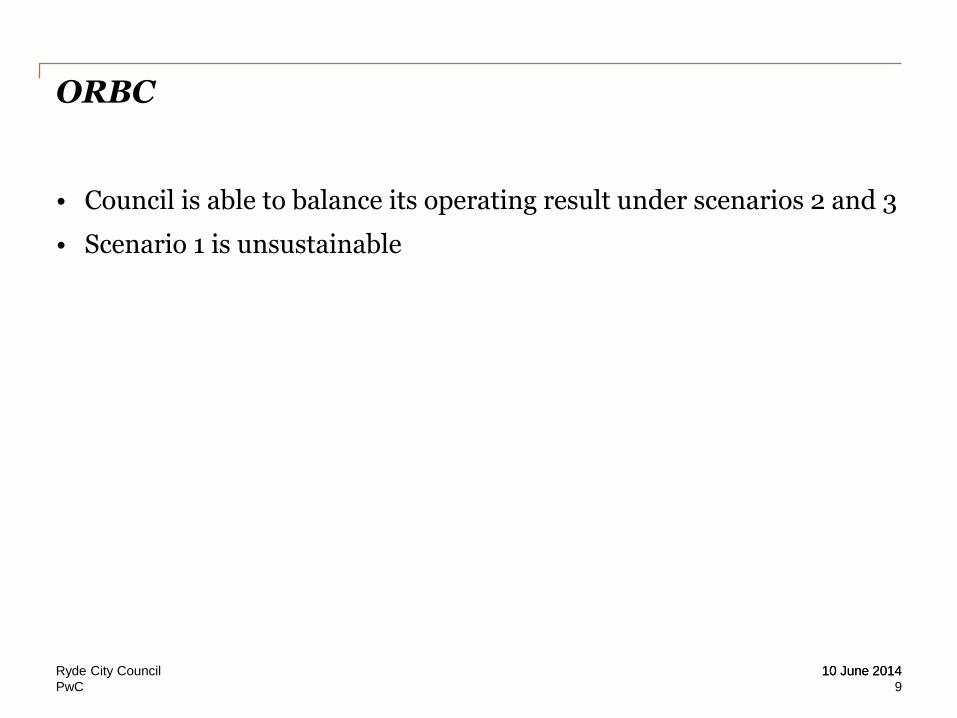
ORBC
• Council is able to balance its operating result under scenarios 2 and 3
• Scenario 1 is unsustainable
10 June 2014
9
10 June 2014 Ryde City Council
PwC
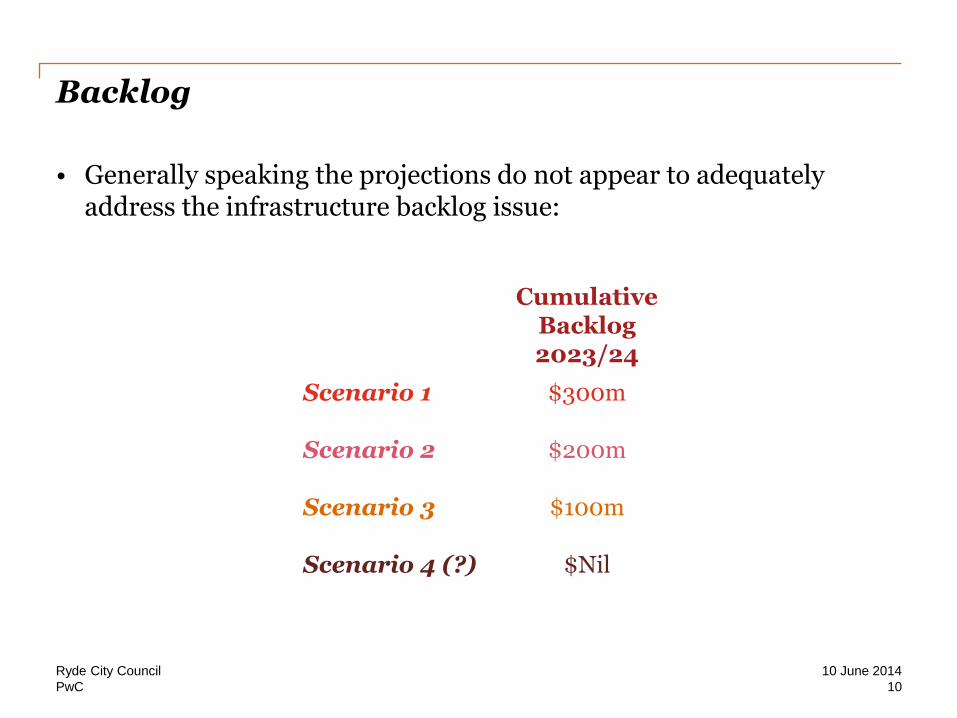
Backlog
• Generally speaking the projections do not appear to adequately address the infrastructure backlog issue:
Cumulative Backlog 2023/24
Scenario 1 $300m
Scenario 2 $200m
Scenario 3 $100m
Scenario 4 (?) $Nil
10
10 June 2014 Ryde City Council
PwC
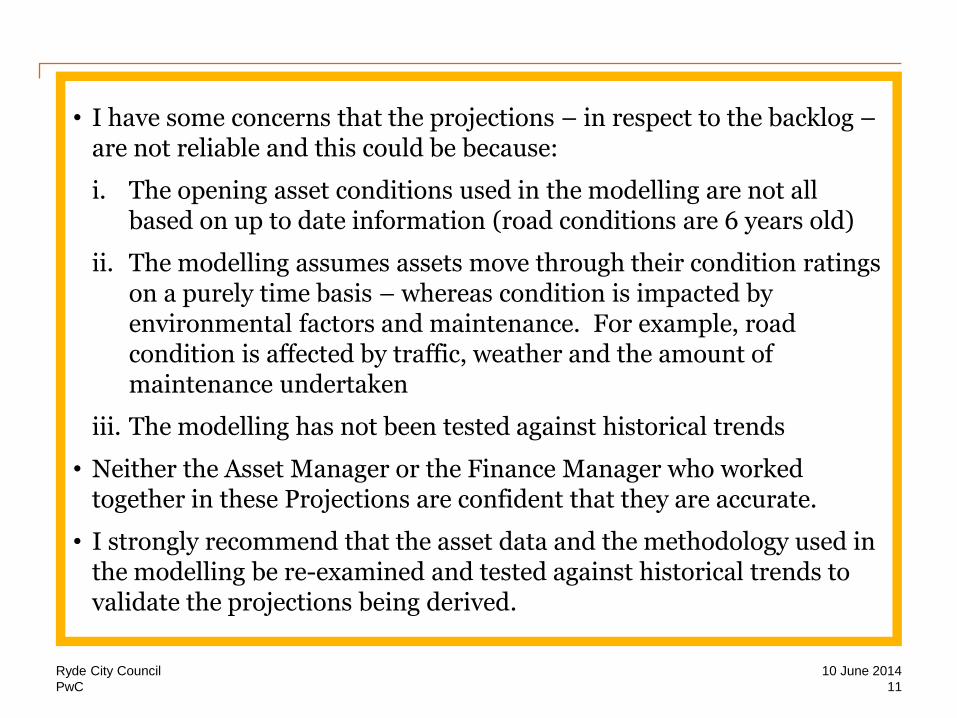
• I have some concerns that the projections – in respect to the backlog – are not reliable and this could be because:
i. The opening asset conditions used in the modelling are not all based on up to date information (road conditions are 6 years old)
ii. The modelling assumes assets move through their condition ratings on a purely time basis – whereas condition is impacted by environmental factors and maintenance. For example, road condition is affected by traffic, weather and the amount of maintenance undertaken
iii. The modelling has not been tested against historical trends
• Neither the Asset Manager or the Finance Manager who worked together in these Projections are confident that they are accurate.
• I strongly recommend that the asset data and the methodology used in the modelling be re-examined and tested against historical trends to validate the projections being derived.
11
10 June 2014 Ryde City Council
PwC
The benchmarks with other NSROC Councils were completed with Kuringai supplying data on cars, overtime and leave levels. Overall council benchmarked well against the other councils indicating it
was not over-administered. The issue about taking control over long service leave still stands.
Benchmarks
Ryde City Council
12
10 June 2014
PwC
Conclusion
• Current financial position is sound.
• There is a backlog – currently estimated by management at $69m – however, because condition ratings are not up to date, this figure may not be accurate. There is also an issue around what is defined as backlog.
• The financial modelling is based around providing more funds for asset renewal and maintenance ($Nil / $10m / $18m) but these appear not to stem the deterioration in asset condition – backlog is still $200m in 10 years under scenario 2 which is not acceptable.
• Suggest the modelling be re-checked as the projected outcomes are inconsistent with the expectations of both the asset manager and the finance manager.
• Council benchmarks indicate administrative costs are reasonable relative to other NSROC Councils.
• My view, based on what information has been provided to me, is that Council needs more funds to maintain the condition of its key infrastructure. The exact amount it needs has not been accurately estimated at this time.
• More work is required on the asset modelling and the financial modelling including work around definitions.
Ryde City Council
13
10 June 2014
pwc.com.au
© 2014 PricewaterhouseCoopers. All rights reserved.
PwC refers to the Australian member firm, and may sometimes refer to the PwC network.
Each member firm is a separate legal entity. Please see www.pwc.com/structure for further details.
Liability limited by a scheme approved under Professional Standards Legislation
PwC 1
$m
Income
Per
Capita
$m
Expenses
Per
Capita
$m
Rates/Charges
Per
Capita
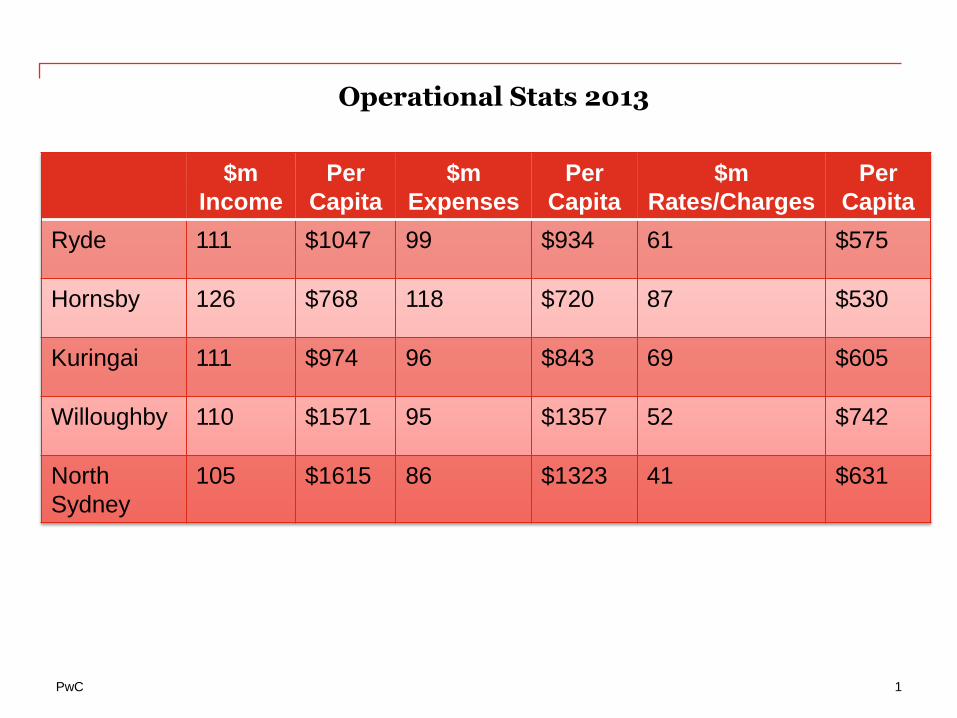
Ryde 111 $1047 99 $934 61 $575
Hornsby 126 $768 118 $720 87 $530
Kuringai 111 $974 96 $843 69 $605
Willoughby 110 $1571 95 $1357 52 $742
North
Sydney
105 $1615 86 $1323 41 $631
Operational Stats 2013
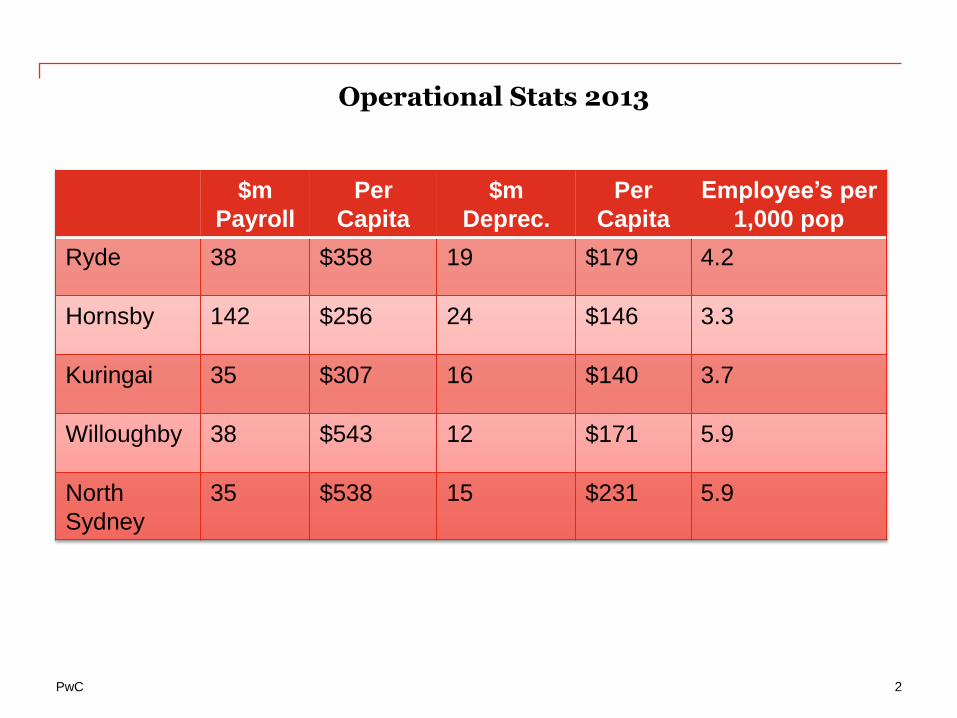
PwC 2
$m
Payroll
Per
Capita
$m
Deprec.
Per
Capita
Employee’s per
1,000 pop
Ryde 38 $358 19 $179 4.2
Hornsby 142 $256 24 $146 3.3
Kuringai 35 $307 16 $140 3.7
Willoughby 38 $543 12 $171 5.9
North
Sydney
35 $538 15 $231 5.9
Operational Stats 2013
PwC 3
$m
User
Charges
Per
Capita
$m
Materials/
Cont
Per
Capita
‘000
Population
FTE
Employees
Area –
Square Kms
Ryde 13 $122 25 $236 106 442 41
Hornsby 13 $79 39 $238 164 544 462
Kuringai 12 $105 29 $254 114 418 86
Willough
by
18 $300 30 $428 70 416 23
North
Sydney
21 $323 28 $430 65 384 11
Operational Stats 2013
PwC 4
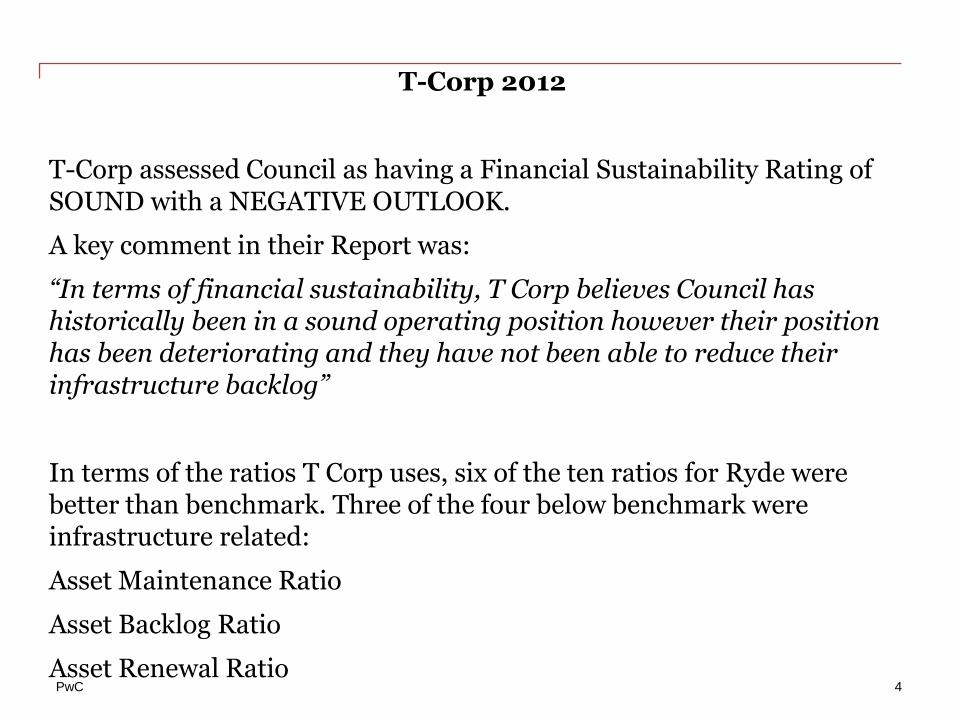
T-Corp 2012
T-Corp assessed Council as having a Financial Sustainability Rating of SOUND with a NEGATIVE OUTLOOK.
A key comment in their Report was:
“In terms of financial sustainability, T Corp believes Council has historically been in a sound operating position however their position has been deteriorating and they have not been able to reduce their infrastructure backlog”
In terms of the ratios T Corp uses, six of the ten ratios for Ryde were better than benchmark. Three of the four below benchmark were infrastructure related:
Asset Maintenance Ratio
Asset Backlog Ratio
Asset Renewal Ratio