Embed Size (px)
Citation preview

Review of Environmental and Economic Aspects of the Sethusamudram Ship Canal Project (SSCP)
Sudarshan Rodriguez, Jacob John
Rohan Arthur Kartik Shanker Aarthi Sridhar

2
Citation: Rodriguez, S., J. John, R. Arthur, K. Shanker, A. Sridhar. 2007. Review of Environmental and Economic Aspects of the Sethusamudram Ship Canal Project (SSCP). pp 76. Cover Photographs: Images from coral reefs and seagrass systems by Rohan Arthur. Disclaimer: The opinions expressed in this report are solely those of the authors and not necessarily that of the institutions they represent.

3
Project Team Contact Details: Sudarshan Rodriguez Flat 2B, Adithya Apartments 38 Balakrishna Road, Valmiki Nagar, Thiruvanmiyur, Chennai 600041. India. Phone: +91-44-52019470 E-mail: [email protected] Jacob John 1, 3rd Cross, Vivekananda Nagar Bangalore 560033 Phone: +91-80 25462649 E-mail: [email protected] Dr. Rohan Arthur Nature Conservation Foundation 3076/5, 4th Cross, Gokulam Park Mysore 570002. India. Ph: +91-821-2515601 E-mail: [email protected] Dr. Kartik Shanker Assistant Professor, Centre for Ecological Sciences Indian Institute of Science, Bangalore 560012 Ph: +-80-22933104 E-mail: [email protected] Aarthi Sridhar Ashoka Trust for Research in Ecology and the Environment (ATREE) 659, 5th Main Road, Hebbal, Bangalore 560092. India Ph: +91-80-23533942 E-mail: [email protected]

4
Table of Contents Introduction to the Review 6Section 1: Issues Relating to Technical Aspects in Project Design, EIA and Related Studies 101. Sub-Surface Geology 122. Bathymetry 133. Information base and Data on Sedimentation 144. Cyclones, Monsoons and Sedimentation 175. Tsunamis and the SSCP 18Section 2. The SSCP EIA, NEERI’s Terms of Reference, EIA Laws and Guidelines 221. Absence of Risk Analysis/Assessment in the EIA 222. SSCP’s Disaster Management Plan 223. Ecological Risk Assessment 223. Loss of Scheduled / Protected Species 234. NEERI’s EIA of the SSCP 23Section 3. Issues Related to Environmental Management Plan (EMP), Environment Monitoring, Clearance & Monitoring Committee
26
1. Gaps in Environment Monitoring program 262. Absence of a Dredge Management Programme 263. Monitoring of Sub-Marine Conditions 274. Monitoring of other parameters 275. Composition of the SSCP Monitoring Committee 27Section 4: Dredging, Sedimentation, and its Impacts on Coral Reefs and Seagrass Meadows: Implications for the SSCP
28
1. Introduction 282. Consequences Of Dredging Activity On Marine Environments 283. Dredging, Sedimentation and Marine Systems: Coral Reefs 304. Dredging, Sedimentation and Marine Systems: Seagrasses 315. Management Strategies in the Gulf of Mannar Biosphere Reserve in Response to the Proposed Canal Building Activity
33
Section 5. Economic Review of the Sethusamudram Project 391. Distance Savings 402. Time Saved 433. Fuel Saved 454. Channel Tariffs 485. Financing of the SSCP 486. Other Issues 497. Conclusions of economic aspects 508. Diagrammatic representation of factors affecting economic viability of the SSCP 51Section 6: Findings and Recommendations of the Review 52References 59
5
List of Abbreviations DPR Detailed Project Report
DMP Disaster Management Plan
EIA Environment Impact Assessment
EMP Environment Management Plan
GoM Gulf of Mannar
NEERI National Environmental Engineering Research Institute
NIOT National Institute of Ocean Technology
NHO National Hydrographic Office
NSDRC National Ship Design and Research Centre
MoEF Ministry of Environment & Forest
L& T Ramboll Larson & Toubro - Ramboll
MoST Ministry of Surface Transport
SSCP Sethusamudram Ship Canal Project
TFEAR Technical Feasibility and Economic Analysis Report
TOR Terms of Reference
Special Acknowledgement Dr. R. Ramesh from the Doctors for a Save Environment, Coimbatore is acknowledged in this report for sharing all his work, including an unpublished report for this review. His website www.sethusamudram.in is storehouse of literature, interviews and documents on the project area and was extensively referred to in compiling this report.

6
I. Introduction to the Review
1. Project Area of the SSCP The SSCP is a 167 km. long shipping canal, which is to pass through the Gulf of Mannar, the Palk Strait and the Palk Bay. It involves dredging in a 89-kilometer stretch for a width of 300 meters and for a depth of 12 meters for ships less than 30, 000 DWT with draft restricted to 10m. The project is said to have been conceived in 1860 by Commander Taylor and the project has been subject to several reviews in the 20th century. The project route is shown below1: Gulf of Mannar The Gulf of Mannar falls in the Indo-Pacific region, considered to be one of world's richest marine biological resources. The proposed SSCP site is located in a globally significant ecologically sensitive marine ecosystem – the Gulf of Mannar Biosphere Reserve. In recognition of this, on May 7, 1999 the Global Environmental Facility (GEF), the official financial mechanism for the Convention on Biological Diversity (CBD) approved the funding of the project proposed by the Government of India titled “Conservation and Sustainable Use of the Gulf of Mannar Biosphere Reserve's Coastal Biodiversity “ for US $ 7.868 million2. The GEF only funds projects and conservation in areas that are globally significant3. The project document states “The overall objective of this project is to conserve the Gulf of Mannar’s globally significant assemblage of coastal and marine biodiversity and to demonstrate, in a large biosphere reserve with various multiple uses, how to integrate biodiversity conservation into coastal zone management plans”. Thus the Gulf of Mannar in addition to being a national priority also assumes global significance and priority. The Gulf has been chosen as a biosphere reserve primarily because of its biological and ecological 1 Source: http://sethusamudram.tamilar.org/ 2 Also available at http://www.gefonline.org/projectDetails.cfm?projID=634 3 GEF Operational Strategy Document, see http://www.gefonline.org/projectDetails.cfm?projID=634

7
uniqueness (MoEF, 2002;4. The region has a distinctive socio-economic and cultural profile shaped by its geography. It has an ancient maritime history and was famous for the production of pearls. Pearl has been an important item of trade with the Roman Empire as early as the first century A.D., while Rameswaram, with its links in legend to the Ramayana epic, has been an important pilgrim centre. The region has been and continues to be famous for its production of chank (Indian conch). In addition, total of 10 true mangrove and 24 mangrove associated species were recorded from the islands in the Biosphere Reserve (Jeganathan, et al, 2006). The GoM thus constitutes a live scientific laboratory of national and international value. It has 3,600 species of plants and animals that make it India's biologically richest coastal region (Global Environment Facility, 1999). It is, of course, specially known for its corals, of which there are 117 species belonging to 37 genera (Kelleher, 1995). It is also well known for its diversity of sea grasses. Out of the fourteen species of seagrasses under 6 genera are known from Indian seas, thirteen species occur in the Gulf of Mannar Biosphere Reserve, with Halophila, Halodule, Enhalus and Cymodocea being common among them (Venkataraman & Wafar, 2005). The GoM has chains of shoal, nearly seven in all, 30 km long called the Adam's Bridge. It is an inlet of the Indian Ocean, between Southeastern India and Western Sri Lanka. The GoM is 130 km to 275 km wide and 160 km long. During high tide, the seawater is known to rise more than 1.2 meters above the mean sea level. Full of beach ridges, the GoM can be grouped into: (i) Beach ridges south of Vaigai River; (ii) Beach ridges between Kotangudi River and Palar River; (iii) Beach ridges between Palar River and Gundar River system; (iv) Beach ridges between Gundar River and Vaippar River; and (v) Beach ridges south of Vaippar River. The total water logged land has been calculated to be 5.96 km2. Eight series of Strand Lines can also be observed, apart from the sea cliff and caves. Palk Bay & Strait 5 The Palk Strait between India and Ceylon is about 75 km wide, with a water depth of 9-13 m, except where local coral reef rises above sea level (Ramesh and Kannupandi, 1997). The Palk Strait is an inlet of the Bay of Bengal. The Palk Strait is 64 km to 137 km wide and 137 km long. It receives several rivers including Vaigai from India and contains many islands of Sri Lanka. The Palk Bay is also considered as one of the five major reef formations in India6. The reef in Palk Bay runs parallel to land (east to west direction) between longitudes 79° 17'E and 79° 8'E at the latitude 9° 17'N. The Bay is a very shallow flat basin and the depth never exceeds 15 metres and the average depth is 9 meters. The coral reef in Palk Bay starts from Munakad as a wall-like formation one to two metres broad and runs east upto Tonithurai, a distance of nearly 5.5 km. East of the Pamban pass, the reef again starts near Thangachimadam and ends near Agnitheertham (Rameswaram). A total of 61 species of algae are distributed among the three major groups - green algae (14 genera and 28 species), brown algae (8 genera and 13 species), red algae (17 genera and 20 species). A total of 73 species of molluscs associated with corals in Palk Bay viz., 46 species of gastropods belonging to 17 families, and 27 species of bivalves belonging to 13 families have been recorded. Of the fourteen species of seagrasses under 6 genera known from Indian seas, eleven species are known to occur in the Palk Bay which include Cymodocea serrulata, Halophila ovalis, Halodule pinifolia and Syringodium isoetifolium (Venkatraman and Wafar, 2005).
4 See http://www.envfor.nic.in/report/0102/chap03.html and http://www.indian-ocean.org/bioinformatics/mangrove/MANGCD/bios1.htm 5 Source: (Ramesh and Kannupandi, 1997) See http://www.fao.org/docrep/X5627E/x5627e0p.htm 6 Also see http://envfor.nic.in/report/9798/con_nat.html

8
2. Structure of this Review The proposed Sethusamudram Shipping Canal Project (SSCP) canal between India and Sri Lanka across the Adam’s Bridge connecting the Arabian Sea with the Bay of Bengal has the potential to effect very significant consequences on this globally significant marine biodiversity area. The construction and maintenance of the canal will involve a range of coastal and marine engineering activities, and when completed will be the largest such undertaking of its kind for India. In a broad sense, this review aimed at understanding how project planning considered the biological diversity of the region and whether the project’s stated benefits outweighed its potential impacts on the region. This review involved an analysis of all the SSCP documents and relevant literature to arrive at a multi-pronged assessment of the implications of the SSCP particularly its implications for the biodiversity of Gulf of Mannar and Palk Bay regions. The literature reviewed includes published articles and papers in peer reviewed journals, expert reports pertaining to the economic, ecological and social impacts of the project. Other relevant background literature pertaining to the project area and specifically, literature pertaining to dredging and its implications to sea grasses and coral reefs were also examined and the findings are presented in this report.
Figure 1.1: Showing the area of the Gulf of Mannar7
7 Source www.sethusamudram.in
9
Section 1 of the report reviews the technical aspects in the project documents referring to critiques of these as well as other relevant background literature on the project area. The state of knowledge of four aspects of the project is reviewed, namely subsurface geology, bathymetry, sedimentation process and dynamics, and other factors which influence the above four aspects such as cyclones, storm surges and tsunamis. The implications of all of the above on dredge disposal are also analysed.
Section 2 contains an analysis of issues and procedural gaps therein from a legal point of view. Here the Environment Impact Assessment (EIA) Report prepared by the National Environmental Engineering and Research Institute (NEERI) is analysed to see whether it complies with the national and state laws and norms and guidelines prescribed by the Ministry of Environment and Forests (MoEF). The EIA report is also compared with the Terms of Reference under which NEERI was commissioned to prepare the EIA. Section 3 looks at aspects related to post-project clearance namely the conditions of environment clearance, environment monitoring requirements and the Environmental Management Plan (EMP). Section 4 is authored by Dr. Rohan Arthur and looks at the implications of dredging, sedimentation, and its impacts on coral reefs and seagrass meadows. This section reviews and uses literature on dredging, dredging related sedimentation and its impacts on corals and sea grasses to draw conclusions for impacts of the project on the same. This section also provides a detailed bibliography on effects of dredging on sedimentation, and on coral reefs and seagrass ecosystems in particular. Section 5 contains an economic review of the project authored by Jacob John. It looks at four critical aspects of the economics of the project that have been presented by the project authorities, namely distance saved, time saved, fuel saved & project financing. Section 6, the last section, summarises the findings of the above sections and analyses their implications and provides recommendations based on this review. Sections 1,2, 3 and 6 were authored by Sudarshan Rodriguez.
10
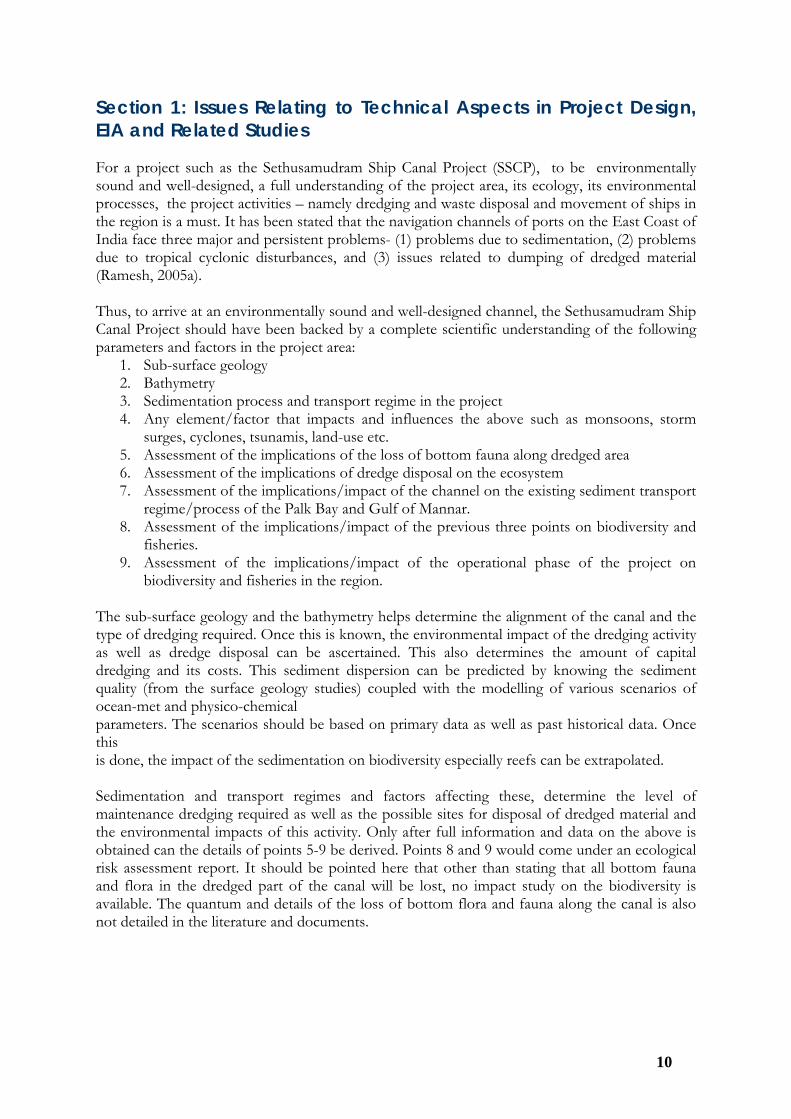
Section 1: Issues Relating to Technical Aspects in Project Design, EIA and Related Studies For a project such as the Sethusamudram Ship Canal Project (SSCP), to be environmentally sound and well-designed, a full understanding of the project area, its ecology, its environmental processes, the project activities – namely dredging and waste disposal and movement of ships in the region is a must. It has been stated that the navigation channels of ports on the East Coast of India face three major and persistent problems- (1) problems due to sedimentation, (2) problems due to tropical cyclonic disturbances, and (3) issues related to dumping of dredged material (Ramesh, 2005a). Thus, to arrive at an environmentally sound and well-designed channel, the Sethusamudram Ship Canal Project should have been backed by a complete scientific understanding of the following parameters and factors in the project area:
1. Sub-surface geology 2. Bathymetry 3. Sedimentation process and transport regime in the project 4. Any element/factor that impacts and influences the above such as monsoons, storm
surges, cyclones, tsunamis, land-use etc. 5. Assessment of the implications of the loss of bottom fauna along dredged area 6. Assessment of the implications of dredge disposal on the ecosystem 7. Assessment of the implications/impact of the channel on the existing sediment transport
regime/process of the Palk Bay and Gulf of Mannar. 8. Assessment of the implications/impact of the previous three points on biodiversity and
fisheries. 9. Assessment of the implications/impact of the operational phase of the project on
biodiversity and fisheries in the region. The sub-surface geology and the bathymetry helps determine the alignment of the canal and the type of dredging required. Once this is known, the environmental impact of the dredging activity as well as dredge disposal can be ascertained. This also determines the amount of capital dredging and its costs. This sediment dispersion can be predicted by knowing the sediment quality (from the surface geology studies) coupled with the modelling of various scenarios of ocean-met and physico-chemical parameters. The scenarios should be based on primary data as well as past historical data. Once this is done, the impact of the sedimentation on biodiversity especially reefs can be extrapolated. Sedimentation and transport regimes and factors affecting these, determine the level of maintenance dredging required as well as the possible sites for disposal of dredged material and the environmental impacts of this activity. Only after full information and data on the above is obtained can the details of points 5-9 be derived. Points 8 and 9 would come under an ecological risk assessment report. It should be pointed here that other than stating that all bottom fauna and flora in the dredged part of the canal will be lost, no impact study on the biodiversity is available. The quantum and details of the loss of bottom flora and fauna along the canal is also not detailed in the literature and documents.

11
Table 1.1 Chronological Timeline of Project Dec 1998 NEERI Initial Environmental Examination (IEE)
May 2003 & Feb 2004 NEERI-NSDRC Sea Geo Survey in the Pamban Pass Area
Jan-Feb 2004 NHO Bathymetry survey (25 January – 18 February 2004)
May 2004 NEERI EIA (this version titled ‘Rapid EIA’ was circulated for the
public hearings)8
July 2004 NEERI’s TFEAR Report9 (incorporates NHO Bathymetry survey)
August 2004 NEERI EIA (Final Version appears online without the words ‘Rapid EIA’)10 (incorporates NHO Bathymetry survey)11
August 2004 L&T- Ramboll was entrusted with preparing the Detailed Project Report in August 2004
Nov-Dec 2004 NIOT Bathymetry Survey (6-23 November 2004 and 16-17 December 2004)12
February 2005 L&T-Ramboll DPR13
February 2005 Indomer-Alkyon, Hydrodynamic Modelling Sedimentation Studies and Ship Manoeuvring Study for Sethusamudram Ship Canal14
31 March 2005 Ministry of Environment grants Environment Clearance to SSCP15
The above table will assist to following information flow or gaps therein in the preparation of the various SSCP project documents. This is explained in the following sections.
8 The authors had procured copies of the May 2004 NEERI EIA report at the time of its release. 9 (NEERI, 2004b) Available at http://sethusamudram.gov.in/Images/TechnoEconomicReport.pdf 10 (NEERI, 2004a)This version is available online at http://sethusamudram.gov.in/images/eia_fullversion.pdf 11 A reading of both versions shows that the August 2004 version only contains additional information on the Adam’s bridge region. 12 (NIOT, 2004) Available on http://sethusamudram.gov.in/BathyStudy.asp 13 (L&T-Ramboll, 2005) Available on http://sethusamudram.gov.in/Images/Sethusamudram%20Final%20DPR-%20Rev.A%20-%20Feb%202005%20-%20Print.pdf 14 (Indomer-Alkyon, 2005) Available on http://www.sethusamudram.in/pdfdocs/HydroStudy.pdf 15 Available on http://sethusamudram.gov.in/EnvMinistry.asp

12
1. Sub-Surface Geology In order to identify the method of dredging for the various sections of the canal, the knowledge of sub-surface geology is absolutely essential. As mentioned earlier, this knowledge is also essential, to identify the potential impacts of the dredging on the environment. Dr. R. Ramesh points out that the EIA and other investigations conducted by the project authorities contain very scanty information on the sub-surface geology of the channel’s alignment (Ramesh, 2006). This has also been admitted in the L& T Ramboll Detailed Project Report (DPR) and in the Technical Feasibility and Economic Analysis Report (TFEAR) prepared by the National Environmental Engineering Research Institute (NEERI). The relevant sections of the respective reports are quoted below:
“Geo-technical data to determine the nature of the soil parameters below the seabed has been obtained at three locations in water depths of 2, 3 and 5m in the Adam's Bridge area using jet probe drilling operations...No geo-technical investigations have been carried out by NEERI along the rest of the channel alignment in Palk Bay or the Palk Straits area where dredging is envisaged." (L&T Ramboll DPR 2005: Section 5.2.3, 1st paragraph, page 5-5).
“The costs may face upward revision as it has been observed that in more than 50% of the dredging contract there have been very large cost overruns mainly due to poor soil investigation. Investigations carried out in this study are based on sub-bottom profile except for three borings in Adam’s Bridge and there is apprehension that hard strata will be encountered in Palk Bay/Palk Strait area. If bottom strata turn out to be rock, the dredging costs will change drastically, as blasting might be required” (NEERI TFEAR, 2004: 1st paragraph, page 5.1-114). The NEERI TFEAR (in section 5.1.1.1 , page 5.1-65 & 5.1-66) mentions that the National Hydrographic Office, Dehradun had collected bathymetry data and also carried out a sub-bottom seismic survey for the Palk Strait area and NSDRC carried out a similar exercise for the Adam’s bridge area and that recent drilling data (bore holes) in the Palk Bay is not available (Ramesh, 2006). The NEERI TFEAR further points out (on page 5.1-66) that ‘detailed sub-soil investigation must be carried out as it is essential” and also that “any short cut will be a disaster for the project”. Dr. Ramesh suggests that, as the NEERI EIA did not have a full knowledge base of the sub-surface geology, the L&T Ramboll DPR recommended “Marine boreholes up to -16 m, suitably staggered covering the width of 1 km of alignment in suitable numbers so as to collect all information for full understanding of the dredged area” (L&T Ramboll DPR 2005: pages 5-6 and 5-7) (Ramesh, 2006).
Krishnasamy16 in his article states that the L&T-Ramboll DPR considers the soil to be mostly dregdeable but in some reaches, blasting may be required before dredging, due to the hard nature of the sandstone that may be encountered in drilling (Krishnasamy, 2005)17. He has also based this on the 44 vibro-coring operations done by National Institute of Ocean Technology (NIOT) during January – February 2005 (NIOT, 2004). This view is also held by Seshagiri18 in his assessment of the same investigations and his conclusion is that “the vibro-core data had indicated harder strata at depth. The amenability of this medium to conventional dredging is to be ascertained” (Seshagiri, 2005). 16 Dr.V.S. Krishnasamy is a renowned expert Engineering Geologist and was the Former Director General of Geological Survey of India. He was personally involved in the Sub Surface Geological Studies for the construction of the Pamban Bridge Project (also located in the Project Area). 17 Also available on http://neelankrisna.blogspot.com/2006/02/sethusamudram-dredging-technical.html 18 Dr. Seshagiri was the Former Director, Geological Survey of India
13
The NEERI TFEAR also states (section 5.1.1.1, page 5.1-65) this by saying, “In the event that hard strata comprising rock is encountered, the dimension of dredging costs will drastically change as blasting might be required.” On NIOT’s Geological & Geo-technical Assessment of the sub-sea region, Krishnasamy states that in order to correctly ascertain the nature of the formations to be excavated and to decide whether they are dregdable, or if blasting will be required in specified sections, vibro coring or the jet coring methods may not provide fully satisfactory information (Krishnasamy, 2005). He is of the view that rotary drilling is required using “large diameter bits and barrels with stipulation of short runs and double tube core barrel and the usage of dry drilling techniques to the maximum extent possible.” This was done earlier by the Geological Survey of India in the 1970s for the exploration of the Pamban Bridge foundation and based on those investigations he states there will be a need for some quantum of blasting to be done in the excavations. He also points out that the costs of blasting has not been taken into account while estimating the cost of capital dredging and more importantly, the impact of blasting on the marine environment, ecology and fisheries has not been taken into account in the NEERI EIA.
The lack of knowledge on the nature of the substratum of the region is also pointed by Rajendran (Rajendran, 2005a; Rajendran, 2005b). He adds that the impact of the bottom topography as a result of possible blasting especially on the movement of currents is not known or studied. Ramesh cautions that as a result of the gaps in the sub-surface geology, the nature of the dredged spoil is currently known only for about 38.5 to 40.5% of the total dredged spoil (Ramesh, 2005a; Ramesh, 2005b). From the above it is clear that the all documents especially the EIA had a poor understanding and information of the sub-surface geology. Consequently the kind of dredging that is required in this region and its impacts on the environment were not estimated scientifically. Thus the present views on environmental impacts of the dredging and disposal of dredge material in this region is incomplete and is potentially much greater than stated in the NEERI EIA. 2. Bathymetry Precise data on bathymetry is essential to estimate the amount of capital dredging required (along with sub-surface geology data). From this information, the quantum of dredging required using various techniques (based on sub-surface geology data) in different sections of the canal can be ascertained to arrive at an accurate estimation of capital dredging costs. The bathymetry, sub-surface geology and the type of dredging determine the total sediment that may be dispersed and hence are also relevant inputs for dredge management programme which can based on the above information can mitigate and reduce the environmental impact and sediment dispersal. A bathymetric survey was done by NEERI (along with the National Ship Design and Research Centre) in the Pamban Pass area of the Adam’s Bridge in May 2003 and February 2004. In addition to this, the National Hyrdographic Office (NHO) had done a survey in January-February 2004 for the channel alignment proposed by NEERI earlier, starting from the north-side of the Adam’s Bridge area. This was mentioned in the July 2004 version of the NEERI TFEAR and the August 2004 version of the NEERI EIA. The L&T-Ramboll DPR suggested that a fresh Bathymetry Survey with much finer resolutions than the one presented by NHO would be necessary to arrive at reasonably accurate estimates of

14
capital dredging (L& T DPR, section 5.2.4, page 5.6). It has been stated that this new Bathymetric Survey was carried out by NIOT, Chennai in the periods 6-23 November 2004 and 16-17 December 2004 but the data was not used in the L&T-Ramboll DPR for calculating the total volume of capital dredging. Also the environmental implications of this new data was not ascertained and never incorporated into the EIA (Ramesh, 2006). It is quite clear from the above that there were serious gaps in the knowledge of bathymetry along the sections of the channel and project authorities or consultant agencies made no attempts to incorporate revised information in their project cost estimates or in environmental assessments of the channel. 3. Information base and Data on Sedimentation As stated earlier, one of the three major persistent problems that navigation channels of ports on the East Coast have been facing is sedimentation (Ramesh, 2005a; Ramesh 2005b). Ramesh points out that the NEERI EIA had collected primary data on the sedimentation rate of Adam’s Bridge area only, and presented the volume of maintenance dredging for the Adam’s Bridge section of the channel only; it had not presented the same for the Palk Strait section of the channel as it had not collected the primary data on sedimentation dynamics for this area (Ramesh, 2006). The DPR itself points out that there are no studies on the littoral processes and flow characteristics that will affect the channel in the Palk Straits region and it suggested mathematical model studies on wave predictions and flow modeling to study sediment transport (L&T-Ramboll DPR, 2nd paragraph, section 5.3.4, page 5.8). This was later done by Indomer-Alkyon which presented a report on the “Hydrodynamic Modeling and Ship Maneuvering Studies” in February 2005. The lack of studies and data in the EIA and other documents on the littoral processes and flow characteristics that will affect the channel in the Palk Straits region have been highlighted by many including the fact that this area (the Palk Bay/Straits) is noted for unusually high sedimentation rate and is one of the five permanent sediment sinks of India. (Rajendran 2005a; Rajendran, 2005b; Ramesh, 2004; Ramesh, 2005a; Ramesh 2005b). The sediment sink and transport mechanism in the region (both Palk Bay and Gulf of Mannar) is yet to be fully understood. In fact, there is evidence to suggest that there is an annual seasonally cycle that allows sediment flow from the Palk Bay into the Gulf of Mannar along the Adam’s bridge.(Dwivedi, 2006). A satellite picture illustrates this below:

15
Figure 1.2.Satellite image showing sediment dispersal patterns from Palk Bay to Gulf of Mannar through the Adams bridge area.19
Thus, the canal through the Adam’s bridge might increase this sediment flow into the Gulf of Mannar from the Palk Bay thus impacting and affecting its sensitive ecosystem. This literature on this dimension and impact is not available and has not been studies by the NEERI EIA The total calculated annual sediment load for this sink is said to be 58.8 × 10⁶ m3 and this is said to cause a sea depth reduction of one cm/ year (Chandramohan et al. 2001). The NEERI TFEAR and NEERI EIA have summarily ignored data contained in this paper (Ramesh, 2006). The net quantum of littoral sediments entering into the Palk Bay from the Nagapattinam coast is calculated as 0.095 × 10⁶ m3 (Sanil Kumar et al., 2002). The NEERI EIA calculated the net annual sediment transport by long shore current and tides in the Adam’s Bridge area as 0.2657 × 10⁶ m3. Ramesh points out that 99.39% of the total sedimentation volume is yet to be accounted for Ramesh, 2005a; Ramesh, 2005b). Researchers have identified that sediment building activity due to sea (littoral) currents seem to occur at the rate of 29 metres/year in the Vedaranyam-Jaffna peninsular stretch of Palk Bay. They opine that there is a possibility that in another 400 years there may arise a connection between Vedaranyam and the Jaffna peninsula (Ramasamy et al, 1998). Rajamanickam has noted that the spit growth in Manamelkudi is of the order of 0.75 m per year and based on the data obtained from the maritime surveys conducted between 1960 and 1986, suggests a sedimentation rate of ~24 cm per year within the Strait (Rajamanickam, 2004).
19 Source: Dwivedi, 2006

16
Ramesh cites the above two studies to conclude that there are specific regions in the Palk Bay where the annual sea depth tends to reduce 25 to 75 times more than the average value proposed by Chandramohan et al (2001) and also points out that the two legs of the SSCP where dredging is required coincide with two such zones with high sedimentation rates (Ramesh, 2005a; Ramesh, 2005b). In fact, the EIA has used values selectively to come up with an average estimate and neglected the fact that different stretches of the Palk Bay may have variable sedimentation rate (Rajendran, 2005a; Ramesh, 2005b). Critics have stated that NEERI EIA needs to incorporate the information and data from the most important research papers on sedimentation process in the project area that had been published in peer reviewed science journals after the year 1989 (Ramesh 2004b; Ramesh, 2005a; Ramesh, 2005b). Some of these are Sanil Kumar et al. (2002), Ramasamy et al. (1998), and Chandramohan (2001). This has also been pointed out by Rajendran (2005). Even the NEERI TFEAR has failed to incorporate the data and criticisms contained in these papers, despite their sound and logical arguments. The NEERI EIA report assessed the maintenance dredging in the Sethusamudram Ship channel based on the silt movement pattern on the east coast. This was pointed out by the NEERI TFEAR report (section 5.1.2 B, on page 5.1-71) which states “The environmental impact study has assessed the maintenance dredging in the Sethusamudram Ship channel of the order of 0.1 million cubic meters per annum. This is based on the silt movement pattern on the east coast.” The L&T-Ramboll DPR in section 8.3, page 8-2 also points out the same stating “M/s NEERI in their EIA studies have assessed the maintenance dredging to be in the order of 0.1 million cubic meters based on the silt movement pattern on the east coast”. The DPR observation (section 4.3.3, page 4-5) on the NEERI TFEAR report is that “the annual maintenance dredging in the Adam’s Bridge area is mentioned to be 0.1 million m3 in the NEERI report which is not substantiated by scientific assessments or calculations”. The NEERI TFEAR does not use current baseline information on the sediment dynamics derived from any field studies and like the NEERI EIA, it too does not use any primary data and is hence seriously inadequate as an assessment.
Rajendran also points out that the EIA has looked at the sedimentation dynamic of very few areas of the canal and not studied the adjacent portions of Palk Strait which is noted for its unusually high sedimentation rate (Rajendran, 2005b). This is also reflected by Ramesh’s analysis of the literature references in the NEERI EIA which notes that the data referred to in the EIA related to Palk Bay and Mandapam areas is just one fourth of the data refered to on the Gulf of Mannar giving an increased importance to the data resources related to the Gulf of Mannar (GOM) area (Ramesh, 2004a). He concludes in another paper (Ramesh, 2005a) that the NEERI EIA has not addressed the question of sedimentation dynamics comprehensively, rendering the estimates on capital and maintenance dredging suspect. The Hydrodynamic Modeling Study by Indomer Hydraulics to calculate the amount of maintenance dredging for the Palk Strait area arrives at the conclusion that the volumes of sediment inflow and outflow in the channel section of the Palk Strait area were similar, and thus there would be no need for Maintenance Dredging in this area of the Channel. This is summarised by the L&T-Ramboll DPR in section 8.3 on page 8-4. This conclusion is totally unsupported by the literature mentioned previously. Critics have shown that the phenomenon of increased siltation seen in Palk Strait area is in fact identified by the presence of the numerous

17
spits and shoals existent in this area and this contradicts the conclusion of this modeling study and argues the study to be wrong on scientific grounds (Ramesh,2006).
4. Cyclones, Monsoons and Sedimentation Ramesh mentions that the exact role of cyclones in influencing the sedimentation pattern has not been studied in detail (Ramesh, 2005a; Ramesh, 2005b). It has been noted that storms have a tendency to transport sediments into the Palk Bay from the Nagapattinam Coast and from the Gulf of Mannar. The NEERI EIA itself points this out (in section 2.2.3.1 , page 64 of the pdf version), stating “In case of occurrence of cyclones in the Gulf of Mannar, such prolonged deposition of sediments move north and enter in Palk Bay through Pamban Pass and Adam’s Bridge. Once the sediments enter Palk Bay, the environment favors immediate deposition…Similarly any cyclones moving in Palk Bay, would generate large southerly waves and transport sizeable amount of deposited sediments into Gulf of Mannar. In the event of absence of cyclones, the deposition will increase causing the enlargement of the sand spit and shoaling across Adam’s Bridge, but the order of sediment exchange will be limited.” The accretion in the Vedaranyam offshore area by describing how the Southwest Monsoon disturbs the sediments of the tidal flats in the northern portion of Palk Bay and how these sediments are obstructed in their northerly movement by the Vedaranyam land projection (Natesan, 1993). She further mentions that the transport of sediments from north during the North East Monsoon are unable to take a bend around the Vedaranyam tip and that a portion of these sediment starts traveling eastwards and the rest move down south along with the longshore currents. The report of the “Hydrodynamic Modeling and Ship Maneuvering Studies” by Indomer-Alkyon Company, in section 3.1 page 5, mentions that cyclones need not be studied with respect to their impact on the sedimentation dynamics of the project environment: “Information on the normal wave conditions is required for further studies on sedimentation and erosion and to establish the limiting conditions for navigation through the channel. Information on the extreme wave conditions is required for the design of various structures, like groynes and bank protection. This is the normal practice followed in port engineering”.
Dr. Ramesh, points out that the Indomer-Alkyon study has included in it, the data of extreme winds that have reached speeds only up to 31.5 km/hr and not higher (Ramesh, 2007). The Indomer-Alkyon study mentions (in section 4.7.1, page 46) that it calculates the potential sedimentation, which could occur in this channel section only for year with “normal” environmental conditions and that “the sediment transport and deposition pattern may differ for extreme environmental conditions, during strong wind, heavy monsoon season and cyclonic period”.
The project area is known to suffer from increased sedimentation from extreme meteorological, oceanographic or geological phenomena. In addition to the sedimentation dynamics, Ramesh states that the canal project area is also threatened by cyclones and cites expert studies which, based on the degree of uncertainty in the prior prediction of cyclones, have termed this coastal stretch as the most vulnerable among the many regions along the Bay of Bengal (Ramesh, 2005a; Ramesh, 2005b). He highlights the fact that 64 cyclones hit the Tamil Nadu Coast between 1891 and 2000. Out of these, 36 (55%) were severe cyclonic storms (wind speed exceeding 89 km/hour) and 23 storms have crossed the project area. Based on the storm surge values (3–5 m), the India Meteorological Department considers the coastal stretch between Nagapattinam and Pamban (the canal project area) a high risk zone (Jeyanthi, 2002).

18
Ramesh further analyses the data on Cyclones from the Global Tropical and Extra Tropical Cyclone Climatic Atlas (GTECCA) presented by L&T-Ramboll DPR (for the period 1977-1993) in section 3.6 , page 3-6 and in Annexure A.3.1 page 1 to 6, and points out that the return period for winds that have speeds greater than 64.82 km/hr for the project area is 2.83 years and that 26 storms and hurricanes have crossed the project area in the period 1880-1993 (114 years) and the return period for one storm or a hurricane in the project area for 1880-1993 is 4.38 years (Ramesh, 2006).
Indomer’s Hydrodynamic Modelling Study has failed to take note of these points and thus has significant gaps on the maintenance dredging and the stability of dredge dumpsites. Ramesh points out that both the NEERI EIA and Indomer’s Hydrodynamic Modelling Study calculations are not on a firm scientific ground as neither have attempted to gather primary data regarding the sedimentation dynamics existent in Palk Strait especially for both cyclone free and cyclone prone years (Ramesh, 2006).
Hence, it is fair to conclude that the knowledge in the NEERI EIA, L&T-Ramboll DPR, NEERI TFEAR of sedimentation process and transport has very serious gaps which carry forward to the Environment Impact Assessment, selection of dredge disposal sites and calculation of maintenance dredging. 5. Tsunamis and the SSCP The EIA did not cover any aspect of tsunamis. This was perhaps because it was prepared before the tsunami of 26 December 2004. However, the risk of disasters such as a tsunami were brought up during the public hearings mandated under the EIA Notification even before December 2004 but were dismissed and these concerns were not taken into account when forwarding the EIA to the Ministry of Environment and Forests20. However, Chapter 18 on risk analysis in the L&T-Ramboll DPR (which was finalised in February 2005, much after the Asian tsunami) does not cover any aspect on tsunamis and only states that the Canal is reviewed for tsunami effects and that it is fully protected as it is in the shadow area of Sri Lanka (See L&T-Ramboll DPR, Section 18.4 Page 18-8). No further details or reference of this review are given. In the above statement, the DPR assumes the likelihood that a tsunami similar to the one that struck the Indian Ocean in Dec 2004 will be shielded by the land mass of Sri Lanka. This assumption is a serious shortcoming when viewed in light of recently published papers in internationally renowned peer reviewed journals, which suggest that the likelihood of earthquakes and tsunamis have increased significantly (McCloskey, 2005). It is not suggested in any literature that all future earthquake-induced tsunamis will only originate from a particular location and consequently follow a tested path. Thus there is a possibility that the Gulf of Mannar/project region might not be shielded by Sri Lanka, as suggested by the DPR, in cases of tsunamis of different intensity, points of origin and so on. The studies on the website of the SSCP (Patterson, 2005), the animation models by Tsunami Animation by National Advanced Institute, Japan21 and Tsunami Animation by Indomer-Alkyon Crystal Hydraulics, Chennai22 and the Tuticorin Port’s response23 seem to suggest that the 20 Ramesh, R. (2006), Pers. comm. 21See http://www.sethusamudram.gov.in/Images/animation.gif 22 See http://www.sethusamudram.gov.in/Images/tsunami.exe 23 Port response to statement attributed to Dr. Tad Murty, Canadian Tsunami Expert on Sethusamudram Ship Canal Project, available at http://www.sethusamudram.gov.in/TedArticle.asp

19
tsunami of December 2004 or any future tsunami had/will have a very negligible impact in the project area. The animation models on the SSCP website are ones of lower resolution of 3 hours and do reveal the true picture of the impact of the tsunami in the project area. Ramesh analyses a higher resolution animation model of 5 hours developed by Dr. Kenji Satake of the National Institute of Advanced Industrial Science and Technology (Ramesh, 2005a)24. He points out that by 150 minutes, the stranded waves at Palk Strait managed to enter Palk Bay in the north by 160 minutes, the waves were well inside Palk Bay and in the south were at Kudankulam coast approaching Tuticorin. He adds that by 170 minutes, these waves from the south had touched Rameshwaram and Adam’s Bridge and thus met the waves from the north in Palk Bay. He mentions that this should have caused a lot of turbulence in the shallow waters of the Bay for at least 20 minutes. He adds that the pull exerted by the westward speeding wave towards the African East Coast, seems to have pulled all the sea water towards itself, resulting in a receding sea level in the Gulf of Mannar which finally caused sea water to flow from the Palk Bay into Gulf of Mannar. From 200 to 220 minutes, the refracted water from the East Coast of Maldives entered the Gulf of Mannar, thus changing the existing north-south current into a current that flowed south to north. A summary of his observation is tabulated below.
Table 1.2: Summary of Analysis of the December 26 2004 Indian Ocean Tsunami
Time After
Earthquake/Origin of Tsunami ( In Minutes)
Location
Impact
140 Waves that were striking Nagapattinam got refracted towards the south towards Palk Strait
Ocean current at Palk Bay was north to south at 140 to 160 minutes
150 Stranded waves at Palk Strait managed to enter Palk Bay
160 The waves were well inside Palk Bay. Waves from the south were at Kudankulam coast approaching Tuticorin.
170 Waves from the south had touched Rameshwaram and Adam’s Bridge and thus meet the waves from the north in Palk Bay
Causes turbulence for 20 minutes
200 Westward spreading wave front off Maldives pulled the sea from the Gulf of Mannar, thus causing the sea to recede from the coast.
Currents take a north to south direction again, causing water flow from Palk Bay to the Gulf of Mannar.
200-220 Refracted water from the east coast of Maldives entered the Gulf of Mannar
Changes the existing north-south current flow into south-north flow
* This table was developed based on descriptions & analysis in Ramesh, 2005a.
From this, he concludes that if the SSCP had been operational, then the fast changing currents at the Bay as well as the resulting turbulence would have considerably damaged the canal and would have caused a dispersal of the dredge in the dredge dumps sites.
24 Available at http://staff.aist.go.jp/kenji.satake/animation.html

20
Ramesh’s observations are validated by the field observations of various other studies and opinions held by many experts. The Department of Ocean Development report states, “However, the survey of the corals of the Palk Bay region showed an increase in sedimentation near the coral reef areas after the incidence of tsunami waves. This is based on sediment traps already placed in several locations of the Palk Bay coral habitats for ongoing research work. The sedimentation rate recorded earlier as 32.5 mg/d in November 2004 had increased to 53.4 mg/d after the event of the tsunami tidal wave flushing into the Palk Bay region. Some corals exhibited partial bleaching near the Pamban viaduct. Reports of people and fishermen in the region confirmed that the water level rose up to 1 meter and then receded back to normal. There was no significant flooding in the nearby coastal areas” (DoD, 2005).
This data from the DoD’s study was later published in detail in the science journal Current Science, which also observed a similar pattern of the tsunami supported by field and anecdotal information (Kumaraguru et al, 2005). In fact, the study observed an overall mean sedimentation rate in the Palk Bay region of 12, 54 and 13 mg/cm2/day during November 2004, December 2004 and January 2005 respectively, with some places showing an increase of almost 64%, indicating substantial increase in sedimentation after the tsunami. 5.1. Need for Post-Tsunami Bathymetry and Geological Investigations In light of the studies on the tsunami cited above, fresh post-tsunami bathymetry and geological surveys of finer resolutions are essential to calculate the exact volume of capital dredging, environmental impacts, and design of dump sites of the SSCP. Prof. G.Victor Rajamanickam25 in his interview26 (dated 12 August 2005) to the web portal www.sethusamudram.in states that the tsunami had churned sediments and brought these materials to the coast, had pushed them further upland and while receding had taken back all the fine heavy minerals, fine silts and clays back to the shelf. Hence the shelf sediments now have a completely new texture after the tsunami. He states that the amount of dredging will be higher because ‘at least half to one meter of sediment must have been deposited at the Palk Strait by the tsunami’. He believes that a resurvey of the seabed along the SSCP canal is absolutely critical to understand the nature and quantum of the sediment present. Prof. Tad Murty27 states in an interview28 to the website www.sethusamudram.in that he feels the Bay of Bengal entrance in the present orientation of the SSCP channel will undoubtedly funnel tsunami energy into the channel and a tsunami wave traveling from the south of Sri Lanka to the southern part of Kerala and through constructed interference29 could augment the tsunami wave 25 Prof.G. Victor Rajamanickam is one of India's eminent coastal geo-morphologists and mineralogists. He is an authority in studies of Tamil Nadu's coastal geomorphology. Till recently, he headed the School of Earth Sciences at the Tamil University, Thanjavur. He currently heads the Department of Disaster Management at the SASTRA Deemed University, Thanjavur. 26 Prof.G.Victor Rajamanickam "Sethusamudram - Can it remain safe and stable in its present form?" - Interview to sethusamudram.in - dated 12 August 2005. Available at http://www.sethusamudram.in/htmdocs/Articles/Interviews/Victor.htm 27 Prof. Tad S. Murty is one of the most respected Tsunami Experts in the world; he advises the Government of Canada on Tsunamis and had played an important role in the development of the 'Baird' simulation model of the December 26th Tsunami. He was on the Editorial Board of the most prestigious Tsunami Journal "Science of Tsunami Hazards" for many years. 28 Interview with Prof. Tad S. Murty titled "Impact of Tsunami on Sethusamudram Shipping Channel and the neighbouring coastal areas" between 7-11 July 2005, available at http://www.sethusamudram.in/htmdocs/Articles/Interviews/tad_murty.htm 29 Phenomenon in which the phases of waves arriving at a specified point over two or more paths of different lengths are such that the square of the resultant amplitude is greater than the sum of the squares of the component amplitudes

21
amplitude, and could thus cause severe impacts there. He is of the view that the SSCP channel with a depth of 12m will indeed provide another route for the tsunami and the energy will be directed towards south Kerala. Thus, it is very clear from the above that if dredging is undertaken without bathymetry and geological investigations then costs overruns, impacts on the environment due to an undue and unexpected increase in the dredge quantity and quality should be expected. 5.2. Disposal of Dredged Material The NEERI TFEAR states, “It is very necessary to carry out a Radio Active Tracer Study to optimise the dredge disposal areas as 80% of the cost of the project is on dredging and disposal of dredged spoil” (NEERI TFEAR, page 5.1.65). It is re-stated here that the NEERI EIA had not carried not any studies on this aspect and the NEERI EIA itself mentions (in section 6.4.1.2, page 318), that “tracer studies have been initiated for further studies to select suitable locations. In no case will dredged spoil be allowed to be dispersed in the Palk Bay.” The SSCP’s EIA should have included information on suitable disposal sites, since the project is located in an ecologically sensitive area and this activity involves obvious environmental implications. Krishnasamy is of the view that it is very premature to come to any conclusion on the suitability or otherwise of the proposed dredge disposal areas (Krishnasamy, 2005). He states that opinion of specialists in oceanographic studies/with regard to the disposal of the dredged material is that it is better to dispose the dredged waste in waters 50-60m deep instead of the current proposal of 25-30m. This view is also held by Prof. G.Victor Rajamanickam who mentions in his interview to www.sethusamudram.in that the present chosen depths of 25-30m for the dumping sites would be disturbed by any monsoon (leave alone cyclones or a tsunami). Rajendran further states that the EIA is ambivalent on the identification of sites for environmentally safe disposal of dredged material thus posing an environmental hazard to marine organisms (Rajendran, 2005a; Rajendran, 2005b). He mentions that some experts are of the view that sediment slides would cause instability in the channel.
Seralathan cautions that the dumping of 82.5 X 10⁶ m3 in highly turbulent open sea will generate turbidity in the water column along with a submergence of bottom communities and that such an environmental effect over vast areas for long time spans will have a long term impact (Seralathan, 2006). He suggests using the dredge spoil to reclaim shallow areas in western Palk Bay to create an artificial island. Ramesh cautions that the nature of the dredged spoil is currently known only for about 38.5 to 40.5% of the total dredged spoil (Ramesh, 2005a; Ramesh, 2005b).
There is ample evidence that the NEERI EIA, a decisive document which should have contained critical information on the impacts of the SSCP, does not adequately assess impacts of dredge disposal on the environment. Aspects such as disposal of dredge spoils have implications for the ecosystem and also for the very activity of dredging, which the TFEAR alludes to, in highlighting the costs of dredging. By deferring such critical and decisive studies, the project pays short shrift to its own economic and ecological viability.

22
Section 2. The SSCP EIA, NEERI’s Terms of Reference, EIA Laws and Guidelines 1. Absence of Risk Analysis/Assessment in the EIA Form A30 of the EIA Notification, 1994, issued under the Environment (Protection) Act, 1986, provides a list of documents and information to be furnished with the EIA by a project proponent. This includes a Risk Assessment Report and Disaster Management Plan (Item No. 11 in Form A). The EIA for the SSCP therefore should have involved the mandatory exercise of risk analysis/assessment. In the NEERI EIA Report for the SSCP the component of risk analysis is absent. However, the same has been done in the project DPR prepared by L&T-Ramboll. The MoEF had produced a manual on EIAs for various sectors, available on their website (www.envfor.nic.in). Section 3.0 of the MoEF’s EIA manual lists a series of review criteria of EIAs, one of which states: Has risk analysis been done; based on which, has the disaster management plan been prepared? 31 NEERI’s Terms of Reference (ToR) for conducting the EIA for the SSCP also specified the need for risk assessment (See section 3.1 and 3.2) (MoEF, 2001).32 The need for risk assessment is also pointed by Kathal suggesting a multi level approach to monitor the ecosystem and evaluate the risk assessment of the region (Kathal, 2005). The reason why risk analysis/assessment is a standard feature of an EIA is that it precludes preparing a Disaster Management Plan (DMP) and an Environment Management Plan (EMP) for a project. Hence, a DMP without a risk analysis/assessment would be incomplete and inadequate. The details of the DMP for the SSCP project are discussed in the next section. 2. SSCP’s Disaster Management Plan In the case of the SSCP EIA, no DMP was prepared. As seen in the earlier section, Form A of the EIA Notification, 1994, requires that a Risk Assessment Report and Disaster Management Plan be furnished along with the EIA (Item No 11 of Form A), and the SSCP EIA should have contained the DMP Report as well. Similarly, this is a requirement of the MoEF’s own EIA manual, where the same review criteria as in the case of risk assessment applies “Has risk analysis been done; based on which has the disaster management plan been prepared?” (Section 3.0 of the manual). L&T-Ramboll’s DPR which does an evaluation of the NEERI EIA for the project also states that a Disaster Management Plan is essential especially in the event of cyclones (See section 12.9.10 of the DPR) and suggests an outline in Appendix 12.1 of the report33. 3. Ecological Risk Assessment NEERI’s Terms of Reference (ToR) for the EIA also specifies the need for an ecological risk assessment. This is also mentioned in the section 1.5.4.6 in the EIA which is given below:
• “Quantification of ecological risks and delineation of ecological risk mitigation measures
30 At the time of the NEERI EIA, the EIA Notification, 1994, as amended upto the year 2004 would have been guiding law. 31 Available on http://www.envfor.nic.in/divisions/iass/eia/Cover.htm 32 Sethusamudram Corporation/Ministry of Surface Transport , Terms of Agreement with NEERI: Sethusamudram Ship Canal Project Terms Of Reference, Annex - I Scope for Comprehensive Environment Impact and Ecological Risk Assessment. Available at http://sethusamudram.gov.in/Terms.asp 33 Seepages 12-14, Section 12.9.10 of the L&T-Ramboll DPR

23
• Analysis of information with regard to environmental impact (direct, synergistic and cumulative) and associated navigational and landward activities in and around the project region
• Quantification of ecological risks with recourse to appropriate ecosystem models” Section 6.6 in the NEERI EIA which is “Impacts on Productivity and Ecology in GoM/Palk Bay” only very briefly and qualitatively lists the impacts and risks with no quantification of the same as suggested by the ToRs and introduction of the EIA. 4. Loss of Scheduled / Protected Species Section 3.2 of the NEERI EIA states that the “Presence of corals along the proposed ship canal alignment is negligible” (not absent!).Again in Section 1.3 it states, “The corals along the proposed channel alignment in Adam’s Bridge do not exist though major groups of biological resources like sea fans, sponges, pearl oysters, chanks and holothuroids at various sampling points have been recorded.” From the above statements it may be inferred that corals (along with sea fans, sponges, pearl oysters, chanks and holothuroids), do exist along the proposed ship canal alignment. Further, the EIA report in section 6.4.1.2 and 6.6 states, ‘Due to dredging, the bottom flora and fauna on an area of about 6 km2 along the channel alignment in Adam’s Bridge and about 16-17 km2 in Palk Bay/Palk Strait area will be lost permanently.’34 The same is also mentioned on page 12-4 section 12.6.2.3, 2nd paragraph of the L&T Ramboll DPR.
Reading the above three points together, it is clear that the dredging activity for the canal will result in the loss of corals, sea fans, sponges and holothurians which are all protected species under the Indian Wildlife (Protection) Act, 1972.35 This under the WLPA this would mandate a separate permission and clearance of the central government ie MoEF (if the species were schedule I and from Chief Wildlife Warden of Tamil Nadu for schedules species other than schedule I. There is no evidence that the project authorities even took such clearances under the Wildlife Act for the loss of these species by the project activities. This has the effect of impeding these agencies from initiating measures to prevent damage to the schedule species or even being actively involved in the clearance of this project. Furthermore, there is also no description and quantification of the extent of the loss of the species along the dredged part of the canal and dredge dump sites (as required by the ToR). The implications to the ecosystem and fisheries have simply not been evaluated altogether. 5. NEERI’s EIA of the SSCP 5.1 Rapid or Comprehensive EIA? One of the central issues around the NEERI EIA report of the project has been whether it is a ‘comprehensive’ or a ‘rapid’ EIA. A project as complex and large as the SSCP necessitates a comprehensive EIA. This has been voiced by many citizens who participated in the public 34 NEERI EIA, see section 6.4.1.2 35 MoEF (2001), S.O.665(E), [11/7/2001] - Amendments to Schedule I and Schedule III of the Wild Life (Protection) Act, 1972 (53 of 1972), MoEF, New Delhi. Available at http://envfor.nic.in/legis/wildlife/so665(e).htm All Corals- Part IV A of Schedule I Entries nos. 1 to 4., All Sea Fans -Part IV A of Schedule I Entries no. 5, All Sea cucumbers (All Holothurians) -Part IV C of Schedule I Entries no. 1, Sponges - Schedule III Entries no. 20

24
hearings. A number of experts have found what is claimed to be a comprehensive EIA to actually be a Rapid EIA. One of them, published in a peer reviewed journal Current Science is particularly critical of the fact that NEERI opted for a rapid EIA (Kathal, 2005). 5.2 Definition of Rapid and Comprehensive EIA Section 1.3 of the EIA Manual by MoEF states ‘The difference between Comprehensive EIA and Rapid EIA is in the time-scale of the data supplied (MoEF, 2001). The Rapid EIA is meant for speedier appraisal process. While both types of EIA require the coverage of all significant environmental impacts and their mitigation, a Rapid EIA achieves this through the collection of ‘one season’ (other than monsoon) data only to reduce the time required.’ Thus, in a comprehensive EIA, the time scale of the primary data supplied is for a full year. The project authorities on various occasions have stated that the NEERI EIA is a comprehensive EIA. However, in many of the very critical components and studies, either only secondary data was used or a full years primary data was certainly absent.
5.3 Multiple Versions of the NEERI EIA An earlier online version of the EIA itself (as well as the document which was publicly available and distributed) refers to it as a Rapid EIA. Section 1.5.1, 2nd para, 1st line states “This rapid environment impact assessment study is to be prepared incorporating ……………………..The comprehensive EIA report will be prepared later based on the primary data collection for the region.” Various sections in the NEERI EIA itself make mention of the fact that it is indeed a Rapid EIA. For instance, page 1.15, Section 1.15.2 gives details of the “Scope of the Rapid EIA”, page 1.16 Section 1.15.3 mentions details on the “Work-plan of the Rapid EIA”, page 1.17 Section 1.15.4 also gives details of the “Workplan of the Rapid EIA”. These references to the word ‘Rapid’ are surprisingly deleted from the online version posted in the SSCP website. 5.4 No full year primary data The NEERI EIA on page 406, section 4.2 states ‘The hydrodynamic studies of the seabed in Adam’s Bridge and its adjoining area have been carried out in May 2003 and February 2004 by retaining the services of National Ship Design Research Centre (NSRDC), Vishakhapatnam.’ In section E.5 page 2 the L&T Ramboll DPR states that for this study that “wave data was collected using a wave rider buoy deployed off Vembar, off the Gulf of Mannar, for a period of one year during Mach 1997 and March 1998” and that “current observations have been carried out at four locations, during three seasons for duration of two days each season”. The details of this are given in section 5.1.1 , table 5.1 on page 5.1 of the DPR (for tides) and in section 5.1.2 , table 5.2 on page 5-3 of the same for (wave measurements). The issue here is the study is limited to one part of the project area, the data for current is only for three seasons and the data is from 1997-98 which is probably part of an earlier study. This data is also used in the Wave and Hydrodynamic Modelling studies of the NEERI EIA. This is also pointed by the L&T-Ramboll DPR which states “the results of the model were calibrated against tide and current measurements carried out in July 1998”. This can be seen in the figures 6.20 to 6.23 on pages 350 to 359 (pdf version) in the NEERI EIA report which all mention 1998 data. Thus, from previous section and chapters and the points mentioned above, we find three issues:

25
1. The studies and data in the EIA are limited to only certain regions of the project area. 2. All the studies do not use a full year’s (all seasons) data 3. The years/periods for which primary data used are not uniform and vary in each case. The data from the Indomer-Alkyon study which should have been part of the EIA or at least should have been incorporated into the EIA, was completely ignored. Even the Indomer-Alkyon study is not based on primary data and uses secondary from inappropriate sources for wind and wave data. On page 6 in section 3.1.1 Indomer-Alkyon study states “For the estimation of wave conditions in the Palk Bay, we used the wind and wave data in the Bay of Bengal north of the Palk Strait, from the Alkyon in-house database, HYDROBASE.NET. This database consists of time series (» 10,000 data sets, for 37 years from 1960 to 1997) of visually observed ship data on wind speed and direction, significant wave height, average wave period and propagation direction.” Further, in addition to the using secondary sources, it uses wind and wave data from the Bay of Bengal for the modelling studies in the Palk Bay which has very different conditions! The DPR categorically states in section 5.1.3 on page 5-4 that “The project areas comprises of three distinct water bodies, namely, - the Gulf of Mannar, Palk Bay and the Bay of Bengal, which are governed by different forcing factors with respect to the wind and tides, which results in different wave climates and circulation patterns.” This is finally pointed out and summarised in the L&T-Ramboll DPR in section 5.1.3 on page 5-4 which states that “primary data collection in respect to the Met-Ocean parameters for the proposed ship channel project was limited”. It goes on to state that the project area has three distinct water bodies – the Gulf of Mannar, Palk Bay and Bay of Bengal and that for these met-ocean parameters (such as wind speed & direction, wave height, period & direction, current speed & direction, tide &water levels) further studies need to be carried out in each of the water bodies. It states “the above have to be established both for operational conditions during all seasons in the three water bodies for cyclonic conditions various (sic) for return periods” This proves that the primary data in the NEERI EIA is minimal and is not for all seasons. Thus, it is quite clear that the NEERI EIA does not fulfil the criteria of a Comprehensive EIA or for that matter even a Rapid EIA. Even to be termed as a Rapid EIA, the collection of atleast ‘one season’s’ data in all studies should have been done. For. e.g. in the case of hydrodynamic modelling in the Palk Bay, the question of the use of ‘one season’ primary data does not arise at all, as it was not done at all (it was done later by Indomer-Alkyon, which, as mentioned earlier was not incorporated into the EIA and which uses secondary data from the Bay of Bengal for the Palk Bay).

26
Section 3. Issues Related to Environmental Management Plan (EMP), Environment Monitoring, Clearance & Monitoring Committee 1. Gaps in Environment Monitoring program The NEERI EIA does not have an environmental monitoring program despite the ToR for NEERI’s EIA clearly stating that the Environmental Management Plan (EMP) will “essentially consist of details of work proposed under mitigative measures, implementation schedule of such measures, fund and manpower requirements and arrangements for monitoring on a long-term basis.” In fact, the NEERI EIA itself further states in section 1.5.2, the Scope of the Study, “Formulation of an environmental quality monitoring programme for various phases of the project to be pursued as per the requirements of statutory authorities.” This lacunae, indeed omission in the EMP of the EIA is pointed out by L&T-Ramboll in their DPR in section 2.5.4 on page 2-12. It states, “The Environment Management Plan reported is well presented but does not cover pre and post project monitoring requirements and mechanisms for environmental management.” In fact, it is the L&T-Ramboll DPR that lays down the detailed environmental monitoring requirements for the implementation & operational phase in appendix A.12.2 on page 2-1 and appendix A.12.2.1 on page 2-3 respectively. This includes monitoring of marine water and sediment quality. This has been adopted by the SSCP and is also on their website on environmental monitoring.36 However, a closer look at the details of environmental monitoring as updated on the website implies that the following parameters are either NOT being followed or not being posted on the website: Chemical Properties: DO, BOD, COD, Oil & Grease, Nutrients, Sulphates, Chlorides Heavy Metals: Fe,Zn,Mg,Mn,Cd,Cr,Hg Bacteriological parameters: Coliform count Marine Biology: Phytoplankton and Zooplankton. Thus only physical properties - pH, EC (electrical conductivity), salinity, temperature, turbidity, TSS (Total Suspended Solids) is being monitored. It also seems that it is being done only for marine water quality and NOT for sediment quality. The SSCP had earlier publicly announced that results of all the environmental monitoring would be updated everyday on the website (Anon, 2005).37 2. Absence of a Dredge Management Programme The Environment management plan (EMP) of the NEERI EIA does not have a dredging management programme. The fact that this is essential is pointed out in the L&T-Ramboll DPR which actually recommends that this be done (L&T-Ramboll DPR, Section 12.9.2 on page 12-11, bullet point 2) 36 See http://sethusamudram.gov.in/Monitor.asp 37 Also available on http://www.hindu.com/2005/07/01/stories/2005070105760400.htm
27
3. Monitoring of Sub-Marine Conditions The L&T-Ramboll DPR in section 12.9.2 page 12-11 bullet point 5 states, “The submarine conditions during the dredging activity should be inspected by divers and photographic and video records should be maintained. This activity should also cover the disposal grounds (at sea)”. This is evidently not being done as seen from the information on the SSCP website where all the environment monitoring detail is being maintained.38 4. Monitoring of other parameters Prof. Rajamanickam stresses that currently important factors like hydrography, bathymetry, current dynamics, total suspension load, climate changes, sea level alterations etc., that have the ability to affect the Project and the Bay are not being monitored either (Rajamanickam, 2005). One of the conditions put forth in the environment clearance letter of the MoEF states, ’Discharge of bilge, ballast, treated sewage, solid wastes, oily wastes and spillage of cargo should not be allowed in Gulf of Mannar’ (Moef, 2005). It must be noted here that the above restrictions have not been extended to the Palk Strait and Palk Bay although these areas are also ecologically sensitive and should also have been planned for in the clearance letter. Seralathan highlights that other conditions from the MoEF’s clearance letter, such as the stoppage of dredging during the fish breeding & spawning periods, and the condition that suspended matter at the dredging sites should not spread more than a kilometer on either side of the channel route have been disregarded by project authorities (Seralathan, 2006). None of the project documents or the MoEF clearance conditions refers to this. 5. Composition of the SSCP Monitoring Committee Many experts have criticised the composition of the monitoring committee which will assess the impact of the dredging activity on the environment and periodically advise the project authorities. Prof. Rajamanickam points out the absence of Earth System scientists such as geo-morphologists, sedimentologists, mineralogists, oceanographers, climatologists in this committee (Rajamanickam, 2005) . He is of the view that they should comprise 90% of the committee which will monitor the possible impact of dredging and maintenance of the project area and that the present monitoring team, which comprises scientists from Marine Biology, Fisheries occupy a role of 10% of the total required monitoring work. He concludes that unless Earth System scientists teams are included right from the initial stages of the project, the whole activity will be a failure sooner or later.
38 http://sethusamudram.gov.in/Monitor.asp

28
Section 4: Dredging, Sedimentation, and its Impacts on Coral Reefs and Seagrass Meadows: Implications for the SSCP 1. Introduction The proposed canal between India and Sri Lanka across the Adam’s bridge connecting the Arabian Sea with the Bay of Bengal has the potential to have very significant consequences on some of the most important marine biodiversity areas of mainland India. The Gulf of Mannar and Palk Bay regions have some of India’s richest coral reef ecosystems and are also home to some of the most extensive and diverse seagrass meadows in the country. Apart from being ecosystems of high productivity and diversity, they perform vital ecosystem functions, protecting coastal systems, and serving as nursery grounds for fish stocks that sustain local fishing communities (Moberg and Folke 1999; Harborne et al., 2006). The seagrasses of the Gulf of Mannar and Palk Bay are additionally important as they represent the last refuge of the globally threatened dugong (Dugong dugon) in mainland India. Given the shallow nature of the Palk Bay and the Adam’s Bridge area, it will require considerable dredging of the sea floor to attain this depth (Ramesh, 2005). The Palk Bay is considered to be one of the biggest sediment sinks along the coast (Chandramohan et al. 2001), and in order to keep the canal open, a certain level of dredging will have to be maintained through the operating life of the canal. Both the initial construction as well as the maintenance dredging will result in the generation of large quantities of dredge spoils, which will be dumped in deeper waters. These activities, along with the increased coastal development that will doubtless result with the establishment of the canal will introduce dramatic changes in the marine environment of the Gulf of Mannar and Palk Bay. This section examines these potential impacts to seagrasses and coral reefs, and discusses the implications of these impacts for marine biosphere managers concerned with maximising the resilience of these systems as well the livelihoods of local communities. 2. Consequences Of Dredging Activity On Marine Environments Marine dredging, by its very nature, is an earth-moving exercise of immense proportions. The SSCP canal proposes to dredge up regions of the Adam’s bridge to between 9m and 12 m depth, from its current 3m to 5m depth as stated in Section E.7 and E.8, page 5 of the Executive Summary of the L&T-Ramboll DPR. The L&T-Ramboll DPR states that the expected dredging amount is 0.1 x 10⁶ m3 and as explained in Section 2 of this review, this in itself is an under-estimation of the amount that would actually require to be dredged. The dredging itself will result in large-scale benthic scarring and removal of all sedentary organisms on the ocean floor. The specific kind of dredging used will eventually determine the nature of the impact on the benthic floor, but the commonly used forms of dredging – anchor dredging and trailer dredging both cause considerable damage (Newell et al. 1998). This direct habitat destruction will result in losses of marine benthic environments along the course of the canal, and can also lead to significant alterations in the characteristics of the sea bed, which may make benthic recovery a protracted process. Recolonisation could begin as early as a year after the event in the case of early successional species, but in the case of more slow-growing, long-lived marine organisms, the recovery could be considerably slower (Newell et al. 1998, also see Figure 2.1.). Large scale changes in bathymetry will also result in alterations in local flow patterns that could change patterns of sediment flux in these waters, and potentially affect dispersal and settlement of

29
benthic organisms. In areas of high flow, recovery could be relatively rapid, in areas where flow rates are much reduced, recovery could take as long as 5-10 years (Van Der Veer et al. 1985).
Figure 2.1. Schematic showing the potential recovery paths of benthic communities after disturbances such as dredging. Early r-selected species lead the succession, followed by longer-lived, K-selected species, leading eventually to an equilibrium community. Estuarine muds and sandy bottoms are subject to constant natural disturbance as well and may never reach an equilibrium community, and quickly regain a transitional state. In contrast, coral reef systems will eventually reach an equilibrium state, but may need between 8-10 years of complete cessation of the disturbance to recover completely (Newell et al. 1998).
Dredging activity associated with the construction of the canal will result in large quantities of dredge spoils which will have to be efficiently disposed. Generally, dredging operations retain a proportion of the dredge materials on board for potential mineral exploitation or as landfill, while the rest is released back into the sea via the reject chute. Although the project proponents propose to dispose the spoils in deep waters 25-30m offshore (Section 12.6.3.1, pg 12-5 m, of the L&T-Ramboll DPR), the dumping of dredge materials could result in a range of deleterious consequences for ecosystems, from burial of the ecosystem to changing sedimentation regimes. This is particularly important given the fact that dredge spoils will be generated not merely during the construction phase of the canal, but throughout the operational phase as well, as maintenance dredging will need to continue through the life of the project (See Section 8.3 page 8-2 and 8-3 of the L&T-Ramboll DPR and Section 2 and 3 of this Review). One of the fallouts of this is that we should expect a marked increase in fine sediment suspension in the waters around the Palk Bay and Gulf of Mannar, and will result in increasing sediment deposits in marine habitats, and a lowering of light conditions. Although only a very small percentage of dredge spoils are represented by fine silty particles, these are generated in sufficiently large amounts to considerably increase sedimentation levels in dredged areas, sometimes for up to 4 years of the dredging activity (Newell et al. 1998). In one estimate of spoils released from the reject screening chutes and from overspill, a typical dredging operation could result in 334 kg.s-1 of fine sand, 19.4 kg.s-1 of silt, and a further 12.2 kg.s-1 of muddy sediment (Hitchcock and Drucker 1996). The spread of these sediments is likely dependent on a combination of particle

30
size, local current patterns and weather conditions. The penumbra of influence of the dredging operations is likely to extend far beyond the dredging zone itself, and may increase the sediment and nutrient loads in nearby marine systems, potentially impacting the region’s coral reefs and seagrasses. The rest of the report attempts to clarify these impacts and its implications for the environmental management of the region. 3. Dredging, Sedimentation and Marine Systems: Coral Reefs As mentioned in the earlier section, apart from the actual physical removal of benthic habitat as a result of dredging, the construction of the canal could have significant flow-on consequences for marine ecosystems in the Palk Bay and Gulf of Mannar by increasing sediment loads. Changed sediment conditions have a range of effects on corals growing on reefs, affecting their basic physiology, reproduction, recruitment, population and community structure. In addition, by potentially favouring other opportunistic species, sediments and the nutrients they bring in, could also work to reduce the overall resilience of coral reef systems. Perhaps the most direct consequence of dredging is the physical removal of coral and other benthic organisms as a result of dredge operations (Newell et al. 1998). This, in effect, resets the ecosystem to a post-disturbance condition, and recovery has to begin from a virtual zero-point. In these cases, the recovery of the reef is likely dependent on a suite of local and landscape-level factors. At the local level, the quality of the dredge-modified will be paramount, particularly if the benthos has been changed so dramatically as to preclude any further recruitment and growth. Depending on how patchy the initial habitat destruction caused by the dredging was, the reef will be reliant to different degrees on external recruitment, and much depends on the integrity of upstream recruitment sources. In the best of all scenarios, after a major disturbance of this nature, reefs are likely to recover as quickly as 5 years after the initial disturbance event, as was documented after a major lava flow killed off virtually all coral in reefs of Banda Island in Indonesia (Tomasik et al. 1996). In the Lakshadweep, after a near complete mortality of coral after a major bleaching event, recovery at some sites was very rapid after 4 years (Arthur et al. 2005). The pattern of recovery in the Lakshadweep was revealing, because other monitored locations showed negligible recovery, driven by recruit survival and hydrodynamic influences (Arthur et al. 2006). In many instances, recovery from dramatic declines or chronic losses can be protracted, and the prospects for regaining the full complement of species in the reef very bleak (Hughes and Tanner, 2000; Lourey et al., 2000; Pandolfi et al., 2003; Lambo and Ormond, 2006). Apart from physical removal, dredging can also result of smothering of corals as a result of releases of dredge spoils drifting into reef areas. The health of the coral is highly dependent on its ability to deal quickly and effectively with sediment loads if it has to avoid being buried under them, and different coral species have different tolerances to sediment loads (Bak and Elgershuizen, 1976; Stafford-Smith, 1993). This tolerance is linked closely with growth form, with branching or vertically plating coral best able to resist sediments through passive transport. Corals also actively reject sediments through mucus formation, and through active ciliary transport of sediments away from their skeleton (Stafford-Smith, 1993; Brown and Bythell, 2005). However, active sediment transport is an energetically costly activity, and places a large physiological demand on corals. This can lead to an eventual decline in calcification abilities and growth rates (Bak, 1978; Edinger et al., 2000; Crabbe and David, 2005). Scleractinian corals are the main structural element of reefs, and depend heavily on the photosynthetic potential of their symbiont zooxanthellae for growth. Under conditions of increased sedimentation that is often the result of sustained maintenance dredging, this could result in serious physiological consequences for coral, including a shift towards increasing

31
heterotrophy, decreased photosynthetic quantum yields, increased mucus production and respiration, and an overall decline in vitality (Riegl and Branch, 1995; Philipp and Fabricius, 2003; Weber et al., 2006). When these conditions become chronic, it can lead to a gradual reduction of coral cover in the area, and an eventual decline of reef health, and its consequences can often be traced long after the dredging events (Esslemont et al., 2004). Sedimentation as a consequence of dredging has other population-level impacts on corals on reefs. Several studies have shown a connection between increased sedimentation and decreased juveniles in reefs (see Fabricius, 2005 for a synthesis). The mechanisms of this shift in population structure have been linked to decreased settlement of recruits on silty or muddy substrates, and reduced survivorship of young settlers in highly sedimented reefs (Gilmour, 1999; Fabricius, 2005; Flood et al., 2005). These changes can have long-term consequences for coral population structure, and can lead to heavily skewed populations (Bak and Meesters, 1999). Dredge sediments and the nutrients they often carry may lead to more subtle changes in reef communities. At one level, this could lead to a gradual shift in communities towards coral species more tolerant of sediment loads, and a gradual change in reef zonation, often coupled with a loss in reef diversity (Acevedo et al., 1989; Clarke et al., 1993; McCook, 2001; Brown et al., 2002). More dramatic are the often rapid shifts in ecosystem states that coral reefs sometimes undergo under conditions of stress, sediments and nutrient loads. These switches in state are termed ‘phase shifts’, and have been reported to occur when nutrient conditions increase (as it often does close to dredged environments), favouring the growth of macroalgae (Done,1992; Umar et al., 1998). When herbivore numbers cannot keep up with the increased macroalgae in these reefs (often because of over-fishing), this can lead to a state where macroalgae rapidly take over the reef, out-competing coral and transforming the reef environment (Hughes, 1994; Hughes et al., 1999; Bellwood et al., 2004). Recovery from a macroalgae dominated state is often a very difficult process, and requires a large amount of management input (Carpenter et al., 2001; Scheffer et al., 2001; Peterson et al., 2003). In perhaps the best-documented case of a coral reef phase shift, after more than 30 years of the initial change in state, there has been very little recovery back to a healthy reef (Hughes and Tanner, 2000; Gardner et al., 2003). 4. Dredging, Sedimentation and Marine Systems: Seagrasses While seagrass ecosystems are not as diverse and complex as tropical coral reef systems, they are vital ecosystems for coastlines. Important among their functions is their role in regulating erosional and depositional processes, in stabilising beaches and coasts, and in trapping sediments (Fonseca, 1989; Gacia and Duarte, 2001; Duarte, 2002; Harborne et al., 2006). They also serve as nurseries for fish stocks, and are essential grazing areas for turtles and dugongs (Duarte, 2002; Waycott et al., 2005; Sheppard et al., 2007). Seagrasses grow on sandy bottoms which are particularly attractive for easy dredging, making them perhaps even more susceptible to dredging and its related impacts than coral reefs. Additionally, seagrasses do not receive the same attention and protection in Indian waters as coral reefs. The Palk Bay, where most of the capital dredging is being conducted, has extensive seagrass meadows, distributed in very shallow waters, and these meadows are at highest risk from dredging and its fallouts. The importance of the extensive seagrass meadows of the Palk Bay and Gulf of Mannar cannot be overstated, as they are a conservation hotspot of regional and global relevance. They represent the most significant meadow system in mainland India, and, with a seagrass diversity of 14 species, are among the most diverse seagrass systems anywhere in the world (Jagtap 2003). As with coral reefs, the most direct impact of dredging on seagrass meadows will be caused by direct removal of seagrass habitats by the dredge. For instance, in the case of Florida’s Tampa

32
Bay, the combined effects of dredging and land-based influences resulted in a loss of more than 80% of its seagrass meadows (Lewis, 1976). The most likely result of dredging is the fragmentation of the meadow, an alteration in habitat arrangement, an increase in gaps and habitat edges, and a change in the transport of nutrients through the meadow (Robbins and Bell, 1994; Bell et al., 1999). The recovery potential of seagrasses after such events is highly variable, dependent on the intensity of disturbance, and the natural history characteristics of the seagrass species that formed the intact community before the disturbance event. While in some cases recovery can be very rapid, in the case of very long-lived, slow-growing species, it may take at least a century for effective recovery to take place (Meinesz and Lefevre, 1984). Apart from direct removal and fragmentation of contiguous meadows, the decreased water transparency, and increased rates of sedimentation caused as a result of the dredging and disposal of dredge materials can severely reduce seagrass habitat quality in a variety of ways. Major changes in benthic topography caused through the construction of canals and other marine constructions can result in significant modifications in sediment flows regimes. This could have important lethal and sub-lethal consequences for seagrass meadows, particularly if these changes result in modifications of the patterns of erosion and deposition that seagrasses are dependent on (Marbà and Duarte, 1995). Sub-lethally, increasing sediment loads can result in changes in rates of vertical elongation and growth as seagrasses struggle to keep up with the increase (Gacia et al., 2003). Additionally, light attenuation as a result of increased turbidity can reduce the photosynthetic potential of seagrasses, one of the key resources necessary for seagrass growth and survival (Hemminga and Duarte, 2000). The insidious impacts of turbidity have been implicated as the major cause of seagrass decline worldwide (Shepherd, 1989; Duarte, 2002). Prolonged exposure to changed turbidity conditions may result in a range of effects, from decreases in below-ground biomass and nutrient contents in tissues, the chlorophyll contents of leaves, and changes in above-ground growth parameters (Gacia et al., 2005; Zimmerman 2006). Every species of seagrass has a different tolerance to turbidity conditions, but it is clear that when these thresholds are crossed, a range of flow-on growth and decline consequences can result (Erftemeijer and Lewis, 2006). As light conditions change as a result of turbidity, seagrass communities may show population and community-level shifts towards species and communities that are more tolerant of the changed conditions, profoundly altering the functional values of the system (Waycott et al., 2005). Beyond chronic insidious processes, increased sedimentation can also result in complete burial of plants. When sediment loads increase beyond the ability of the seagrass to compensate with increased growth, the vital apical sections of the plant are stifled with sand deposition, and the plant will die. When dredging or similar habitat modification exercises result in wide-spread sudden wide-spread increases in sedimentation, entire meadows can be destroyed by burial, often well outside the area of primary impact (Marbà and Duarte, 1995; Duarte et al., 1997; Erftemeijer and Lewis, 2006). Dredging can also often cause an increase in nutrients entering seagrass systems, either through the dredge spoils themselves, or through re-suspension of nutrients from the benthic floor as a result of dredging activity (Newell et al., 1998). Declining water quality can often be detected as changes in heavy metal concentrations that accumulate directly in seagrasses (Filho et al., 2004), suggesting that seagrasses may be a good indicator of changes in water quality. As nutrients increase in the water column, this can result in serious eutrophication impacts on seagrasses, and a suite of fallout consequences. The mechanism of eutrophication and seagrass decline is a complex one, mediated by two main processes. The first is the preferential growth of macroalgae in seagrass meadows as a result of increased nutrient conditions – this can result in an outcompetition of seagrass by space acquisition and shading, resulting in its eventual decline (Peralta et al., 2002). Increased nutrients also often lead to increases in epiphytes growing on seagrass leaves, which can reduce light levels reaching the plant, and all the consequences of light attenuation mentioned above (Wear et al., 1999).

33
5. Management Strategies in the Gulf of Mannar Biosphere Reserve in Response to the Proposed Canal Building Activity There is little doubt that the construction of the Sethusamudram canal will result in sustained, long-term, and potentially irretrievable consequences for important marine ecosystems in the region of its construction. What is less clear is how far the influence of the canal building will spread to the surrounding waters. Much of this will be dependent to a large extent on how sensitively the construction effort is managed and controlled, and whether adequate precautions are taken to ensure that surrounding ecosystems do not decline below previously determined thresholds of acceptable loss. Given time, and with adequate protection from other pressures, many marine systems show remarkable resilience, and may recover fairly quickly from even the worst disturbances, but ensuring that this resilience is not compromised because of developmental pressures is often a huge task. This section attempts to give an overview of the potential consequences and responses of coral reefs and seagrass beds to the canal development activity. This is based completely on a reasoned assessment of the secondary literature available from other areas and other developmental projects. If the section is circumspect in its conclusions, it reflects the natural circumspection that any scientist must maintain in the absence of primary data. The list of scientific documents available in the peer-reviewed literature on the potential effects of sedimentation on the Gulf of Mannar is, to this author’s knowledge, practically non-existent, necessitating the largely derivative approach taken here. Having said that, it is not an unreasonable best practice to use experiences elsewhere to prepare for the range of potential scenarios that the construction of the canal can throw up. A large proportion of the direct damage to marine ecosystems is likely to be felt by seagrasses in the Palk Bay, since that is where most of the capital dredging is focused. However, it is not possible to discount changes to sediment regimes, turbidity and nutrient increases within the Gulf of Mannar Biosphere Reserve jurisdiction as a direct result of this activity. While jurisdictional boundaries may certainly restrict what marine managers can do outside their administrative limits, it must be understood that the particularly fluid environments of coral reefs and seagrasses are strongly influenced by forces often well outside the protected area. Management needs to constantly keep an eye on these factors and be aware of any potential impacts and subsequent changes in parameters (ocean-met, ecological, physico- chemical, or biological). Given the fact that many marine ecosystems also show sudden shifts in their functioning, a fire fighting approach may not be of much use if the system is tipped over the cusp of its resilience potential and can well result in significant reductions in the ecological status of the regions precious coral reef and seagrass environments. It has also been pointed earlier in this section as well as previous sections that there is inadequate literature and data on the environmental impacts especially on the Gulf of Mannar ecosystem in terms of its ecology, biodiversity, and fisheries. Hence in the light of this, developing and adopting a strong monitoring programme is the most prudent approach to be followed by the GOMBRT. The following are a series of small but essential measures that can be undertaken by the GoMBRT in the light of these potential impacts:

34
1. Mapping the distribution of corals and seagrasses in the Gulf of Mannar Biosphere reserve. This community cartographic exercise is absolutely essential to get an idea of what species of seagrass and coral are present in what locations. Apart from being a useful baseline from which ecologically-relevant ecosystem management can proceed, this will give Biosphere managers a good sense of which species and communities are most at risk from sedimentation impacts. 2. Establish a monitoring protocol for seagrasses and coral reefs that directly address the issues of sedimentation, euthrophication and turbidity impacts. As global best practice, most impact assessments will standardly be based on a BACI (Before-After-Control-Impact) design. In the absence of this best practice being employed in the current EIA notification, it may be imperative for the Trust to enforce it at the local level at least to document any potential impacts of the dredging activity. This will serve as an early warning system to alert the manager on remedial action to be taken. Using a functional indicator system approach is ideal for such a monitoring programme, and it could potentially include measures of nutrient and heavy metal accumulation directly in seagrasses. While there are a few monitoring programmes already designed that can be used, most are not geared to dealing with specific functional aspects that may be important in the Gulf and therefore cannot be applied without considerable modification. To be adequate, a monitoring programme needs to prove its sensitivity to changes in sedimentation regimes at sublethal levels. To do this, detailed standardisation studies are required for coral reefs as well as for seagrasses. These studies should be designed to examine the efficacy of a whole range of ecological parameters, to determine which of them, when combined, allow the most sensitive assessment of ecological change in relation to the developmental activities in the Gulf. Ideally, these studies should be conducted over an annual cycle, and will eventually lead to the development of a comprehensive protocol for monitoring. 3. Establishing tight controls over the treatment and deposition of dredge spoils in relation to the reserve boundaries. This should ideally extend well beyond the limits of the boundary, given the inherent connectivity of marine systems. References to Section 4 Acevedo, R., J. Morelock, and R. A. Olivieri. 1989. Modification of Coral Reef Zonation by Terrigenous Sediment Stress. PALAIOS 4:92-100. Arthur, R., T. J. Done, H. Marsh, and V. Harriott. 2006. Local processes strongly influence post-bleaching benthic recovery in the Lakshadweep islands. Coral Reefs 25:427-440. Arthur, R., T. J. Done, H. Marsh, and V. J. Harriott. 2005. Benthic recovery four years after an El Niño-induced coral mass mortality in the Lakshadweep atolls. Current Science 89:694-699. Bak, R. P. M. 1978. Lethal and Sublethal Effects of Dredging on Reef Corals. Marine Pollution Bulletin 9. Bak, R. P. M., and J. Elgershuizen. 1976. Patterns of Oil-Sediment rejection in corals. Marine Biology 37:105-113. Bak, R. P. M., and E. H. Meesters. 1999. Population structure as a response of coral communities to global change. American Zoologist 39 56-65.

35
Bell, S. S., B. D. Robbins, and S. L. Jensen. 1999. Gap dynamics in a seagrass landscape. Ecosystems 2:493-504. Bellwood, D. R., T. P. Hughes, C. Folke, and M. Nyström. 2004. Confronting the coral reef crisis. Nature 429 827-833. Brown, B. E., and J. C. Bythell. 2005. Perspectives on mucus secretion in reef corals. Marine Ecology Progress Series 296:291-309. Brown, B. E., K. R. Clarke, and R. M. Warwick. 2002. Serial patterns of biodiversity change in corals across shallow reef flats in Ko Phuket, Thailand, due to the effects of local (sedimentation) and regional (climatic) perturbations. Marine Biology 141:21-29. Carpenter, S. R., M. C. Press, N. J. Huntley, and S. A. Levin. 2001. Alternate states of ecosystem: evidence and some implications. Pages 357-383 Ecology: Achievement and challenge. Blackwell, London. Chandramohan, P., B. K. Jena, and V. S. Kumar. 2001. Littoral drift sources and sinks along the Indian coast. Current Science 81:292-296. Clarke, K. R., R. M. Warwick, and B. E. Brown. 1993. An index showing breakdown of seriation, related to disturbance, in a coral-reef assemblage. Marine Ecology Progress Series 102:153-160. Crabbe, M. J. C., and J. S. David. 2005. Sediment impacts on growth rates of Acropora and Porites corals from fringing reefs of Sulawesi, Indonesia. Coral Reefs V24:437-441. Done, T. J. 1992. Phase shifts in coral reef communities and their ecological significance. Hydrobiologia 247:121-132. Duarte, C. M. 2002. The future of seagrass meadows. Environmental Conservation 29 192-206. Duarte, C. M., J. Terrados, N. S. R. Agawin, M. D. Fortes, S. Bach, and W. J. Kenworthy. 1997. Response of a mixed Philippine seagrass meadow to experimental burial. Marine Ecology Progress Series 147:285-294. Edinger, E. N., G. V. Limmon, J. Jompa, W. Widjatmoko, J. M. Heikoop, and M. J. Risk. 2000. Normal Coral Growth Rates on Dying Reefs: Are Coral Growth Rates Good Indicators of Reef Health? Marine Pollution Bulletin 40:404-425. Erftemeijer, P. L. A., and R. R. Lewis. 2006. Environmental impacts of dredging on seagrasses: A review. Marine Pollution Bulletin 52:1553-1572. Esslemont, G., R. A. Russell, and W. A. Maher. 2004. Coral record of harbour dredging: Townsville, Australia. Journal of Marine Systems 52:51-64. Fabricius, K. E. 2005. Effects of terrestrial runoff on the ecology of corals and coral reefs: review and synthesis. Marine Pollution Bulletin 50:125-146. Filho, G. M. A., J. C. Creed, L. R. Andrade, and W. C. Pfeiffer. 2004. Metal accumulation by Halodule wrightii populations. Aquatic Botany 80:241-251.
36
Flood, V. S., J. M. Pitt, and S. R. Smith. 2005. Historical and ecological analysis of coral communities in Castle Harbour (Bermuda) after more than a century of environmental perturbation. Marine Pollution Bulletin 51:545-557. Fonseca, M. S. 1989. Sediment stablisation by Halophila decipiens in comparison with other seagrasses. Estuarine, Coastal and Shelf Science 17. Gacia, E., and C. M. Duarte. 2001. Sediment retention by a Mediterranean Posidonia oceanica meadow: The balance between deposition and resuspension. Estuarine, Coastal and Shelf Science 52:505-514. Gacia, E., C. M. Duarte, N. Marbà, J. Terrados, H. Kennedy, M. D. Fortes, and N. H. Tri. 2003. Sediment deposition and production in SE-Asia seagrass meadows. Estuarine, Coastal and Shelf Science 56:909-919. Gacia, E., H. Kennedy, C. M. Duarte, J. Terrados, N. Marba, S. Papadimitriou, and M. D. Fortes. 2005. Light-dependence of the metabolic balance of a highly productive Philippine seagrass community. Journal of Experimental Marine Biology and Ecology 316:55-67. Gardner, T. A., I. M. Cote, J. A. Gill, A. Grant, and A. R. Watkinson. 2003. Long-term region-wide declines in Caribbean corals. Science 301:958-960. Gilmour, J. 1999. Experimental investigation into the effects of suspended sediment on fertilisation, larval survival and settlement in a scleractinian coral. Marine Biology 135:451-462. Harborne, A. R., P. J. Mumby, F. Micheli, C. T. Perry, C. P. Dahlgren, K. E. Holmes, and D. R. Brumbaugh. 2006. The functional value of Caribbean coral reef, seagrass and mangrove habitats to ecosystem processes. Adv Mar Biol 50:57-189. Hemminga, M., and C. M. Duarte. 2000. Seagrass Ecology. Cambridge University Press, Cambridge. Hitchcock, D. R., and B. R. Drucker. 1996. Investigation of benthic and surface plumes associated with marine aggregates mining in the United Kingdom. Pages 221-284 The Global Ocean-Towards Operational Oceanography: Conference of Oceanology International. Spearhead Publications, Surrey. Hughes, T. P. 1994. Catastrophes, phase shifts, and large-scale degradation of a Caribbean coral reef. Science 265:1547-1551. Hughes, T. P., A. M. Szmant, R. Steneck, R. C. Carpenter, and S. Miller. 1999. Algal blooms on coral reefs: What are the causes? Limnology and Oceanography 44(6):1583-1586. Hughes, T. P., and J. E. Tanner. 2000. Recruitment failure, life histories, and long-term decline of caribbean corals. Ecology 81:2250-2263. Jagtap, T. G., Komarpant, D.G, Rodrigues, R. 2003. The seagrasses of India. Page 310 in E. P. S. Green, F.T., editor. World Atlas of Seagrasses. University of California Press. Lambo, A. L., and R. F. G. Ormond. 2006. Continued post-bleaching decline and changed benthic community of a Kenyan coral reef. Marine Pollution Bulletin 52:1617-1624.
37
Lewis, R. R. 1976. Impact of dredging in the Tampa Bay estuary, 1876-1976. Pages 31-55 in E. L. Pruitt, editor. Time-stressed coastal environments: Assessment and future action. The Coastal Society, Arlington, Virginia. Lourey, M. J., D. A. J. Ryan, and I. R. Miller. 2000. Rates of decline and recovery of coral cover on reefs impacted by, recovering from and unaffected by crown-of-thorns starfish Acanthaster planci : a regional perspective of the Great Barrier Reef. Marine Ecology Progress Series 196:179-186. Marbà, N., and C. M. Duarte. 1995. Coupling of seagrass (Cymodocea nodosa) patch dynamics to subaqueous dune migration. Journal of Ecology 83:381-389. McCook, L. J. 2001. Competition between corals and algal turfs along a gradient of terrestrial influence in the nearshore central Great Barrier Reef. Coral Reefs 19:419-425. Meinesz, A., and J. R. Lefevre. 1984. Régénération d’un herbier de Posidonia oceanica quarante années après sa destruction par une bombe dans la rade de Villefranche (Alpes-Maritimes, France). Pages 39–44 International Workshop on Posidonia oceanica beds. Posidonie, Gis France. Moberg, F., and C. Folke. 1999. Ecological goods and services of coral reef ecosytems. Ecological Economics 29 215-233. Newell, R. C., L. J. Seiderer, and D. R. Hitchcock. 1998. The impact of dredging works in coastal waters: a review of the sensitivity to disturbance and subsequent recovery of biological resources on the sea bed. Oceanography and Marine Biology: An Annual Review 36:127-178. Pandolfi, J. M., R. H. Bradbury, E. Sala, T. P. Hughes, K. A. Bjorndal, R. G. Cooke, D. McArdle, L. McClenachan, M. J. H. Newman, G. Paredes, R. R. Warner, and J. B. C. Jackson. 2003. Global trajectories of the long-term decline of coral reef ecosystems. Science 301:955-958. Peralta, G., J. L. Perez-Llorens, I. Hernandez, and J. J. Vergara. 2002. Effects of light availability on growth, architecture and nutrient content of the seagrass Zostera noltii Hornem. Journal of Experimental Marine Biology and Ecology 269:9-26. Peterson, G. D., S. R. Carpenter, and W. A. Brock. 2003. Uncertainty and the management of multistate ecosytems: an apparently rational route to collapse. Ecology 84 1403-1411. Philipp, E., and K. Fabricius. 2003. Photophysiological stress in scleractinian corals in response to short-term sedimentation. Journal of Experimental Marine Biology and Ecology 287:57-78. Ramesh, R. 2005. Sethusamudram Shipping Canal Project. Current Science 88:536-537. Riegl, B., and G. M. Branch. 1995. Effects of sediment on the energy budgets of four scleractinian (Bourne 1900) and five alcyonacean (Lamouroux 1816) corals. Journal of Experimental Marine Biology and Ecology 186:259-275. Robbins, B. D., and S. S. Bell. 1994. Seagrass landscapes: a terrestrial approach to the marine subtidal environment. Trends in Ecology and Evolution 9:301-304.

38
Scheffer, M., R. C. Carpenter, J. A. Foley, C. Folke, and B. Walker. 2001. Catastrophic shifts in ecosystems. Nature 413 591-596. Shepherd, S. A. 1989. Decline of seagrass.in A. W. D. Larkum, A. J. McComb, and S. A. Shepherd, editors. Biology of Seagrasses. Elsevier: New York., New York. Sheppard, J. K., I. R. Lawler, and H. Marsh. 2007. Seagrass as pasture for seacows: Landscape-level dugong habitat evaluation. Estuarine, Coastal and Shelf Science 71:117-132. Stafford-Smith, M. G. 1993. Sediment-rejection efficiency of 22 species of Australian scleractinian corals. Marine Biology 115:229-243. Tomasik, T., R. van Woesik, and A. J. Mah. 1996. Rapid coral colonization of a recent lava flow following a volcanic eruption, Banda Islands, Indonesia. Coral Reefs 15 169-175. Umar, M. J., L. J. McCook, and I. R. Price. 1998. Effects of sediment deposition on the seaweed Sargassum on a fringing coral reef. Coral Reefs 17:169-177. Van Der Veer, H. W., M. J. N. Bergman, and J. J. Beukema. 1985. Dredging Activities in the Dutch Wadden Sea: Effects on Macrobenthic Infauna. Netherlands Journal of Sea Research 19. Waycott, M., B. J. Longstaff, and J. Mellors. 2005. Seagrass population dynamics and water quality in the Great Barrier Reef region: A review and future research directions. Marine Pollution Bulletin 51:343-350. Wear, D. J., M. J. Sullivan, A. D. Moore, and D. F. Millie. 1999. Effects of water-column enrichment on the production dynamics of three seagrass species and their epiphytic algae. Marine Ecology Progress Series 179:201-213. Weber, M., C. Lott, and K. E. Fabricius. 2006. Sedimentation stress in a scleractinian coral exposed to terrestrial and marine sediments with contrasting physical, organic and geochemical properties. Journal of Experimental Marine Biology and Ecology 336:18-32. Zimmerman, R. C. 2006. Light and photosynthesis in seagrass meadows. Pages 303-321 in A. W. D. Larkum, R. J. Orth, and C. M. Duarte, editors. Seagrasses: Biology, ecology and conservation. Springer, Dordrecht, The Netherlands.

39
Section 5. Economic Review of the Sethusamudram Project The Sethusamudram Ship Canal Project envisages the creation of a navigable canal from the Gulf of Mannar to the Bay of Bengal to facilitate movement of ships. Presumably, ships moving from the West Coast to the East Coast of India do not need to navigate around Sri Lanka but can use the channel to save 36 hours of shipping time and 570 nautical miles. The advantage provided by the project includes the creation of a shipping channel from the west coast of India to the east coast of India through the territorial waters of the country. Many authors have highlighted the environmental concerns as well as the economic impact of the project. Many have distinct cost implications including the possibility of cost escalation due to an increase in the amount of capital dredging as well as maintenance dredging. This is supported by scientific opinion that suggests that the amount of dredge material has been under estimated, particularly the amount of new silt that has been deposited in the wake of the December 2004 Indian Ocean tsunami. This report makes a major assumption that that there are no cost escalations due to underestimation of the amount of capital dredging as well as maintenance dredging, though there is enough evidence and literature to suggest otherwise. It looks at the central premise and claim of the Sethusamudram canal to reduce distance, time and fuel consumed for journeys around the Indian peninsula. It also looks at the financing methods of the project especially in the light of a global hardening of interest rates. What it finds is that while the SSCP does conduct a sensitivity analysis39 to highlight the likely effects of different scenarios it does not for example account for the global increases in interest rates that are already at almost double the rates used by the project document. It also finds that the L&T-Ramboll authored DPR highlights the savings of East Coast to West Coast movement of cargo, but fails to account for savings for cargo coming from Africa, the Middle East and Europe. The resulting analysis suggests that there is a need to ask fundamental economic viability questions regarding the SSCP. The benchmark IRR used to approve the project was much lower in an interest rate regime that was very low. However, with a global hardening of interest rates, the basis on which the project was approved needs to be reconsidered. The L&T-Ramboll DPR overestimates the distance saved for ships by choosing Kanyakumari and Tuticorin (referred to as coastal voyages) as starting points for voyages around the Indian peninsula. For ships that arrive from Europe and Africa (referred in the DPR as non- coastal ships), the savings in distance is on an average half of what is claimed in the L&T-Ramboll DPR as they do not need to come to these destinations before going around Sri Lanka. Instead, they can go around Sri Lanka from points which originate just south of Colombo. For these ships, the need to use higher quality fuel as they go through the Sethusamudram canal (due to the increase in carbon deposition at lower speeds for ordinary fuel) means that fuel savings for these destinations are likely to be negligible due to the higher costs of fuel while using the canal. Non- coastal ships are supposed to contribute about two thirds of the revenue of the SSCP, a decrease in patronage from these ships will mean that the project is likely to be a financial disaster. The first section is devoted to the revenues of the project through the distance, time and fuel saved by the usage of the channel. The second part of the review looks at financing of the project including the rupee loan as well as the foreign currency loan and its impact on the revenue stream of the SSCP.
39 L& T Detailed Project Report p 17-7

40
1. Distance Savings One of the central claims of the proponents of the SSCP is that it will dramatically cut the distance travelled for journeys from the East Coast to the West Coast of India, thus encouraging ships to use the canal due to the assured savings in fuel and time. The public statements of the project claim that the journey time will be reduced by 36 hours and the distance by 400 nautical miles.40 The Managing Director of the project claims a more modest average of 24 hours and for ‘certain categories of vessels’ 32 hours.41 The L&T-Ramboll DPR claims that the time saved is 22.5 hours on average for most journeys. Even by the DPR's own generous standards, not a single journey saves 36 hours of shipping time. The only journey to save around 30 hours is the journey from Chennai to Tuticorin, which saves 29.9 hours. This journey can also be made by road or rail in around 10 hours. Even the Managing Directors claims of 32 hours are exaggerated as it ignores the two hours of pilotage that the DPR does factor in and reduces the total savings to 30 hours. On average however, the savings made by ships the DPR claims will be 22.5 hours. We use this figure as the basis of our calculations for all coastal ships.42 The L&T-Ramboll DPR calculates distance and fuel saved by using an average of the distance saved from Kanyakumari and Tuticorin to Chennai, Vishakapatnam and Calcutta. Using the distances saved from these points, an average figure of 335 NM is calculated as shown in table 1.1 below.
Table 1.143
From To Existing
Route SSC Route Savings in Distance
Kanyakumari Chennai 755 407 348 Vishakapatnam 1014 724 290 Calcutta 1357 1103 254Tuticorin Chennai 769 345 424 Vishakapatnam 1028 662 366 Calcutta 1371 1041 330 Average 335.3 As illustrated in the map below (Figure 1.1), the distances saved are measured from points C (Kanyakumari) and T (Tuticorin) and would generally be applicable for coastal cargo.44 For these journeys, one will need to come to point C before using the canal or going around Sri Lanka as per current practice. For journeys from Tuticorin, the savings is measured from point T. The average distance saved from point T and C overstates the actual distance saved. This is because savings in time and distance is smaller for cargo that moves from destinations that are from points like Aden and Mauritius (away from the Indian coast) as ships do not have to come
40 See http://www.deccanherald.com/deccanherald/sep262004/sl2.asp and http://www.financialexpress.com/fe_full_story.php?content_id=92299 41 See http://www.thehindubusinessline.com/2005/10/22/stories/2005102200350700.htm 42 L&T-Ramboll DPR p 15-3 43 L&T-Ramboll DPR p 15-1 44 Coastal cargo is all cargo that moves from one coast of India to another

41
to these points to proceed on a voyage around the coast of India, deviating just south of Colombo or around the Eight Degree Channel.
Figure 1.1, 45 As a percentage of cargo handled, coastal cargo forms only a small part of the total cargo handled by the Sethusamudram project (about 35%), with a large part of cargo (almost 65%) factored into the project, being from the Middle East, Africa, Europe and the USA.46 The savings in time and fuel for non-coastal cargo is smaller than that for Indian coastal cargo. When asked, the Assistant Managing Director – Operations of the SSCP said that the canal would use only the pre-existing global shipping routes, and the details of how the SSCP routes integrate into these routes need to be worked on. It seems to be a basic omission, yet an important one that origin destination pairs for non- coastal cargo has not been calculated, despite it being 65% of the total cargo that is supposed to use the canal! It is a classic case of not reviewing the needs of your customer, but instead assuming that the savings for coastal origin destination pairs will apply for non-coastal cargo. Whether this omission was by design or default, it will have significant impacts on the revenue of the project. Global shipping lanes define the routes that ships can use when on high seas and parts of the shipping lanes are illustrated in the diagram above (Fig 1.1). For journeys from the Middle East (and therefore Europe and USA as all these journeys use the Suez canal) to the eastern coast of India, ships use a lane called the Eight Degree Channel that is south of Lakshadweep and north of the Maldives coming roughly to point ‘A’ shown on the map above. For journeys from Africa, ships use a lane that comes from south of the Maldives arriving at around point ‘B’. It is from these points that the savings for non-coastal cargo journeys need to be measured and not from
45 Downloaded from http://iri.columbia.edu/~mahaweli/climate.lk_mirror/sethu/index.html, with original source being Tuticorin Port Trust 46 We use a ratio of the total coastal cargo to the total cargo from Section 6 of the L&T-Ramboll DPR for this figure. Ratio = 20.2/57.3= 0.35
C
T
A
B

42
either Kanyakumari or Tuticorin. These routes highlight that savings in distance and time is significantly less for all non-coastal cargo. This study did not have access to marine navigation charts in order to plot journeys from non- coastal destinations. Therefore, they were first drawn on a simple TTK India political map (to scale) to redraw the shipping lanes that could be used by ships coming from the Middle East, Africa and Europe. This was then checked using a mapping of shipping routes using GoogleTM
Earth and then further verified using journey calculators that are available online that include e-ships.com. All these methods gave roughly corresponding results for distances for various origin destination pairs.
Table 1.2
For travel from Aden/ Europe
SSCP Normal Savings (km) Savings (NM) Calcutta 3135 3301 307 166 Vizag 2698 2914 400 216 Chennai 2391 2650 480 259
For travel from Africa/ Mauritius SSCP Normal Savings (km) Savings (NM) Calcutta 3194 3217 43 23 Vizag 2767 2835 125 68 Chennai 2458 2579 223 121 Average 142
What we find is that on average, ships from non- coastal destinations save just 142 nautical miles by using the Sethusamudram Canal: less than half of what the DPR claims! As shown in the table above, the savings for a journey from Mauritius (Africa) to Calcutta, could be as little at 23 nautical miles. The implications of this reduction in distance saved is that ships that come from Africa, Europe and the Middle East have little incentive to use the canal as the savings in time are much smaller than what is claimed by the DPR. What is required for an objective comparison of distance saved is greater detail regarding distances saved for different origin-destination pairs. This is shown on the website of the Kiel Canal which highlights how different origin-destination pairs could have different savings in time.47 As overseas cargo ships form a significant portion of the projected SSCP users (around 65%), we do need to consider if it will be economical or sensible for them to use this canal. Journeys from Southeast Asia and Australia to India’s West Coast are not considered in this review . As per the L&T-Ramboll DPR they do not form a significant portion of the external trade of India. However, if they were considered, again, the savings in using the Sethusamudram canal will be equally insignificant or possibly even smaller, as ships will have to change their course as they enter the canal from the Palk Bay side to travel south and then change course again as they leave the canal.
47 http://www.kiel-canal.org/english.htm

43
2. Time Saved This section will investigate the savings in time that are likely by using this canal. It is done in the same format as that followed by the L&T-Ramboll DPR. To reiterate, the canal expects to receive ships that use pre-existing shipping lanes. Therefore, as seen in Figure 1.1 and in Table 2.1, point A will be the point at which the journeys diverge for those ships arriving from Europe and B is the similar point for ships arriving from Africa. While the canal does reduce distance, it does not always reduce the time taken for the journey in a proportionate manner. This is because, within the canal, ships will operate at a restricted speed of 8 knots. This will be significantly lower than their optimal speed of around 12-13 knots.48 Using a similar calculation as used in the L&T-Ramboll DPR49 the savings in time for ships arriving from Africa can be as low as 5 hours and therefore negligible on a voyage that takes many days. For purposes of explanation, we use a voyage to explain how this study as well as the L&T-Ramboll DPR calculates time saved.
Box2.1: Showing calculations of time saved used in the L&T-Ramboll DPR
The voyage used is that from Europe to Kolkata. For voyages coming from Europe and going to Calcutta, the point of deviation is point ‘B’ in the Eight Degree Channel. Existing Route: Distance = 3301 nm Speed in open sea = 12 knots Time = Distance/ Speed = 3301/12 = 275 hours SSCP Route: Distance = 3135 nm Canal length = 82 nm Distance in open sea = 3135-82 = 3053 Speed in canal = 8nm Time taken in canal = Length of canal/ Speed in canal = 82/8 = 10.3 hours Time taken in open sea voyage = Distance in open sea/ Speed in open sea = 3053/12= 254.4 hours Total time taken for using SSCP route = Time taken in canal + Time taken in open sea = 10.3+ 254.4 = 264.7 hours Time Saved = Time taken through SSCP route - Time taken in open sea using existing route – Time for pilotage= 275 - 264.7- 2 = 8.4 hours
48 L&T-Ramboll DPR p 15- 3 49 L&T Detailed Project Report p 15-3

44
Table 2.1 Savings in Time
Table 2.1 (above) repeats the calculations in Box 2.1 across all the voyages given in the L&T-Ramboll DPR and arrives at the average figure. The greatest time that is saved is 18 hours for journeys to Chennai from the Aden. On an average, the net savings in time after accounting for pilotage is around 6 hours: less than a third of what is claimed in the L&T-Ramboll DPR.50 As a point of clarification, we need to state that the speed at which the ships travel in the canal and on open sea is the same as that used in the L&T-Ramboll DPR.51
The L&T-Ramboll DPR assumes that if there are savings in time, the reduction in the time required for the ship to be hired can be considered a savings.52 Time charter rates are the rates at which ships are leased and any reduction in the time taken for hire means a reduction in costs for ships making a voyage through the canal. We use the hire rates (or time charter rates) provided by the L&T-Ramboll DPR without change. The table from the L&T-Ramboll DPR is reproduced below with the savings in time being replaced by the savings in time for non- coastal ships (6.4 hours).
Table 2.2: Time Charter Rates
For non coastal journeys, we know from Table 2.1 that the average savings in time (after adjustment for pilotage etc) is 6.4 hours. This is the reduction in time charter for ships coming from Europe and Africa. For a 10,000 DWT ship with a hire charge of $ 10,800/ 24 hours, the
50 See L&T-Ramboll DPR p 15- 3 51 See L&T-Ramboll DPR p 15- 2 52 See L&T-Ramboll Section 15
DWT 10000 20000 30000 40000 50000
6.4 6.4 6.4 6.4 6.4
10800 12600 13500 15300 18000
2880 3360 3600 4080 4800
Sav ing in Time (hrs )Time Charter Rate ($/24 hrs )Sav ings in Time Charter
From To Existing Route SSC Route
Distance Distance Open Sea
Mauritius Calcutta 3217.0 268.1 23.0 3194.0 82 10.3 3112.0 259.3 269.6 -3.5Vizag 2835.1 236.3 67.7 2767.4 82 10.3 2685.4 223.8 234.0 0.2Chennai 2578.9 214.9 120.6 2458.3 82 10.3 2376.3 198.0 208.3 4.6
Aden Calcutta 3301.0 275.1 166.0 3135.0 82 10.3 3053.0 254.4 264.7 8.4Vizag 2914.0 242.8 216.0 2698.0 82 10.3 2616.0 218.0 228.3 12.6Chennai 2650.0 220.8 259.0 2391.0 82 10.3 2309.0 192.4 202.7 16.2Average 2916.0 243.0 142.0 2773.9 82.0 10.3 2691.9 224.3 234.6 6.4
Savings in Time
Time @ 12nm
Distance Saved
Channel Length
Time @ 8 nm
Time @ 12 nm
Total Time Required

45
savings in cost is 10800/6.4= $ 2,880. This calculation is done for all the categories of vessels as given in the DPR53. The savings in time charter rates are a fraction of what is stated in the DPR. It needs clarification here that the dramatic reduction in savings for some ships does not mean that the savings can be significant for coast-to-coast cargo. The point that this paper makes is that relying solely on coast-to-coast cargo will mean that the SSCP will be an economically unviable project as most of its revenues are projected to be from non-coastal sources. A more detailed analysis should be undertaken to integrate the savings of the coastal cargo and the savings for the non-coastal cargo into a single unit so that we can then further assess the changes likely as a result of these changes. In this review however, we simply make the point that the savings in time and distance are over-stated in the L&T-Ramboll DPR. 3. Fuel Saved One of the principle arguments in favour of the SSCP is that a shorter distance can result in significant fuel savings. Given this scenario and the use of the Sethusamudram canal, a decrease in distance does not always reduce fuel consumption. The DPR highlights that for travel at lower speeds, a better quality fuel is required. When shipping consultants were asked for the reason for this, there were two reasons stated. The first was the fact that a lower quality fuel results in increased carbon deposition in the engines, causing greater damage. Therefore, there was a need to use a lighter fuel that is less damaging to the engines. The other is that many jurisdictions require that low sulphur diesel be used for voyages that go through ecologically sensitive areas. The SSCP’s DPR possibly underestimates the total fuel cost as it does not mandate the use of low sulphur diesel in the ecologically sensitive Palk Bay Biosphere reserve area. In fact, there is no mention at all of low sulphur diesel that should be used in these areas. Our estimates for fuel savings are extracted from the L&T-Ramboll DPR which simply states that the “ships will use IFO in the open seas and MDO in the channel where there is a restriction, and a need for a better vehicle response”.54 IFO stands for intermediate fuel oil and MDO for marine diesel oil. In Table 4.1, we simply use the calculation that has already been used in the L&T-Ramboll DPR to calculate savings using the existing routes for Europe and Africa compared to the potential savings by using the canal. Fuel consumption rates and cost of fuel are taken at the same rate as provided in the DPR. Since the time the DPR was written, fuel prices have gone up dramatically, but we have not taken it into consideration. If it is taken into consideration, our findings would not change dramatically. The principal finding is that by using only coastal ships as a reference point, it makes the project appear like an attractive one for non- coastal ships.
53 See L&T-Ramboll p 15-4 54 See L&T-Ramboll DPR p 15- 2

46
Table 4.1: Fuel Savings
DWT 10000 20000 30000 40000 50000Fuel Consumption (kg/km) 19.9 29.2 36.6 42.9 48.6
Existing Route Distance (NM) 2916.0 0.0 0.0 0.0 0.0Distance (km) 5400 5400 5400 5400 5400Fuel Consumption (kg) 107468 157692 197656 231678 262461
Fuel Rate ($) 180 Fuel Consumption ($) 19344.3 28384.6 35578.0 41702.1 47242.9Canal Route Canal Distance 82 Canal Distance 152 152 152 152 152Fuel Consumption (kg) 3022 4434 5558 6515 7381Fuel Rate ($) 350 Fuel Consumption ($) 1057.7 1552.1 1945.4 2280.2 2583.2Open Sea (NM) 2691.9 Open Sea (km) 4985.5 Fuel Consumption (kg) 99211.2 145576.3 182468.9 213877.4 242294.7Fuel Rate ($) 180 Fuel Consumption ($) 17858.0 26203.7 32844.4 38497.9 43613.1Total Fuel Cons ($) 18915.8 27755.8 34789.8 40778.2 46196.3Savings in Fuel Cost ($) 428.6 628.9 788.2 923.9 1046.7* Fuel rate calculations taken from the L&T-Ramboll DPR p 15-2 In the table above (Table 4.1), we calculate the savings in fuel similar to the method used in the L&T-Ramboll DPR. From table 2.1, we know that the average distance for non coastal voyages is 929.3 nautical miles. We calculate the average savings for a 10,000 DWT vessel in Box 3.1 making a non- coastal voyage as an illustrative example.

47
Box 3.1 Illustrating the calculation of savings for a 10,000 DWT vessel for an average non-coastal voyage
Existing Distance Average Distance = 2916 nm Average Distance = 2916*1.852 = 5400 km Fuel Consumption = Distance (km) x Fuel Consumption (kg/km) = 5400*19.9= 107468 kg Fuel Rate = $ 180 per 1000 kg Fuel Consumption = (Fuel consumption (kg) * Fuel Rate $/kg)/1000= 107468*180/1000= $ 19,344 SSCP Route Canal Distance = 82*1.852= 152km Fuel Consumption = 152*19.9= 3022.1kg Fuel Rate = $ 350 Fuel Consumption = 3022.1*350/1000= 1057.7 Distance in open sea = 2691.9*1.852= 4985 km Fuel Consumption (kg) = 4985.5*19.9= 99,211.2 kg Fuel Rate = $ 180 Fuel Consumption = 99,211.2*180/1000= $ 17858.0 Total fuel consumed in SSCP route = 1057.7+17858.0=$ 18,915.8 Fuel Savings = Fuel cost by existing route – Fuel cost by SSCP route = 19,344- 18,915.8 = $ 428.6 What this means is that the net savings in fuel for ships using the Europe/ Africa route is actually negligible: less than $ 1000 for all ships that are likely to use the canal. The canal for many ships on the basis of fuel cost alone is unlikely to use the SSCP as the gains are much smaller than what has been portrayed in the DPR. In the next table 4.2, we add the savings in fuel costs and the savings in ship charter time to get an idea of the total savings for these ships. This again, is the same method used in the DPR. We add the total savings in time charter (from table 2.3) with the total savings in fuel (from table 4.1) to arrive at total savings for each kind of ship. What we get is an affirmation that the proclaimed savings for ships can actually be a small fraction of what is claimed in the L&T-Ramboll DPR (around 30%). What is significant for this project is that almost two-thirds of the ships using this canal will have a benefit that is just 30% of what is claimed in the L&T-Ramboll DPR. This has huge revenue implications, as these ships are unlikely to be willing to pay the same amount that is claimed by the L&T-Ramboll DPR.
Table 4.2: Savings
10000 20000 30000 40000 50000Savings in Fuel Costs 428.6 628.9 788.2 923.9 1046.7Savings in Time Charter 2880 3360 3600 4080 4800Total Savings 3308.6 3988.9 4388.2 5003.9 5846.7
Savings per DPR 11850 14339.1 15817.3 18050.9 21072.9
Ratio of Savings 28% 28% 28% 28% 28%

48
4. Channel Tariffs The channel tariffs have used a base case of savings where 50% of the total savings can be charged as channel user fees.55 This means that a ship of 10,000 DWT will be willing to pay upto $ 5925 in order to use the canal as they save $ 11,850 by its usage. If they were to stick to this tariff, ships that are coming from Europe and Africa to move to the East Coast of India will use the canal. This is because the savings that they obtain ($ 3,309) is lower than the tariff that is proposed.
If the tariff of $ 5,925 is charged for 10,000 DWT ships, they will end up spending $ -2,616 more by using the canal! It is simple economic logic, that ships will not use this canal unless the tariffs are substantially lower. We then use the ‘pessimistic’ scenario that has been utilised in the DPR. In that scenario, the tariff represents 33% of the projected savings for users. The tariff therefore will be $ 3911 for every ships of 10,000 DWT. Even at this tariff rate (which is considered pessimistic by the DPR), the savings for a ship is negative ($602), though much smaller. This means that even in the pessimistic tariff scenario (where 33% of the savings of the fuel plus time charter is used as a tariff rate), non- coastal ships will find it uneconomical to use the SSCP. 5. Financing of the SSCP The SSCP was conceptualised and developed in a regime where interest rates were considered to be ‘soft’ or low. This was the case worldwide around two years ago. Inflationary pressures driven by oil price hikes and a tightening of monetary policy across many countries including the US, Europe and Japan has meant that interest rates have hardened since the project was written. In India, the prime lending rate has gone up from around 8% to over 10.25%56: an increase of 225 basis points57. The terms of the debt as stated in the L&T-Ramboll DPR are given in Table 5.158:
Table 5.1
Construction Period 3 years Moratorium 2 years Total Loan Tenure 3 + 2 + 8 years Interest Rate 8% Guarantee fee to Government of India 1.2% Payment of interest and guarantee fee Quarterly Repayment Quarterly The loan is a thirteen year loan with a two year moratorium and an interest rate of 8%. In addition, the company has to pay a fee of 1.2% to the Government of India in order to underwrite all debt. This means, that in exchange for a small fee (1.2% of the total loan amount), the government will stand as a guarantor to all debts of the SSCP. As per the financial statements in the L&T-Ramboll DPR, it is proposed to withdraw cash in three instalments of Rs 2732, 1,933 and 2,616 million. After a two-year moratorium on repayments, the repayments will commence and be completed in eight years. Table 5.2 below
55 See L&T-Ramboll DPR Section 15 56 RBI website: http://www.rbi.org.in 57 1 percentage point = 100 basis points 58 See L&T-Ramboll DPR p 17-3

49
shows the likely impact of an increase in interest rates on the total repayment that has to be made to the banking institutions. At the current prime lending rate (10.25%), there is an increase of more than Rs 2 billion for this project (Rs 200 crores). This sensitivity analysis done by the DPR has not factored in an increase in interest rates to this extent (only a 1% increase is factored in).59 It seems to be fiscally imprudent to go ahead with this project with outdated interest rate calculations that have huge cost implications for the company. Table 5.2 below shows how the increase in interest rates affects both the quarterly repayments to be made as well as the total amount to be repaid. A 2% increase in interest rate causes an increase in repayment amount by over Rs. 3 billon: a significant cost that has to be borne by the SSCP.
Table 5.2 8%
(Stated in the DPR)10% 11%
Principal to be repaid after moratorium 9,939 10,712 11,116 Quarterly repayments for eight years 423 490 527 Total amount to be repaid 13,553 15,689 16,858 *Rupees in millions Similarly, in the case of the foreign currency loan, the interest rate has been calculated at 4.25%. This was done when interest rates were soft. Since the time of creation of the L&T-Ramboll DPR, interest rates have hardened globally including the United States of America (for dollar denominated debt). The current prime lending rate in the USA is around 8.25% as per Bloomberg60. This means that the interest rate for the foreign currency loans is just half of what is the current lending rate. This has not been factored into the report, despite the fact that some increase in interest rate has been factored in.
Table 5-3 Construction Period 3 years
Moratorium 5 years Total loan tenure 3 + 5 + 12 years
Interest Rate 4% p.a. Guarantee Fee to GoI 1.2% p.a.
Payment of interest and guarantee fee Half yearly rests Repayment Half yearly
The total amount that has to be borrowed in foreign currency is the dollar equivalent of Rs. 4, 666 and 2,616 million rupees to be borrowed in June 2007 and 2008 respectively. When the cost of credit for both the Indian rupee loan and the foreign currency loan are factored in, the cost of the project goes up dramatically. It then becomes a big question mark given the shaky basis on which the tariffs are structured whether the project will be financially sustainable at all. 6. Other Issues There are some other issues that have to be considered with regard to the Sethusamudram project. This includes the fact that a large percentage of cargo that is likely to pass through the canal will be petroleum oil and lubricants (POL). Much of this cargo moves from Mumbai to Vishakapatnam or Haldia or originates from Africa and moves to the eastern coast. Two additional factors could make this set of cargo irrelevant for ships visiting Indian ports. The first
59 See L&T-Ramboll DPR p 17-7 60 http://www.bloomberg.com/markets/rates/

50
is the increasing number of oil pipelines that have been built across the country, which could transport petroleum products across the country through pipelines. The second is the discovery of oil and gas fields across the Godavari basin and off shore along the eastern coast of India. This could actually further reduce the ship traffic that might use the Sethusamudram canal. Other issues that need to be considered include the risk tolerance of companies that use the canal and the price at which they will decide to use the canal. As the risks of using a closed canal are higher, the tariffs and the cost of using it must fall enough before a shipping company decides to use the canal. It is not clear in the L&T-Ramboll DPR what insurance amount is stated in the financial statements and if it will cover any losses by ships that get stranded in the canal or on the way to it. This report has also not quantified the total economic losses that are likely for the country’s GDP as a result of the reduction in other livelihoods like fishing and tourism around the Palk Bay. The other environmental costs have also not been quantified adequately by the Environmental Impact Assessment report prepared by NEERI. 7. Conclusions of economic aspects While the SSCP has been justified on the basis of the massive cost savings for ships using the canal, this study finds that these cost savings have not been adequately detailed out and grossly exaggerate the actual savings for ships using the canal. This is especially true for ships coming from Europe/Africa or other locations. The fuel savings for many of these ships is actually negative, while the total savings (including reduction in time charter) actually works out to just 30% of what is claimed by the L&T-Ramboll DPR for most non-coastal ships. This significant lower level of savings implies that the tariff that can be charged by SSCP will be much lower than that claimed by the L&T-Ramboll DPR. This has significant revenue implications as over 60% of the ships which ‘benefit’ will not be willing to pay the amount as claimed in the L&T-Ramboll DPR. What is needed is a greater study of economic benefits as per present justification. This review points to the conclusion that this project with its current design, injudicious analyses and ambitious public projections will be a financial white elephant. From the economic analysis perspective, there are a few recommendations for the SSCP project.
1. Preparing a revised origin and destination pairing in order to get a more accurate picture of the savings achieved for ships using the canal.
2. Recalculating interest rates with the revised interest rates being incorporated within the DPR.
3. Recalculating fuel savings with the usage of low sulphur diesel in ecologically sensitive areas like the Palk Bay.

51
8. Diagrammatic representation of factors affecting economic viability of the SSCP
Time Saved Half of Project Claim
Total Savings 30 % of project claim
Fuel Savings Negative
Financially Non-Viable
Distance Saved Half of Project Claim
Project Cost Escalation
Inadequate Estimation of Maintenance Dredging
Inadequate Estimation of Capital
Dredging
Increase in Foreign currency loan, interest rates:
Not factored
Lending rates increase Not factored

52
Section 6: Findings and Recommendations of the Review 1. Findings The first two sections of this review reveal major short-comings in the EIA and other related documents of the project in terms of adequacy and gaps methods used to assess environmental impacts, but more importantly, in terms of data on basic parameters such as sub-surface geology, bathymetry, and sedimentation process in the project area. These data gaps are responsible for the poor design of the project, under-estimations of costs, and the poor assessment of risks, hazards and environmental impact of the project. As result of the poor understanding of the sub-surface geology and the bathymetry, the type of dredging required and the characteristics of the dredged sediments are not known. This means the exact impact while dredging as well as dredge disposal cannot be ascertained and that the impacts on the environment were scientifically inadequate.
. The poor knowledge base of the sedimentation process and dynamics of the project area across all the documents implies that there is an underestimation of the maintenance dredging required in the area (which will result in further cost escalation). This will also result in instability of the dredging dump sites and in turn environmental impacts as a result of this instability.
Even in the basic aspects of the TOR for NEERI, EIA legislation and guidelines laid down by the MoEF such as risk analysis/assessment, disaster management plan, ecological risk assessment have not been done/complied with.
Most importantly the project itself admits to the loss of corals, sea fans, sponges and holothuroids which are all protected/schedule species under the Wildlife Protection Act 1972. And by failing to inform the State Board for Wildlife, Chief Wildlife Warden, warden of the region of the loss of these species by the project activities has prevented these agencies from initiating measures to prevent damage to the schedule species.
Besides the above there are other gaps in the EMP suggested in the EIA, the environmental monitoring and the environmental clearance conditions. A summary of the same is mentioned below:
1.2. Summary of Gaps in the NEERI EIA Geology and Bathymetry
• No geotechnical investigations carried out along the rest of the channel alignment in Palk Bay or the Palk Straits
• Bathymetry survey by NEERI in the Pamban Pass area of the Adam’s Bridge and National Hyrdographic Officer (NHO) starting from the north-side of the Adam’s Bridge area inadequate
• Lack of full knowledge base of the sub-surface geology along canal • Bathymetric Survey data was carried out by NIOT (6-23 November 2004 and 16-17
December 2004) not incorporated into EIA • Non inclusion of vital studies in EIA -NIOT’s Geological & Geo-technical Assessment,
Indomer’s Hydrodynamic Modelling (both of which have ), Radio Active Tracer Study
Sedimentation

53
• Collected primary data on the sedimentation rate of Adam’s Bridge area only • No studies on palk bay and straits • No review/study of literature on sedimentation process in palk bay /straits after 1989
despite being well noted for unusually high sedimentation rate • Maintenance dredging calculation based on the silt movement pattern on the east coast • Annual maintenance dredging in the Adams Bridge is not substantiated by scientific
assessments or calculations. • No use of primary data in hydrodynamic modelling and sedimentation studies for whole
canal. Dredge Spoil and Dumping
• Poor estimation of maintenance dredging • Nature of the dredged spoil is currently known only for about 38.5 to 40.5% of the total
dredged spoil. • No Radio Active Tracer Study to optimize the dredge disposal in dredge dumping sites • EIA ambivalent on the identification of sites for environmentally safe disposal of
dredged material • No Dredge management plan as part of EMP in EIA
Miscellaneous • Did not take into account the impacts of the 2004 tsunami on the bathymetry or
ecosystem. • Not taken into account impacts of blasting ( as a possible activity that might be required
later) on the ecosystem. Violations of EIA Legislation & Guidelines
• Does not contain Risk Analysis/Assessment • Does not contain Disaster Management Plan • Inadequate Ecological Risk Assessment • Does not quantify and describe bottom fauna along dredged part of the canal which will
be lost. • EMP does not cover pre and post project monitoring requirements and mechanism for
environmental management • EMP Environment management plan (EMP) of the EIA does not have a dredging
management programme • Loss of protected species/scheduled flora and fauna
1.3. Summary of Gaps in Indomer-Alkyon’s Hydrodynamic Modelling and Ship Manoeuvring Studies
• No use of primary data • Estimation of sediment transport and deposition pattern only for normal conditions
only (wind speeds only up to 31.5 km/hr) despite the fact that 55% of storms between 1891-2000 in project area have wind speed exceeding 89 km/hour.
• Return period for winds that have speeds greater than 64.82 Km/hr for the project area is 2.83 years
• Unscientific conclusion of zero maintenance dredging for the Palk Straits area

54
1.4. Summary of Gaps in NIOT’s Geological & Geo-technical Assessment
• Vibro coring or the jet coring methods do not provide fully satisfactory information to
determine sub-surface geology and type of dredging required. • Indication of harder strata at depth • Amenability of medium to conventional dredging is yet to be ascertained • Indicates that blasting might be required
1.5. Summary of Gaps in TFEAR
• No review/study of literature on sedimentation process in Palk Bay /Palk Strait after
1989 despite being well noted for unusually high sedimentation rate. 1.6. Summary of Gaps in Environment Monitoring, Environmental Clearance & Monitoring Committee
• No monitoring of heavy metals, bacteriological parameters, and marine biology: phytoplankton and zooplankton, only physical properties are being monitored.
• It also seems that it is being done only for marine water quality and NOT for sediment quality.
• No monitoring of the submarine conditions during the dredging by divers and photographic and video records
• No monitoring of important factors like hydrography, bathymetry, current dynamics, total suspension load, climate changes, sea level alterations.
The Economic viability ( TFEAR) and environmental sustainability ( EIA ) being assessed by the same agency ( NEERI in this case) results in conflict of interest situation and is not good practice. The flow chart below illustrates the how these various gaps affect the project.
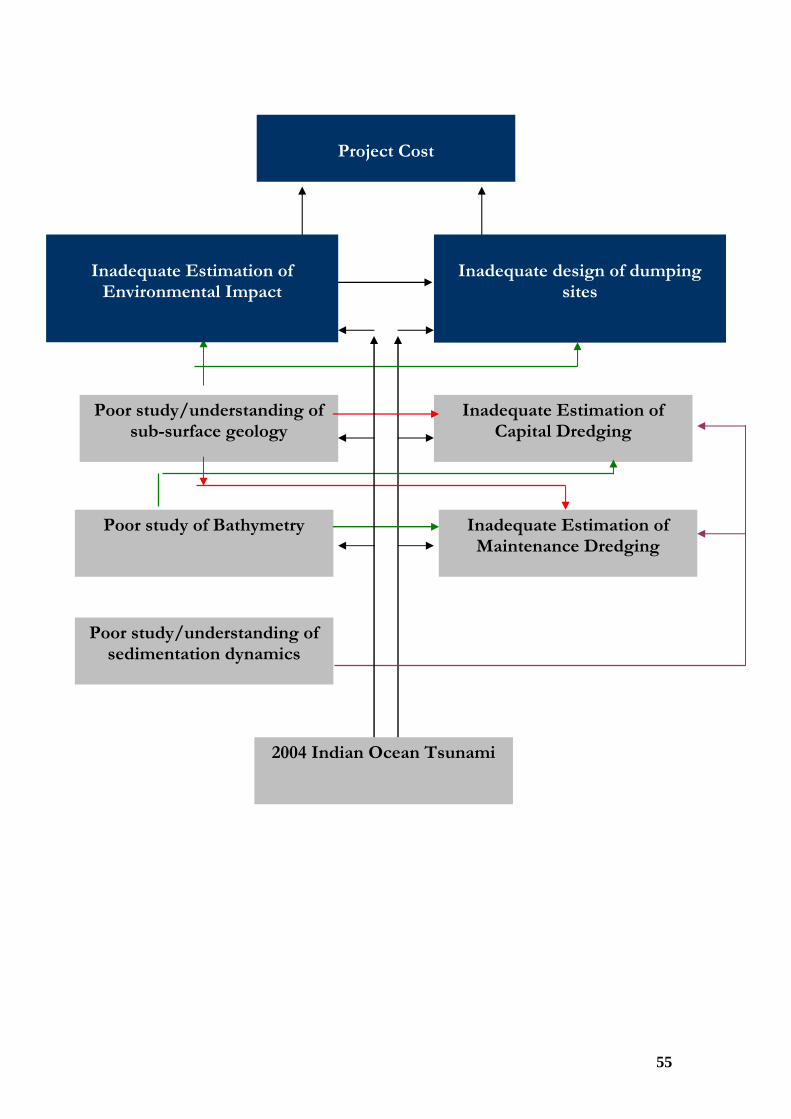
55
Inadequate design of dumping
sites
Inadequate Estimation of Capital Dredging
Inadequate Estimation of Maintenance Dredging
Poor study/understanding of sub-surface geology
Poor study/understanding of sedimentation dynamics
Poor study of Bathymetry
2004 Indian Ocean Tsunami
Project Cost
Inadequate Estimation of
Environmental Impact


57
The section on dredging and it impacts on the corals and seagrasses concludes that the project and its activities will introduce dramatic changes in the marine environment of the Gulf of Mannar and Palk Bay.
Finally, the last section on the economic review reveals many glaring gaps. Firstly among them is that the cost savings by ships have not been adequately detailed out and grossly exaggerated. Secondly, the fuel savings for many of these ships is actually negative. Thirdly, the total savings (including reduction in time charter) actually works out to just 30% of what is claimed by the DPR for most non-coastal ships. The review concludes that the above three factors have significant revenue implications as over 60% of the ships which ‘benefit’ will not be willing to pay the amount as claimed in the DPR and this calls for a greater study of economic benefits as per the present justification and that in the present scenario the project will be a financial white elephant. In light of all the above, we conclude that the project has not been adequately assessed for the environmental impacts to the biodiversity and habitat of the Palk Straits, Palk Bay and Gulf of Mannar and will have serious impacts and cause drastic changes to the biodiversity of the region. It is likely to also cause major impacts and losses of fisheries and livelihoods to the region. Reviewing the current status of the implementation phase of the project, considerable environmental damage has probably already been done.
The project is economically unviable as per the present justifications in the project document such as the Detailed Project Report and the Technical Feasibility and Economic Analysis Report. 2. Recommendations In light of the above the reviewers have the broad recommendation that since in the present scenario, the project will have serious negative environmental and financial impacts, it should consider addressing all the knowledge gaps & recommendations that have been highlighted in this report. The specific recommendations are listed below: • Carry out a risk analysis/assessment, an ecological risk assessment and develop a disaster
management plan as per the requirement and guidelines laid down by the EIA Notification and MoEF and incorporate them into the EIA
• Undertake an assessment of sub-surface geology using appropriate drilling investigations to
arrive at clear picture of the type of dredging required and its impacts on the environment.
• Based on the above appropriate hydrodynamic modeling studies in the full area of the channel and potential disposal sites using a full year’s primary data taking into account cyclone and non cyclone data, should be done. This study should also incorporate the latest literature on sedimentation of the project area and the information of sub-surface geology.
• Based on the inputs and results of the above two points, undertake a study of the sediment
dispersion and sedimentation during dredging operations and assess its ecological and environmental implications. The result of this should be incorporated into EIA, EMP and post project environmental monitoring.

58
• Based on the dredge spoil characteristics, quantum and sedimentation of the region identify suitable sites for dredge disposal after assessing their stability using a full year’s primary data (for normal and cyclonic conditions). The result of this should be incorporated into EIA, EMP and post project environmental monitoring.
• A full description and quantum of loss of bottom flora & fauna along the channel and the
dredge disposal sites. As assessment of the impacts and implications to the local ecology and fisheries should be done and incorporated into EIA, EMP and post project environmental monitoring.
• Ensure monitoring of all the parameters suggested in the DPR and MoEF clearance conditions
are being carried out and is fully published on the project website regularly.
• The environmental parameters currently being monitored need to be expanded to include other parameters such as hydrography, bathymetry, current dynamics, total suspension load, climate changes, sea level alterations etc. These should be incorporated into EMP and post-project environmental monitoring.
• The submarine conditions during the dredging activity should be inspected by divers and
photographic and video records should be maintained. This activity should also cover the dredge disposal sites. This should be incorporated into EMP and post-project environmental monitoring.
• The project should develop a Dredging Management Programme and incorporate it into the
Environment Management Plan (EMP) of the EIA.
• Since the above are all basic elements that should have been part of the EIA (and at least 70 percent of an EIA for a project of this kind) and given the weight of the criticisms it is only fitting that EIA and the relevant studies be redone.
• Only after the above has been done, reassessment of the economic justifications of the project
by reviewing of all economic benefits as per present justification should be done. Specifically, reassess the current projected cost savings by ships in terms of distance, fuel savings, and time savings for the various routes. The projected traffic along these various routes (Aden, Africa/Mauritius and Indian coastal ships) should be quantified.

59
References Anonymous. 2005. Website launched. The Hindu Friday, Jul 01, 2005 Chandramohan, P., B. K. Jena and V. Sanil Kumar. 2001. Littoral Drift Sources and Sinks along the Indian Coast, Current Science, Vol. 81, No. 3. pp 295. DoD. 2005. Preliminary Assessment of Impact of Tsunami in Selected Coastal Areas of India. Department of Ocean Development, Integrated Coastal and Marine Area Management Project Directorate, Chennai. Global Environment Facility. 1999. Conservation and Sustainable Use of the Gulf of Mannar Biosphere Reserve's Coastal Biodiversity, Project Document, GEF Project ID 634, GEF Secretariat, Washington. Indomer-Alkyon. 2005. Hydrodynamic Modelling Sedimentation Studies and Ship Manoeuvring Study for Sethusamudram Shipping Channel. Indomer-Alkyon, Chennai. Jeganathan, S., K. R. Saravanan, B.C. Choudhury, and K. Sivakumar. 2006. Vegetation Status in the Offshore Islands of Gulf of Mannar Marine National Park, Tamil Nadu. National Institute for Coastal and Marine Biodiversity (NICMB), WII, Dehradhun. Jeyanthi, N. 2002. Cyclone Disaster Management. National Interactive Workshop held at Tamil Nadu Agricultural University, February 25-26, 2002. Kathal, P.K. 2005. Sethusamudram Ship Canal Project: oceanographic/geological and ecological impact on marine life in the Gulf of Mannar and Palk Bay, South-eastern coast of India. Current Science, Vol. 89, No. 7. Kelleher G, C. Bleakley, and S. Wells. 1995. A Global Representative System of Marine Protected Areas. Volume 3: Central Indian Ocean, Arabian Seas, East Africa and East Asian Seas. The Great Barrier Reef Marine Park Authority, The World Bank and the World Conservation Union (IUCN), Washington, D.C. pp 146. Krishnasamy , V.S .2006. Sethusamudram Dredging Technical Issues, Dated the18th October’05, White Plains, New York. Kumaraguru, A. K., K. Jayakumar, J. J. Wilson and C. M. Ramakritinan. 2005. Impact of the tsunami of 26 December 2004 on the coral reef environment of Gulf of Mannar and Palk Bay in the southeast coast of India. Current Science, Vol. 89, No. 10. L&T-Ramboll. 2005. Detailed Project Report and Evaluation of EIA Study for Sethusamudram Ship Channel Project. Larson & Toubro –Ramboll Consulting Engineers Limited. McCloskey, J., S. Nalbant, S. and S. Steacy. 2005. Earthquake risk from co-seismic stress. Nature, Vol. 434.
60
MoEF. 1998. Chapter 3: Conservation Of Natural Resources Including Forestry and Wildlife in MoEF Annual Report 1997-98. Ministry of Environment & Forests, New Delhi. MoEF. 2002. Chapter 3: Conservation Of Natural Resources Including Forestry And Wildlife in MoEF Annual Report 2001-02. Ministry of Environment & Forests, New Delhi. MoEF. 2001. Environmental Impact Assessment Manual. Impact Assessment Division, Ministry of Environment and Forests, New Delhi. MoEF. 2005. Letter No.J-16011/6/99-IA-III, Sethusamudram Shipping Channel Project by M/s Tuticorin Port Trust, Tuticorin, Tamil Nadu - Environmental Clearance, Letter dated 31st March,2005. Ministry of Environment and Forests, New Delhi. Natesan, U. 1993. Seasonal Shoreline Oscillation of Tamil Nadu Coast, Current Science, Vol 65, No 9. pp 667-68. NEERI. 2004a. Environmental Impact Assessment for Proposed Sethusamudram Ship Channel Project, National Environmental Engineering Research Institute, Nagpur. August 2004. pp 427. NEERI. 2004b. Technical Feasibility and Economic Analysis of Proposed Sethusamudram Channel, National Environmental Engineering Research Institute Nagpur, July 2004. pp330. NIOT. 2004. Geological & Geo-technical Assessment of the Subsea, Chennai - Executive Summary. Sethusamudram Project Website, http://www.sethusamudram.gov.in/Geotech.asp Patterson , J.K. 2005. Rapid assessment of status of corals in Gulf of Mannar after tsunami. On http://www.sethusamudram.gov.in/PeterArticle.asp Rajamanickam, V. G. 2004. Sethusamudram Canal: The Life of Tamil Nadu in Abstracts of the proceedings of the National Seminar on Ecological Balance and Sethusamudram Canal held on October 1-3, 2004 at Alagappa University, Thondi Campus,. pp 29-30. Rajendran, C.P. 2005a. Assessing the Stability of the Sethusamudram Shipping Canal, Jounal of Geol.Soc.India, Vol. 66, No.3. pp. 367-370. Rajendran, C.P. 2005b. Sethusamudram shipping canal project and the eternal silence of the Indian earth scientists. Current Science, Vol. 89, No. 2. Ramasamy, S. M., D. Ramesh, M. A. Paul, S. Kusumgar, M. A. Yadava, A. R. Nair, U. K. Sinha and T. B. Joseph.,1998. Land Building Activity along Vedaranniyam Coast and its Possible Implications, Current Science, Vol 75, No 9. pp 884-86. Ramesh, A. and T. Kannupandi. 1997. Recent Changes in the Coral Reef Ecosystem of Palk Bay: A Comparative Status of Previous Reports and Researches in Hoon, V. (ed), Proceedings of the Regional Workshop on the Conservation and Sustainable Management of Coral Reefs. Proceedings No.22. CRSARD, Chennai.

61
Ramesh, R. 2004a.Critique on the Methodology of NEERI EIA for the Proposed Sethusamudram Ship Canal Project. Doctors for Safer Environment (DOSE), Coimbatore. pp23. Ramesh, R. 2004b. Sethusamudram Shipping Canal Project and the unconsidered high risk factors: Can it withstand them? Doctors for Safer Environment, Coimbatore. pp73. Ramesh, R. 2005a. Is the Sethusamudram Shipping Canal Project Technically Feasible?, Economic and Political Weekly, January 22, 2005. Ramesh, R. 2005b. Sethusamudram Shipping Canal Project, Current Science, Vol. 88, No. 4. Ramesh, R. 2006. Sethusamudram Ship Canal Project - Further Inputs, Unpublished. Sanil Kumar, V., N. M. Anand, and R. Gowthaman. 2002. Variations in Nearshore Processes along Nagapattinam Coast, India, Current Science, Vol 82, No 11. pp 1381-89. Seralathan, P. 2006. Disposal of dredge spoil from Sethusamudram Ship Channel Project, Current Science, Vol. 90, No. 2. Seshagiri, D.N. 2005. Assessment of the Results of the Geotechnical Study by NIOT for Sethusamudram Shipping Canal Project. Uploaded on 9th September 2005. www.sethusamudram.in. Venkataraman K and M. Waffar. 2005. Coastal and Marine Biodiversity of India. Indian Journal of Marine Sciences. Vol 34(1).pp 57-75.