Embed Size (px)
Citation preview
Review of Performance
Quality and financial outcomes at Quarter 1, 2013/14
April 2013

Category R8 Performance 2012/13
Category R19 Performance 2012/13
50%
55%
60%
65%
70%
75%
80%
85%
90%
95%
100%
Apr
May Jun Jul
Aug
Sep
Oct
Nov Dec Jan
Feb
Mar
R8 2013/14 Target R8 2012/13
86%
88%
90%
92%
94%
96%
98%
100%
Apr
May Jun Jul
Aug
Sep
Oct
Nov Dec Jan
Feb
Mar
R19 2013/14 Target R19 2012/13
25,000
26,000
27,000
28,000
29,000
30,000
31,000
32,000
33,000
34,000
35,000
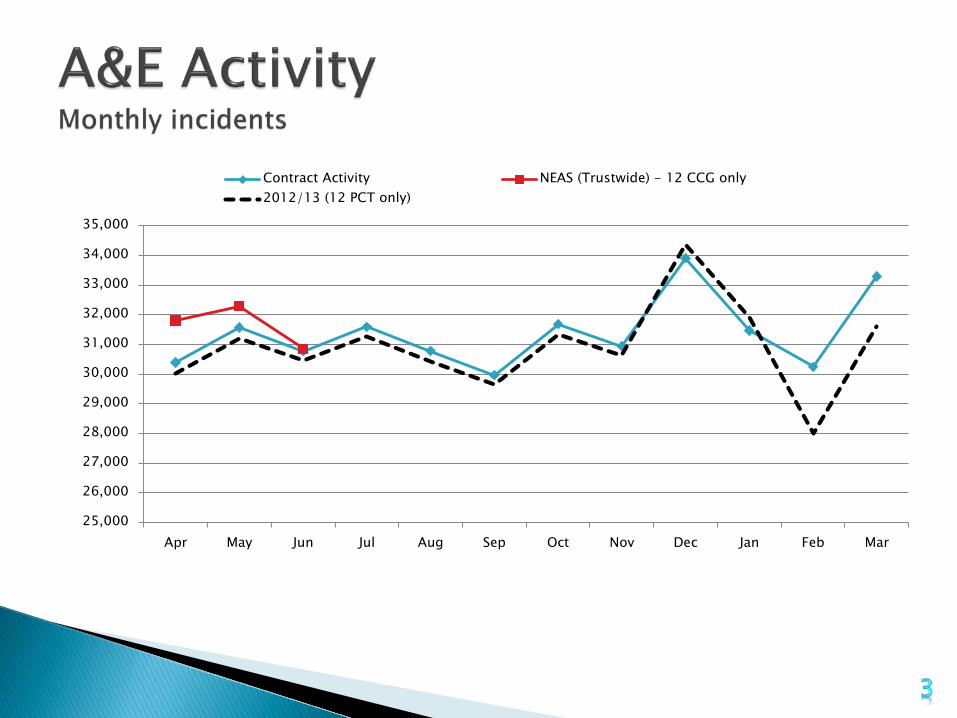
Apr May Jun Jul Aug Sep Oct Nov Dec Jan Feb Mar
Contract Activity NEAS (Trustwide) - 12 CCG only2012/13 (12 PCT only)

R, 8 Minute Response Trustwide Annual Performance Target: 75%CCG Apr-13 May-13 Jun-13 Jul-13 Aug-13 Sep-13 Oct-13 Nov-13 Dec-13 Jan-14 Feb-14 Mar-14NHS Northumberland CCG 71% 73.56% 71.97% 73.76% 73.08%NHS Newcastle North and East CCG 75% 89.04% 89.83% 90.50% 89.78%NHS Newcastle West CCG 75% 93.05% 91.46% 92.47% 92.30%NHS North Tyneside CCG 75% 84.00% 84.32% 84.83% 84.37%NHS Gateshead CCG 75% 82.94% 78.48% 85.03% 82.15%NHS South Tyneside CCG 75% 87.49% 84.94% 86.24% 86.23%NHS Sunderland CCG 75% 83.52% 84.44% 83.35% 83.78%NHS North Durham CCG 71% 73.83% 72.71% 74.01% 73.50%NHS Durham Dales, Easington and Sedgefield CCG 71% 67.58% 68.58% 70.69% 68.89%NHS Darlington CCG 75% 80.98% 82.23% 84.88% 82.65%NHS Hartlepool and Stockton-on-Tees CCG 75% 78.26% 78.07% 79.80% 78.68%NHS South Tees CCG 75% 79.96% 77.89% 80.69% 79.46%Unknown 50.00% 100.00% 75.00%Out of Area 31.03% 35.48% 37.50%North East CCG's Only 79.88% 79.22% 80.98%NEAS - (All incidents) 79.77% 79.14% 80.90%North East CCG's OnlyQtr PerformanceNEAS - (All incidents)Qtr Performance
79.92% 79.92%
80.01% 80.01%
TargetQuarter 1 Quarter 2 Quarter 3 Quarter 4
YTD

R, 19 Minute ResponseTrustwide Annual Performance Target 95%CCG Apr-13 May-13 Jun-13 Jul-13 Aug-13 Sep-13 Oct-13 Nov-13 Dec-13 Jan-14 Feb-14 Mar-14NHS Northumberland CCG 95% 93.92% 94.57% 94.65% 94.37%NHS Newcastle North and East CCG 95% 99.54% 99.27% 100.00% 99.59%NHS Newcastle West CCG 95% 99.12% 99.80% 99.68% 99.54%NHS North Tyneside CCG 95% 99.16% 99.36% 99.31% 99.27%NHS Gateshead CCG 95% 98.43% 98.46% 99.33% 98.74%NHS South Tyneside CCG 95% 99.64% 98.80% 98.94% 99.13%NHS Sunderland CCG 95% 98.70% 98.79% 98.37% 98.62%NHS North Durham CCG 95% 95.93% 97.08% 97.15% 96.73%NHS Durham Dales, Easington and Sedgefield CCG 95% 94.25% 93.84% 96.39% 94.78%NHS Darlington CCG 95% 96.01% 96.51% 96.31% 96.28%NHS Hartlepool and Stockton-on-Tees CCG 95% 97.66% 97.38% 97.71% 97.58%NHS South Tees CCG 95% 97.63% 97.93% 97.61% 97.73%Unknown 83.33% 100.00% 87.50%Out of Area 75.86% 87.10% 78.26%North East CCG's Only 97.25% 97.45% 97.78%NEAS - (All incidents) 97.20% 97.43% 97.74%North East CCG's OnlyQtr PerformanceNEAS - (All incidents)Qtr Performance
97.45% 97.45%
97.49% 97.49%
TargetQuarter 1 Quarter 2 Quarter 3 Quarter 4
YTD
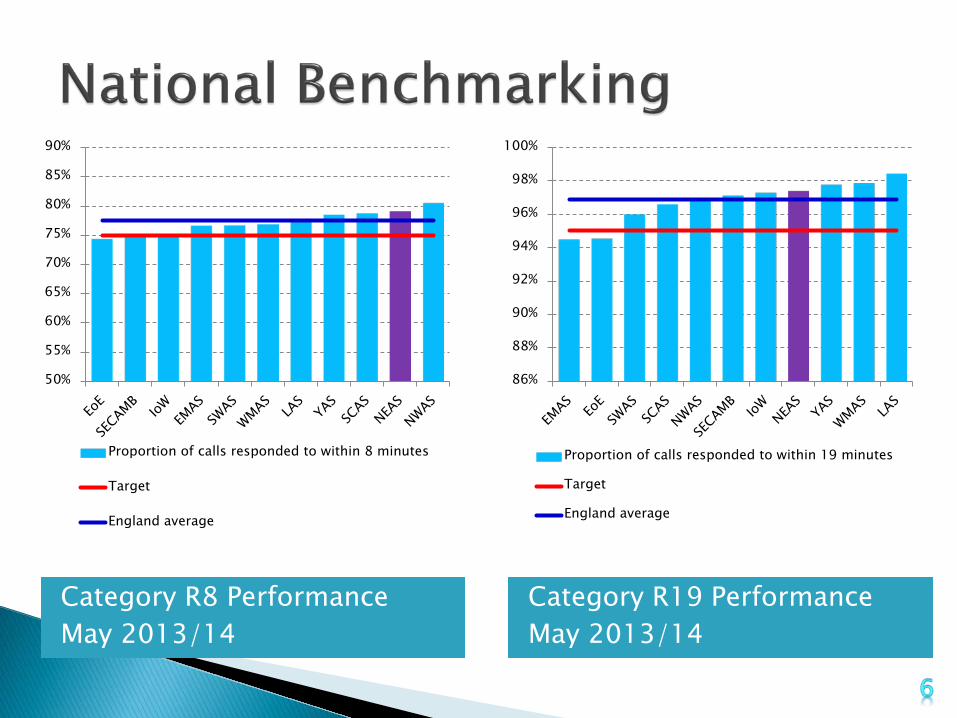
Category R8 Performance May 2013/14
Category R19 Performance May 2013/14
50%
55%
60%
65%
70%
75%
80%
85%
90%
Proportion of calls responded to within 8 minutes
Target
England average
86%
88%
90%
92%
94%
96%
98%
100%
Proportion of calls responded to within 19 minutes
Target
England average

Quarter 4 2012/13 Quarter 1 2013/14 Key targets: Monitor Key targets: Monitor
R1: 78.09% R1: 76.66%
R2: 78.64% R2: 79.99%
R: 78.63% R: 79.92%
R19: 97.12% R19: 97.45%
Fully registered with CQC for the essential standards of quality and safety.
Fully registered with CQC for the essential standards of quality and safety.
Overall (confirmed): Governance score = 0 GREEN
Overall (predicted): Governance score = 0 GREEN
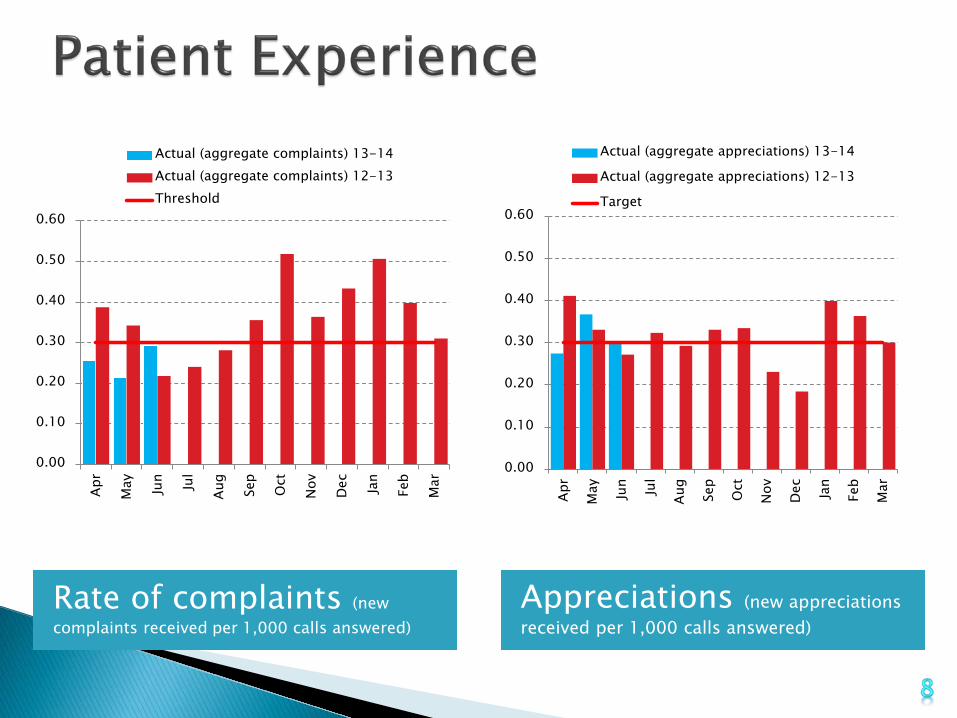
Rate of complaints (new complaints received per 1,000 calls answered)
Appreciations (new appreciations received per 1,000 calls answered)
0.00
0.10
0.20
0.30
0.40
0.50
0.60
Apr
May Jun Jul
Aug
Sep
Oct
Nov Dec Jan
Feb
Mar
Actual (aggregate complaints) 13-14Actual (aggregate complaints) 12-13Threshold
0.00
0.10
0.20
0.30
0.40
0.50
0.60
Apr
May Jun Jul
Aug
Sep
Oct
Nov Dec Jan
Feb
Mar
Actual (aggregate appreciations) 13-14
Actual (aggregate appreciations) 12-13
Target

Friends and Family Test

Patient Safety Incidents Assaults on Staff
Serious Incidents Near Misses
0102030405060708090
100
Jun-
12
Jul-1
2
Aug-
12
Sep-
12
Oct
-12
Nov
-12
Dec-
12
Jan-
13
Feb-
13
Mar
-13
Apr-
13
May
-13
Jun-
13
0
2
4
6
8
10
12
Jun-
12
Jul-1
2
Aug-
12
Sep-
12
Oct
-12
Nov
-12
Dec-
12
Jan-
13
Feb-
13
Mar
-13
Apr-
13
May
-13
Jun-
13
05
101520253035404550
Jun-
12
Jul-1
2
Aug-
12
Sep-
12
Oct
-12
Nov
-12
Dec-
12
Jan-
13
Feb-
13
Mar
-13
Apr-
13
May
-13
Jun-
13
0
20
40
60
80
100
120Ju
n-12
Jul-1
2
Aug-
12
Sep-
12
Oct
-12
Nov
-12
Dec-
12
Jan-
13
Feb-
13
Mar
-13
Apr-
13
May
-13
Jun-
13

Sickness Absence Vacancies
0.00%
1.00%
2.00%
3.00%
4.00%
5.00%
6.00%
7.00%
8.00%
Apr-
11
Jun-
11
Aug-
11
Oct
-11
Dec
-11
Feb-
12
Apr-
12
Jun-
12
Aug-
12
Oct
-12
Dec
-12
Feb-
13
Apr-
13
Jun-
13
Sickness Target
1800
1850
1900
1950
2000
2050
2100
2150
2200
2250
2300
Apr-
11
Jun-
11
Aug-
11
Oct
-11
Dec
-11
Feb-
12
Apr-
12
Jun-
12
Aug-
12
Oct
-12
Dec
-12
Feb-
13
Apr-
13
Jun-
13
Establishment In post

Turnaround Performance
0
100
200
300
400
500
600
Jun-
12
Jul-
12
Aug-
12
Sep-
12
Oct
-12
Nov
-12
Dec
-12
Jan-
13
Feb-
13
Mar
-13
Apr-
13
May
-13
Jun-
13
Handover delays over 1 hourHandover delays over 2 hours
6.0
8.0
10.0
12.0
14.0
16.0
18.0
20.0
Jun-
12
Jul-
12
Aug-
12
Sep-
12
Oct
-12
Nov
-12
Dec
-12
Jan-
13
Feb-
13
Mar
-13
Apr-
13
May
-13
Jun-
13
Average handover time (mins)Average post handover to clear time (mins)

Qtr 1 Monitor Combined Financial Risk Rating 4 (out of 5)
• Reported normalised income and expenditure surplus of £0.475m against a planned £0.874m
• Payments for A&E activity above contract in-year of £1,052k (based on unvalidated activity of 94,956; which is 6,051 above contract, or 6.81%)
• Liquidity of 62.4 days debt cover • Quarter end cash balance of £12.545m • Capital investment of £0.442m in the year, against
a year to date target of £0.518m (85.3%) • Combined financial risk rating of 4

Total value of CQUIN 2013/14: £2.3m
Goal 1 – Involvement in whole system reviews
Goal 2 – Alternative dispositions, other than A&E
Goal 3 – Patient experience (A&E, PTS, Contact Centre)
Goal 4 – Improvement in response times for patients outside of national target
Goal 5 – Improvements in response times to GP Urgents
Goal 6 – PTS – reduction in the level of aborted journeys
Priority 1 – Patient experience Priority 2 - Improvements in response times to GP Urgents Priority 3 – To introduce an appointment based PT service Priority 4 – Reduce hospital turnaround delays Priority 5 – Lead work to deliver support to high intensity users of NEAS services Priority 6 – Explore a system that supports Individual Treatment Plans Priority 7 - Alternative dispositions, other than A&E

NEAS are the only provider of NHS 111 services given the green light for full regionwide rollout in April 2013.
Folliwing up on a NEAS organised handover summit held on 5th February 2013, another summit is planned for 3rd September 2013.
NEAS met it’s National targets in Quarter 1 and are forecast to receive a green governance rating from Monitor.
Notice was withdrawn on the current PTS contract in Durham and Darlington. NEAS are working with commissioners on reviewing PTS for the future.
The 2013/14 ambulance contract has been fully signed off.
NEAS welcome Tara McGwinn (Emergency Care Business Manager) and, from 1st August 2013, Jo Baxter (Director of Clinical Care & Patient Safety).

Number Objective Objective owner
1 To continuously improve the quality of care provided ensuring it is patient focused, effective, safe and delivered with compassion
Ann Fox
2 To deliver the right care pathway to improve the care offered to patients through maximising access to alternative services in the community. Ann Fox
3 To develop an integrated high quality contact centre service which is patient focused and at least exceeds all appropriate performance standards. Paul Liversidge
4 Delivering the PTS strategy to secure continuous quality improvement, long term financial viability and commercial competitiveness. Paul Liversidge
5 To preserve the strong financial position of NEAS and achieve the delivery of efficiency savings, whilst protecting and continuously improving the quality of services provided. Roger French
6 To continuously support internal and external customer information requirements through reliable and effective data collection and data quality systems in response to patient and staff feedback and experience
Roger French
7 Maintain and improve the delivery of national emergency care performance standards. Paul Liversidge
8 Further develop and implement a programme of engagement within the newly established commissioning architecture.
Nicola Fairless/ Rod Macleod
9 To more fully understand the environmental impact of NEAS and to reduce where possible the carbon footprint of the services provided. Roger French
10 To ensure NEAS delivers the NEAS mission, vision and values by actively embedding a positive culture in order to retain, attract, support and develop a workforce which meets current and future service needs.
Joanne Machers
11 To commence work on a long term strategic plan for NEAS as a Foundation Trust. Simon Featherstone

Strategic Intention Corporate Objective Sub-objectives Red Amber GreenCorporate Objective 3: To develop an integrated high quality contact centre service which is patient focused and at least exceeds all appropriate performance standards
17 0 6 11
Corporate Objective 7: Maintain and improve the delivery of national emergency care performance standards
13 1 4 8
To be a key partner in urgent care reform
Corporate Objective 2: To deliver the right care pathway to improve the care offered to patients through maximising access to alternative services in the community
11 0 6 5
To transform our patient transport services
Corporate Objective 4: Delivering the PTS strategy to secure continuous quality improvement, long term financial viabil ity and commercial competitiveness
12 1 5 6
To be a first rate employer
Corporate Objective 10: To ensure NEAS delivers the NEAS mission, vision and values by actively embedding a positive culture in order to retain, attract, support and develop a workforce which meets current and future service needs.
39 0 12 27
Qtr 1 Position
To lead in the provision of emergency care

Strategic Intention Corporate Objective Sub-objectives Red Amber GreenCorporate Objective 5: To preserve the strong financial position of NEAS and achieve the delivery of efficiency savings, whilst protecting and continuously improving the quality of services provided
9 0 6 3
Corporate Objective 9: To more fully understand the environmental impact of NEAS and to reduce where possible the carbon footprint of the services provided
9 0 2 7
Corporate Objective 1: To continuously improve the quality of care provided ensuring it is patient focused, effective, safe and delivered with compassion
27 0 13 14
Corporate Objective 6: To continuously support internal and external customer information requirements through reliable and effective data collection and data quality systems in response to patient and staff feedback and experience
5 0 4 1
Corporate Objective 8: Further develop and implement a programme of engagement within the newly established commissioning architecture
6 0 4 2
Corporate Objective 11: To commence work on a long term strategic plan for NEAS as a Foundation Trust
5 0 3 2
153 2 65 86100.0% 1.3% 42.5% 56.2%
Qtr 1 Position
TotalTotal (%)
To have a sound financial health
To be well governed and accountable