Embed Size (px)
Citation preview

HAL Id: hal-02437881https://hal.archives-ouvertes.fr/hal-02437881
Submitted on 14 Jan 2020
HAL is a multi-disciplinary open accessarchive for the deposit and dissemination of sci-entific research documents, whether they are pub-lished or not. The documents may come fromteaching and research institutions in France orabroad, or from public or private research centers.
L’archive ouverte pluridisciplinaire HAL, estdestinée au dépôt et à la diffusion de documentsscientifiques de niveau recherche, publiés ou non,émanant des établissements d’enseignement et derecherche français ou étrangers, des laboratoirespublics ou privés.
Review of Quantitative Empirical Evaluations ofTechnology for People with Visual Impairments
Emeline Brulé, Brianna Tomlinson, Oussama Metatla, Christophe Jouffrais,Marcos Serrano
To cite this version:Emeline Brulé, Brianna Tomlinson, Oussama Metatla, Christophe Jouffrais, Marcos Serrano. Reviewof Quantitative Empirical Evaluations of Technology for People with Visual Impairments. 2020 CHIConference on Human Factors in Computing Systems, Apr 2020, Honolulu, United States. pp.1-14,�10.1145/3313831.3376749�. �hal-02437881�

Review of Quantitative Empirical Evaluations of Technologyfor People with Visual Impairments
Emeline BruléUniversity of Sussex
Falmer, [email protected]
Brianna J. TomlinsonGeorgia Institute of technology
Atlanta, Georgia, [email protected]
Oussama MetatlaUniversity of Bristol
Bristol, [email protected]
Christophe JouffraisCNRS IRIT, Uni. of Toulouse
Toulouse, [email protected]
Marcos SerranoIRIT, Uni. of Toulouse
Toulouse, [email protected]
ABSTRACTAddressing the needs of visually impaired people is of contin-ued interest in Human Computer Interaction (HCI) research.Yet, one of the major challenges facing researchers in this fieldcontinues to be how to design adequate quantitative empiricalevaluation for these users in HCI. In this paper, we analysea corpus of 178 papers on technologies designed for peoplewith visual impairments, published since 1988, and includingat least one quantitative empirical evaluation (243 evaluationsin total). To inform future research in this area, we providean overview, historic trends and a unified terminology to de-sign and report quantitative empirical evaluations. We identifyopen issues and propose a set of guidelines to address them.Our analysis aims to facilitate and stimulate future researchon this topic.
Author KeywordsAssistive Technology, Visual Impairments, Literature Review,Evaluation Methods, Experiments, Education
CCS Concepts•Human-centered computing→Usability testing; Accessi-bility systems and tools; Laboratory experiments; Empiricalstudies in HCI; •Social and professional topics → Peoplewith disabilities;
INTRODUCTIONResearch in Human-Computer Interaction (HCI) on assistivetechnologies for people with visual impairments (PVI)1 is an1Participants can be referred to using person-first or disability-firstlanguage. There are many debates regarding which one is best prac-tice [30, 21]. We use people with visual impairments which waspreferred by a majority of authors and PVI as an abbreviation.
CHI’20, April 25–30, 2020, Honolulu, HI, USA
ACM ISBN XXX.
DOI: https://doi.org/10.1145/XXXXX
ever growing domain with the general goal of improving ac-cessibility as a means for addressing broader societal issuesof equality, diversity and inclusion. Research on technologiesfor PVI spans a variety of application areas, such as education,entertainment and mobility [12], and investigates the potentialof novel interaction techniques, including tactile display (hap-tics and vibratory feedback) [73], auditory display (verbal andnon-verbal feedback) [8, 51, 74], tangible interaction [26, 18],and sensory substitution [47, 31]. However, designing and con-ducting adequate quantitative empirical remains a challenge,an issue also noted in the field of education sciences [42]. Forinstance, a literature review by Kelly and Smith [42] foundthat less than 10% of educational technologies for visuallyimpaired children underwent some form of quantitative em-pirical evaluation. A 2018 workshop on inclusive educationaltechnologies for PVI [52] identified the lack of overview andguidelines on evaluation practices as a barrier for developingnovel technologies. To address this challenge, it is importantfor the HCI community to understand existing practices. Yet,to date, no survey addresses the evaluation of technologies andinteraction techniques for PVI in HCI.
Quantitative empirical evaluation methodologies are popular,if not considered a gold standard, in the field of HCI [10,46]. However, these are usually difficult to implement whenworking on technologies for PVI. Common challenges in-clude heterogeneous participant profiles, limited availabilityof participants, and deciding how and when to include sightedparticipants in evaluations [9]. Hence, we address the follow-ing research question: What is, at present, best practice inquantitative empirical evaluations of technologies for peoplewith visual impairments in HCI? Providing answers to thisquestion will not only guide researchers in this area to deviseand carry out appropriate quantitative evaluations, but will alsoallow for a more informed and uniform approach to reviewingthem in scientific publications.
To answer this question, we developed three secondary re-search questions: RQ1: Are there common standards for con-ducting quantitative empirical evaluations of technologies forPVI; if so, what are they?; RQ2: Overall, are participants in

these evaluations representative of the target population?; andRQ3: What are the difficulties encountered by researchers inthis type of evaluation?
We focused on papers reporting practices of quantitative eval-uations in top-tier venues (i.e., CHI, ASSETS, TOCHI, andTACCESS). Our final corpus includes 178 papers publishedsince 1988, each involving one or more quantitative empiricalevaluations (243 experiments in total). We tagged these papersbefore analysing: (1) the design of these evaluations and howthey are used; (2) the representativeness of the participants in-volved in the evaluations in this corpus; and (3) the difficultiesreported by authors.
Overall, we found a large variety of accepted practices for eval-uation, which could lessen integration of findings over timeand interdisciplinary application. We highlight concerns re-garding the quality and details in reporting evaluations and therepresentativeness of the participant sample. We propose a setof recommendations for addressing these concerns, includingusing shared standards for describing participants with visualimpairment and borrowing other quantitative approaches toevaluation from connected fields such as rehabilitation andspecial education research.
BACKGROUNDSurveying evaluation approaches supports the establishmentof best practices in research, helps maintain consistency inthe review processes, and builds a strong and coherent bodyof scholarship [46]. However, to date, there are no surveysfocused on quantitative empirical evaluations of technologiesand interaction techniques for PVI, despite the large domi-nance of this type of evaluations in HCI venues such as thefield’s flagship conference, ACM SIGCHI Conference on Hu-man Factors in Computing Systems (CHI) [10]. This is espe-cially crucial as previous work has long reported challengesspecific to evaluation with this user group (e.g., [71, 27, 23]).
Quantitative empirical evaluations in HCIBy quantitative empirical evaluation, we refer to Barkhuusand Rode [10]’s classification of evaluation methods at CHI:quantitative refers to the type of measures taken (e.g., numberof errors or time to accomplish tasks) and empirical meansthe evaluation involves users directly (instead of experts, as inthe case in analytical evaluation such as heuristic evaluation).Quantitative empirical evaluations are largely considered agold standard in HCI [10].
A quantitative empirical evaluation is the study, generallytask-based, of a given device, technique, or system. It aimsat objectively measuring its usability and usage by users, orexploring the extent to which a technology is beneficial com-pared to previous similar propositions (independent variables)[46, 59, 50]. These measures (dependent variables) are proxyfor performance (e.g., speed) or subjective experience (e.g.,preference). Within research, they can be formative (i.e., in-form an improved or final iteration of a system design); orsummative (i.e., used as a proof of validity and adequacy of aproposed system), and either can become the basis for creatingan improved design [65]. Completion of statistical tests can
confirm the trustworthiness of the results for a larger popula-tion. These evaluations often include qualitative questions.
Scholars have raised three main concerns about this type ofevaluation: (1) there needs to be more transparency in thereporting and validity of experiments in light of practices suchas ‘p-hacking’ (the lack of consideration of effect sizes andconfidence interval or similar practices) [24]; (2) they are notnecessarily representative of the larger user population [10,67]; and (3) they do not provide a holistic picture of peoples’understanding of a system in context [34, 70, 44]. This might,for instance, lead to discarding forward-thinking technologycontaining usability issues that could be resolved later [34],or to missing what is important to marginalised users becausethey focus on restrictive measures of subjective experience [70,44]. The above concerns suggest that a review of quantitativeevaluation in HCI should be concerned with (1) assessingcurrent practices and standards for reporting evaluations, tohighlight areas for improvement; (2) assessing the extent towhich participants are representative of the target population;and (3) examining the challenges and limitations mentioned,to reflect on potential ways forward. It is in light of thischaracterization that we formulated the three previously-statedsecondary research questions that we used to focus our surveyof quantitative evaluation methods: RQ1: Are there commonstandards for conducting quantitative empirical evaluations oftechnologies for PVI; if so, what are they?; RQ2: Overall, areparticipants in these evaluations representative of the targetpopulation?; and RQ3: What are the difficulties encounteredby researchers in this type of evaluation?
Evaluating with and for People with Vision ImpairmentThere are rising concerns in the accessibility community thatfew technologies are thoroughly evaluated, let alone in usefulcontexts or with the relevant user group, such as children(e.g., [42, 31, 19, 29]). Recent initiatives to address thisissue were aimed at building community resources on thistopic [19] or developing alternative quantitative evaluationapproaches that are easier for researchers to conduct [42]. Thisis a two-way problem: if not properly evaluated and iteratedon, technologies risk being rejected when commercialized[31]. If few prototypes are publicly available, it is difficult toassess their impact on practices in the field.
A first difficulty for evaluating technologies with PVI are thelow numbers of participants, particularly children. Accordingto the World Health Organisation (WHO) [57], prevalenceof visual impairments is estimated between 0.2 and 3% inWestern Europe and North American countries, with 90% ofvisually impaired people worldwide living in low-to-middleincome countries [4]. Blindness is a small (7%) subset ofvisual impairments, and the vast majority of cases of visualimpairments (65 to 82%) occur after the age of 50. More-over, PVI may be solicited often by researchers, limiting theiravailability. Consequently, many experiments use blindfoldedsighted participants instead. Bardot et al. [9] list three experi-mental evaluation approaches involving participants who aresighted and visually impaired: (1) mixed group for all experi-ments, which has to account for differences in performance;(2) formative experiments with a group of sighted blindfolded

participants to reduce the number of alternatives to test, and asummative experiment with PVI; and (3) a single evaluationwith a small group of PVI. The authors note that this thirdoption is generally perceived as inadequate for evaluating per-formance due to the small sample size, making it necessaryto include sighted participants (i.e., option (1) or (2)). Theadequacy of this practice is debated, both on validity [67] andpolitical grounds, with concerns that disability simulation neg-atively affects the perception and representation of disabledpeople [11].
A second difficulty is the lack of shared evaluation frameworksor adapted evaluation tools [61, 19, 27]. Previous researchsuggests interaction laws [27], usability questionnaires [61],and procedures (e.g., length [9]) need to be adapted to PVI. Italso suggests that we need more homogenised experimentaldesigns for evaluating typical technologies (e.g., for commoncontexts, like indoor navigation [29, 40]).
A final difficulty comes from the sample of participants: het-erogeneity in terms of visual abilities, age of onset, associatedimpairments, access to education, type of assistive technologyused [21] and previous experience with visual concepts[71].This heterogeneity makes it difficult to have an adequate con-trol group [52, 42, 18]. To address this issue, some scholarscall for alternative approaches to experimental design, suchas single-subject experiments [42]. Even though the abovechallenges have been acknowledged in the community, to ourknowledge, there are no systematic surveys that provide a de-tailed overview of reported difficulties, accepted best practicesin quantitative empirical evaluations, nor guidelines for theway they are, or should be used in practice.
What can we learn from a literature review?There are two approaches to completing literature review pa-pers: systematic and narrative [22]. Systematic literaturereviews aim at achieving unbiased, complete and reproducibleoverviews of a given research field [43]. They attempt toeliminate biases in the selection of papers included by meticu-lously describing the search and selection process, and theyprovide a quantitative summary of the papers found. However,the extent to which any literature review can be unbiased andcomplete is unclear due, for instance, to technical limitationsof database searches [15]. Narrative literature review focuson developing a critical theoretical understanding of a field ata given time (e.g., [14]). We took a systematic approach, onwhich we reflect critically.
LITERATURE REVIEW APPROACHThe purpose of this systematic literature review is to identifybest practices for quantitative empirical evaluations with PVI(RQ). We structured our process following recommended prac-tices for systematic reviews: search, study selection, data ex-traction, data analysis, and interpretation [43]. We then aimedto understand these best practices by (1) studying the maincharacteristics of these experiments and their participants; (2)identifying potential gaps in their design or reporting; and (3)discussing ways forward.
Search strategy and queryWe first conducted a Scopus search across different publishers(IEEE, ACM, etc). This is described in supplementary ma-terial. However, this corpus missed many publications thatdid not explicitly discuss evaluation in the abstract. Moreover,it was very heterogeneous in terms of writing styles, lengthand structure. We thus decided to focus on ACM SIGCHIConference on Human Factors in Computing Systems (CHI)and the ACM SIGACCESS Conference on Computers andAccessibility (ASSETS), as well as their associated journals:ACM Transactions on Computer-Human Interaction (TOCHI)and ACM Transactions on Accessible Computing (TACCESS).These are largely considered premier venues for HCI publica-tions [1], and focusing on a limited number of well-recognisedpublications in which this type of evaluation is popular [10]and is a strategy previously used by similar literature reviews(e.g., [46, 58, 36]). Our aim is not to derive best practicesfor all types of evaluation from this corpus: many other well-recognised venues may favour different evaluation approachesand epistemologies [70]. However, given empirical quantita-tive evaluations are a well-recognised approach to evaluationacross the field of HCI [10], standards for their conduct andpublication would benefit all publication venues.
We searched the proceedings of the publications listed above,using a request consisting only of the keywords for “visualimpairments” on Scopus. The search yielded 821 results.In contrast with the preliminary study, we did not includetechnology keywords since they are implicit to HCI. Nor didwe include the evaluation keywords as we filtered out papersmanually. The main search string is below; the full stringrestricting the search to the publications listed above can befound in supplementary material:TITLE-ABS-KEY(blind OR "deaf blind" OR deafblind ORdeaf-blind OR "eye disorder*" OR "partially sighted" OR"vision disorder*" OR "visual disabilit*" OR blindnessOR "visual impairment*" OR "visually impaired" OR"partial vision")
Study SelectionWe performed two rounds of study selection: (1) the firstround included papers based on their abstracts, and (2) thesecond round included papers based on whether they reporteda quantitative empirical evaluation.
First exclusion process: One researcher (five years of experi-ence in this area) read the abstracts of the 821 papers to selectstudies likely to include a quantitative empirical evaluation.She included 298 papers and excluded 523 papers. In caseswhere the type of evaluation is not specified within the abstract,the papers were included.
Papers were excluded for the following reasons. The first setwere out of scope (n=198), and either included systems ortechnology not intended for PVI, or papers reporting usingonly non-quantitative types of evaluation (e.g., qualitative,technical evaluation of algorithm accuracy). Papers that werenot full papers were also excluded (n=324): we did not includeposters, workshop papers, late-breaking work, or short papers.This is because the reporting of experiments have too muchdiscrepancy (often involving a lack of detail compared to full

papers). Finally, duplicate papers were excluded (n=1). SeeSupplementary material for the corpus at this stage.
Second exclusion process: The second exclusion was sharedamong the authors (between 5 and 20 years of experience ofworking on technologies for PVI): each was assigned between40 and 80 papers to review and code. During this process,authors excluded 120 papers. Papers were excluded becausethey were out of scope (n=63); they only reported qualitativeevaluation(s) (see 3.4 for a discussion of mixed quantitativeand qualitative evaluations); they were short papers (n=46);they did not meet requirements for reported information (n=10)(e.g., papers in which there was too much missing data aboutthe evaluation); or they were duplicate papers (n=1). At theend of this second exclusion process, there were 178 papersremaining in the corpus.
Data coding and cleaningThe corpus was reviewed by the five authors. We first codeddata describing the participants and evaluations from five pa-pers. This enabled verifying expectations were aligned andthat the data extracted was suitable for addressing the researchquestions. We could not find a model for the type of data toextract for this analysis. Instead, we developed the followingreporting form through discussion and iteration:
• Mode of interaction (e.g., visual enhancement, tactile, tan-gible, gestures);• Application area (e.g., navigation and walking, techniques
to access GUIs, education);• Number of quantitative empirical evaluations and of studies:
to identify whether evaluations are used in concert withother evaluation methods or in isolation, as well as thenumber of evaluations per paper;• Per evaluation: the description of its purpose, number and
reported characteristics of participants, length and context,measures (dependent variables), aim of the evaluation (mea-suring: primarily performance; performance with subjec-tive experience; or primarily subjective experience), thestatistical tests used, presence of qualitative questions, dif-ficulties mentioned by the authors and whether the coderestimates being able to reproduce the evaluation. Thesedata enabled understanding of whether participants wererepresentative of the larger visually impaired community,uncovered shared standards (such as the statistical testsused), and identified encountered difficulties;• Whether and how sighted participants were involved.
We carried out a verification process, during which an au-thor read and extracted data from one paper for each year ofpublication in the corpus. She found no issue with the dataextracted, but homogenized the way missing data was reported.For instance, coders had used “n/a,” “0” or “not reported” al-ternatively to indicate absence of data. We also produced twodocuments for data processing and analysis: one with onepaper per line and every quantitative empirical evaluations itincludes, and one with one evaluation per line.
Challenges in the selection and coding processThe structured description was initially more extensive, includ-ing the type of p-values used (when used), number of tasks,
precise description of visual impairments measurements, in-dependent variables, etc. However, we found that even recentpapers did not provide all these details, which we discuss be-low. Moreover, the coding process revealed that the differencequantitative and qualitative evaluations can be thin. One re-current debate regarding the inclusion of papers in the corpuswas how to handle papers using an experimental setup forevaluation, reporting some quantitative measures but focus-ing primarily on qualitative results. We decided to includethem, since there are no guidelines describing the minimumnumber of quantitative measures a paper should include, andusing a narrow definition of quantitative experiments wouldhave excluded many older studies. They also share evaluationconstructs: experience and performance, whereas qualitativeevaluations may look at different aspects. For instance, weincluded [32] which measured time and task success, but oth-erwise evaluated usability qualitatively; but we did not includeLinespace because it presented only subjective usability feed-back, reported thematically [72]. Two of the five authors alsoincluded qualitative evaluations reporting Cohen’s kappa forinter-rater reliability and included a coding sheet, because theresults were quantifiable. We decided not to include them,since the evaluation constructs were different. A last discrep-ancy between coders was the inclusion of pilot studies if theyare mentioned but not described. We included them, as this isprecisely a practice that we would benefit from understanding.In summary, this approach favors homogeneity of evaluationconstructs.
Analysis and InterpretationThe analysis was conducted using Excel and SPSS. We first cal-culated descriptive statistics to summarize each of the taggedaspects of evaluations for the entire corpus. We analysedvalues over the whole corpus before looking at trends by pub-lication year to assess whether our findings were still represen-tative of practices. When high heterogeneity was found (highstandard deviation), we examined outlying papers to providean explanation. We also propose a typology of papers andof how sighted participants are included in these evaluationsbased on the data. To interpret these results, we leveraged theworks from the Background section to make recommendationsfor future work. The aim is to contextualise this work withincurrent concerns about evaluation in HCI.
OVERVIEW OF THE CORPUSBefore reporting on evaluations, we describe the corpus interms of number of papers per venue and year of publication,areas of application, and interaction modalities involved.
Paper originAmong the 178 tagged papers, 50 had been published at CHI,98 at ASSETS, 6 at TOCHI, and 24 at TACCESS. The publica-tion year ranges from 1988 to 2019, with an increasing numberof papers per year. This parallels the overall increase in thenumber of papers published in these venues, but also includesthe higher rate of excluded papers in the 1990s, as quantitativeempirical evaluations were less of a standard (Figure 1).
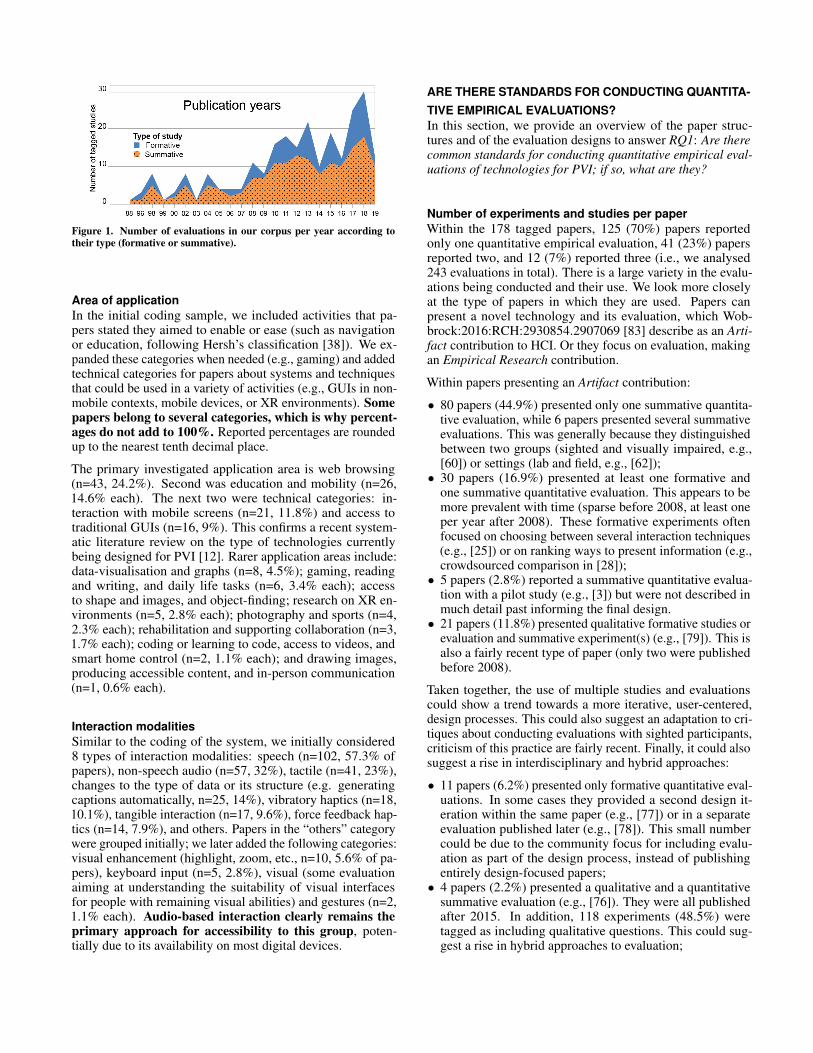
Figure 1. Number of evaluations in our corpus per year according totheir type (formative or summative).
Area of applicationIn the initial coding sample, we included activities that pa-pers stated they aimed to enable or ease (such as navigationor education, following Hersh’s classification [38]). We ex-panded these categories when needed (e.g., gaming) and addedtechnical categories for papers about systems and techniquesthat could be used in a variety of activities (e.g., GUIs in non-mobile contexts, mobile devices, or XR environments). Somepapers belong to several categories, which is why percent-ages do not add to 100%. Reported percentages are roundedup to the nearest tenth decimal place.
The primary investigated application area is web browsing(n=43, 24.2%). Second was education and mobility (n=26,14.6% each). The next two were technical categories: in-teraction with mobile screens (n=21, 11.8%) and access totraditional GUIs (n=16, 9%). This confirms a recent system-atic literature review on the type of technologies currentlybeing designed for PVI [12]. Rarer application areas include:data-visualisation and graphs (n=8, 4.5%); gaming, readingand writing, and daily life tasks (n=6, 3.4% each); accessto shape and images, and object-finding; research on XR en-vironments (n=5, 2.8% each); photography and sports (n=4,2.3% each); rehabilitation and supporting collaboration (n=3,1.7% each); coding or learning to code, access to videos, andsmart home control (n=2, 1.1% each); and drawing images,producing accessible content, and in-person communication(n=1, 0.6% each).
Interaction modalitiesSimilar to the coding of the system, we initially considered8 types of interaction modalities: speech (n=102, 57.3% ofpapers), non-speech audio (n=57, 32%), tactile (n=41, 23%),changes to the type of data or its structure (e.g. generatingcaptions automatically, n=25, 14%), vibratory haptics (n=18,10.1%), tangible interaction (n=17, 9.6%), force feedback hap-tics (n=14, 7.9%), and others. Papers in the “others” categorywere grouped initially; we later added the following categories:visual enhancement (highlight, zoom, etc., n=10, 5.6% of pa-pers), keyboard input (n=5, 2.8%), visual (some evaluationaiming at understanding the suitability of visual interfacesfor people with remaining visual abilities) and gestures (n=2,1.1% each). Audio-based interaction clearly remains theprimary approach for accessibility to this group, poten-tially due to its availability on most digital devices.
ARE THERE STANDARDS FOR CONDUCTING QUANTITA-TIVE EMPIRICAL EVALUATIONS?In this section, we provide an overview of the paper struc-tures and of the evaluation designs to answer RQ1: Are therecommon standards for conducting quantitative empirical eval-uations of technologies for PVI; if so, what are they?
Number of experiments and studies per paperWithin the 178 tagged papers, 125 (70%) papers reportedonly one quantitative empirical evaluation, 41 (23%) papersreported two, and 12 (7%) reported three (i.e., we analysed243 evaluations in total). There is a large variety in the evalu-ations being conducted and their use. We look more closelyat the type of papers in which they are used. Papers canpresent a novel technology and its evaluation, which Wob-brock:2016:RCH:2930854.2907069 [83] describe as an Arti-fact contribution to HCI. Or they focus on evaluation, makingan Empirical Research contribution.
Within papers presenting an Artifact contribution:
• 80 papers (44.9%) presented only one summative quantita-tive evaluation, while 6 papers presented several summativeevaluations. This was generally because they distinguishedbetween two groups (sighted and visually impaired, e.g.,[60]) or settings (lab and field, e.g., [62]);• 30 papers (16.9%) presented at least one formative and
one summative quantitative evaluation. This appears to bemore prevalent with time (sparse before 2008, at least oneper year after 2008). These formative experiments oftenfocused on choosing between several interaction techniques(e.g., [25]) or on ranking ways to present information (e.g.,crowdsourced comparison in [28]);• 5 papers (2.8%) reported a summative quantitative evalua-
tion with a pilot study (e.g., [3]) but were not described inmuch detail past informing the final design.• 21 papers (11.8%) presented qualitative formative studies or
evaluation and summative experiment(s) (e.g., [79]). This isalso a fairly recent type of paper (only two were publishedbefore 2008).
Taken together, the use of multiple studies and evaluationscould show a trend towards a more iterative, user-centered,design processes. This could also suggest an adaptation to cri-tiques about conducting evaluations with sighted participants,criticism of this practice are fairly recent. Finally, it could alsosuggest a rise in interdisciplinary and hybrid approaches:
• 11 papers (6.2%) presented only formative quantitative eval-uations. In some cases they provided a second design it-eration within the same paper (e.g., [77]) or in a separateevaluation published later (e.g., [78]). This small numbercould be due to the community focus for including evalu-ation as part of the design process, instead of publishingentirely design-focused papers;• 4 papers (2.2%) presented a qualitative and a quantitative
summative evaluation (e.g., [76]). They were all publishedafter 2015. In addition, 118 experiments (48.5%) weretagged as including qualitative questions. This could sug-gest a rise in hybrid approaches to evaluation;

• 6 papers (3.4%) presented analytical formative studies andevaluations (e.g., benchmark or technical evaluation notinvolving human participants).
Finally, an empirical quantitative evaluation can be the focus ofa paper, and inform us as much about technologies as they doabout users (n=15). For instance, [75] used such an evaluationto make a methodological contribution, and [54] examined theusability of phones with a theoretical aim.
Study length and contextStudy length was not consistently reported. We were able toreport it in 102, or 42% of, evaluations. When a time range wasreported, we calculated the average. Four evaluations (1.6% ofall evaluations) were conducted over periods superior to fourdays and up to two weeks long. For lab-based evaluations, theaverage length of en experiment is 89 minutes (median=66,min=10, max=360, stdev=70). For context, we found advice inthe literature that evaluations should be shorter to avoid fatigue(e.g., [9] recommends to keep them under 60 min). There is ahigh heterogeneity in the length of lab-based evaluations,and a very small percentage of long-term evaluation.
Context is not often explicitly reported and discussed, unlessthe experiment took place outside of a lab study. Duringdata extraction, we assumed that when it was not reported,the experiment was conducted in an academic office or lab.In 45 cases (18.5% of evaluations), the experiments wereconducted in a different type of space: online or remotely(n=14, 5.8% of all evaluations), everyday life settings (n=13,5.3%), and in relevant public settings such as airports (n=8,3.3%), schools (n=6, 2.5%), community spaces (e.g., the NYLighthouse; n=3, 1.2%), and libraries (n=1, 0.4%). We canconclude quantitative empirical evaluations are primarilyconducted in non-realistic settings.
Validated questionnairesWe reported whether evaluations used standardized question-naires to investigate usability: 23 evaluations did so (9.5%).These validated questionnaires are primarily for measuringsubjective experience. This includes the System UsabilityScale (SUS, n=9, 3.7% of all evaluations, [7]) and the UserExperience questionnaire (UEQ, n=2, 0.8%, [66]). Used asingle time (or in 0.4% of evaluations each) were the DesignOriented Evaluation of Perceived Usability (DEEP, [84]), theSoftware Usability for Blind Children Questionnaire (SUBC,[61]), the Single Use Question (SUQ, [63]), and the Positiveand Negative Affect Schedule (PANAS, [80]). Domain spe-cific questionnaires were used, including the Robotic SocialAttributes Scale (RoSAS, n=1, 0.4%, [20]) and the IgroupPresence Questionnaire (n=1, 0.4%, [82]). Some papers re-ported adapting Nielsen’s heuristics [53] or Shneiderman’sgolden rules [68] as the basis for subjective experience ques-tions and Likert scales. Finally, eight studies (3.3%) usedthe NASA-TLX test for cognitive workload [37]. Overall,there does not seem to be a standard shared set of toolsand measures.
MeasuresWe coded for three types of measures: primarily task per-formance (n=145, 59.7%), task performance and subjective
experience (n=69, 28.4%), and primarily subjective experi-ence (n=29, 11.9%). Although the majority of papers fo-cus on performance, a significant number of usability ex-periments focus on subjective experience, through measure-ments such as preference and perceived difficulty.
Statistical testsWe found that 143 evaluations (59.7%) used a statistical testto validate their results (twelve, or 4.9%, used descriptivestatistics). The most common tests are from the ANOVA(n=64, 26.3%) or t-tests (n=33, 13.6%) families, followed byWilcoxon (n=26, 10.7%). Many of the experiments withoutstatistical tests are pilot studies, and others focus on subjectiveexperience with quantitative measures. If we look at paperswith only summative experiments, the number of papers usinga statistical test raises to 67%. Hence, although it is a practiceused by a majority of the papers, many others only report onlynumerical values. One reason provided is that the sample sizeof participants is too small (e.g., [13]).
Quality metricsIn addition to the exclusion of papers with inconsistent report-ing or very little detail, we tagged (0 or 1) whether experimentswere missing information that would make duplicating the ex-periment difficult. This code was used at the discretion of thecoders. The coders looked for incomplete description of tasks,experiment design, and measures. Coders expressed this lackof detail for 39 evaluations (16%). This does not appear tohave decreased significantly through time (it represents 15%of evaluations between 2015 and 2019). This is concerning, es-pecially as many more papers could prove difficult to replicatein practice.
Answering RQ1Overall, these findings suggest that the most common type ofpaper is one that presents a new system followed by a summa-tive quantitative empirical evaluation (lab-based, measuringprimarily performance, using a statistical test). It could bedescribed as a standard. However, papers with formative stud-ies and evaluations are becoming ever more common, with alarge variety in the type of methods used. This could suggestan evolution towards more user-centered and iterative work(which might not be specific to assistive technologies for PVI),as well as better recognition of qualitative perspectives. Wenote, however, that very few papers were evaluated quantita-tively in real settings and that there are concerns regardingreproducibility, which could weaken validity [44].
REPRESENTATIVENESS OF PARTICIPANTSIn this section, we analyse the characteristics of the partici-pants involved to answer RQ2: Overall, are participants inthese evaluations representative of the target population? Wealso propose a typology of how sighted participants are in-volved in evaluations.
Number of participants per evaluationThe average number of participants per evaluation was 22.3(median=12, min=1, max=453, stdev=41.7). The numberof participants varied with the type of evaluation. In forma-tive evaluations, the average number of participants was 32.8

Figure 2. Mean number of participants according to the participants’visual status.
(median=12.4, stdev=64.1), as opposed to summative studies,where the number is 17.1 (median=11.8, stdev=23.1). Thenumber of participants decreases according to the positionof the experiment in the paper (as usually formative exper-iments are presented before summative ones): 24.5 for thefirst experiment (median=12, stdev=46.9), 17.3 participantsfor the second experiment (median=10, stdev=23.5), and 10.9participants the third experiment (median=7, stdev=22).
Visual status of participantsOver the 243 experiments of our corpus, 208 (85.5%) includedpeople with VI, 35 (14.4%) included blindfolded people, and63 (25.9%) included sighted people (not blindfolded). Surpris-ingly, 3 papers did not report whether participants had visualimpairment or not. Among the 208 studies with PVI, only 144of them (59.2% of the corpus) did exclusively involve PVI. Forexperiments that only involved PVI, the average number ofparticipants was 12.66 (median=9.67, stdev=11.8), while forstudies that did not involve PVI, the average number was 14.9(median=13, stdev=44.5). Those that used only blinfoldedparticipants had 23.1 (median=14, stedv=24.6) participants onaverage; when participants were a combination of blindfoldedand non-blindfolded sighted people (which only occurred fortwo studies) evaluations had 16 (median=16, stedv=5.6) par-ticipants on average. This is illustrated in Figure 2.
When looking at the distribution of the visual status of par-ticipants according to the type of study (see Figure 3), weobserved that formative experiments more often involvedblindfolded and sighted participants (n=44, 56% of for-mative studies), while summative experiments more fre-quently involved exclusively PVI (n=112, 69% of summa-tive studies).
Concerning the type of visual impairment, 104 evaluationsinvolved participants with non-specified visual impairments orsevere visual impairments, 41 involve people who are legallyblind, and 156 completely blind. Note that due to the absenceof shared standards for reporting (here, we used the WHOtypology [57]), some subjects may have been misclassified.Among the 243 experiments, only 53 (21.8%) reported (at dif-ferent levels of precision) the age of onset, 12 (4.9%) reportedthe causes of blindness, and only 6 (2.4%) reported other
Figure 3. Number of experiments according to the participants visualstatus and type of experiment (formative or summative).
types of impairment such as hearing impairment, intellectualdisability, or limited mobility.
Age and genderThe age of participants was not consistently reported, butthe majority of studies provided a median estimation. Whendata about every participant was available, we determined themedian ourselves. When only a range was provided, we usedthe average.
The median age of participants was 37 years old (min=9,max=80). This median age was clearly higher for partici-pants with vision impairment (38.3 years old) compared tosighted participants (29.6 years old).
Regarding gender: 65 experiments did not report this demo-graphic. In papers that did report on it, men were more fre-quently involved in research than women (12 vs. 9.3 partic-ipants/evaluation). Across the entire corpus, the gender ofthree participants was reported as “other”2, which we haveto presume means non-binary and two did not disclose theirgender.
Additional informationBeyond basic demographics, we identified four additional cat-egories of information provided by authors (in 140 evaluationsor 57.6%): technology usage (smartphone, computer, screenreader, etc.); expertise (braille, mathematics, musical, etc.);health-related information (visual and hearing acuity, healthproblems, etc.); and education (background). This suggestsresearchers are overall aware of the heterogeneity of par-ticipants’ profiles, although there is no standard model forwhat to report [21].
Use of sighted participantsAs noted above, sighted participants are often involved in eval-uations (30% of the experiments in our corpus). We systemati-cally tagged how sighted users participated in experiments:
• Comparison. When the performance of the two groups areevaluated, and then compared. Sometimes this is reportedas one experiment, sometimes as two. This was the case
2Current writing guidelines on writing gender advise against usingthis word. See: morgan-klaus.com/sigchi-gender-guidelines

of 34 evaluations in our corpus. Comparisons can be jus-tified by fundamental research questions, such as in [49]“the comparison between the results of the two groups canhelp identifying similarities and differences in the cognitiveprocess”.• Replacement. In some evaluations, PVI are intended as the
end-users, but are replaced by sighted participants. This isthe case in 19 evaluations. Generally, sighted participantsare used in formative or pilot studies (n=16), to choose thesystem that will be evaluated by PVI later. The analysis ofthe corpus confirms that replacement needs to be done care-fully, as performance of both group of users vary dependingon the task and technology (e.g., [2]).• Baseline. Eight evaluations reported using sighted partici-
pants as a baseline for performance for a given system. Forinstance, a study of the accessibility of Augmented Realityglasses while walking required measuring impact of walk-ing on sighted participants to identify the specific difficultyexperienced by PVI [85].• Improve statistical significance. Two evaluations indicated
that recruiting sighted users enabled them to verify statisti-cal significance, especially in cases where they could alsobe a target user (e.g., [49]). In contrast, some recent studies(see below) state they did not use a statistical test becausethe number of participants was too small. It is hence unclearwhether this practice will continue or will be replaced byother means of validating evaluations.• Two target user groups. Four evaluations explained their use
of sighted participants by their goal to develop non-visualsystems accessible by both sighted and PVI (e.g., [76]).• Collaboration: Four evaluations cite collaboration as the
main reason for involving sighted participants (one citesboth collaboration and considering two target-user groups).• Understand impact on environment. In one case, sighted
participants were involved as researchers wanted to evaluatethe impact on the behavior of sighted pedestrians in publicspaces. [41].
In summary, many evaluations involve sighted people; thereare many legitimate cases in which to do so. Regarding theinvolvement of sighted participants as a replacement for PVI informative evaluations, which is a more controversial approach,it might be possible to use qualitative studies to accomplishthis instead, as the analysis of the corpus papers above suggeststhey are well accepted.
Answering RQ2To contextualise these findings in terms of representativeness,we need to compare them to the population with VI in gen-eral. We note that blind and legally blind users are a minoritywithin PVI: 7% according to the World Health Organisation(WHO) [57]. However, they are involved in the majority ofexperiments. Moreover, the WHO estimates that 65% of PVIand 82% of blind people are over the age of 50, hence likelyto experience other impairments (2.4% in our corpus, the me-dian age of PVI participants was 38.5 years-old). Overall, thedesign and therefore the evaluation of assistive technologiesdo not reflect the global population of PVI. We speculate theunder-representation of blind participants can be explained bythe fact that they may have more considerable accessibility
issues than people with other visual impairments. Moreover,participants with additional impairments may instead be in-volved in studies about people with multiple disabilities. An-other area of concern is that few experiments report the ageof onset or cause of visual impairments, although this impactscognition and technology use [64].
DIFFICULTIES REPORTEDDuring the tagging, we noted whether authors reported anyparticular difficulty concerning the study. With this, we aimto answer RQ3: What are the difficulties encountered by re-searchers in this type of evaluation?. We classified these com-ments, reported in 31 papers (17.3%), into seven categories.They are reported here from the most frequently occurring tothe least, with the inclusion of representative examples fromthe corpus:
• Small available pool of PVI. Authors commented on re-cruitment difficulties (30%): “Obtaining a large number ofblind participants was difficult due to their relatively lowrepresentation in the general population” [6]. This was usedto motivate the recruitment of sighted people for formativestudies: “To avoid over-use of the relatively small pool ofnon-sighted people available for evaluations such as this, allbut one of the participants [...] were sighted” [17]. Othersreported their methods for recruiting participants, mostlythrough email lists and local organizations. This difficultyis even more common when it comes to recruiting children:“As access to blind children is very limited we first usedblind and visually impaired young adults” [81].• Sample size. As a direct consequence from the recruitment
problem, 12% reported that the sample size for the studywas small, explaining the choice of reporting only qualita-tive data: “the limited number of participants in our initialstudy makes it difficult for us to perform a statistical analy-sis of the quantitative data” [55].• Expertise of the participants. Beyond the recruitment of
PVI in general, finding participants with a specific expertiseis very difficult (12%):“the number of people qualified totest the workstation and its components are small” [71];“In Pakistan, finding blind computer users highly proficientwith LaTeX was not an easy task” [48].• Consistency between participants. Again as a consequence
of the small pool of available PVI, 10% reported that theresulting group of participants is too heterogeneous: “Itwould also be impossible to match participants; their back-grounds were simply too diverse: level of sight. aetiologyof disability. level and form of education and so on.” [71].• Inclusion of sighted people. Authors also discussed (9%) the
inclusion of sighted participants in the study as a limitation(“One limitation of this study is that the sighted participants’performance may not be representative of blind users” [39]).• Exclusion of participants. In some papers, authors reported
(6%) that they had to exclude participants from the studyresults due to several reasons: “We excluded from this anal-ysis one participant with low vision, since she could see,with some effort, the route on the screen” [35] or “we hadto exclude 4 of them; the first one did not have an under-standing of what geometric figures are, [...] the second onehad an unusually small hand [...] the third one kept falling

asleep [...] and with the fourth participant, we experiencedhardware failure” [69].• Other comments. Authors reported other difficulties, such as
scheduling problems (e.g., “requiring participants to travelto the study location” [16]), technical issues, the length ofthe experiment being too long for a certain modality, thedifficulty to create an inclusive experimental environment,the generalization of the results, or the definition of thestudy measures.
Answering RQ3Researchers do express difficulty to find and involve PVI intheir studies. By extension, it is difficult to design and conductexperiments similar to how they would be done with sightedparticipants. Taken together with the results of RQ1 and RQ2,this suggests that the standards for quantitative empirical eval-uations are hard to apply in this area of HCI, which couldexplain researchers turning to other approaches as discussedearlier.
DISCUSSION
Answering our research questionWe addressed the research question What is, at present, bestpractice in quantitative empirical evaluations of technologiesfor people with visual impairment in HCI? through an analysisof published evaluations. We adopted a broad definition ofquantitative empirical evaluations (instead of one restricted tocontrolled lab studies) to be able to identify the full range ofapproaches and what we can learn from them going forward.We found a wide range of approaches. There is one type ofpaper more common than others, a description of a design withone summative quantitative experiment, followed by paperswith either a pilot or a formative quantitative empirical eval-uation with one summative experiment. However, (1) thereare concerns about the quality of reporting of evaluations; (2)most design focus on a subset of PVI; and (3) researchersface difficulties in running evaluations (especially with PVI)while reaching the statistical significance expected in thesevenues. Practices appear to adapt to this issue in various ways,such as turning to qualitative evaluations or replacing visuallyimpaired participants with blindfolded sighted ones.
At present, involving sighted participants instead of visuallyimpaired participants is accepted practice, despite the manycritiques leveraged against it. We thus need to discuss andbuild standards for empirical quantitative evaluations that bothtake into account the difficulties researchers are running intoand this critique. For this, we propose to learn from otherfields that have addressed the same issues.
Limitations and future workWe identify two areas regarding limitations and future work:evaluations in other fields, and evaluating beyond empiricalquantitative evaluations.
Learning from Other FieldsWe have limited our inquiry to publications about technologiesin the field of HCI. This potentially limits our understandingof possible approaches to evaluation. During this research, wefound similar literature review in learning sciences [42] but
not others. As pointed out in our answer to RQ2, many eval-uations in our corpus do not follow standards for evaluatingtechnologies with PVI used in related research fields. Thiscould restrict interdisciplinary exchanges. Moreover, otherdisciplines concerned with assistive technologies can provideinspiration for the evaluations conducted in HCI. For instance,Kelly and Smith [42] acknowledge the difficulty of conduct-ing traditional experiments with a control group in specialeducation, recommending instead the use of single-subjectdesign. This is a standard practice in the field of orientationand mobility as well [5, 56, 45]. Both areas of applicationare prominent in our corpus. Technologies could be evaluatedwith a low number of representative participants, with new ex-periments over time adding to the credibility of the evaluation.The question however is which HCI publications would allowthis.
Other assessment approachesWe focus here on quantitative empirical evaluations. Theypose a number of concerns, from their validity to their ap-propriateness for technology that do not aim at compensatingan impairment but rather to foster experience or community.Several articles in the corpus raise concerns about the va-lidity of quantitative evaluations for user preference, due tousers attempting to please the designer [66, 75], which seemsmore pronounced for participants with visual impairments[75]. Further leveraging qualitative studies could be a wayto understand more nuanced experiences with technologies[70]. We should also account for the novelty effect [44]. Somepapers in our corpus conduct evaluations in the field and/orover relatively long periods (up to two weeks), but this is dif-ficult to do with large groups of participants. Single-subjectexperimental designs could also be a way to address this issuegoing forward.
Analytical evaluation includes heuristic evaluation, expertcomparisons with other products, or expert-led analysis tooutline a design space and design implications. These formsof expert-led evaluations have become increasingly rare inthe 2000s at venues such as CHI [10], although they are stillused as formative studies (6 papers in our corpus). Heuristicevaluations [53] are based on expert users identifying issuesand suggesting improvements, reporting the number of errorsor rating functions. This could be interesting in the case ofevaluations with PVI, as they can be considered as experts ofnon-visual uses of technologies. These results would have tobe considered carefully and optimally, so several evaluationapproaches should be used [33]. These other approaches toevaluation confirm the wide range of evaluation practices inthis community. It suggests potential ways of complementingquantitative empirical evaluation, especially in the formativestages, to lessen the involvement of sighted participants [67].However, the variety of evaluation approaches could also beseen negatively, as preventing the accumulation of knowl-edge due to generalization difficulty. We would argue that thecommunity benefits from shared standards in the area of quan-titative evaluation, particularly as these methods are key forsecuring funding for new interventions [42]. These standardsshould evolve as they are challenged by new approaches to

evaluation and the historical methods are not always appropri-ate.
RECOMMENDATIONSThe exploration of the three initial research questions led usto a set of recommendations on how to conduct, report, andreview experimental evaluations of technology for PVI.
Recommendations for conducting evaluationsIn this section we discuss how the involvement of participantswith visual impairments and approaches potentially enablingtheir wider participation.
• While it may be acceptable to include sighted participantsfor testing interaction techniques at the level of “actions,” itis not for testing a device designed to do a more cognitivetask. Indeed, visual impairments have consequences oneducation, knowledge and mental representations, which,in turn, have an impact on the execution of cognitive tasks.• This also suggests that if involving a few PVI in the early
cycles of a user-centered design is considered beneficial,validating the final design with that same population isconsidered crucial.• Visual impairments other than (isolated) blindness seem
under-represented across many of the studies. Involvingother users could offer a different perspective on the us-ability of technologies, and may provide insights to thetechnology’s benefit to a diverse population.• The variety of evaluation methods in the corpus should
encourage researchers to use the full range of evaluationapproaches, echoing Barkhuus and Rode [10]. We arguethis is not opposed to a shared standard for quantitativeevaluation, but that instead, it contributes to its evolutionand improvement through time.• Evaluations conducted in the field, on participants’ own
spaces and schedules, and within a context of high involve-ment in the community such as participatory design couldbe easier to conduct.• Single subject design for quantitative evaluations could be
an interesting approach to address the current difficultiesencountered by researchers.
Recommendations for reporting evaluationWithin the corpus there were inconsistencies in reporting. Hereare a few key points all authors can address to help situatestudy results and understand their generalizability:
• We encourage authors to report participant characteristicsindividually through a description table, using the user char-acteristics listed above, as long as this does not threatentheir privacy and security.• We also encourage authors to use standardized metrics when
giving an overview of the group, including median age, gen-der, education level, and experience with relevant technolo-gies or subjects.• It would be beneficial to systematically use the WHO clas-
sification for visual impairments so experiments can becompared. This considers that technologies evaluated quali-tatively have the aim to help access to fairly narrow tasks,for which this medical classification is relevant. In other
cases, functional definitions (e.g., ability to read at a certaindistance most of the time) might be better suited.• We provide a typology of the reasons for including sighted
users as participants. These could be used as references todescribe and motivate their inclusion.• For general reporting, an even greater transparency on the
issues of designing and analysing results would be beneficialto this research community as it enables continuous reviewof standards.
Recommendations for reviewing evaluationIn addition to changes researchers can make to their ownresearch and reporting practices, they can also consider thefollowing points when reviewing work for others:
• We highlight the difficulties reported by researchers duringtheir evaluations. Being aware and considerate of these diffi-culties could help promote more inclusive practices, insteadof adaptations to quality metrics used for other technologies(e.g., adding sighted participants to reach validity).• Rejecting a paper based on low sample size may hinder
research in the field; the community should support authorsand new researchers in reporting results appropriate forthe sample size, i.e., using in-depth qualitative analysis ifquantitative is not possible.• Reviewers should pay special attention to how authors re-
port their evaluations and particularly to comprehensivenessof the description of participants.• Reviewers can refer to the previous recommendations for re-
porting evaluations when suggesting changes for the camera-ready version of a paper.
CONCLUSIONMotivated by a lack of systematic surveys on evaluationmethodologies for technologies for PVI, we set out to reviewa corpus of 178 papers on assistive HCI published over thepast three decades. We analysed types and forms of quanti-tative empirical evaluations used, sample representation, andreported difficulties in conducting evaluations in this space.Our findings confirm there is an implicit standard (a noveltechnique with a summative quantitative evaluation), whichco-exists with a wide range of other types of article. We notedconcerns about the reporting of evaluations and the represen-tation of PVI in these evaluations. We also report on thedifficulties experienced by researchers and discussed alterna-tive and complementary approaches to quantitative empiricalevaluations as they are currently run. We frame our findings inthe form of recommendations for conducting, reporting, andreviewing empirical evaluations of technologies for PVI, thatwe hope will help improve evaluation practices in this domain.
ACKNOWLEDGEMENTSThe authors would like to thank the workshop and SIG partic-ipants who contributed to map these issues (inclusiveeduca-tion.tech). This work has received funding from the Univer-sity of Sussex Research and Development Fund, from theFrench National Research Agency (AccessiMap ANR-14-CE17-0018) and the EPSRC (CRITICAL Fellowship Project,EP/N00616X/2).

REFERENCES[1] 2019. Human Computer Interaction - Google Scholar
Metrics. (2019).https://scholar.google.com/citations?view_op=top_
venues&hl=en&vq=eng_humancomputerinteraction
[2] Iyad Abu Doush, Enrico Pontelli, Dominic Simon,Tran Cao Son, and Ou Ma. 2009. Making MicrosoftExcelâDc: multimodal presentation of charts. InProceedings of the 11th international ACM SIGACCESSconference on Computers and accessibility. ACM,147–154.
[3] Jérémy Albouys-Perrois, Jérémy Laviole, Carine Briant,and Anke M Brock. 2018. Towards a multisensoryaugmented reality map for blind and low vision people:A participatory design approach. In Proceedings of the2018 CHI Conference on Human Factors in ComputingSystems. ACM, 629.
[4] Farhan Khashim Alswailmi. 2018. Global prevalenceand causes of visual impairment with special referenceto the general population of Saudi Arabia. Pakistanjournal of medical sciences 34, 3 (2018), 751.
[5] Catherine L Backman and Susan R Harris. 1999. CaseStudies, Single-Subject Research, and N of 1Randomized Trials: Comparisons and Contrasts1.American Journal of Physical Medicine &Rehabilitation 78, 2 (1999), 170–176.
[6] Suzanne Balik, Sean Mealin, Matthias Stallmann,Robert Rodman, Michelle Glatz, and Veronica Sigler.2014. Including blind people in computing throughaccess to graphs. ASSETS14 - Proceedings of the 16thInternational ACM SIGACCESS Conference onComputers and Accessibility (10 2014), 91–98. DOI:http://dx.doi.org/10.1145/2661334.2661364
[7] Aaron Bangor, Philip T Kortum, and James T Miller.2008. An empirical evaluation of the system usabilityscale. Intl. Journal of Human–Computer Interaction 24,6 (2008), 574–594.
[8] Sandra Bardot, Marcos Serrano, and ChristopheJouffrais. 2016. From Tactile to Virtual: Using aSmartwatch to Improve Spatial Map Exploration forVisually Impaired Users. In Proceedings of the 18thInternational Conference on Human-ComputerInteraction with Mobile Devices and Services(MobileHCI ’16). ACM, New York, NY, USA, 100–111.DOI:http://dx.doi.org/10.1145/2935334.2935342
[9] Sandra Bardot, Marcos Serrano, Simon Perrault,Shengdong Zhao, and Christophe Jouffrais. 2019.Investigating Feedback for Two-Handed Exploration ofDigital Maps Without Vision. In IFIP Conference onHuman-Computer Interaction. Springer, 305–324.
[10] Louise Barkhuus and Jennifer A. Rode. 2007. FromMice to Men - 24 Years of Evaluation in CHI. InProceedings of the SIGCHI Conference on HumanFactors in Computing Systems (CHI ’07). ACM, NewYork, NY, USA, Article 1. DOI:http://dx.doi.org/10.1145/1240624.2180963
[11] Cynthia L. Bennett and Daniela K. Rosner. 2019. ThePromise of Empathy: Design, Disability, and Knowingthe "Other". In Proceedings of the 2019 CHI Conferenceon Human Factors in Computing Systems (CHI ’19).ACM, New York, NY, USA, Article 298, 13 pages. DOI:http://dx.doi.org/10.1145/3290605.3300528
[12] Alexy Bhowmick and Shyamanta M Hazarika. 2017. Aninsight into assistive technology for the visuallyimpaired and blind people: state-of-the-art and futuretrends. Journal on Multimodal User Interfaces 11, 2(2017), 149–172.
[13] Syed Masum Billah, Yu-Jung Ko, Vikas Ashok, XiaojunBi, and IV Ramakrishnan. 2019. Accessible GestureTyping for Non-Visual Text Entry on Smartphones. InProceedings of the 2019 CHI Conference on HumanFactors in Computing Systems (CHI ’19). ACM, NewYork, NY, USA, Article 376, 12 pages. DOI:http://dx.doi.org/10.1145/3290605.3300606
[14] Kirsten Boehner, Janet Vertesi, Phoebe Sengers, andPaul Dourish. 2007. How HCI interprets the probes. InProceedings of the SIGCHI conference on Humanfactors in computing systems. ACM, 1077–1086.
[15] Sebastian K Boell and Dubravka Cecez-Kecmanovic.2010. Literature reviews and the hermeneutic circle.Australian Academic & Research Libraries 41, 2 (2010),129–144.
[16] Danielle Bragg, Cynthia Bennett, Katharina Reinecke,and Richard Ladner. 2018. A Large Inclusive Study ofHuman Listening Rates. In Proceedings of the 2018 CHIConference on Human Factors in Computing Systems(CHI ’18). ACM, New York, NY, USA, Article 444, 12pages. DOI:http://dx.doi.org/10.1145/3173574.3174018
[17] Andy Brown, Steve Pettifer, and Robert Stevens. 2003.Evaluation of a Non-visual Molecule Browser.SIGACCESS Access. Comput. 77-78 (Sept. 2003), 40–47.DOI:http://dx.doi.org/10.1145/1029014.1028639
[18] Emeline Brulé and Christophe Jouffrais. 2016.Representing children living with visual impairments inthe design process: A case study with personae. InDesigning Around People. Springer, 23–32.
[19] Emeline Brulé, Oussama Metatla, Katta Spiel, AhmedKharrufa, and Charlotte Robinson. 2019. EvaluatingTechnologies with and for Disabled Children. InExtended Abstracts of the 2019 CHI Conference onHuman Factors in Computing Systems (CHI EA ’19).ACM, New York, NY, USA, Article SIG08, 6 pages.DOI:http://dx.doi.org/10.1145/3290607.3311757
[20] Colleen M Carpinella, Alisa B Wyman, Michael APerez, and Steven J Stroessner. 2017. The robotic socialattributes scale (rosas): Development and validation. InProceedings of the 2017 ACM/IEEE InternationalConference on human-robot interaction. ACM,254–262.

[21] Anna Cavender, Shari Trewin, and Vicki Hanson. 2014.Accessible writing guide.https://www.sigaccess.org/welcome-to-sigaccess/resources/accessible-writing-guide/(2014).
[22] John A Collins and Bart CJM Fauser. 2005. Balancingthe strengths of systematic and narrative reviews. (2005).
[23] Ticianne GR Darin, Rossana Andrade, Lotfi B Merabet,and Jaime Hernán Sánchez. 2017. Investigating theMode in Multimodal Video Games: Usability Issues forLearners who are Blind. In Proceedings of the 2017 CHIConference Extended Abstracts on Human Factors inComputing Systems. ACM, 2487–2495.
[24] Pierre Dragicevic. 2016. Fair statistical communicationin HCI. In Modern Statistical Methods for HCI.Springer, 291–330.
[25] Julie Ducasse, Marc Macé, Bernard Oriola, andChristophe Jouffrais. 2018. BotMap: Non-VisualPanning and Zooming with an Actuated TabletopTangible Interface. ACM Transactions onComputer-Human Interaction (TOCHI) 25, 4 (2018), 24.
[26] Julie Ducasse, Marc J-M Macé, Marcos Serrano, andChristophe Jouffrais. 2016. Tangible Reels:Construction and Exploration of Tangible Maps byVisually Impaired Users. In Proceedings of the 2016CHI Conference on Human Factors in ComputingSystems (CHI ’16). ACM, New York, NY, USA,2186–2197. DOI:http://dx.doi.org/10.1145/2858036.2858058
[27] Naomi Friedlander, Kevin Schlueter, and MarilynMantei. 1998. Bullseye! when Fitts’ law doesn’t fit. InProceedings of the SIGCHI conference on Humanfactors in computing systems. ACMPress/Addison-Wesley Publishing Co., 257–264.
[28] Prathik Gadde and Davide Bolchini. 2014. From screenreading to aural glancing: towards instant access to keypage sections. In Proceedings of the 16th internationalACM SIGACCESS conference on Computers &accessibility. ACM, 67–74.
[29] Thomas Gallagher, Elyse Wise, Hoe Chee Yam,Binghao Li, Euan Ramsey-Stewart, Andrew GDempster, and Chris Rizos. 2014. Indoor navigation forpeople who are blind or vision impaired: where are weand where are we going? Journal of Location BasedServices 8, 1 (2014), 54–73.
[30] Morton Ann Gernsbacher. 2017. Editorial Perspective:The use of person-first language in scholarly writingmay accentuate stigma. Journal of Child Psychologyand Psychiatry 58, 7 (2017), 859–861. DOI:http://dx.doi.org/10.1111/jcpp.12706
[31] Monica Gori, Giulia Cappagli, Alessia Tonelli, GabrielBaud-Bovy, and Sara Finocchietti. 2016. Devices forvisually impaired people: High technological deviceswith low user acceptance and no adaptability for
children. Neuroscience & Biobehavioral Reviews 69(2016), 79–88.
[32] Timo Götzelmann. 2018. Autonomous Selection andPrinting of 3D Models for People Who Are Blind. ACMTransactions on Accessible Computing (TACCESS) 11, 3(2018), 14.
[33] Wayne D Gray and Marilyn C Salzman. 1998. Damagedmerchandise? A review of experiments that compareusability evaluation methods. Human-computerinteraction 13, 3 (1998), 203–261.
[34] Saul Greenberg and Bill Buxton. 2008. Usabilityevaluation considered harmful (some of the time). InProceedings of the SIGCHI conference on Humanfactors in computing systems. ACM, 111–120.
[35] João Guerreiro, Dragan Ahmetovic, Kris M. Kitani, andChieko Asakawa. 2017. Virtual Navigation for BlindPeople: Building Sequential Representations of theReal-World. In Proceedings of the 19th InternationalACM SIGACCESS Conference on Computers andAccessibility (ASSETS ’17). ACM, New York, NY, USA,280–289. DOI:http://dx.doi.org/10.1145/3132525.3132545
[36] Kim Halskov and Nicolai Brodersen Hansen. 2015. Thediversity of participatory design research practice atPDC 2002–2012. International Journal ofHuman-Computer Studies 74 (2015), 81–92.
[37] Sandra G Hart. 2006. NASA-task load index(NASA-TLX); 20 years later. In Proceedings of thehuman factors and ergonomics society annual meeting,Vol. 50. Sage publications Sage CA: Los Angeles, CA,904–908.
[38] Marion Hersh and Michael A Johnson. 2010. Assistivetechnology for visually impaired and blind people.Springer Science & Business Media.
[39] Jonggi Hong, Alisha Pradhan, Jon E. Froehlich, andLeah Findlater. 2017. Evaluating Wrist-Based HapticFeedback for Non-Visual Target Finding and PathTracing on a 2D Surface. In Proceedings of the 19thInternational ACM SIGACCESS Conference onComputers and Accessibility (ASSETS ’17). ACM, NewYork, NY, USA, 210–219. DOI:http://dx.doi.org/10.1145/3132525.3132538
[40] Hernisa Kacorri, Eshed Ohn-Bar, Kris M Kitani, andChieko Asakawa. 2018. Environmental factors in indoornavigation based on real-world trajectories of blindusers. In Proceedings of the 2018 CHI Conference onHuman Factors in Computing Systems. ACM, 56.
[41] Seita Kayukawa, Keita Higuchi, João Guerreiro, ShigeoMorishima, Yoichi Sato, Kris Kitani, and ChiekoAsakawa. 2019. BBeep: A Sonic Collision AvoidanceSystem for Blind Travellers and Nearby Pedestrians. InProceedings of the 2019 CHI Conference on HumanFactors in Computing Systems. ACM, 52.

[42] Stacy M Kelly and Derrick W Smith. 2011. The impactof assistive technology on the educational performanceof students with visual impairments: A synthesis of theresearch. Journal of Visual Impairment & Blindness 105,2 (2011), 73–83.
[43] Barbara Kitchenham. 2004. Procedures for performingsystematic reviews. Keele, UK, Keele University 33,2004 (2004), 1–26.
[44] Jesper Kjeldskov and Mikael B Skov. 2014. Was itworth the hassle?: ten years of mobile HCI researchdiscussions on lab and field evaluations. In Proceedingsof the 16th international conference onHuman-computer interaction with mobile devices &services. Acm, 43–52.
[45] Steven La Grow and others. 1999. The use of the SonicPathfinder as a secondary mobility aid for travel inbusiness environments: a single-subject design. Journalof rehabilitation research and development 36, 4 (1999),333–340.
[46] Heidi Lam, Enrico Bertini, Petra Isenberg, CatherinePlaisant, and Sheelagh Carpendale. 2011. Seven guidingscenarios for information visualization evaluation.(2011).
[47] Shachar Maidenbaum, Sami Abboud, and Amir Amedi.2014. Sensory substitution: closing the gap betweenbasic research and widespread practical visualrehabilitation. Neuroscience & Biobehavioral Reviews41 (2014), 3–15.
[48] Ahtsham Manzoor, Safa Arooj, Shaban Zulfiqar,Murayyiam Parvez, Suleman Shahid, and Asim Karim.2019. ALAP: Accessible LaTeX Based MathematicalDocument Authoring and Presentation. In Proceedingsof the 2019 CHI Conference on Human Factors inComputing Systems (CHI ’19). ACM, New York, NY,USA, Article 504, 12 pages. DOI:http://dx.doi.org/10.1145/3290605.3300734
[49] Sergio Mascetti, Andrea Gerino, Cristian Bernareggi,and Lorenzo Picinali. 2017. On the evaluation of novelsonification techniques for non-visual shape exploration.ACM Transactions on Accessible Computing (TACCESS)9, 4 (2017), 13.
[50] Joseph E McGrath. 1995. Methodology matters: Doingresearch in the behavioral and social sciences. InReadings in Human–Computer Interaction. Elsevier,152–169.
[51] Oussama Metatla, Marcos Serrano, Christophe Jouffrais,Anja Thieme, Shaun Kane, Stacy Branham, ÉmelineBrulé, and Cynthia L. Bennett. 2018a. InclusiveEducation Technologies: Emerging Opportunities forPeople with Visual Impairments. In Extended Abstractsof the 2018 CHI Conference on Human Factors inComputing Systems (CHI EA ’18). ACM, New York, NY,USA, Article W13, 8 pages. DOI:http://dx.doi.org/10.1145/3170427.3170633
[52] Oussama Metatla, Anja Thieme, Emeline Brulé, CynthiaBennett, Marcos Serrano, and Christophe Jouffrais.2018b. Toward Classroom Experiences Inclusive ofStudents with Disabilities. Interactions 26, 1 (Dec.2018), 40–45. DOI:http://dx.doi.org/10.1145/3289485
[53] Jakob Nielsen and Rolf Molich. 1990. Heuristicevaluation of user interfaces. In Proceedings of theSIGCHI conference on Human factors in computingsystems. ACM, 249–256.
[54] Joyojeet Pal, Anandhi Viswanathan, Priyank Chandra,Anisha Nazareth, Vaishnav Kameswaran, HariharanSubramonyam, Aditya Johri, Mark S Ackerman, andSile O’Modhrain. 2017. Agency in assistive technologyadoption: visual impairment and smartphone use inBangalore. In Proceedings of the 2017 CHI Conferenceon Human Factors in Computing Systems. ACM,5929–5940.
[55] Peter Parente. 2004. Audio Enriched Links: Web PagePreviews for Blind Users. In Proceedings of the 6thInternational ACM SIGACCESS Conference onComputers and Accessibility (Assets ’04). ACM, NewYork, NY, USA, 2–8. DOI:http://dx.doi.org/10.1145/1028630.1028633
[56] Amy T Parker. 2009. Orientation and mobility withpersons who are deaf-blind: An initial examination ofsingle-subject design research. Journal of VisualImpairment & Blindness 103, 6 (2009), 372–377.
[57] Donatella Pascolini and Silvio Paolo Mariotti. 2012.Global estimates of visual impairment: 2010. BritishJournal of Ophthalmology 96, 5 (2012), 614–618.
[58] Adam Perer and Ben Shneiderman. 2009. Integratingstatistics and visualization for exploratory power: Fromlong-term case studies to design guidelines. IEEEComputer Graphics and Applications 29, 3 (2009),39–51.
[59] Helen Petrie and N Bevan. 2009. The evaluation ofaccessibility, usability, and user experience. 20–1.
[60] Andreas Reichinger, Helena Garcia Carrizosa, JoannaWood, Svenja Schröder, Christian Löw, Laura RosaliaLuidolt, Maria Schimkowitsch, Anton Fuhrmann, StefanMaierhofer, and Werner Purgathofer. 2018. Pictures inyour mind: using interactive gesture-controlled reliefs toexplore art. ACM Transactions on Accessible Computing(TACCESS) 11, 1 (2018), 2.
[61] Jaime Sánchez. 2003. Software Usability for BlindChildren Questionnaire (SUBC). Usability evaluationtest, University of Chile (2003).
[62] Daisuke Sato, Uran Oh, Kakuya Naito, Hironobu Takagi,Kris Kitani, and Chieko Asakawa. 2017. Navcog3: Anevaluation of a smartphone-based blind indoornavigation assistant with semantic features in alarge-scale environment. In Proceedings of the 19thInternational ACM SIGACCESS Conference onComputers and Accessibility. ACM, 270–279.

[63] Jeff Sauro and Joseph S Dumas. 2009. Comparison ofthree one-question, post-task usability questionnaires. InProceedings of the SIGCHI conference on humanfactors in computing systems. ACM, 1599–1608.
[64] Victor R Schinazi, Tyler Thrash, and Daniel-RobertChebat. 2016. Spatial navigation by congenitally blindindividuals. WIREs Cognitive Science (2016).
[65] Jean Scholtz. 2004. Usability evaluation. NationalInstitute of Standards and Technology 1 (2004).
[66] Martin Schrepp, Andreas Hinderks, and JörgThomaschewski. 2014. Applying the user experiencequestionnaire (UEQ) in different evaluation scenarios. InInternational Conference of Design, User Experience,and Usability. Springer, 383–392.
[67] Andrew Sears and Vicki L. Hanson. 2012. RepresentingUsers in Accessibility Research. ACM Trans. Access.Comput. 4, 2, Article 7 (March 2012), 6 pages. DOI:http://dx.doi.org/10.1145/2141943.2141945
[68] Ben Shneiderman. 1986. Designing the User Interface:Strategies for Effective Human-computer Interaction.Addison-Wesley Longman Publishing Co., Inc., Boston,MA, USA.
[69] Andrii Soviak, Anatoliy Borodin, Vikas Ashok, YevgenBorodin, Yury Puzis, and I.V. Ramakrishnan. 2016.Tactile Accessibility: Does Anyone Need a HapticGlove?. In Proceedings of the 18th International ACMSIGACCESS Conference on Computers and Accessibility(ASSETS ’16). ACM, New York, NY, USA, 101–109.DOI:http://dx.doi.org/10.1145/2982142.2982175
[70] Katharina Spiel, Christopher Frauenberger, EvaHornecker, and Geraldine Fitzpatrick. 2017. Whenempathy is not enough: Assessing the experiences ofautistic children with technologies. In Proceedings ofthe 2017 CHI Conference on Human Factors inComputing Systems. ACM, 2853–2864.
[71] Robert D Stevens and Alistair DN Edwards. 1996. Anapproach to the evaluation of assistive technology. InACM SIGACCESS Conference on AssistiveTechnologies: Proceedings of the second annual ACMconference on Assistive technologies, Vol. 11. 64–71.
[72] Saiganesh Swaminathan, Thijs Roumen, Robert Kovacs,David Stangl, Stefanie Mueller, and Patrick Baudisch.2016. Linespace: A sensemaking platform for the blind.In Proceedings of the 2016 CHI Conference on HumanFactors in Computing Systems. ACM, 2175–2185.
[73] Joe Tekli, Youssef Bou Issa, and Richard Chbeir. 2018.Evaluating Touch-screen Vibration Modality for BlindUsers to Access Simple Shapes and Graphics. Int. J.Hum.-Comput. Stud. 110, C (Feb. 2018), 115–133. DOI:http://dx.doi.org/10.1016/j.ijhcs.2017.10.009
[74] Brianna J Tomlinson, Jared Batterman, Yee Chieh Chew,Ashley Henry, and Bruce N Walker. 2016. Exploringauditory graphing software in the classroom: The effectof auditory graphs on the classroom environment. ACMTransactions on Accessible Computing (TACCESS) 9, 1(2016), 3.
[75] Shari Trewin, Diogo Marques, and Tiago Guerreiro.2015. Usage of subjective scales in accessibilityresearch. In Proceedings of the 17th International ACMSIGACCESS Conference on Computers & Accessibility.ACM, 59–67.
[76] Michel Vacher, Sybille Caffiau, François Portet, BrigitteMeillon, Camille Roux, Elena Elias, BenjaminLecouteux, and Pedro Chahuara. 2015. Evaluation of acontext-aware voice interface for Ambient AssistedLiving: qualitative user study vs. quantitative systemevaluation. ACM Transactions on Accessible Computing(TACCESS) 7, 2 (2015), 5.
[77] Aditya Vashistha, Edward Cutrell, Gaetano Borriello,and William Thies. 2015. Sangeet swara: Acommunity-moderated voice forum in rural india. InProceedings of the 33rd Annual ACM Conference onHuman Factors in Computing Systems. ACM, 417–426.
[78] Bruce N Walker, Jeffrey Lindsay, and Justin Godfrey.2004. The audio abacus: representing numerical valueswith nonspeech sound for the visually impaired. In ACMSIGACCESS Accessibility and Computing. ACM, 9–15.
[79] Ruolin Wang, Chun Yu, Xing-Dong Yang, Weijie He,and Yuanchun Shi. 2019. EarTouch: FacilitatingSmartphone Use for Visually Impaired People in Mobileand Public Scenarios. In Proceedings of the 2019 CHIConference on Human Factors in Computing Systems.ACM, 24.
[80] David Watson, Lee Anna Clark, and Auke Tellegen.1988. Development and validation of brief measures ofpositive and negative affect: the PANAS scales. Journalof personality and social psychology 54, 6 (1988), 1063.
[81] Graham Wilson and Stephen A. Brewster. 2016. UsingDynamic Audio Feedback to Support PeripersonalReaching in Young Visually Impaired People. InProceedings of the 18th International ACM SIGACCESSConference on Computers and Accessibility (ASSETS’16). ACM, New York, NY, USA, 209–218. DOI:http://dx.doi.org/10.1145/2982142.2982160
[82] Bob G Witmer and Michael J Singer. 1998. Measuringpresence in virtual environments: A presencequestionnaire. Presence 7, 3 (1998), 225–240.
[83] Jacob O. Wobbrock and Julie A. Kientz. 2016. ResearchContributions in Human-computer Interaction.Interactions 23, 3 (April 2016), 38–44. DOI:http://dx.doi.org/10.1145/2907069
[84] Tao Yang, Jared Linder, and Davide Bolchini. 2012.DEEP: design-oriented evaluation of perceived usability.International Journal of Human-Computer Interaction28, 5 (2012), 308–346.
[85] Yuhang Zhao, Michele Hu, Shafeka Hashash, and ShiriAzenkot. 2017. Understanding Low Vision People’sVisual Perception on Commercial Augmented RealityGlasses. In Proceedings of the 2017 CHI Conference onHuman Factors in Computing Systems. ACM,4170–4181.


![[WI 2017] Context Suggestion: Empirical Evaluations vs User Studies](https://img.pdfslide.net/doc/110x75/5a65e4417f8b9a6f448b48e5/wi-2017-context-suggestion-empirical-evaluations-vs-user-studies.jpg)