Embed Size (px)
Citation preview
U.S. Department of Housing and Urban Development Office of Policy Development and Research
REVIEW OF STRUCTURAL MATERIALS AND METHODS FOR HOME BUILDING IN THE UNITED STATES: 1900 to 2000

PATH (Partnership for Advancing Technology in Housing) is a new private/public effort to develop, demonstrate, and gain widespread market acceptance for the Next Generation" of American Housing. Through the use of new or innovative technologies, the goal of PATH is to improve the quality, durability, environmental efficiency, and affordability of tomorrow's homes.
PATH, initiated jointly by the Administration and Congress, is managed and supported by the Department of Housing and Urban Development (HUD). In addition, all Federal Agencies that engage in housing research and technology development are PATH Partners, including the Departments of Energy and Commerce, as well as the Environmental Protection Agency (EPA) and the Federal Emergency Management Agency (FEMA). State and local governments and other participants from the private sector are also partners in PATH. Product manufacturers, home builders, insurance companies, and lenders represent private industry in the PATH Partnership.
To learn more about PATH, please contact:
451 7th Street, SW, Suite B 133 Washington, DC 20410 202-708-4250 (fax) e-mail: [email protected] website: www.pathnet.org
Visit PD&R's Web Site www.huduser.org to find this report and others sponsored by HUD's Office of Policy Development and Research (PD&R).
Other services of HUD USER, PD&R's Research Information Service, include listservs; special interest, bimonthly publications (best practices, significant studies from other sources); access to public use databases; hotline 1-800-245-2691 for help accessing the information you need.

REVIEW OF STRUCTURAL MATERIALS AND METHODS FOR HOME BUILDING IN THE UNITED STATES: 1900 to 2000
Prepared for
U.S. Department of Housing and Urban Development Washington, DC
Contract No.: C-OPC-21289
by
NAHB Research Center, Inc. Upper Marlboro, MD
January 25, 2001
ACKNOWLEDGEMENTS
Much gratitude is owed to the U.S. Department of Housing and Urban Development for its sponsorship of this work. Special appreciation is given to William Freeborne for his interest in all aspects of housing construction and technology. The principle author of this document, Jay H. Crandell, also wishes to recognize the thorough review provided by Don Luebs, the research assistance provided by Dan Priest, and the administrative support provided by Lynda Marchman and Donna Woodhurst.
"In dedication to my grandfather, John O. Crandell, Sr., (1904-2000) whose experience in carpentry, home building, and construction stemmed from his desire to work and to provide for his family and others."
Jay H. Crandell January 16, 2001
NOTICE
The work that provided the basis for this publication was supported by funding under a grant with the U.S. Department of Housing and Urban Development. The substance and findings of the work are dedicated to the public. The author is solely responsible for the accuracy of the statements and interpretations contained in this publication. Such interpretations do not necessarily reflect the views of the Government.
The U.S. Government does not endorse products or manufacturers. Trade or manufacturers' names appear herein solely because they are considered essential to the object of this report.
DISCLAIMER
This publication has been prepared by the NAHB Research Center, Inc., which makes no warranty, express or implied, and assumes no legal liability or responsibility for the accuracy, completeness, or usefulness of any information, apparatus, product, or process disclosed, and makes no representation that its use would not infringe on privately owned rights. The contents of this report are the views of the contractor and do not necessarily reflect the views or policies of the U.S. Department of Housing and Urban Development, the U.S. Government, or any other person or organization.
Cover Photo Courtesy of Bonotom Studios
ii
TABLE OF CONTENTS
PAGE
INTRODUCTION .......................................................................................................................................................................................1
1.0 GENERAL HOUSING CHARACTERISTICS ..............................................................................................................................21.1 Early 1900s ..........................................................................................................................................................................21.2 Mid-1900s ............................................................................................................................................................................31.3 Late 1900s............................................................................................................................................................................5
2.0 DESIGN LOADS .............................................................................................................................................................................7
3.0 FOUNDATION CONSTRUCTION ...............................................................................................................................................9
4.0 WOOD-FRAME CONSTRUCTION............................................................................................................................................104.1 Wood Materials..................................................................................................................................................................15
4.1.1 Size.........................................................................................................................................................................154.1.2 Type/Species ..........................................................................................................................................................154.1.3 Structural Properties...............................................................................................................................................16
4.2 Floor Framing ....................................................................................................................................................................234.3 Wall Framing .....................................................................................................................................................................25
4.3.1 Studding .................................................................................................................................................................254.3.2 Plates ......................................................................................................................................................................254.3.3 Corners...................................................................................................................................................................254.3.4 Headers...................................................................................................................................................................264.3.5 Bracing ...................................................................................................................................................................26
4.4 Roof Framing .....................................................................................................................................................................314.4.1 Rafters ....................................................................................................................................................................314.4.2 Roof Sheathing.......................................................................................................................................................32
4.5 Fasteners and Connections.................................................................................................................................................324.5.1 Early 1900s ............................................................................................................................................................334.5.2 Late 1900s..............................................................................................................................................................34
iii

5.0 CONSTRUCTION QUALITY......................................................................................................................................................356.0 SUMMARY AND CONCLUSIONS ............................................................................................................................................35
7.0 RECOMMENDATIONS...............................................................................................................................................................37
8.0 BIBLIOGRAPHY ..........................................................................................................................................................................37
APPENDIX A - THERMAL INSULATION
iv
LIST OF TABLES
PAGE
Table 1 - Basic New Housing Construction Statistics in Late 1900s ......................................................................................................... 6
Table 2 - Age Distribution of Existing U.S. Single-Family Homes (1995) ............................................................................................... 7
Table 3 -Geographic Distribution of U.S. Single-Family Homes by Region (1995) ................................................................................. 7
Table 4 - Recommended Live and Dead Loads .......................................................................................................................................... 8
Table 5 - Presumptive Soil Bearing Values by Time Period .................................................................................................................... 10
Table 6 - Typical Framing Lumber Species by Time Period.................................................................................................................... 16
Table 7 - Typical Lumber Grades by Time Period ................................................................................................................................... 17
Table 8 - Early Engineering Data for Structural Timbers......................................................................................................................... 18
Table 9 - Allowable Stresses for Structural Timbers ................................................................................................................................ 20
Table 10 - Allowable Unit Stresses for Structural Lumber and Timber ................................................................................................... 21
Table 11 - Early Data on Wood Specific Gravity..................................................................................................................................... 22
Table 12 - Maximum Spans for Joists and Rafters ................................................................................................................................... 24
Table 13 - Recommended Framing Above Openings............................................................................................................................... 26
Table 14 - Early Shear Wall Test Data ..................................................................................................................................................... 28
Table 15 - Early Shear Wall Test Data For 9’ X 14’ Walls With Openings ............................................................................................ 29
Table 16 - Ultimate Shear Values for Typical Modern Wall Constructions ............................................................................................ 30
Table 17 - Interior Wall Amounts............................................................................................................................................................. 31
v

LIST OF FIGURES
PAGE
Figure 1. Profile Home in 1900 (2 story).................................................................................................................................................... 3
Figure 2. Profile Home in 1950 (upper 1/2 story optional). ....................................................................................................................... 4
Figure 3. Profile Home in 2000 (2 story).................................................................................................................................................... 5
Figure 4. Braced Framing Pre-1900.......................................................................................................................................................... 11
Figure 5. Balloon Framing Technique in Early 1900s.............................................................................................................................. 11
Figure 6. Platform Framing....................................................................................................................................................................... 14
vi

INTRODUCTION
Americans have greater access to better housing today than ever before. While modern housing may be considered to be better than in the past, the process of improving housing value should include periodic evaluation to confirm past successes, consider the ramifications of past decisions, and foster future advancement in the interest of even better housing value.
This paper examines the evolvement of U.S. housing construction during the 20th century. Of particular interest are changes in construction practices associated with the materials and methods used in home building that affect structural performance. The purpose is to benchmark housing structural characteristics (as implied by historic practice), to identify significant changes that have occurred, and to provide an objective resource for discussion and evaluation of structural design implications. Other related interests, such as construction quality, are also considered.
Home building has always been rooted in practical applications of basic technology. Therefore, this study attempts to align the practical aspects of home building and its history with relevant technical data on structural performance. When available, statistics are cited with respect to housing styles, size, materials, and relevant structural aspects. Where reliable statistical data is unavailable, selected documents that define typical practices are used to arrive at reasonable historic profiles of housing construction and structural characteristics. To a limited degree, personal interviews of home builders with experience dating as far back as 1917 were conducted to compare with information found in the literature.
The study focuses on structural aspects of housing construction and breaks them into three periods of time: early 1900s, mid-1900s, and late 1900s. While it is recognized that change usually occurs slowly and that practices vary regionally, an attempt is made to typify relevant housing construction data and practices in each period. The following sections address:
• General Housing Characteristics, • Design Loads, • Foundation Construction, • Wood-Frame Construction, and • Construction Quality.
Additional information on thermal insulation materials and methods are reported in Appendix A as a matter of special interest.
1

1.0 GENERAL HOUSING CHARACTERISTICS
Based on U.S. Census data, the Builder Practices Survey, Housing at the Millenium: Facts, Figures, and Trends, and other sources (see Bibliography), a synopsis of American housing in the 20th century may be constructed for each of the following periods:
1.1 EARLY 1900S
The following characteristics describe a typical home and the housing market in 1900:
Population: 76 million (40 percent urban, 60 percent rural)Median family income: $490New home price: average unknown1
Type of purchase: typically cashOwnership rate: 46 percentTotal housing units: 16 millionNumber of annual housing starts: 189,000 (65 percent single-family)Average size (starts only): less than 1,000 sq. ft.Stories: One to two storiesBedrooms: 2 to 3Bathrooms: 0 or 1
The front elevation and floor plan of a typical home produced in 1900 is shown in Figure 1. Good examples of traditional housing styles and architectural plans in the early 1900s are found in catalogues produced by Sears, Roebuck and Co., a major producer of traditional American kit homes from about 1910 into the early 1930s (see Bibliography). Likewise, it should be recognized that a large portion of the public lived in rural areas that were not subject to municipal building codes, and housing needs were likely fulfilled in a variety of ways that may not be well documented in the popular literature on housing construction. For example, in Cotton Field's No More it is stated that "more than half of the farmers lived in one- and two-room shacks that had not been whitewashed or painted for many years, if ever. Many of these houses had holes in the roof, wall, and floor." Further, U.S. Census data for 1900 reports that the value of land and buildings per farm in eleven Southern states ranged from $600 to $2,000. By contrast, the values for Indiana and Kansas were $6,550 and $3,718, respectively. Thus, living conditions and housing varied widely in the early 1900s.
1Based on Housing at the Millenium: Facts, Figures, and Trends, the average new home cost was less than $5,000. However, this estimate is potentially skewed in that many people could not afford a "house" of the nature considered in the study. Based on Sears, Roebuck, and Co. catalogue prices at the turn of the century, a typical house cost may have ranged from $1,000 to $2,000, including land.
2
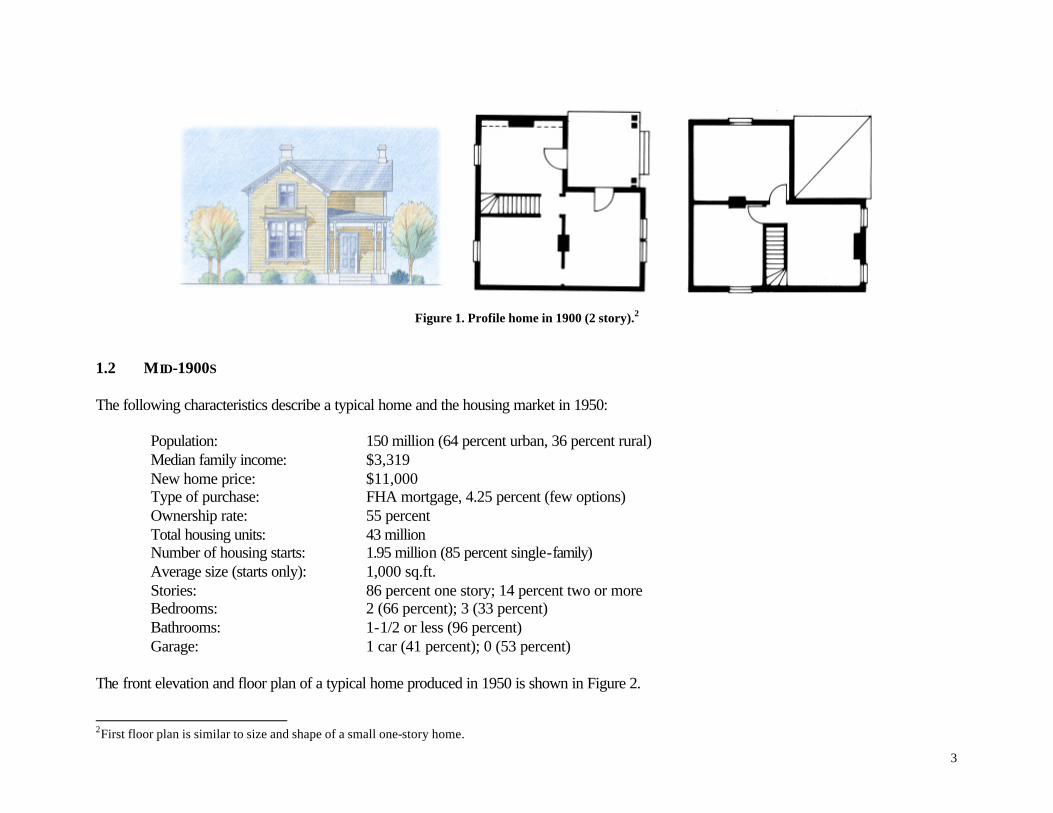
Figure 1. Profile home in 1900 (2 story).2
1.2 MID-1900S
The following characteristics describe a typical home and the housing market in 1950:
Population:Median family income:New home price:Type of purchase:Ownership rate:Total housing units:Number of housing starts:Average size (starts only):Stories:Bedrooms:Bathrooms:Garage:
150 million (64 percent urban, 36 percent rural)$3,319$11,000FHA mortgage, 4.25 percent (few options)55 percent43 million1.95 million (85 percent single-family)1,000 sq.ft.86 percent one story; 14 percent two or more2 (66 percent); 3 (33 percent)1-1/2 or less (96 percent)1 car (41 percent); 0 (53 percent)
The front elevation and floor plan of a typical home produced in 1950 is shown in Figure 2.
2First floor plan is similar to size and shape of a small one-story home.
3

By the mid-1900s, the use of standardized products, materials, and methods of constructing homes had become fairly mature. In particular, lumber grading and sizes had become essentially uniform across the country. Much of the standardization in home building may be attributed to the Federal Housing Administration (current day Department of Housing and Urban Development) with its Minimum Property Requirements (MPRs) which were applied across the country following WWII, and which were eventually superceded by a first edition of the Minimum Property Standards (MPS) in 1958. At this point, the older “rules-of-thumb” were giving way to prescriptive construction requirements (e.g., span tables, construction specifications, etc.) that were based on practical as well as basic technical (engineering) criteria. Newer materials such as plywood sheathing were addressed as well as standard construction details. This document was, in the opinion of the author, one of the best organized, instructive, and comprehensive building standards developed in the United States.
Figure 2. Profile home in 1950 (upper 1/2 story optional).
4
1.3 LATE 1900S
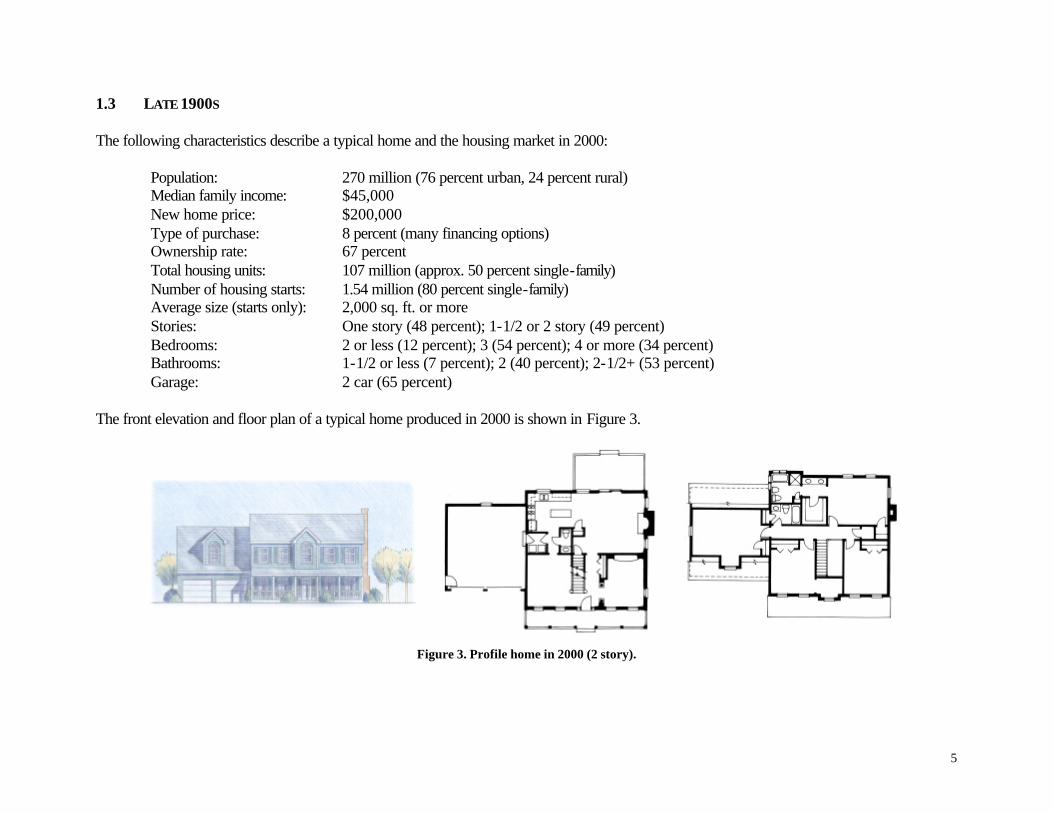
The following characteristics describe a typical home and the housing market in 2000:
Population:Median family income:New home price:Type of purchase:Ownership rate:Total housing units:Number of housing starts:Average size (starts only):Stories:Bedrooms:Bathrooms:Garage:
270 million (76 percent urban, 24 percent rural)$45,000$200,0008 percent (many financing options)67 percent107 million (approx. 50 percent single-family)1.54 million (80 percent single-family)2,000 sq. ft. or moreOne story (48 percent); 1-1/2 or 2 story (49 percent)2 or less (12 percent); 3 (54 percent); 4 or more (34 percent)1-1/2 or less (7 percent); 2 (40 percent); 2-1/2+ (53 percent)2 car (65 percent)
The front elevation and floor plan of a typical home produced in 2000 is shown in Figure 3.
Figure 3. Profile home in 2000 (2 story).
5
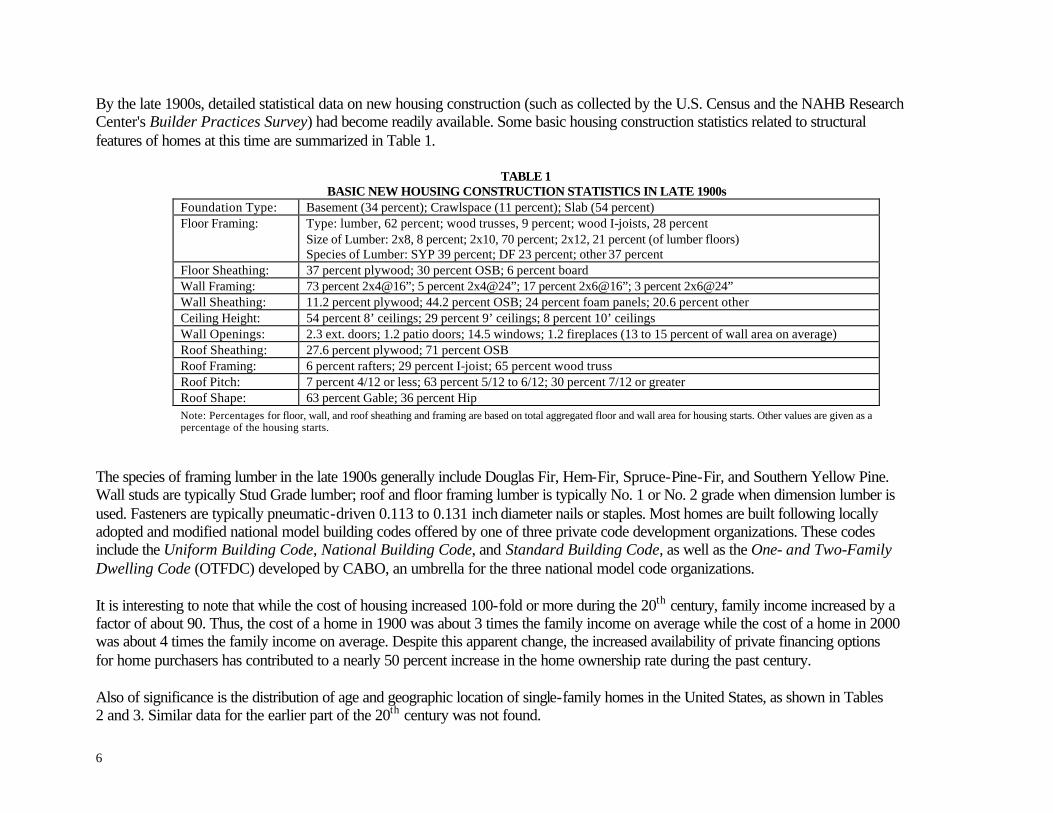
By the late 1900s, detailed statistical data on new housing construction (such as collected by the U.S. Census and the NAHB Research Center's Builder Practices Survey) had become readily available. Some basic housing construction statistics related to structural features of homes at this time are summarized in Table 1.
TABLE 1BASIC NEW HOUSING CONSTRUCTION STATISTICS IN LATE 1900s
Foundation Type: Basement (34 percent); Crawlspace (11 percent); Slab (54 percent) Floor Framing: Type: lumber, 62 percent; wood trusses, 9 percent; wood I-joists, 28 percent
Size of Lumber: 2x8, 8 percent; 2x10, 70 percent; 2x12, 21 percent (of lumber floors) Species of Lumber: SYP 39 percent; DF 23 percent; other 37 percent
Floor Sheathing: 37 percent plywood; 30 percent OSB; 6 percent board Wall Framing: 73 percent 2x4@16”; 5 percent 2x4@24”; 17 percent 2x6@16”; 3 percent 2x6@24” Wall Sheathing: 11.2 percent plywood; 44.2 percent OSB; 24 percent foam panels; 20.6 percent other Ceiling Height: 54 percent 8’ ceilings; 29 percent 9’ ceilings; 8 percent 10’ ceilings Wall Openings: 2.3 ext. doors; 1.2 patio doors; 14.5 windows; 1.2 fireplaces (13 to 15 percent of wall area on average) Roof Sheathing: 27.6 percent plywood; 71 percent OSB Roof Framing: 6 percent rafters; 29 percent I-joist; 65 percent wood truss Roof Pitch: 7 percent 4/12 or less; 63 percent 5/12 to 6/12; 30 percent 7/12 or greater Roof Shape: 63 percent Gable; 36 percent Hip Note: Percentages for floor, wall, and roof sheathing and framing are based on total aggregated floor and wall area for housing starts. Other values are given as a percentage of the housing starts.
The species of framing lumber in the late 1900s generally include Douglas Fir, Hem-Fir, Spruce-Pine-Fir, and Southern Yellow Pine. Wall studs are typically Stud Grade lumber; roof and floor framing lumber is typically No. 1 or No. 2 grade when dimension lumber is used. Fasteners are typically pneumatic-driven 0.113 to 0.131 inch diameter nails or staples. Most homes are built following locally adopted and modified national model building codes offered by one of three private code development organizations. These codes include the Uniform Building Code, National Building Code, and Standard Building Code, as well as the One- and Two-Family Dwelling Code (OTFDC) developed by CABO, an umbrella for the three national model code organizations.
It is interesting to note that while the cost of housing increased 100-fold or more during the 20th century, family income increased by a factor of about 90. Thus, the cost of a home in 1900 was about 3 times the family income on average while the cost of a home in 2000 was about 4 times the family income on average. Despite this apparent change, the increased availability of private financing options for home purchasers has contributed to a nearly 50 percent increase in the home ownership rate during the past century.
Also of significance is the distribution of age and geographic location of single-family homes in the United States, as shown in Tables 2 and 3. Similar data for the earlier part of the 20th century was not found.
6
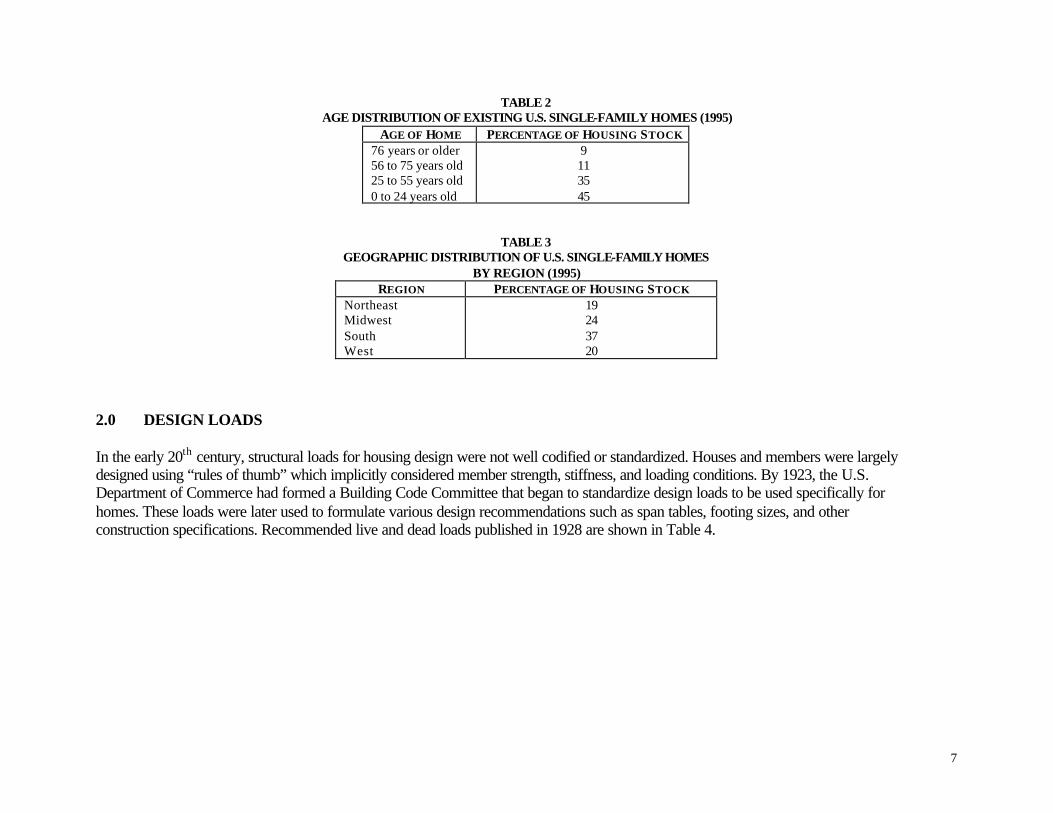
TABLE 2 AGE DISTRIBUTION OF EXISTING U.S. SINGLE-FAMILY HOMES (1995)
AGE OF HOME PERCENTAGE OF HOUSING STOCK
76 years or older 56 to 75 years old 25 to 55 years old 0 to 24 years old
9 11 35 45
TABLE 3GEOGRAPHIC DISTRIBUTION OF U.S. SINGLE-FAMILY HOMES
BY REGION (1995)REGION PERCENTAGE OF HOUSING STOCK
Northeast Midwest South West
19 24 37 20
2.0 DESIGN LOADS
In the early 20th century, structural loads for housing design were not well codified or standardized. Houses and members were largely designed using “rules of thumb” which implicitly considered member strength, stiffness, and loading conditions. By 1923, the U.S. Department of Commerce had formed a Building Code Committee that began to standardize design loads to be used specifically for homes. These loads were later used to formulate various design recommendations such as span tables, footing sizes, and other construction specifications. Recommended live and dead loads published in 1928 are shown in Table 4.
7

TABLE 4RECOMMENDED LIVE AND DEAD LOADS
[U. S. Department of Commerce, 1928]CONDITION POUNDS PER SQUARE FO O T
Live load, all floors used for living purposes Live load for attic (used for light storage only) Dead weight for average double floor and joists, but without plaster Dead weight of plaster ceiling, including joists on light unfloored attics Roof of light construction, including both live and dead loads Roof of medium construction with light slate or asbestos roofing, including both live and dead loads Roof of heavy construction with heavy slate or tile roofing, including both live and dead loads
40 20 10 10 20 30 40
It is interesting to note that the relationship of live load magnitude to influence area (tributary area) was recognized by the U.S. Department of Commerce at this early time in a rudimentary fashion:
“Although a live load of 40 pounds per square foot should be used in selecting all [individual] floor joists, such a load will not occur over a large floor area at the same time. The larger the area, the less chance there is of its being heavily loaded all over. In fact, the building Code Committee of the Department of Commerce, in 1923, after careful investigation, recommended that, in computing the load on girders carrying floors more than 200 square feet in area, a live load of 30 pounds per square foot be used.”
This practical consideration of influence area for dwelling design was subsequently lost in the development of building codes later in the 20th century. Most modern codes do allow a floor live load of 30 psf to be used for bedroom areas; however, this is a separate issue from that of influence area on design live loads.
At the turn of the century, cities that had comprehensive building laws generally specified dwelling floor live loads ranging from 40 to 70 psf. Specified roof loads ranged from 25 to 50 psf depending on the degree that dead, live, and snow loads were included in the values. Snow load reductions based on simple relations to roof slope were sometimes recognized. Wind loads, where specified, ranged from 10 to 30 psf with 20 psf being most common. However, wind loads did not find explicit consideration in housing design until later in the 1900s, even though they were noted throughout the century. For most of the 20th century, it appears that wind loads, when considered, usually used a simple uniform load to be applied to vertical and horizontal projected building surfaces.
In addition, there appears to have been considerable variation in how loads were applied and analyzed. For example, rafter selections were recommended by using horizontal joist span tables produced in the 1930s. Thus, it is unclear as to how various loads were factored into the design of roofs until later in the 20th century when span tables specifically for rafter design considered roof live, dead,
8
and snow loads explicitly. In some cases the actual rafter sloped span was used and wind loads were accounted. However, a lack of standard procedure for analyzing sloped rafters has remained to this day.
By the mid-1900s, the National Bureau of Standards had produced a document titled Minimum Design Loads in Buildings and Other Structures (ASA A58.1-1955). In this document, the design floor live load for apartments and first floors of dwellings was set at 40 psf; second floors and habitable attics at 30 psf; and uninhabitable attics at 20 psf.
Throughout the later half of the 1900s, building codes varied in the requirements for building design loads. However, by the end of the century, the major model building codes began to standardize load requirements into a single format with uniform requirements, in most cases based on the American Society of Civil Engineer’s standard ASCE 7-98, Minimum Design Loads for Buildings and Other Structures (drawn from a later edition of the National Bureau of Standards document ASA A58.1-55).
3.0 FOUNDATION CONSTRUCTION
Foundation construction at the beginning of the 1900s differed significantly from that used by the end of the century. Residential foundations in the early 1900s rarely had separate spread footings; the first course of masonry was often laid directly on subgrade. The following relevant quote was found in Structural Analysis of Historic Buildings:
“Portland concrete and reinforced spread footings began to appear at about the turn of the century. They were obviously used sparingly at the beginning, as in the application of any new technology."
When readily available, it is also found that many homes before 1900 used stone masonry for foundation walls or piers, with or without some type of mortar. Special consideration to foundations and soil support was only given to very unique structures or soil conditions. If engineered, building foundation bearing pressures were usually designed with “appropriate dead and live loads” at the beginning of the 20th century. Even then, the techniques were quite arbitrary and relied heavily on experience and judgment of the designer. Most building designs, at best, were based on a manual probing of the soil and reliance on local practice and/or past performance of nearby building foundations.
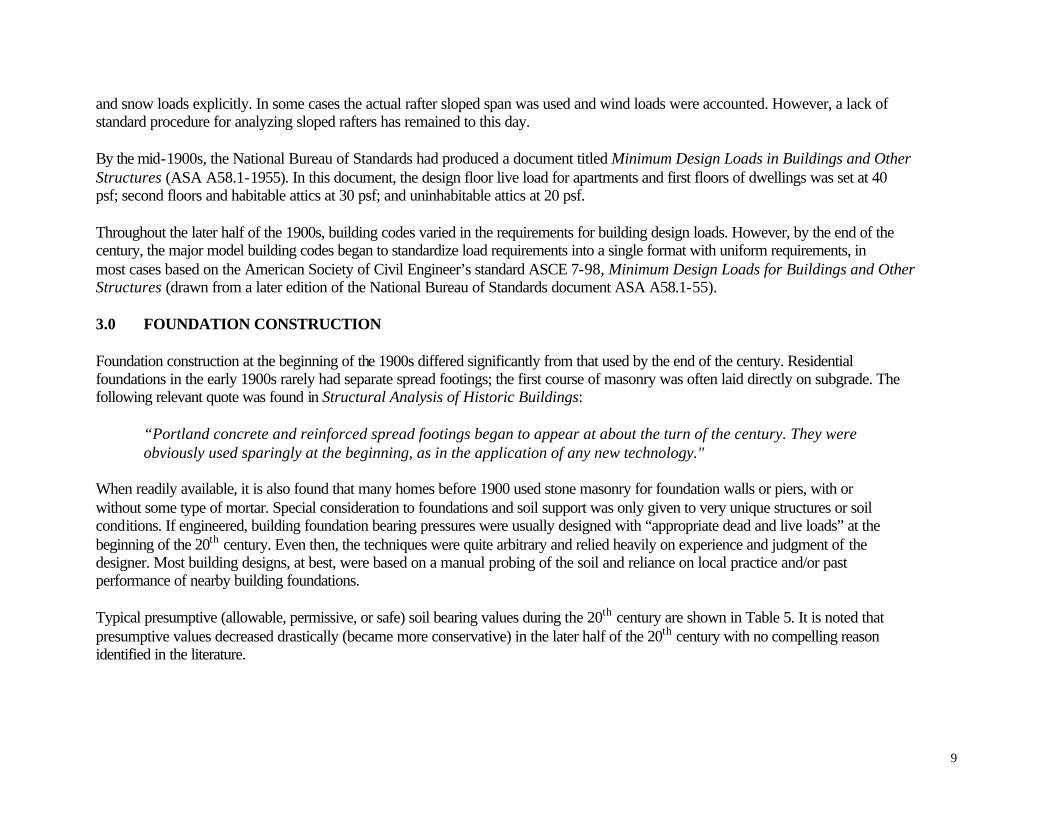
Typical presumptive (allowable, permissive, or safe) soil bearing values during the 20th century are shown in Table 5. It is noted that presumptive values decreased drastically (became more conservative) in the later half of the 20th century with no compelling reason identified in the literature.
9
TABLE 5PRESUMPTIVE SOIL BEARING VALUES BY TIME PERIOD
(pounds per square foot)EARLY 1900S MID-1900S LATE-1900S
Soft/Wet Clay or Sand or Loam (2,000) Firm Earth (2,500 to 3,500) Ordinary Clay/Sand Mix and Sand (4,000) Hard Clay and Firm Course Sand (8,000) Firm Gravel/Sand Mix (12,000) Shale Rock (16,000) Hard Rock (40,000)
Soft Clay (2,000) Firm Clay and Sand/Clay Mix (4,000) Fine dry sand (6,000) Coarse Sand (8,000) Gravel (12,000) Soft Rock (16,000) Hard Rock (80,000)
Clay, Sandy Clay, Silty Clay, and clayey silt (1,000) Sand, silty sand, clayey sand, silty gravel, and clayey gravel (1,500) Sandy gravel and/or gravel (2,000) Sedimentary and foliated rock (2,000) Massive crystalline bedrock (4,000)
By the mid-1900s and throughout the remainder of the century, the use of concrete footings and masonry (block) or concrete walls had become common practice. The introduction of separate spread footings is not well understood, as few documents used in this study spoke directly to this issue. Perhaps, newer wall construction methods and materials allowed the use of thinner foundation walls which brought about concern with bearing area on the foundation soil. Perhaps a greater concern or lower tolerance for settlement and cracking of foundation walls developed over time, as expectations for use of basements increased over the course of the century. Certainly, basement wall cracks are a major source of homeowner complaints or claims in modern homes; however, it does not appear that this was such a concern earlier in the century. Data on modern foundation construction types is reported in Table 1.
4.0 WOOD-FRAME CONSTRUCTION
Prior to the 1900s some significant changes in basic framing practices in the United Sates were set in motion. Up through most of the 19th century, homes were built following traditional timber construction known as braced framing adopted from England (see Figure 4). In this manner, homes used heavy squared timber frames and beams with diagonal bracing of 4x or larger timbers. Wood joinery methods were used for heavy connections rather than steel fasteners. Intermediate framing members of smaller dimension were used within the structural frame to provide for attachment of finish materials.
In the mid-1800s a new construction method, known as balloon framing, began to be used in the United States. This method used repetitive light framing members, generally 2x4s, made available by the proliferation of sawmills. By the start of the 20th century, balloon framing had practically replaced the traditional heavy braced framing technique. The balloon framing technique is illustrated in Figure 5. In some cases, vestiges of early practices�such as the use of 4x corner posts, beams, and sill framing members�existed well into the 20th century in combination with balloon framing. Balloon framing persisted until after World War II in some parts of the country.
10

Figure 4. Braced Framing pre-1900. Figure 5. Balloon Framing Technique in Early 1900s.
11
Variations in application of the balloon framing method also recognized trade-offs between economy and performance. For example, Sears, Roebuck and Co., produced two types of pre-cut structural framing systems: one using the “honor-built” system and the other using the “standard-built” system. In advertising the “honor-built” system, the following features were highlighted:
• Rafters, 2x6 or 2x4 inches (larger where needed), 14-3/8 inches apart (16 inches on center). • Double plates over doors and windows (as headers and trim nailing base). • Double studdings at sides of doors and windows (as jamb support and trim nailing base). • Three studs at corners. • High grade horizontal wood sheathing boards, 13/16 inch thick with tarred felt overlay between sheathing and wood siding. • Double floors with heavy building paper between the subfloor and finished floor • 2x8 inch joists, or 2x10 where needed, 14-3/8 inches apart (16 inches on center). • Studdings, 2x4 inches, 14-3/8 inches apart (16 inches on center), double plate at top and single at bottom of wall, ceiling height
of typically 8 feet-2 inches to 9 feet for above grade stories and as low as 7 feet for basements. • High quality framing lumber (virgin growth, dense grain, from the Pacific Northwest, Douglas-Fir and Hemlock) specially
sorted, stored, and dried at Sears lumber yards. • Common wire nails of sufficient quantity and variety of sizes. • Genuine cypress window and door casings (exterior trim), 1-1/8 inches thick, naturally weather resistant. • 3 coats of guaranteed paint on outside.
The “standard-built” construction was advertised (at the back of the 1928 Sears catalogue) as the “most house per dollar invested” for smaller homes of 1 to 1-1/2 stories. The largest home of this type had four rooms within a 24 feet by 36 feet plan. The following are key specifications of Sears’ “standard-built” homes:
• Rafters, 2x4 inches, 22-3/8 inches apart (24 inches on center); 2x4 ceiling joists at 16 inches on center (for interior finish). • Single plates over doors and windows (no headers or trim nailing base). • Single studdings at sides of doors and windows. • Two studs at corners. • No wood sheathing (only exterior wood siding of 1x6). • No sub-floor (finish flooring applied direct to joists). • Tarred felt under floors and siding. • 2x8 inch joists placed 22-3/8 inches apart (24 inches on center), spans generally not exceeding 12 feet. • Studdings, 2x4 inches, 14-3/8 inches apart (16 inches on center), double plate at top and single at bottom of wall; ceiling
heights typically 8 feet-3 inches.
12
• Framing lumber for walls, floors, and roofs uses No. 1 Douglas Fir or Pacific Coast Hemlock (non-Sears standard construction is noted to use lower quality or No. 2 and No. 3 lumber and species such as Tamarak or White Pine).
• Common wire nails of sufficient quantity and variety of sizes. • Cypress exterior trim. • All outside paint, two coats.
Sears also advertised cottage style or portable homes with 2x2 No. 1 yellow pine wall framing, 2x3 roof rafters, and post foundations. The largest size had three rooms with overall plan dimensions of 20 feet by 16 feet, plus a 5 foot covered porch. Sears noted that their "standard-built" homes incorporated some improvements over the common practice of that time, such as the use of three-stud corners and doubled 2x4 members at window and door openings for improved finish attachment. It is unknown how many homes of each type were sold by Sears, Roebuck and Co. But, the catalogues give clear evidence that at least two to three distinctly different levels of dwelling construction were recognized in the early 1900s as a matter of economy verses quality.
By the mid-1900s and during the housing “boom” following WWII, the preferred framing practice had evolved to platform framing, a further refinement of balloon framing. Platform framing is shown in Figure 6. This change was driven by economy and practicality. For example, balloon framing required the use of long wall framing members (studs) which were more expensive and less available. Also, balloon framing required fire blocking between wall framing at story levels to comply with modern building codes (initiated in the 1920s). In contrast, platform framing is inherently fire blocked by the use of horizontal wall plates at the top and bottom of each story. In addition, the balloon frame approach was essentially limited to “regular” two-story construction and did not readily allow for newer housing styles that featured story offsets (i.e., floor overhangs) and other “irregularities” in design. Finally, the platform framing technique provides a solid and safe work platform from which to stage construction for upper stories. Platform framing has dominated the housing market since the mid-1900s with a few refinements as follows:
• unnecessary use of bridging between studs and floor joists was eliminated; • panel products have replaced the use of boards for wall, floor, and roof sheathing; • wall sheathing no longer laps over the floor perimeter (except in some isolated high wind locales); and • foundation sill members are anchored to the foundation.
13

Throughout the 20th century, 16 inch on center framing has remained the dominant choice. Interestingly, this practice has been associated with an early concern to provide adequate support for finish materials (i.e., exterior wood siding or sheathing and, particularly, interior lath and plaster finishes). On the other hand, spacing of roof framing members has largely increased from 16 inch on center (early to mid-1900s) to 24 inches on center in the late 1900s. This change is associated with the inception and later dominance of wood roof trusses in the second half of the 20th
Century. However, 16 inch on center roof framing still finds limited use today, particularly in complicated roof designs that necessitate rafter framing.
It should be noted that 24 inch on center wall framing has been used throughout the 20th century in at least a small portion of housing construction for reasons of economy and, more recently, for its additional benefits of improved energy efficiency and resource conservation. Changes to panel forms of exterior and interior sheathing materials (including the use of plywood and OSB sheathing panels and gypsum wallboard, as opposed to boards or lath and plaster) have perhaps contributed to a greater use of 24 inch on center framing today than in the early 20th
century. Still, 24 inch on center framing is generally used in less than 10 percent of wall area in modern residential construction annually.
Floor construction has also seen some use of alternate spacings such as 19.2 inch and 24 inch. In recent years, increased use of
Figure 6. Platform Framing. wider spacing for floor framing members may be associated with increased use of engineered wood products such as parallel chord
Note: Platform framing in Figure 6 is representative of early platform framing. Platform framing in the mid- to late-1900s used panel products in lieu of board sheathing and bridging
wood trusses and wood I-joists. in floors and walls was eliminated.
14
4.1 WOOD MATERIALS
4.1.1 Size
Significant changes to sizes of dimension lumber used in balloon framing occurred in the early 1900s. At first, members where often rough sawn (or perhaps only surfaced on two sides) and available in actual (approximate) 2 inch thickness and depths of 4, 6, 8, 10, 12, and even 14 inches. Later, ostensibly to account for surfacing and shrinkage, finished lumber sizes were reduced to 1-3/4 inch thickness with actual depths of 1/4 inch scant of nominal for members up to 4-inch depth and 1/2-inch scant for members over 4-inch depth. Still later, the thickness was reduced to 1-5/8 inch (as in the Sears homes of 1928) and the depth was reduced to 3-5/8, 5-5/8, 7-1/2, 9-1/2, etc. Finally, in the mid-1900s, lumber dimensions were reduced to the standard sizes that are in use today. The nominal size vs. actual size in current use are as follows: 2x4 (1.5 in by 3.5 in), 2x6 (1.5 in by 5.5 inch), 2x8 (1.5 in by 7.25 in), 2x10 (1.5 in by 9.25 in), and 2x12 (1.5 in by 11.25 in).
4.1.2 Type/Species
Over the 20th century, supply and demand has dictated numerous changes in forestry and availability of wood materials in the United States. At the beginning of the 20th century, virgin growth lumber (also known as old growth) was commonly used. As resources of virgin growth lumber diminished, first in the east and then in the west, use of managed forests became more common and practically essential by the mid- to late-1900s. Wood species typically used for framing lumber in residential construction are shown in Table 6 by time period. As seen in the early 1900s many local species were used. However, Sears boasted in being able to ship the best available Douglas Fir and Pacific Coast Hemlock for their framing lumber. By the late 1900s, wood species were organized into 'species groups' each including several species with similar properties.
15
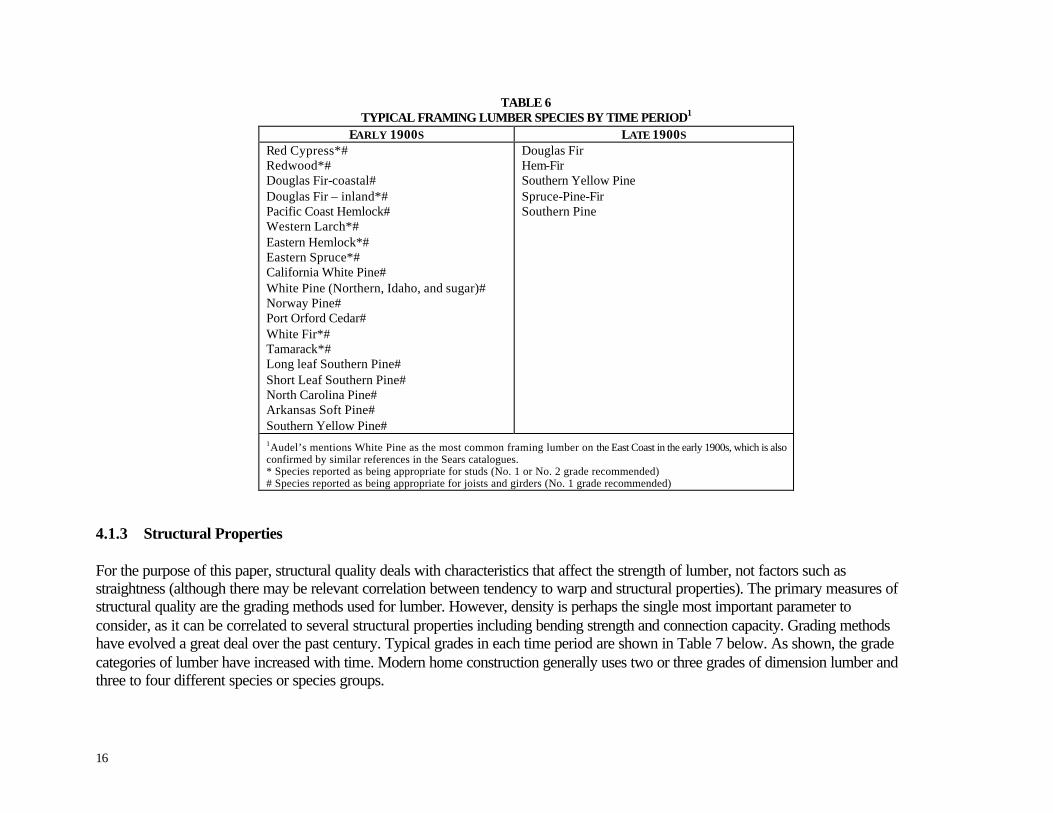
TABLE 6 TYPICAL FRAMING LUMBER SPECIES BY TIME PERIOD1
EARLY 1900S LATE 1900S
Red Cypress*# Redwood*# Douglas Fir-coastal# Douglas Fir – inland*# Pacific Coast Hemlock# Western Larch*# Eastern Hemlock*# Eastern Spruce*# California White Pine# White Pine (Northern, Idaho, and sugar)# Norway Pine# Port Orford Cedar# White Fir*# Tamarack*# Long leaf Southern Pine# Short Leaf Southern Pine# North Carolina Pine# Arkansas Soft Pine# Southern Yellow Pine#
Douglas Fir Hem-Fir Southern Yellow Pine Spruce-Pine-Fir Southern Pine
1Audel’s mentions White Pine as the most common framing lumber on the East Coast in the early 1900s, which is also confirmed by similar references in the Sears catalogues. * Species reported as being appropriate for studs (No. 1 or No. 2 grade recommended) # Species reported as being appropriate for joists and girders (No. 1 grade recommended)
4.1.3 Structural Properties
For the purpose of this paper, structural quality deals with characteristics that affect the strength of lumber, not factors such as straightness (although there may be relevant correlation between tendency to warp and structural properties). The primary measures of structural quality are the grading methods used for lumber. However, density is perhaps the single most important parameter to consider, as it can be correlated to several structural properties including bending strength and connection capacity. Grading methods have evolved a great deal over the past century. Typical grades in each time period are shown in Table 7 below. As shown, the grade categories of lumber have increased with time. Modern home construction generally uses two or three grades of dimension lumber and three to four different species or species groups.
16
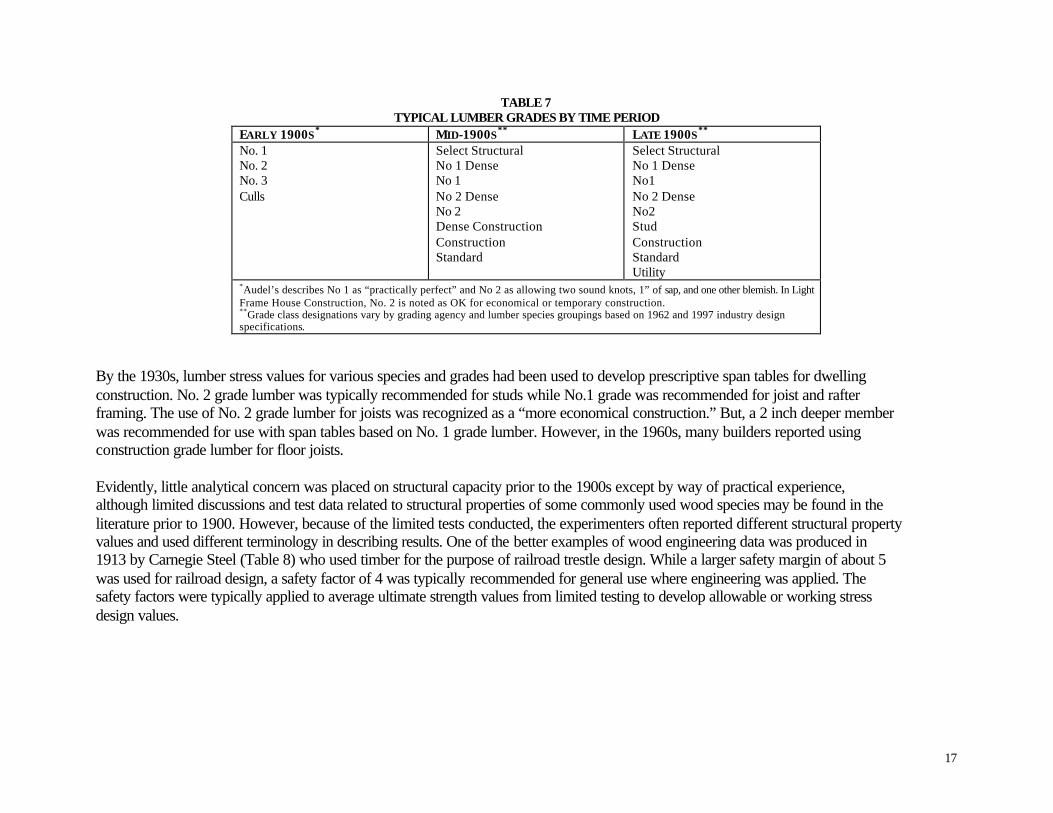
TABLE 7 TYPICAL LUMBER GRADES BY TIME PERIOD
EARLY 1900S * MID-1900S ** LATE 1900S **
No. 1 No. 2 No. 3 Culls
Select Structural No 1 Dense No 1 No 2 Dense No 2 Dense Construction Construction Standard
Select Structural No 1 Dense No1 No 2 Dense No2 Stud Construction Standard Utility
*Audel’s describes No 1 as “practically perfect” and No 2 as allowing two sound knots, 1” of sap, and one other blemish. In Light Frame House Construction, No. 2 is noted as OK for economical or temporary construction.**Grade class designations vary by grading agency and lumber species groupings based on 1962 and 1997 industry design specifications.
By the 1930s, lumber stress values for various species and grades had been used to develop prescriptive span tables for dwelling construction. No. 2 grade lumber was typically recommended for studs while No.1 grade was recommended for joist and rafter framing. The use of No. 2 grade lumber for joists was recognized as a “more economical construction.” But, a 2 inch deeper member was recommended for use with span tables based on No. 1 grade lumber. However, in the 1960s, many builders reported using construction grade lumber for floor joists.
Evidently, little analytical concern was placed on structural capacity prior to the 1900s except by way of practical experience, although limited discussions and test data related to structural properties of some commonly used wood species may be found in the literature prior to 1900. However, because of the limited tests conducted, the experimenters often reported different structural property values and used different terminology in describing results. One of the better examples of wood engineering data was produced in 1913 by Carnegie Steel (Table 8) who used timber for the purpose of railroad trestle design. While a larger safety margin of about 5 was used for railroad design, a safety factor of 4 was typically recommended for general use where engineering was applied. The safety factors were typically applied to average ultimate strength values from limited testing to develop allowable or working stress design values.
17

TABLE 8EARLY ENGINEERING DATA FOR STRUCTURAL TIMBERS
(Carnegie Steel Co., 1913)UNIT S TRESSES (psi)
Kind of Timber Bending Shearing Compression Extreme
Fiber Stress Modulus of Elasticity
Parallel to the Grain
Longitudinal Shear in Beam
Perpendicular to the Grain
Parallel to the Grain
Working Stresses for Columns
Average Ultimate
Working Stress
Average Average Ultimate
Working Stress
Average Ultimate
Working Stress
Elastic Limit
Working Stress
Average Ultimate
Working Stress
Length under 15 x d
Length over 15 x d
Douglas fir Longleaf pine Sh ortleaf pine White pine Spruce Norway pine Tamarack Western hemlock Redwood Bald Cypress Red Cedar White Oak
6,100 6,500 5,600 4,400 4,800 4,200 4,600 5,800 5,000 4,800 4,200 5,700
1,200 1,300 1,100 900 1,000 800 900 1,100 900 900 800 1,100
1,510,000 1,610,000 1,480,000 1,130,000 1,310,000 1,190,000 1,220,000 1,480,000 800,000 1,150,000 800,000 1,150,000
690 720 710 400 600 590 670 630 300 500
840
170 180 170 100 150 130 170 160 80 120
210
270 300 330 180 170 250 260 270
270
110 120 130 70 70 100 100 100
110
630 520 340 290 370
440 400 340 470 920
310 260 170 150 180 150 220 220 150 170 230 450
3,600 3,800 3,400 3,000 3,200 2,600 3,200 3,500 3,300 3,900 2,800 3,500
1,200 1,300 1,100 1,000 1,100 800 1,000 1,200 900 1,100 900 1,300
900 975 825 750 825 600 750 900 675 825 675 975
1,200(1-l/60d) 1,300(1-l/60d) 1,100(1-l/60d) 1,000(1-l/60d) 1,100(1-l/60d) 800(1-l/60d)
1,000(1-l/60d) 1,200(1-l/60d) 900(1-l/60d)
1,100(1-l/60d) 900(1-l/60d)
1,300(1-l/60d)
From Carnegie Steel Co. 1913, 310 (as reported in Structural Analysis of Historic Buildings).
As discussed later, many wood members for light building construction were probably sized or designed by intuitive “rules of thumb” passed down through years of experience. For example, there were no records found of engineering calculations or test data in the origins of balloon framing techniques in the mid- to late-1800s. However, this outcome is not to suggest that no structural consideration or verification testing was performed, since “proof testing” has historically been a common practice to validate new construction techniques. For example, modern roof trusses were developed using engineering tests and data in the mid-1900s. Proof testing of actual truss constructions (i.e., stacking weights on a trussed roof) was often done to verify performance to a skeptical audience. In essence, the concept of “seeing is believing” has played a significant role in the adoption of new construction technologies.
In summary, it appears that two methods of wood construction verification were emerging in the United States in the late 1800s and early 1900s. The first relied on experience with constructed systems for specific applications (i.e., balloon framing of buildings). The second and newer method relied on engineering analysis of special structures (i.e., railroad trestles) based on evaluation of stresses on individual members using quantified structural properties of various wood species. By the 1920s, allowable stresses for various species and two grades (No.1 and No.2) of structural timbers had been published (see Table 9). Later in the 1920s and 1930s,
18
allowable stresses for structural lumber and timber for dry uses had been published (see Table 10). The following quotation from Light Frame House Construction describes the use of the data in Table 10 in the 1930s:
“In Table [10] is given a list of various softwoods used for building construction, with allowable unit working stresses for each species and grade. The species in the upper half of the list are manufactured in structural grades as shown. Definite working stresses have been assigned to all these grades by the manufacturers. For the species in the lower half of the table, structural grades are seldom manufactured as such. Nevertheless, timbers from these species, if carefully selected as to influence of defects, may be rated as ‘select structural,’ and timbers of lower grade as ‘common structural.’ The working stresses shown may then be applied.”
It is apparent that the application of grading standards was in its infancy in the 1930s. The common lumber grades (No. 1 and No. 2) were loosely defined in practice and may have varied substantially at the local level of supply. While published bending properties varied by grade and species, they did not differ much according to size of member. Similarly, modulus of elasticity values tended to vary by species, but not by grade.
Early tests of lumber density are not readily found in the available literature. Because of the lack of grading standards at that time, the lack of standard terminology, and the frequent use of locally grown and milled timber, it is difficult to determine the range of lumber densities typifying residential and other building construction earlier in the 1900s. However, in 1885 the data in Table 11 was reported.
By the 1930s, stress values for many popular wood species, and typically two grades each, were available from lumber grading agencies that followed grading standards. Through the mid- to late-1900s structural data on a wide variety of wood species grew rapidly. By the second half of the 20th century, grading rules and agencies were in full swing, and numerous design values were published in wood industry specifications such as the National Design Specification for Wood Construction and its supplement of wood design values. While dimension lumber dominated the housing market through most of the 20th century, the late 1990s saw a dramatic increase in the use of engineered wood members such as trusses, wood I-joists, and engineered wood panel products (see Table 1).
19
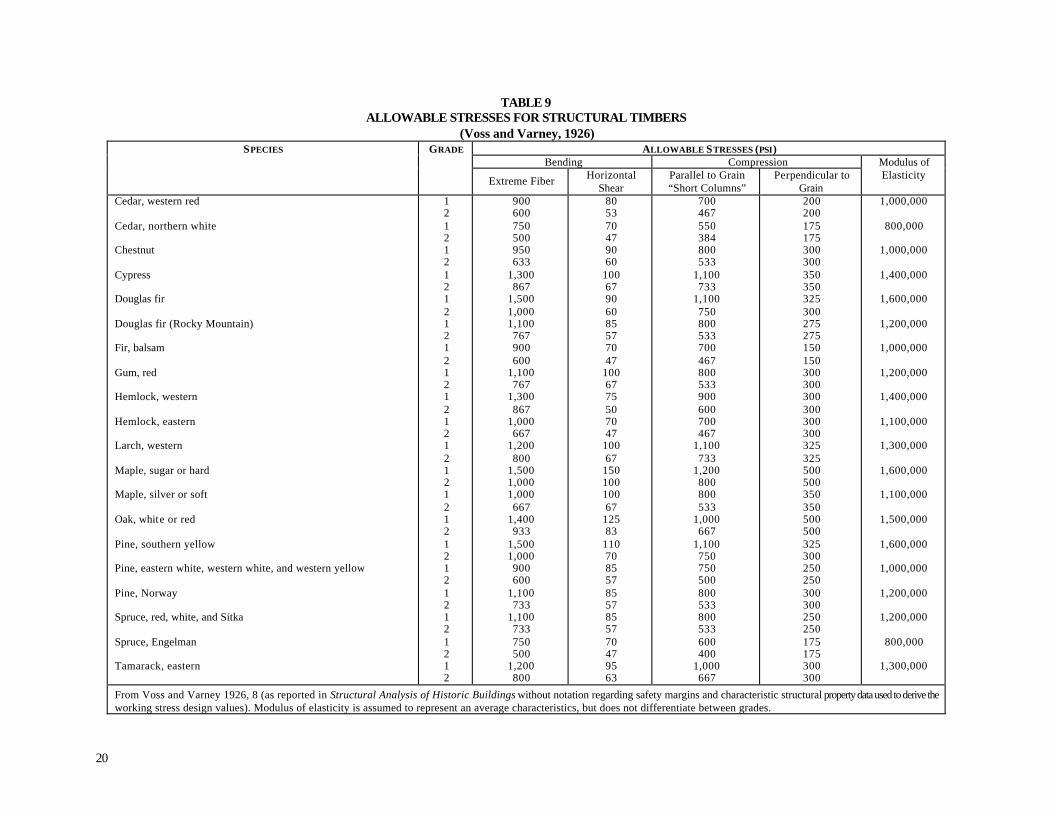
TABLE 9ALLOWABLE STRESSES FOR STRUCTURAL TIMBERS
(Voss and Varney, 1926)S PECIES GRADE ALLOWABLE S TRESSES (PSI )
Bending Compression Modulus of ElasticityExtreme Fiber Horizontal
Shear Parallel to Grain “Short Columns”
Perpendicular to Grain
Cedar, western red
Cedar, northern white
Chestnut
Cypress
Douglas fir
Douglas fir (Rocky Mountain)
Fir, balsam
Gum, red
Hemlock, western
Hemlock, eastern
Larch, western
Maple, sugar or hard
Maple, silver or soft
Oak, whit e or red
Pine, southern yellow
Pine, eastern white, western white, and western yellow
Pine, Norway
Spruce, red, white, and Sitka
Spruce, Engelman
Tamarack, eastern
1 2 1 2 1 2 1 2 1 2 1 2 1 2 1 2 1 2 1 2 1 2 1 2 1 2 1 2 1 2 1 2 1 2 1 2 1 2 1 2
900 600 750 500 950 633
1,300 867
1,500 1,000 1,100 767 900 600
1,100 767
1,300 867
1,000 667
1,200 800
1,500 1,000 1,000 667
1,400 933
1,500 1,000 900 600
1,100 733
1,100 733 750 500
1,200 800
80 53 70 47 90 60
100 67 90 60 85 57 70 47
100 67 75 50 70 47
100 67
150 100 100 67
125 83
110 70 85 57 85 57 85 57 70 47 95 63
700 467 550 384 800 533
1,100 733
1,100 750 800 533 700 467 800 533 900 600 700 467
1,100 733
1,200 800 800 533
1,000 667
1,100 750 750 500 800 533 800 533 600 400
1,000 667
200 200 175 175 300 300 350 350 325 300 275 275 150 150 300 300 300 300 300 300 325 325 500 500 350 350 500 500 325 300 250 250 300 300 250 250 175 175 300 300
1,000,000
800,000
1,000,000
1,400,000
1,600,000
1,200,000
1,000,000
1,200,000
1,400,000
1,100,000
1,300,000
1,600,000
1,100,000
1,500,000
1,600,000
1,000,000
1,200,000
1,200,000
800,000
1,300,000
From Voss and Varney 1926, 8 (as reported in Structural Analysis of Historic Buildings without notation regarding safety margins and characteristic structural property data used to derive the working stress design values). Modulus of elasticity is assumed to represent an average characteristics, but does not differentiate between grades.
20
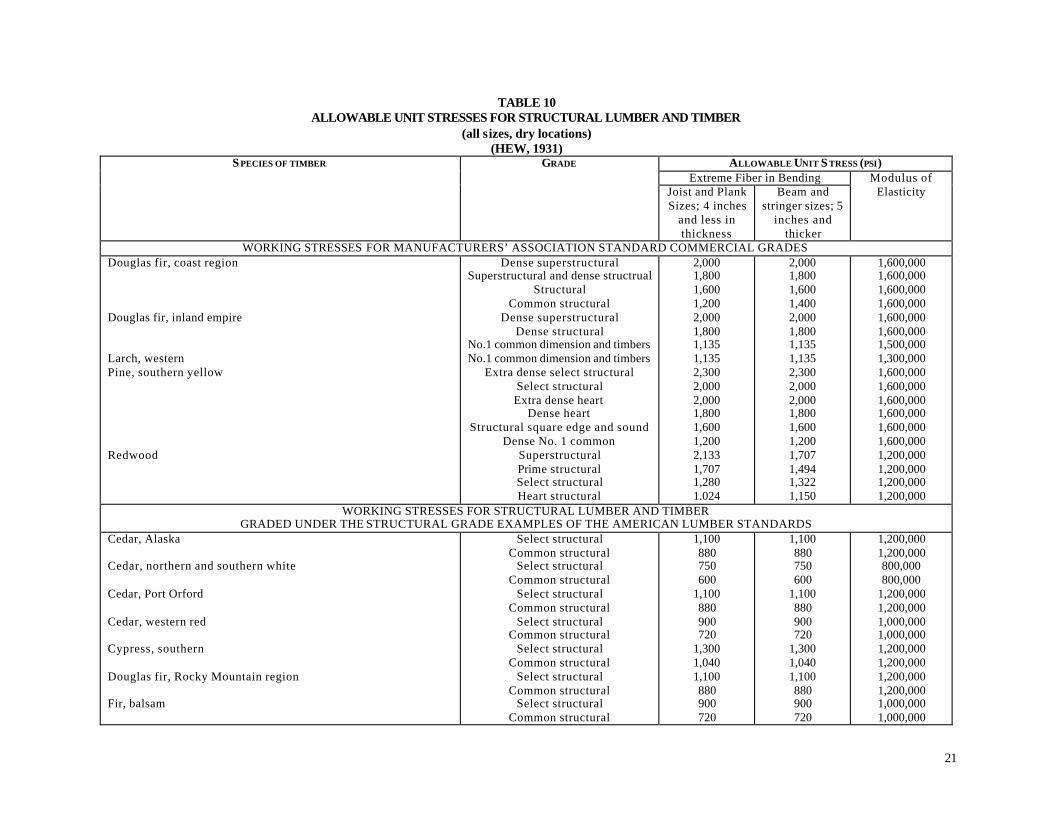
TABLE 10ALLOWABLE UNIT STRESSES FOR STRUCTURAL LUMBER AND TIMBER
(all sizes, dry locations)(HEW, 1931)
S PECIES OF TIMBER GRADE ALLOWABLE UNIT S TRESS (PSI ) Extreme Fiber in Bending Modulus of
ElasticityJoist and Plank Sizes; 4 inches
and less in thickness
Beam and stringer sizes; 5
inches and thicker
WORKING STRESSES FOR MANUFACTURERS’ ASSOCIATION STANDARD COMMERCIAL GRADES Douglas fir, coast region
Douglas fir, inland empire
Larch, western Pine, southern yellow
Redwood
Dense superstructural Superstructural and dense structrual
Structural Common structural
Dense superstructural Dense structural
No.1 common dimension and timbers No.1 common dimension and timbers
Extra dense select structural Select structural Extra dense heart
Dense heart Structural square edge and sound
Dense No. 1 common Superstructural Prime structural Select structural Heart structural
2,000 1,800 1,600 1,200 2,000 1,800 1,135 1,135 2,300 2,000 2,000 1,800 1,600 1,200 2,133 1,707 1,280 1.024
2,000 1,800 1,600 1,400 2,000 1,800 1,135 1,135 2,300 2,000 2,000 1,800 1,600 1,200 1,707 1,494 1,322 1,150
1,600,000 1,600,000 1,600,000 1,600,000 1,600,000 1,600,000 1,500,000 1,300,000 1,600,000 1,600,000 1,600,000 1,600,000 1,600,000 1,600,000 1,200,000 1,200,000 1,200,000 1,200,000
WORKING STRESSES FOR STRUCTURAL LUMBER AND TIMBER GRADED UNDER THE STRUCTURAL GRADE EXAMPLES OF THE AMERICAN LUMBER STANDARDS
Cedar, Alaska
Cedar, northern and southern white
Cedar, Port Orford
Cedar, western red
Cypress, southern
Douglas fir, Rocky Mountain region
Fir, balsam
Select structural Common structural
Select structural Common structural
Select structural Common structural
Select structural Common structural
Select structural Common structural
Select structural Common structural
Select structural Common structural
1,100 880 750 600
1,100 880 900 720
1,300 1,040 1,100 880 900 720
1,100 880 750 600
1,100 880 900 720
1,300 1,040 1,100 880 900 720
1,200,000 1,200,000 800,000 800,000
1,200,000 1,200,000 1,000,000 1,000,000 1,200,000 1,200,000 1,200,000 1,200,000 1,000,000 1,000,000
21

TABLE 10ALLOWABLE UNIT STRESSES FOR STRUCTURAL LUMBER AND TIMBER
(all sizes, dry locations)(HEW, 1931)(continued)
S PECIES OF TIMBER GRADE ALLOWABLE UNIT S TRESS (PSI ) Extreme Fiber in Bending Modulus of
ElasticityJoist and Plank Sizes; 4 inches
and less in thickness
Beam a nd stringer sizes; 5
inches and thicker
WORKING STRESSES FOR STRUCTURAL LUMBER AND TIMBER GRADED UNDER THE STRUCTURAL GRADE EXAMPLES OF THE AMERICAN LUMBER STANDARDS
Fir, golden, Noble, silver, white (commercial white)
Hemlock, eastern
Hemlock, west c oast
Oak, commercial white and red
Pine, California, Idaho, and northern white, lodgepole, Pondosa, sugar
Pine, Norway
Spruce, Englemann
Spruce, red, white, Sitka
Tamarack, eastern
Select structural Common structural
Select structural Common structural
Select structural Common structural
Select structural Common structural
Select structural Common structural
Select structural Common structural
Select structural Common structural
Select structural Common structural
Select structural Common structural
1,100 880
1,100 880
1,300 1,040 1,400 1,120 900 720
1,100 880 750 600
1,100 880
1,200 960
1,100 880
1,100 880
1,300 1,040 1,400 1,120 900 720
1,100 880 750 600
1,100 880
1,200 960
1,100,000 1,100,000 1,100,000 1,100,000 1,400,000 1,400,000 1,500,000 1,500,000 1,000,000 1,000,000 1,200,000 1,000,000 800,000 800,000
1,200,000 1,200,000 1,300,000 1,300,000
Note: The source document (HEW, 1931) did not indicate the margin of safety or characteristic structural property values used to derive the above working stress values. The table values were used to create joist, rafter, and girder span tables in the source document based on a stated extreme fiber working stress.
TABLE 11EARLY DATA ON WOOD SPECIFIC GRAVITY
DESCRIPTION OF WOOD S PECIFIC GRAVITY
White spruce (Canadian) White pine (American) Black spruce (American) Southern pine (American)
0.465 0.455 0.490 0.872
From Mahon 1885, 125 (as reported in Structural Analysis of Historic Buildings).
22
While difficult to quantify, the references used in the study indicate that a general decline in the structural quality of lumber has occurred. This reduction may be related to the increased use of managed growth lumber, which implies the use of younger, faster growing trees. Based on available reports of lumber density and species usage, it is the authors’ judgment that framing (dimension) lumber density has dropped from a typical range of 0.4 to 0.65 earlier in the 20th century to a range of 0.35 to 0.55 by the end of the 20th century – approximately a 10 percent reduction in lumber density. A similar change in the grade quality of lumber may also be inferred. This trend would affect member properties as well as connection properties that are discussed later. While these apparent changes are amply treated in wood engineering specifications and structural property data, the affect on conventional practices suggests the need for re-examination of rules of thumb that are still in use today, particularly with respect to system connections and system performance. On the other hand, it should be noted that many engineered wood products that use laminated veneers and similar methods to create entire members or parts of composite members tend to offset the apparent reduction in dimension lumber quality.
4.2 FLOOR FRAMING
In the early 1900s, floor joists were typically 2x8 with spans in the range of 12 feet to 14 feet spaced on 16 inch centers (though 24 inch on center placement was indicated for “economical floor construction” when a plaster ceiling was not supported by the joists). For spans of more than 14 feet, 2x10s were recommended when No. 1 grade lumber was used or 2x12 if No. 2 lumber was used. (It was generally recommended that joists be 2 inches deeper or 1 inch wider when lower grade material was used.) One early rule of thumb for sizing joists and beams from Audel’s states that “Joists longer than 12 times their width [depth] used without intermediate supports are apt to crack plastered ceilings.” Obviously, the concern here was with serviceability rather than safety. Rules of thumb for strength were not found in the reviewed literature, but some general guidelines have been passed down. For example, a span to depth ratio limit of 21 is commonly considered as a practical design limitation when beams or joists are laterally supported to prevent twisting. This rule of thumb would allow a 2x8 (1920s actual size 1-5/8” x 7-1/2”) to span about 13 feet.
By the 1930s, standardized lumber grades and stress values (see Table 10) were used to specify maximum spans based on engineering analysis of strength limits. A deflection limit of 1/360 of span was used to produce span tables for joists supporting plaster ceilings. Tables were also used to specify maximum horizontal spans for sloped roof rafters. Some examples of maximum spans are shown in Table 12.
23
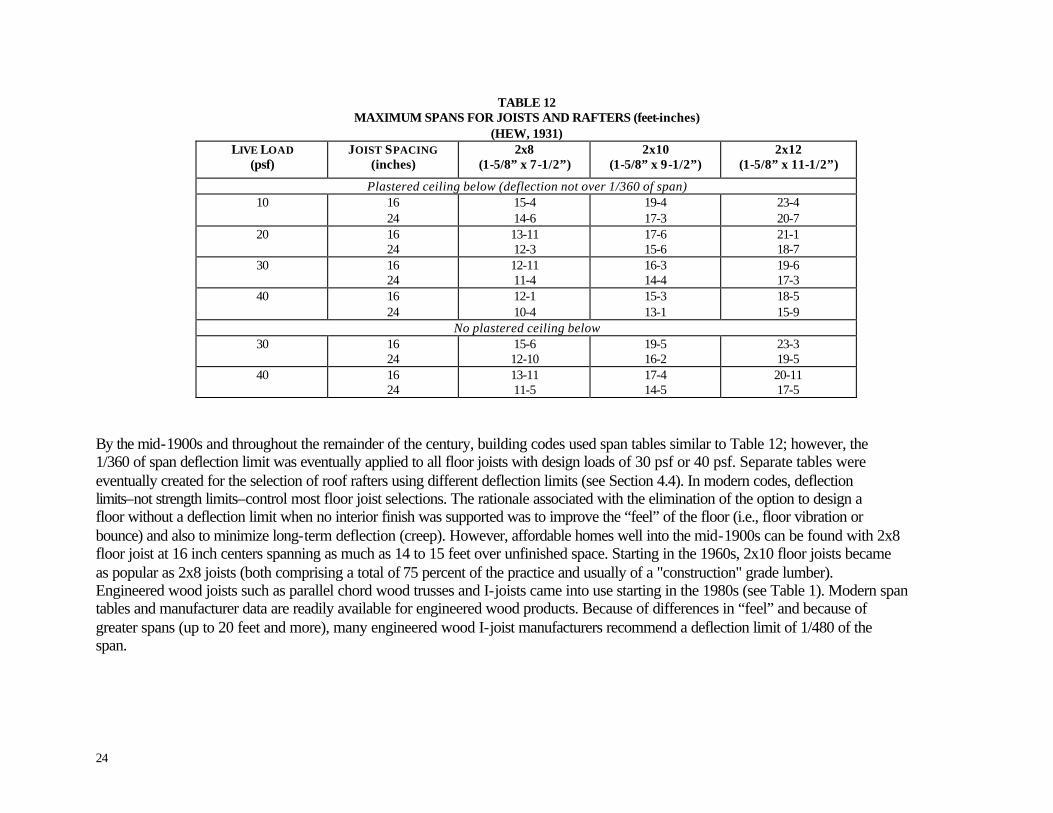
TABLE 12MAXIMUM SPANS FOR JOISTS AND RAFTERS (feet-inches)
(HEW, 1931)LIVE LOAD
(psf) JOIST SPACING
(inches) 2x8
(1-5/8” x 7 -1/2”) 2x10
(1-5/8” x 9 -1/2”) 2x12
(1-5/8” x 11-1/2”)
Plastered ceiling below (deflection not over 1/360 of span) 10 16
24 15-4 14-6
19-4 17-3
23-4 20-7
20 16 24
13-11 12-3
17-6 15-6
21-1 18-7
30 16 24
12-11 11-4
16-3 14-4
19-6 17-3
40 16 24
12-1 10-4
15-3 13-1
18-5 15-9
No plastered ceiling below 30 16
24 15-6 12-10
19-5 16-2
23-3 19-5
40 16 24
13-11 11-5
17-4 14-5
20-11 17-5
By the mid-1900s and throughout the remainder of the century, building codes used span tables similar to Table 12; however, the 1/360 of span deflection limit was eventually applied to all floor joists with design loads of 30 psf or 40 psf. Separate tables were eventually created for the selection of roof rafters using different deflection limits (see Section 4.4). In modern codes, deflection limits–not strength limits–control most floor joist selections. The rationale associated with the elimination of the option to design a floor without a deflection limit when no interior finish was supported was to improve the “feel” of the floor (i.e., floor vibration or bounce) and also to minimize long-term deflection (creep). However, affordable homes well into the mid-1900s can be found with 2x8 floor joist at 16 inch centers spanning as much as 14 to 15 feet over unfinished space. Starting in the 1960s, 2x10 floor joists became as popular as 2x8 joists (both comprising a total of 75 percent of the practice and usually of a "construction" grade lumber). Engineered wood joists such as parallel chord wood trusses and I-joists came into use starting in the 1980s (see Table 1). Modern span tables and manufacturer data are readily available for engineered wood products. Because of differences in “feel” and because of greater spans (up to 20 feet and more), many engineered wood I-joist manufacturers recommend a deflection limit of 1/480 of the span.
24
4.3 WALL FRAMING
4.3.1 Studding
Over the 20th century, actual vs. nominal framing member sizes have decreased somewhat and wall framing methods have changed from balloon to platform frame. By far, the most common stud spacing throughout the 20th century was 16 inches on center; however, 24 inches on center has also been used primarily for single stories. In the early 1900s, it is clear that 16 inches on center framing was considered necessary for the support of lath and plaster interior finishes. While 2x4 studding is exclusively mentioned in the earlier parts of the century for typical dwelling construction, 2x6 studs are sometimes used in modern homes to allow for thicker wall cavity insulation (see Table 1). Because of their greater structural capacity and cost, 2x6 studs are sometimes spaced 24 inches on center where 2x4's would be spaced 16 inches on center.
In the early 1900s, 2x4s spaced 16 inches on center were considered adequate for use in buildings up to three stories in height and for ceiling heights not exceeding 12 to 15 feet. This limit was related to the weak axis of the stud being braced by wall finishes and a maximum stud height to stud depth ratio of 50. For buildings over three stories in height, 2x6s or 3x4s were recommended in the lower stories. In modern codes with 2x4s of smaller standard dimension spaced 16 inches on center, building height is limited to two stories and the maximum 2x4 stud wall height is limited to 10 ft. For buildings over two stories in height, 2x6s or 3x4s are required for the lower stories. Preferred ceiling heights have also changed somewhat over time (see Table 1)which affects the selection of stud lengths.
4.3.2 Plates
While balloon framing generally used single plates at the top and bottom of walls, “standard” modern platform frame construction has adopted the use of double top plates (discussed earlier in Sears’ “standard-built” homes). However, single plates are still permitted, and are used occasionally, in modern affordable platform framed homes, specifically in non-load bearing walls or where loads are transferred directly down through studs.
4.3.3 Corners
Three stud corners have been typical throughout the 20th century. A 4x4 corner post was sometimes used in older homes as a hold-over from the 19th century braced frame construction. Two stud corners were also used and are still permitted.
25

4.3.4 Headers
In the early 1900s, headers were usually considered unnecessary above typical window and door openings because of the load distributing effects in the walls and floor members above the opening. Thus, only a single or double 2x4 flat-wise was used. Doubled 2x4 stud framing at window and door openings was considered as an enhancement to allow for better trim attachment and more sturdy support. Regarding headers in platform frame construction, the following 1923 quote was found in Audel's:
“It [platform framing] made the formation of openings for windows and doors easier: a simple header (flat-wise 2x4) could be utilized because the platform above spreads loads from an upper floor or roof uniformly to the stud walls below.”
For framing above larger than normal doors and windows, truss framing using diagonal blocking with cripple studs was recommended, though extensive use of this recommended practice is doubtful. Framing requirements above window and door openings in the early 1900s are summarized in Table 13.
TABLE 13RECOMMENDED FRAMING ABOVE OPENINGS
(HEW, 1931)OPENING WIDTH RECOMMENDED HEADER FRAMING
3’ or less 2-2x4 edgewise in load bearing walls 1-2x4 flatwise in non-load bearing walls
3’ to 6’ use a trussed header greater than 6’ use a girder (built-up header)
During the last half of the 1900s, built-up headers ranging in size up to two 2x12s for large openings were provided in span tables in building codes based on various engineering assumptions and loading conditions with disregard for “load spreading” recognized earlier in the century. No clear reason (practical or technical) for this was found in the reviewed literature. It does appear that recognition of different header requirements in load bearing vs. non-load bearing conditions existed throughout the century, although confusion in the field often resulted in the use of headers in either case.
4.3.5 Bracing
Wall bracing includes not only the presence of designated bracing members, but also the contribution of various sheathing and finish materials applied to interior and exterior surfaces. In addition, housing style (i.e., amount and size of openings and plan configuration) can have significant effects on the amount and type of lateral bracing provided.
26
In the early 1900s, wall bracing followed one or more of the following reported practices:
• no bracing (relying solely on interior lath and plaster finish and exterior wood siding); • 1x4 diagonal bracing (let-in or cut-in); or • horizontal or diagonal board sheathing.
The following 1931 quote from Wood Frame House Construction explains the recommendation for wall bracing when no sheathing is used:
“Where sheathing is omitted, the wall should be braced, at each corner and beside each doorway, with let-in strips [1x4] running diagonally from the floor line above to the plate or sill below, and nailed strongly at the upper and lower ends as well as at each intervening stud…Drop siding is more suitable than bevel or common siding for direct application to studs without sheathing…While rabbeted siding serves to brace the building to some extent, it does not add sufficient strength to serve in lieu of other forms of bracing. For this reason the building should be braced, or the bracing effect needed should be supplied in some other way, as by wood lath and plaster, diagonal sheathing, or let-in bracing.”
Based on the above quote, it is apparent that interior finishes (wood lath and plaster) were considered as an adequate primary wall bracing mechanism in the 1930s and earlier. However, it was also recognized that other practices, such as the use of let-in braces or diagonal board sheathing provided enhanced bracing.
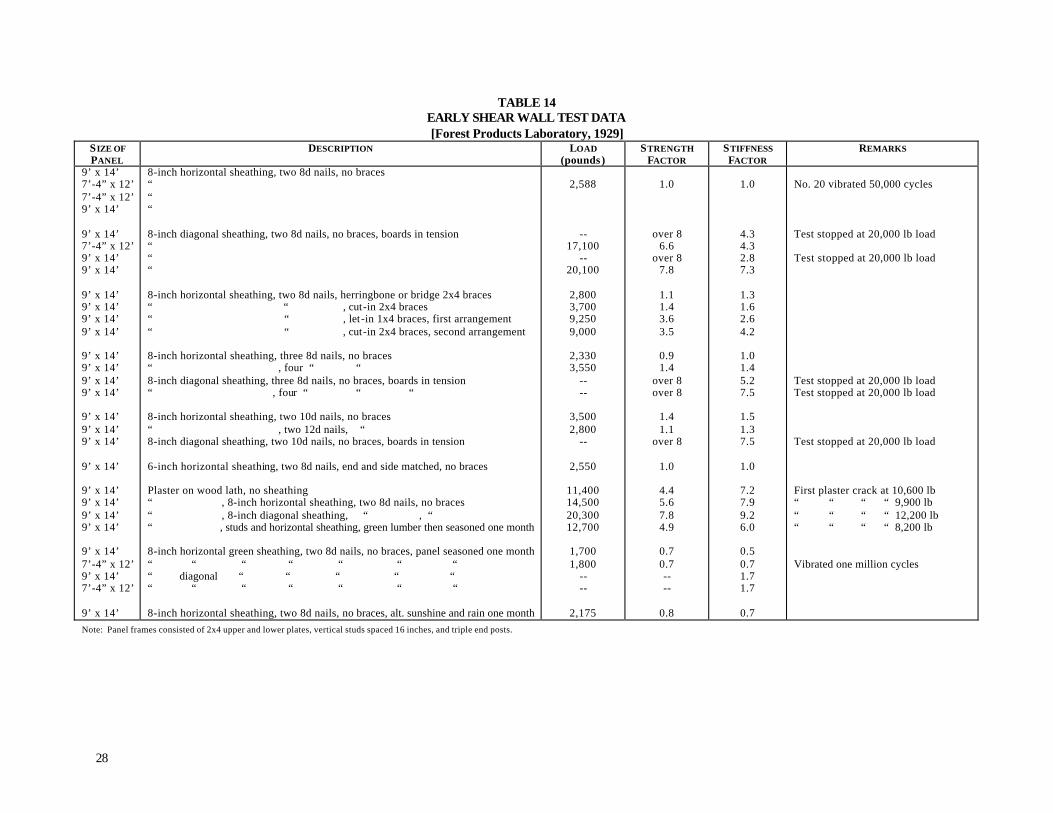
The Forest Products Laboratory conducted in-plane shear tests in 1929 on various wall systems representative of the above practices. These tests were conducted to determine the effectiveness of different bracing because “no one knew the relative values of different methods.” The bracing tested ranged from horizontal sheathing of green lumber to wood lath and plaster without sheathing. Walls were either solid, framed with a single window opening, or framed with a window and door opening. The standard wall construction was designated as horizontal 1x6 board sheathing of seasoned lumber fastened to each stud with two 8d common wire nails (without interior lath and plaster finish). It was assigned a relative value of 100 percent (i.e., strength and stiffness factors of 1.0). Wall height and length dimensions included two conditions: 9 feet by 14 feet and 7 feet 4 inches by 12 feet. The walls were tested under sufficient vertical restraint (load) to prevent overturning from occurring. The test results for the various solid wall constructions are shown in Table 14; results for walls with openings are shown in Table 15. It is apparent that results varied substantially.
27
--
--
----
--
----
----
TABLE 14EARLY SHEAR WALL TEST DATA[Forest Products Laboratory, 1929]
S IZE OF PANEL
DESCRIPTION LOAD (pounds )
S TRENGTH FACTOR
S TIFFNESS FACTOR
REMARKS
9’ x 14’ 7’-4” x 12’ 7’-4” x 12’ 9’ x 14’
9’ x 14’ 7’-4” x 12’ 9’ x 14’ 9’ x 14’
9’ x 14’ 9’ x 14’ 9’ x 14’ 9’ x 14’
9’ x 14’ 9’ x 14’ 9’ x 14’ 9’ x 14’
9’ x 14’ 9’ x 14’ 9’ x 14’
9’ x 14’
9’ x 14’ 9’ x 14’ 9’ x 14’ 9’ x 14’
9’ x 14’ 7’-4” x 12’ 9’ x 14’ 7’-4” x 12’
9’ x 14’
8-inch horizontal sheathing, two 8d nails, no braces “ “ “
8-inch diagonal sheathing, two 8d nails, no braces, boards in tension “ “ “
8-inch horizontal sheathing, two 8d nails, herringbone or bridge 2x4 braces “ “ , cut -in 2x4 braces “ “ , let -in 1x4 braces, first arrangement “ “ , cut -in 2x4 braces, second arrangement
8-inch horizontal sheathing, three 8d nails, no braces “ , four “ “ 8-inch diagonal sheathing, three 8d nails, no braces, boards in tension “ , four “ “ “
8-inch horizontal sheathing, two 10d nails, no braces “ , two 12d nails, “ 8-inch diagonal sheathing, two 10d nails, no braces, boards in tension
6-inch horizontal sheathing, two 8d nails, end and side matched, no braces
Plaster on wood lath, no sheathing “ , 8-inch horizontal sheathing, two 8d nails, no braces “ , 8-inch diagonal sheathing, “ , “ “ , studs and horizontal sheathing, green lumber then seasoned one month
8-inch horizontal green sheathing, two 8d nails, no braces, panel seasoned one month “ “ “ “ “ “ “ “ diagonal “ “ “ “ “ “ “ “ “ “ “ “
8-inch horizontal sheathing, two 8d nails, no braces, alt. sunshine and rain one month
2,588
17,100
20,100
2,800 3,700 9,250 9,000
2,330 3,550
3,500 2,800
2,550
11,400 14,500 20,300 12,700
1,700 1,800
2,175
1.0
over 8 6.6
over 8 7.8
1.1 1.4 3.6 3.5
0.9 1.4
over 8 over 8
1.4 1.1
over 8
1.0
4.4 5.6 7.8 4.9
0.7 0.7
0.8
1.0
4.3 4.3 2.8 7.3
1.3 1.6 2.6 4.2
1.0 1.4 5.2 7.5
1.5 1.3 7.5
1.0
7.2 7.9 9.2 6.0
0.5 0.7 1.7 1.7
0.7
No. 20 vibrated 50,000 cycles
Test stopped at 20,000 lb load
Test stopped at 20,000 lb load
Test stopped at 20,000 lb load Test stopped at 20,000 lb load
Test stopped at 20,000 lb load
First plaster crack at 10,600 lb “ “ “ “ 9,900 lb “ “ “ “ 12,200 lb “ “ “ “ 8,200 lb
Vibrated one million cycles
Note: Panel frames consisted of 2x4 upper and lower plates, vertical studs spaced 16 inches, and triple end posts.
28
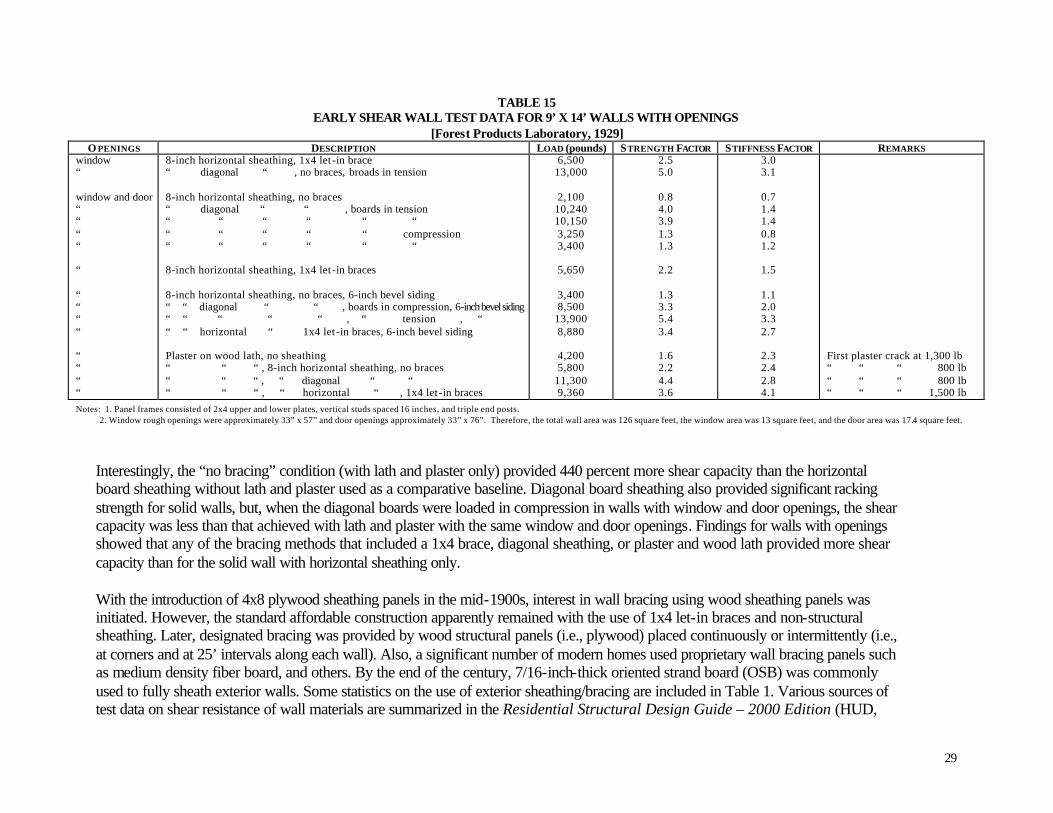
TABLE 15EARLY SHEAR WALL TEST DATA FOR 9’ X 14’ WALLS WITH OPENINGS
[Forest Products Laboratory, 1929]O PENINGS DESCRIPTION LOAD (pounds) S TRENGTH FACTOR S TIFFNESS FACTOR REMARKS
window “
window and door “ “ “ “
“
“ “ “ “
“ “ “ “
8-inch horizontal sheathing, 1x4 let -in brace “ diagonal “ , no braces, broads in tension
8-inch horizontal sheathing, no braces “ diagonal “ “ , boards in tension “ “ “ “ “ “ “ “ “ “ “ compression “ “ “ “ “ “
8-inch horizontal sheathing, 1x4 let -in braces
8-inch horizontal sheathing, no braces, 6-inch bevel siding “ “ diagonal “ “ , boards in compression, 6-inch bevel siding “ “ “ “ “ , “ tension , “ “ “ horizontal “ 1x4 let -in braces, 6-inch bevel siding
Plaster on wood lath, no sheathing “ “ “ , 8-inch horizontal sheathing, no braces “ “ “ , “ diagonal “ “ “ “ “ , “ horizontal “ , 1x4 let -in braces
6,500 13,000
2,100 10,240 10,150 3,250 3,400
5,650
3,400 8,500
13,900 8,880
4,200 5,800
11,300 9,360
2.5 5.0
0.8 4.0 3.9 1.3 1.3
2.2
1.3 3.3 5.4 3.4
1.6 2.2 4.4 3.6
3.0 3.1
0.7 1.4 1.4 0.8 1.2
1.5
1.1 2.0 3.3 2.7
2.3 2.4 2.8 4.1
First plaster crack at 1,300 lb “ “ “ 800 lb “ “ “ 800 lb “ “ “ 1,500 lb
Notes: 1. Panel frames consisted of 2x4 upper and lower plates, vertical studs spaced 16 inches, and triple end posts. 2. Window rough openings were approximately 33” x 57” and door openings approximately 33” x 76”. Therefore, the total wall area was 126 square feet, the window area was 13 square feet, and the door area was 17.4 square feet.
Interestingly, the “no bracing” condition (with lath and plaster only) provided 440 percent more shear capacity than the horizontal board sheathing without lath and plaster used as a comparative baseline. Diagonal board sheathing also provided significant racking strength for solid walls, but, when the diagonal boards were loaded in compression in walls with window and door openings, the shear capacity was less than that achieved with lath and plaster with the same window and door openings. Findings for walls with openings showed that any of the bracing methods that included a 1x4 brace, diagonal sheathing, or plaster and wood lath provided more shear capacity than for the solid wall with horizontal sheathing only.
With the introduction of 4x8 plywood sheathing panels in the mid-1900s, interest in wall bracing using wood sheathing panels was initiated. However, the standard affordable construction apparently remained with the use of 1x4 let-in braces and non-structural sheathing. Later, designated bracing was provided by wood structural panels (i.e., plywood) placed continuously or intermittently (i.e., at corners and at 25’ intervals along each wall). Also, a significant number of modern homes used proprietary wall bracing panels such as medium density fiber board, and others. By the end of the century, 7/16-inch-thick oriented strand board (OSB) was commonly used to fully sheath exterior walls. Some statistics on the use of exterior sheathing/bracing are included in Table 1. Various sources of test data on shear resistance of wall materials are summarized in the Residential Structural Design Guide – 2000 Edition (HUD,
29

2000). Approximate ultimate shear values for various modern wall constructions based on research from the mid- to late-1900s are shown in Table 16.
TABLE 16ULTIMATE SHEAR VALUES FOR TYPICAL MODERN WALL CONSTRUCTIONS
1x4 Let-in brace >600 lbs/ea (tension) 2,000 lbs/ea (compression)
Metal T-brace (tension only) 1,400 lbs/ea 1/2” Gypsum Wall Board (single side, min. 4d cooler nails at 12”oc) 100 plf 3/8” Plywood or 7/16” OSB (G=0.5, 8d pneumatic nails at standard 6/12 spacing) 650 plf Exterior 7/8” PC stucco and metal lath
w/nails w/staples
500-750 plf 750-1,580 plf
It is evident that the interior finish material, which is not considered explicitly as bracing, actually was the most significant determinant of bracing capacity in many homes built during the first half of the 20th century. During the mid-1900s the preference for interior finishes switched from wood lath and plaster to gypsumboard, 2 foot wide gypsum “lath” that was finished with a skim coat of plaster. Soon thereafter, the preferred practice became gypsum wallboard using 4 foot wide panels with taped and finished joints. This practice has remained a standard through the end of the 20th century. It is noted that older lath and plaster interior finishes may provide up to 8 times more shear capacity than typical gypsum board wall finishes used in modern homes (i.e., 100 plf vs. 800 plf). However, all modern homes use either structural panel or let-in/metal braces in addition to support provided by interior finishes.
Since dwelling lateral (shear) capacity is to some degree dependent on interior finishes, it is important to consider changes in the average size of houses as depicted in Table 1, in amounts of interior wall relative to area, and in dead load (relative to seismic or wind design loads). Data on interior wall linear footage per story level as a function of square feet of floor area on a given story level are shown in Table 17. These data are based on a limited sample of house plans that are considered to be representative of a range of home styles constructed in each period. The decrease in the relative amounts of interior walls over the course of the past century is notable. While this trend tends to show a decrease in the amount of ancillary bracing provided by interior walls in newer homes, the lineal footage of exterior walls relative to floor area tend to increase in the newer homes. Thus, the overall bracing impact (considering the changes to interior and exterior walls) may be somewhat offset by these two countervailing trends. Uncertainty in the effects of increased irregularity in plan configuration of newer homes must also be considered relative to possible impact on resistance to lateral loads. However, one recent study of homes following the Northridge Earthquake seems to indicate that irregularities in wall line offsets cannot be directly associated with any noticeable trend in performance of single family homes (HUD, 1999). The data summarized in this section is provided to suggest the need for a more detailed and thorough evaluation of changes in bracing found in
30
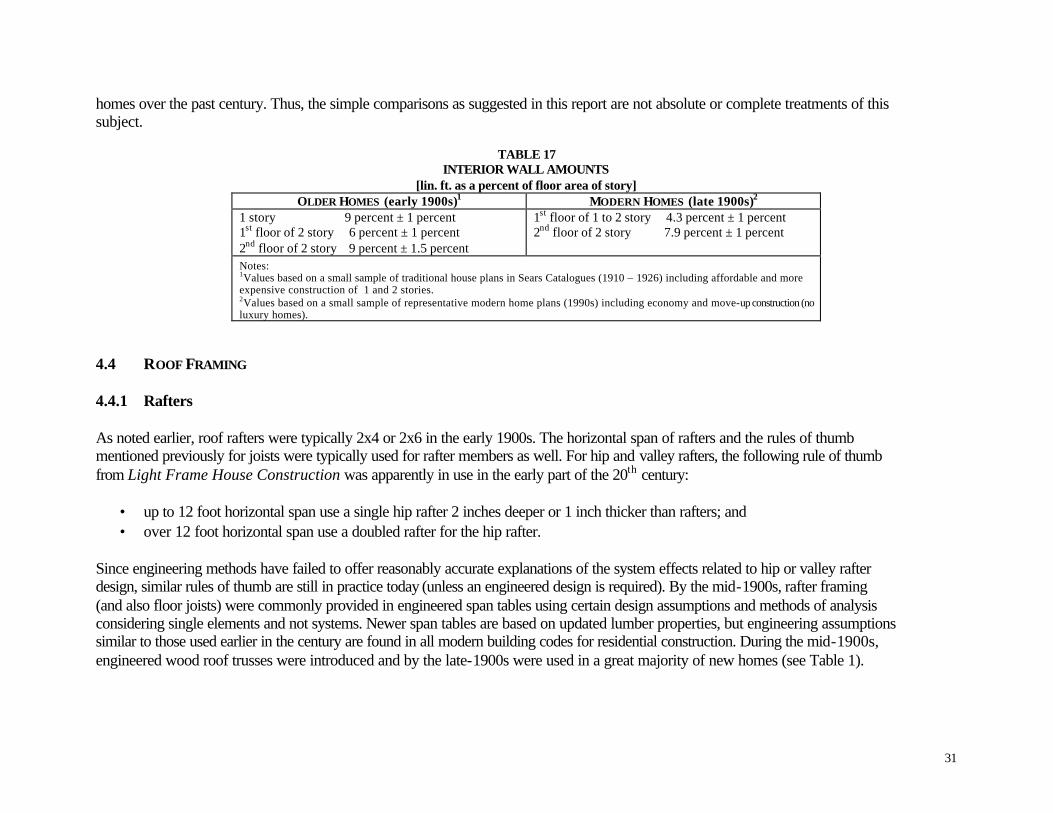
homes over the past century. Thus, the simple comparisons as suggested in this report are not absolute or complete treatments of this subject.
TABLE 17INTERIOR WALL AMOUNTS
[lin. ft. as a percent of floor area of story]OLDER HOMES (early 1900s)1 MODERN HOMES (late 1900s)2
1 story 9 percent ± 1 percent 1st floor of 2 story 6 percent ± 1 percent 2nd floor of 2 story 9 percent ± 1.5 percent
1st floor of 1 to 2 story 4.3 percent ± 1 percent 2nd floor of 2 story 7.9 percent ± 1 percent
Notes: 1Values based on a small sample of traditional house plans in Sears Catalogues (1910 – 1926) including affordable and more expensive construction of 1 and 2 stories. 2Values based on a small sample of representative modern home plans (1990s) including economy and move-up construction (no luxury homes).
4.4 ROOF FRAMING
4.4.1 Rafters
As noted earlier, roof rafters were typically 2x4 or 2x6 in the early 1900s. The horizontal span of rafters and the rules of thumb mentioned previously for joists were typically used for rafter members as well. For hip and valley rafters, the following rule of thumb from Light Frame House Construction was apparently in use in the early part of the 20th century:
• up to 12 foot horizontal span use a single hip rafter 2 inches deeper or 1 inch thicker than rafters; and • over 12 foot horizontal span use a doubled rafter for the hip rafter.
Since engineering methods have failed to offer reasonably accurate explanations of the system effects related to hip or valley rafter design, similar rules of thumb are still in practice today (unless an engineered design is required). By the mid-1900s, rafter framing (and also floor joists) were commonly provided in engineered span tables using certain design assumptions and methods of analysis considering single elements and not systems. Newer span tables are based on updated lumber properties, but engineering assumptions similar to those used earlier in the century are found in all modern building codes for residential construction. During the mid-1900s, engineered wood roof trusses were introduced and by the late-1900s were used in a great majority of new homes (see Table 1).
31

4.4.2 Roof Sheathing
In the early 1900s, roof sheathing of 1x6 or 1x8 boards, or minimum 1x3 furring (spaced sheathing) spaced according to weather exposure of wood shingles (up to 6 inches on center) was typical. A minimum of two 8d common wire nails were typically used to fasten random-length boards to each roof rafter. In the mid-1900s plywood roof sheathing entered the market and soon became the standard. By the late 1900s, most roofs were sheathed with some form of wood structural panel sheathing, primarily 7/16-inch-thick OSB (see Table 1); board sheathing methods had become practically extinct. Nailing requirements and types of fasteners changed to accommodate the panels and newer tools, such as pneumatic nail guns.
4.5 FASTENERS AND CONNECTIONS
Trends in the treatment of connections in housing during the 20th century provide important insights into changes in the structural characteristics of homes. This section reviews some of the changes in fastening practices and materials. Where found in the literature, data on structural characteristics of various fasteners or connections are summarized.
Wire nails have been the predominant fastener for wood framing connections throughout the 20th century. Up to the 20th century, the most common nails used were wrought iron or cut nails, which were preceded by the use of wooden pegs and special heavy timber connection details (i.e., wood joinery). Cut nails were quickly replaced by common wire nails in the earliest parts of the 20th century. However, it is worth noting that Audel's reports test data indicating that cut nails provide as much as 2 to 3 times the “holding capacity” of common wire nails of similar size. The tests were conducted with several repetitions and wood species, including hardwoods and soft woods and dense soft woods. It is presumed that the difference in withdrawal capacity can be explained by the wedging action created by the tapered shank of a cut nail. Cut nails continued to see infrequent use for some applications such as hardwood flooring, but eventually they became obsolete. In early framing practice, specifications often called for heavier loaded joints or thicker materials to be “securely spiked together.” Spikes are similar to common wire nails, but are larger in diameter and greater in length than common wire nails. However, from the literature surveyed, it appears that for home building in the early 1900s, spikes may have been considered to be 20d common wire nails. Rules of thumb for nail selection in the early 1900s are paraphrased as follows from Audel’s:
“Use one penny size for each 1/8-inch of thickness for typical wood density. For softer wood use up to two penny-weights larger, and for harder/denser wood use one to two penny-weights smaller to prevent cracking of wood.”
In the last half of the 1900s, box nails with a smaller shank diameter and a resin coating to increase holding were used to some unknown extent. By the late 1900s, pneumatic fasteners dominated the market. Various fastener sizes and types are addressed in the Residential Structural Design Guide – 2000 Edition (HUD, 2000) and other wood design or technology references.
32
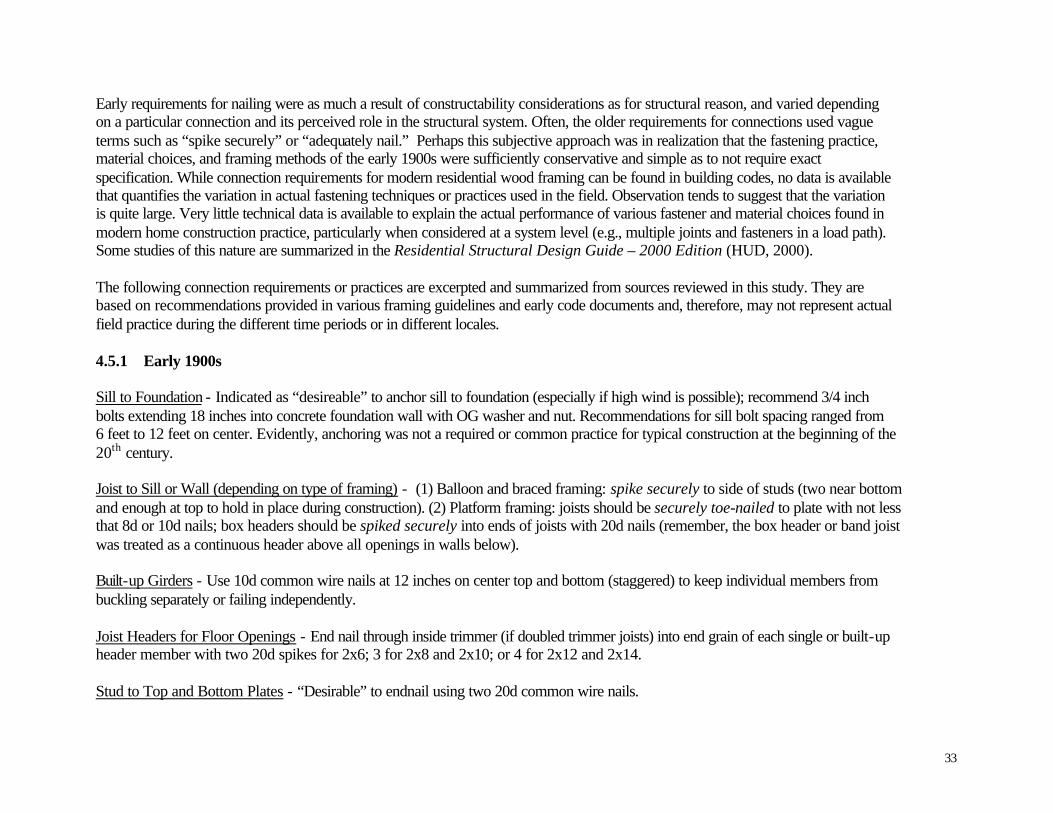
Early requirements for nailing were as much a result of constructability considerations as for structural reason, and varied depending on a particular connection and its perceived role in the structural system. Often, the older requirements for connections used vague terms such as “spike securely” or “adequately nail.” Perhaps this subjective approach was in realization that the fastening practice, material choices, and framing methods of the early 1900s were sufficiently conservative and simple as to not require exact specification. While connection requirements for modern residential wood framing can be found in building codes, no data is available that quantifies the variation in actual fastening techniques or practices used in the field. Observation tends to suggest that the variation is quite large. Very little technical data is available to explain the actual performance of various fastener and material choices found in modern home construction practice, particularly when considered at a system level (e.g., multiple joints and fasteners in a load path). Some studies of this nature are summarized in the Residential Structural Design Guide – 2000 Edition (HUD, 2000).
The following connection requirements or practices are excerpted and summarized from sources reviewed in this study. They are based on recommendations provided in various framing guidelines and early code documents and, therefore, may not represent actual field practice during the different time periods or in different locales.
4.5.1 Early 1900s
Sill to Foundation - Indicated as “desireable” to anchor sill to foundation (especially if high wind is possible); recommend 3/4 inch bolts extending 18 inches into concrete foundation wall with OG washer and nut. Recommendations for sill bolt spacing ranged from 6 feet to 12 feet on center. Evidently, anchoring was not a required or common practice for typical construction at the beginning of the 20th century.
Joist to Sill or Wall (depending on type of framing) - (1) Balloon and braced framing: spike securely to side of studs (two near bottom and enough at top to hold in place during construction). (2) Platform framing: joists should be securely toe-nailed to plate with not less that 8d or 10d nails; box headers should be spiked securely into ends of joists with 20d nails (remember, the box header or band joist was treated as a continuous header above all openings in walls below).
Built-up Girders - Use 10d common wire nails at 12 inches on center top and bottom (staggered) to keep individual members from buckling separately or failing independently.
Joist Headers for Floor Openings - End nail through inside trimmer (if doubled trimmer joists) into end grain of each single or built-up header member with two 20d spikes for 2x6; 3 for 2x8 and 2x10; or 4 for 2x12 and 2x14.
Stud to Top and Bottom Plates - “Desirable” to endnail using two 20d common wire nails.
33
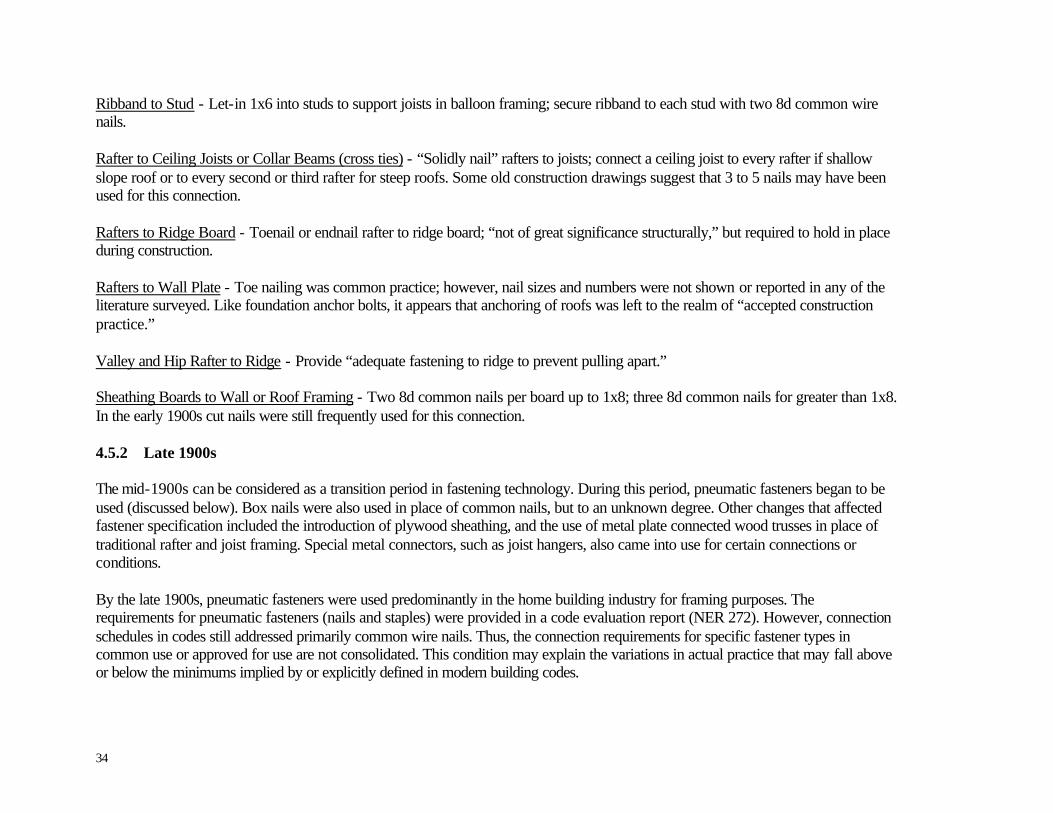
Ribband to Stud - Let-in 1x6 into studs to support joists in balloon framing; secure ribband to each stud with two 8d common wire nails.
Rafter to Ceiling Joists or Collar Beams (cross ties) - “Solidly nail” rafters to joists; connect a ceiling joist to every rafter if shallow slope roof or to every second or third rafter for steep roofs. Some old construction drawings suggest that 3 to 5 nails may have been used for this connection.
Rafters to Ridge Board - Toenail or endnail rafter to ridge board; “not of great significance structurally,” but required to hold in place during construction.
Rafters to Wall Plate - Toe nailing was common practice; however, nail sizes and numbers were not shown or reported in any of the literature surveyed. Like foundation anchor bolts, it appears that anchoring of roofs was left to the realm of “accepted construction practice.”
Valley and Hip Rafter to Ridge - Provide “adequate fastening to ridge to prevent pulling apart.”
Sheathing Boards to Wall or Roof Framing - Two 8d common nails per board up to 1x8; three 8d common nails for greater than 1x8. In the early 1900s cut nails were still frequently used for this connection.
4.5.2 Late 1900s
The mid-1900s can be considered as a transition period in fastening technology. During this period, pneumatic fasteners began to be used (discussed below). Box nails were also used in place of common nails, but to an unknown degree. Other changes that affected fastener specification included the introduction of plywood sheathing, and the use of metal plate connected wood trusses in place of traditional rafter and joist framing. Special metal connectors, such as joist hangers, also came into use for certain connections or conditions.
By the late 1900s, pneumatic fasteners were used predominantly in the home building industry for framing purposes. The requirements for pneumatic fasteners (nails and staples) were provided in a code evaluation report (NER 272). However, connection schedules in codes still addressed primarily common wire nails. Thus, the connection requirements for specific fastener types in common use or approved for use are not consolidated. This condition may explain the variations in actual practice that may fall above or below the minimums implied by or explicitly defined in modern building codes.
34

5.0 CONSTRUCTION QUALITY
No reliable source of data was found regarding trends in construction quality over the course of the 20th century. However, it should be noted that complaints and concerns with shoddy construction in the references used in this study seem to indicate that it was just as much a concern at the beginning of the century as the end. Unfortunately, the significance of such concerns remain in the realm of anecdotal evidence, which serves to confirm that quality problems existed, but does not allow a quantitative assessment of the degree, frequency, or implications of such problems as related to structural performance in newer or older homes. It appears that the tradespeople of yesterday were just as subject to human error as they are today.
However, assuming no significant change in construction quality, certain changes in construction materials and methods may justify a greater concern in modern times on the basis that the techniques are less “forgiving” of mistakes or tolerances implicit to reasonable standards of workmanship. For example, modern framing members are somewhat smaller and require greater precision in fastener installation. Pneumatic fastening methods and panelized sheathing products tend to create situations where “blind” connections are made to underlying framing members without as close a control as inherent with hand-driven nails to secure boards. While such problems can be avoided with appropriate controls, newer materials and methods (including more varieties and options than in the past) do seem to place the burden of a greater standard of care on the tradesperson.
6.0 SUMMARY AND CONCLUSIONS
Significant changes to construction materials and methods have occurred over the past century that affect the economy and structural performance of homes. In some cases it appears that change has increased structural performance while, in other cases structural performance was reduced. It also appears that different levels of value (i.e., balancing of cost versus performance) have been applied throughout the century to meet varied housing needs or desires in the nation. As a result, minimums based on a compelling need for affordable housing have co-existed with “up-grades” used in homes sold to more affluent buyers. In such a manner, housing supply has served a diverse demand with needed flexibility in establishing an appropriate definition of value based on individual buyers or market segments.
Some significant changes to housing construction methods and materials discussed in this report are summarized as follows:
• Separate concrete spread footings, introduced in early 1900s, are found on nearly all homes by the end of the century. In fact, several enhancements to foundation construction have occurred over the past century.
• Framing method switched from balloon to platform frame technique.
35
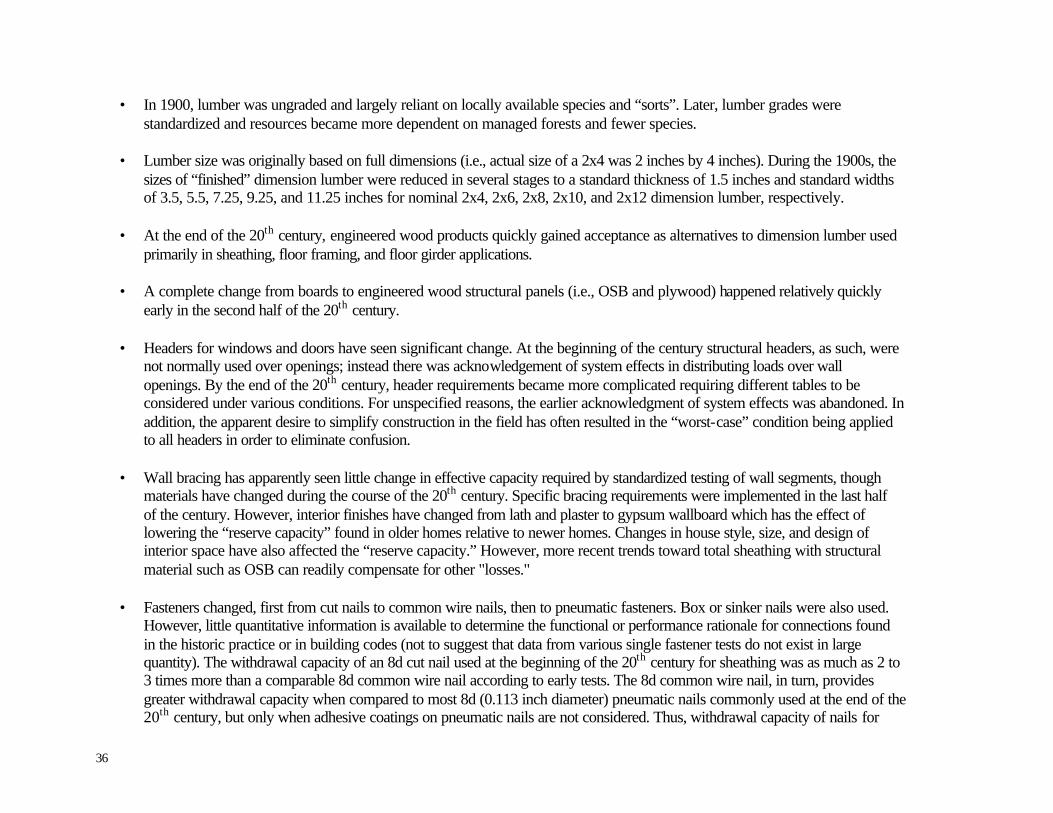
• In 1900, lumber was ungraded and largely reliant on locally available species and “sorts”. Later, lumber grades were standardized and resources became more dependent on managed forests and fewer species.
• Lumber size was originally based on full dimensions (i.e., actual size of a 2x4 was 2 inches by 4 inches). During the 1900s, the sizes of “finished” dimension lumber were reduced in several stages to a standard thickness of 1.5 inches and standard widths of 3.5, 5.5, 7.25, 9.25, and 11.25 inches for nominal 2x4, 2x6, 2x8, 2x10, and 2x12 dimension lumber, respectively.
• At the end of the 20th century, engineered wood products quickly gained acceptance as alternatives to dimension lumber used primarily in sheathing, floor framing, and floor girder applications.
• A complete change from boards to engineered wood structural panels (i.e., OSB and plywood) happened relatively quickly early in the second half of the 20th century.
• Headers for windows and doors have seen significant change. At the beginning of the century structural headers, as such, were not normally used over openings; instead there was acknowledgement of system effects in distributing loads over wall openings. By the end of the 20th century, header requirements became more complicated requiring different tables to be considered under various conditions. For unspecified reasons, the earlier acknowledgment of system effects was abandoned. In addition, the apparent desire to simplify construction in the field has often resulted in the “worst-case” condition being applied to all headers in order to eliminate confusion.
• Wall bracing has apparently seen little change in effective capacity required by standardized testing of wall segments, though materials have changed during the course of the 20th century. Specific bracing requirements were implemented in the last half of the century. However, interior finishes have changed from lath and plaster to gypsum wallboard which has the effect of lowering the “reserve capacity” found in older homes relative to newer homes. Changes in house style, size, and design of interior space have also affected the “reserve capacity.” However, more recent trends toward total sheathing with structural material such as OSB can readily compensate for other "losses."
• Fasteners changed, first from cut nails to common wire nails, then to pneumatic fasteners. Box or sinker nails were also used. However, little quantitative information is available to determine the functional or performance rationale for connections found in the historic practice or in building codes (not to suggest that data from various single fastener tests do not exist in large quantity). The withdrawal capacity of an 8d cut nail used at the beginning of the 20th century for sheathing was as much as 2 to 3 times more than a comparable 8d common wire nail according to early tests. The 8d common wire nail, in turn, provides greater withdrawal capacity when compared to most 8d (0.113 inch diameter) pneumatic nails commonly used at the end of the 20th century, but only when adhesive coatings on pneumatic nails are not considered. Thus, withdrawal capacity of nails for
36
certain joints may have changed dramatically depending on the effectiveness of adhesives on newer coated nails. Changes in the shear capacity of certain joints, such as sheathing connections, also occurred as a result of the general reduction in nail diameters.
• Construction quality has been a concern through the 20th century with little evidence to suggest that any substantial change (good or bad) has occurred. However, there are some obvious changes in materials and tools that require more precision in construction; thus, there is a greater potential for error, particularly in connections. This problem is not helped by the numerous choices for fasteners (including staples, etc.) now on the market, and the lack of simplicity and uniformity in the regulations that govern connection requirements in modern construction practice.
7.0 RECOMMENDATIONS
The findings and conclusions of this study suggest that certain modern house construction practices should be carefully evaluated in view of changes in historic practice. Some specific recommendations include:
1. Re-evaluate, simplify, and prepare specific details for connections that balance structural needs with the intuition and capability of the tradesperson. For example, can two specific sizes of pneumatic nails be successfully used to specify all or most framing connections in a typical house?
2. Wall bracing practices should be re-assessed based on changes in the style, size, and interior finishes used in modern homes as compared to older homes (early 1900s).
3. Practices for header sizing and engineering analysis of homes in general should incorporate more efficient system-based design principles that were inherently understood in the design and framing practices in the early 1900s.
8.0 BIBLIOGRAPHY
Annual Builder Practices Survey, NAHB Research Center, Inc., Upper Marlboro, MD.
Architectural Graphic Standards, 5th Edition, Charles George Ramsey and Harold Reeve Sleeper, 1956.
Audel’s Carpenters and Builders Guide (Vol. 1, 2, 3, and 4), Theo. Audel & Co. - Publishers, New York, NY, 1923.
Cotton Fields No More: Southern Agriculture 1865-1980, Gilbert C. Fite, The University Press of Kentucky, Lexington, KY, 1984.
37
Dwelling House Construction, Fourth Edition, Revised, by Albert G. H. Dietz, The MIT Press, Cambridge, MA, 1974.
Evaluation of Housing Performance and Seismic Design Implications in the Northridge Earthquake, U.S. Department of Housing and Urban Development, Washington, DC, 1999
Housing at the Millennium, Facts, Figures and Trends, National Association of Home Builders, Washington, DC, 2000.
Housing Statistics, U.S. Census, Washington, DC.
Light Frame House Construction, U.S. Department of Health, Education, and Welfare (HEW), Washington, DC, 1931.
Minimum Property Standards for One and Two Living Units, FHA No. 300, Federal Housing Administration, Washington, DC, 1958.
Old House Measured and Scaled Detail Drawings for Builders and Carpenters, W.A. Radford, Dover Publications, Inc., New York, NY, 1983.
One- and Two-Family Dwelling Code, Council of American Building Officials (CABO), Falls Church, VA, 1989 and 1992 editions.
Pneumatic or Mechanically Driven Staples, Nails, P-Nails, and Allied Fasteners for Use in All Types of Building Construction (NER-272) – Council of American Building Officials, Falls Church, VA, 1989.
Residential Structural Design Guide - 2000 Edition, prepared by NAHB Research Center, Inc., for the U.S. Department of Housing and Urban Development, Washington, DC, 2000.
Sears, Roebuck Home Builder’s Catalog, 1910 Edition, Dover Publications, Inc., NY, 1990.
Small Housing of the Twenties, the Sears Roebuck 1926 Catalog, Rover Publication, Inc., NY, 1991.
Structural Analysis of Historic Buildings, J. Stanley Rabun, John Wiley & Sons, Inc., New York, NY, 2000.
Wood Frame House Construction, Edited by Gerald E. Sherwood and Robert C. Stroh, Ph.D., for the National Association of Home Builders, Armonk Press, Armonk, NY, 1988.
38
APPENDIX ATHERMAL INSULATION
Very little mention of any requirement for energy efficiency such as thermal insulation was found in the historical sources reviewed (see Bibliography). For example, no information on thermal insulation was found in the Sears catalogues, which were considered an exhaustive catalogue for building materials, although the use of tarred felt paper underneath flooring to prevent draftiness and under the siding for rot protection was mentioned.
Tarred paper was also recognized as an air barrier to prevent air leakage through walls in “poorly built” homes in a University of Wisconsin study in the early 1900s. This study reported various infiltration rates through frame walls and found that “air infiltration through frame wall construction, containing building paper or plaster properly applied, is negligibly small (0.1 to 0.3 cubic feet per hour with a 15 mph wind-induced pressure difference). It is also reported that the United States Bureau of Standards had conducted tests on the strength, rate of air penetration, and moisture proof properties of building papers. Asphalt impregnated papers were reported to weigh from 66 to 163 pounds per 1,000 square feet. It was noted that building paper “must be selected and put on much more carefully than is ordinarily done.”
One 1930s framing guide (HEW, 1931) encouraged the use of exterior board sub-sheathing for its structural bracing benefits and for comfort benefits in cold or hot climates since “wood is one of the best natural insulators.” In addition, one drawing of roof framing did indicate “insulation material” placed between ceiling joists, which may suggest the relative importance placed on insulation in roofs as compared to other locations. The same guide later describes air leakage and thermal conduction as primary sources of heat loss, and encourages the use of thermal insulation and weather striping of doors to save on the rising cost of coal as well as other sources of heating energy (fuel oil, electric, etc.), and percent reductions in air leakage were cited for practices such as weather stripping and tightly fitting doors.
The National Bureau of Standards (Journal of Research, Vol.6, No.3), reported fuel savings for combinations of weather-stripped doors, insulation, and double (storm) windows. The savings were reported to range from 10 to 60 percent. The higher values were reported for use of 1-inch insulation (probably exterior wood sheathing) and double windows. It is noted that if tarred paper is not placed over sheathing (i.e., board sheathing is omitted) it is probably not worth installing because of air leakage between laps in the building paper. It is not clear that the function of moisture protection was considered reason enough to justify the use of building paper.
In general, energy efficiency did not become a serious consideration in home construction until later in the 1900s. The Minimum Property Standards (HUD, 1958) gave requirements for insulation based on a rudimentary calculation method. By the late 1900s, more sophisticated energy codes had been developed and relatively high levels of insulation were required in virtually every new home. The availability of materials to enhance energy efficiency also flourished (e.g., double glazed windows, various insulation types with high
A-1

thermal resistivity, sealing and weather-stripping technologies, etc.). In addition to energy codes that addressed new construction, tax incentive programs were introduced in the 1970s to encourage insulation of older homes. In addition, credits were offered through energy efficient mortgage financing programs and demand-management programs offered by various utility companies.
A-2