Embed Size (px)
Citation preview
Review of Water Monitoring in the
SEAWA Watershed
South Saskatchewan River Sub-basin
Prepared for:
SEAWA - South East Alberta Watershed Alliance
Prepared By: Ryan Davison C.E.T.
March 2013
Review of Water Monitoring in the SEAWA Watershed
1
Acknowledgements
I would like to thank Brian Hills, Karen Saffran, Bob Phillips, Robyn Black, Peter Wallis and Natalie Kromrey for their contributions and guidance toward the final compilation of this summary report.
Review of Water Monitoring in the SEAWA Watershed
2
Table of Contents
1.0 INTRODUCTION ---------------------------------------- 3
2.0 BACKGROUND ---------------------------------------- 3
3.0 HYDROLOGY ---------------------------------------- 4
3.1 SEAWA Watershed ---------------------------------------- 4
3.2 Tributaries ---------------------------------------- 5
3.3 Non – Contributing Basins ---------------------------------------- 5
3.4 Groundwater ---------------------------------------- 5
4.0 REVIEW OF MONITORING IN THE SEAWA WATERSHED -------------------- 6
4.1 ENVIRONMENT and SUSTAINABLE RESOURCE DEVELOPMENT (ESRD)- 6
Hydrometric Monitoring
Surface Water Quality
Groundwater Monitoring
4.2 IRRIGATION DISTRICTS ---------------------------------------- 12
Flow Monitoring
Water Quality
4.3 PRAIRIE PROVINCES WATER BOARD ---------------------------------------- 13
4.4 CITY OF MEDICINE HAT ---------------------------------------- 14
Regional Drinking Water
Trace Organics Sampling Project
4.5 MUNICIPAL WATER QUALITY MONITORING ----------------------------- 15
Water Supply
Waste Water Treatment
4.6 INDUSTRIAL WATER USERS --------------------------------------- 16
4.7 AGRICULTURAL WATER USERS --------------------------------------- 16
5.0 DISCUSSION
5.1 GAPS and RECOMMENDATIONS -------------------------------------- 17
5.2 ENGAGEMENT OPPORTUNITIES -------------------------------------- 18
5.3 LONG TERM MONITORING STRATEGY -------------------------------------- 18
6.0 CONCLUSION -------------------------------------- 19
7.0 REFERENCES -------------------------------------- 19
8.0 APPENDIX
A Summary of Monitoring Workshop ------------------- ------- Attached .pdf
B Monitoring Site Data and Reference Hyperlinks ----- ------- Attached .xls

Review of Water Monitoring in the SEAWA Watershed
3
1.0 INTRODUCTION
The South East Alberta Watershed Alliance (SEAWA) is working in partnership with governments,
industry and local stakeholders to develop and implement an Integrated Watershed Management Plan
(IWMP) for South East Alberta. Reliable monitoring of the quantity and quality of streams, rivers, lakes
and groundwater is a vital first step in understanding the resource, and is critical for establishing water
management objectives. As part of the IWMP process, this summary report will provide a review of
current water monitoring activities in the SEAWA Watershed and will identify information gaps and
future opportunities to support development of a Long Term Water Monitoring strategy in the
watershed.
2.0 BACKGROUND
Water monitoring has been recognized by both the Governments of Canada and Alberta as a critical step
in understanding and dealing with issues that threaten the future of sustainable development in Alberta.
The Alberta Government announced the following in a news release on March 13, 2012. “Our goal is to
build a world-class, science-based monitoring system,” said Diana McQueen, Minister of Environment
and Water. “This team of scientific, regulatory and academic experts will review governance and funding
options and provide recommendations to the government so that we continue making progress.” (ESRD,
2012)
While this action was in response to oil sands development in Northern Alberta’s Athabasca River Basin,
the South Saskatchewan River Basin also faces significant challenges related to development. Alberta
census data show that in the past decade 392,000 people have settled in the South Saskatchewan River
Basin, an increase of 31 percent over 2001. (Alberta Department of Municipal Affairs) As of 2012, this
brings the total basin population to 1.64 million, creating significant pressure on the quantity and quality
of water available to downstream users. Add to this the ongoing efforts to increase irrigated areas
upstream (SMRID, 2011), and monitoring becomes even more crucial to ensure a reliable water supply is
maintained in the lower reach of the South Saskatchewan River in Alberta.
In 2009, SEAWA was asked to provide priorities for the South Saskatchewan Regional Plan (SSRP). The
three priorities are:
High water quality standards
Sustainable water quantity allocation
Incentives for low impact development
All of these objectives rely on adequate monitoring to provide high quality data to be used in making
water management decisions and for tracking changes on the landscape.
Since that time, SEAWA and ESRD have been working in partnership to develop an Integrated Watershed
Management Plan (IWMP) for the South Saskatchewan River sub-basin. Key to the future progress of the
IWMP is a complete understanding of monitoring partners, their programs, data sources and information
gaps that are relevant to the watershed. (SEAWA - IWMP, 2013)
Review of Water Monitoring in the SEAWA Watershed
4
In November of 2012, SEAWA assembled many of the regional monitoring partners at a planning
workshop at Dinosaur Park where they provided details on their monitoring efforts. The workshop
information has been compiled and included in Appendix A.
This report will build on that work and provide a comprehensive summary of partners, programs, data
sources and gaps to assist in the development of a Long Term Monitoring Strategy for SEAWA.
3.0 HYDROLOGY
3.1 SEAWA – SOUTH SASKATCHEWAN RIVER (SSR) SUB-BASIN
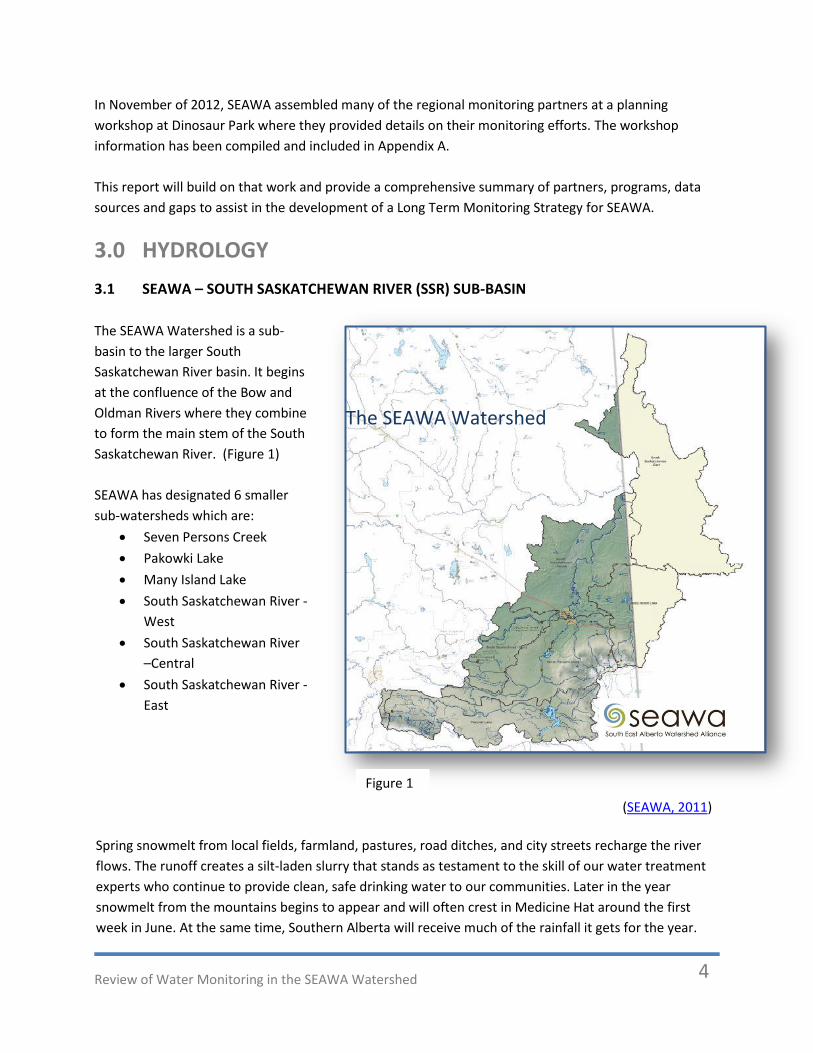
The SEAWA Watershed is a sub-
basin to the larger South
Saskatchewan River basin. It begins
at the confluence of the Bow and
Oldman Rivers where they combine
to form the main stem of the South
Saskatchewan River. (Figure 1)
SEAWA has designated 6 smaller
sub-watersheds which are:
Seven Persons Creek
Pakowki Lake
Many Island Lake
South Saskatchewan River -
West
South Saskatchewan River
–Central
South Saskatchewan River -
East
(SEAWA, 2011)
Spring snowmelt from local fields, farmland, pastures, road ditches, and city streets recharge the river
flows. The runoff creates a silt-laden slurry that stands as testament to the skill of our water treatment
experts who continue to provide clean, safe drinking water to our communities. Later in the year
snowmelt from the mountains begins to appear and will often crest in Medicine Hat around the first
week in June. At the same time, Southern Alberta will receive much of the rainfall it gets for the year.
The SEAWA Watershed
Figure 1
Review of Water Monitoring in the SEAWA Watershed
5
The combination of snowmelt and rainfall often raises concern about flooding. Depending on the
mountain snowpack, the Irrigation Districts may wait until the crest has passed and then begin diversion
into their works to replenish the reservoirs. These diversions will continue through the summer into the
fall often depending on the nature of the spring and summer rains.
However, the spring rains are not guaranteed and mountain snowpack can be quite variable. In the
south county, drought is never far from people’s mind. If it stays dry into the summer, diversions get
used to the fullest, and everyone is affected as river levels drop and calls for conservation abound.
3.2 TRIBUTARIES
There are several named creeks that originate from the north slope of the Cypress Hills and contribute
to the South Saskatchewan River. They include the Seven Persons, Ross, Bullshead, Gros-Ventre and
Piegan Creeks. Vegetative cover in these sub-watersheds is a mixture of cropped and stubble fields,
forage production, native grass and forest lands. Median annual runoff from the north slope of Cypress
Hills is some of the highest on the Prairies at approximately 30 - 50 dam3 /km2. (Bell & Cole, 2013)
The steeply sloping topography can generate significant erosive forces during runoff events as
evidenced in the flood of 2010. (Pentland, Abrahamson, & Wiens, 2011)
There are three sub-watersheds that contribute directly to the river. The most significant is the SEAWA
West sub-watershed which includes the main stem of the river between the Great Forks and the City of
Medicine Hat. The hydrology in the upland area of this sub-watershed is dominated by irrigation
structures and controls, operated by the St. Mary River Irrigation District (SMRID). The irrigation district
uses the natural drainage courses to provide outlets for their supply ditches and, as such, they provide
an important resource as they contribute the return flow directly to the river. This reach of the river
includes the City of Medicine Hat. (State of the Watershed, 2010)
3.3 NON-CONTRIBUTING OR CONFINED BASINS
Pakowki and Many Island Lakes are both non-contributing basins in that neither of them contributes
flow to the South Saskatchewan River. They comprise a significant area and are very much an entity in
themselves. Both of the basins have, in the past, seen significant development of private irrigation
schemes that rely solely on runoff from the local watershed. Due to the recent wet springs, the trend is
toward increasing water levels in both Pakowki Lake and Many Island Lakes.
3.4 GROUNDWATER
Groundwater is an important water source for rural residents and communities in the watershed. These
groundwater resources offer an enticing alternative to supplement surface water supplies but are poorly
understood by comparison. Regional aquifers include those in the Oldman (Belly River); Milk River
Sandstone and Medicine Hat Valley as well as numerous smaller infill and surficial formations. (Davison,
Dubord, & HCL, 2011)
Review of Water Monitoring in the SEAWA Watershed
6
4.0 REVIEW OF MONITORING PROGRAMS IN THE
SOUTH SASKATCHEWAN RIVER SUB-BASIN
(SEAWA WATERSHED)
HYDROMETRIC MONITORING Hydrometric monitoring refers to the collection of water flow data from rivers and streams and static
observations of lake levels. Data are collected in support of water management, water supply, river ice
break up and flood forecasting. Response to high water and other water-related emergency events are
also part of this program. The collection of hydrometric data is critical to the understanding of the
availability, variability and distribution of our water resources. The hydrometric network blanketing
Alberta provides data essential to informed decision-making for purposes such as flood risk, water
supply/approvals, International Joint Commission and trans-boundary agreements, State of the
Environment reporting and cumulative effects management. It is also the basis for a historical long-term
data archive used for modeling and other activities by a multitude of users. Emergency collection of
critical data during high water events help in the protection of communities at risk. (Hills, 2012)
4.1 ALBERTA ENVIRONMENT AND SUSTAINABLE RESOURCE DEVELOPMENT (ESRD)
The Alberta River Basins website (ESRD, 2013) provides maps, tables, charts and raw data for numerous
monitoring sources across the province. The web-page for the South Saskatchewan River sub-basin
currently includes:
River Flow and Levels
Lake and Reservoir Levels
Meteorological and Precipitation Data
Water Quality Data
Water Management and Operations
Reports
What is monitoring?
Monitoring: A scientifically-designed system of long-term, standardized
measurements, systematic observations, evaluation and reporting.
Surveillance: A focused, short-term study to assess and report on a priority
issue or specific threat.
Research: Systematic, science-based study used to establish facts and reach
conclusions.
(Environment Canada, 2010)
Review of Water Monitoring in the SEAWA Watershed
7
The Water Survey of Canada (WSC) is the national authority responsible for the collection, interpretation
and dissemination of standardized water resource data and information in Canada. In partnership with
the provinces, territories and other agencies, the WSC operates over 2,500 active hydrometric gauges
across the country. Environment Canada operates approximately 400 stations in the province of Alberta
on behalf of ESRD, as a result of a long-standing, co-management agreement between the two
organizations established in 1975. Site specific descriptions including UTM co-ordinates and related
hydrologic data are compiled in a spreadsheet attached as Appendix B. (Hills, 2012)
Using a sophisticated telecommunications system, water level and stream-flow conditions are reported
within hours of their measurement. The data are transmitted by satellite or by land-line directly from
the gauging station to regional data centres. Data transfer between the regional data centres and the
website occurs on a scheduled basis every hour. (Water Survey of Canada) While measurements are
somewhat delayed, for simplicity, this report will refer to these as real-time measurements.
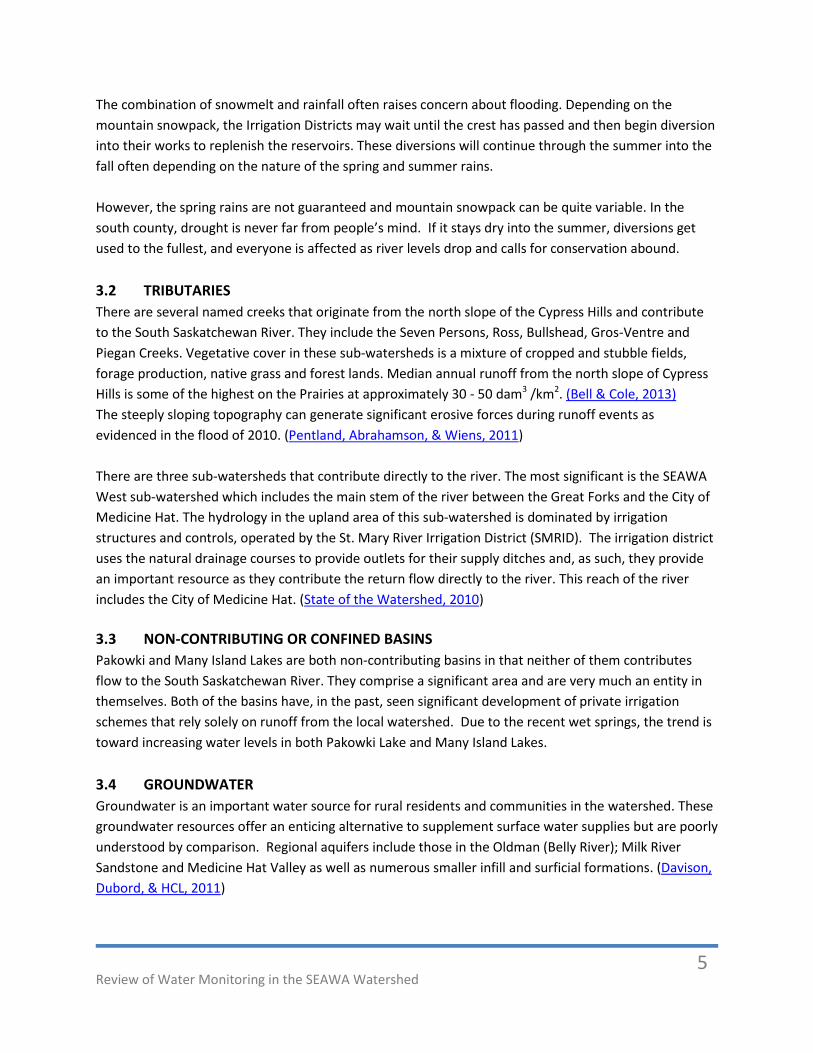
In SEAWA, there are 43 hydrometric stations of which 9 provide real-time hydrometric data. There are 8
stations on the tributaries and 1 station at Medicine Hat on the South Saskatchewan River. Flow
measurements at this station began in 1908, the year the Finlay Bridge was constructed. There are 103
years of historical flow record at this location and it continues to provide real time data from this site.
Figure 2
Real-Time Hydrometric
Stations in the
South Saskatchewan River
Sub-Basin
River and Stream Flows (ESRD, 2013)
Note: Manyberries Creek station
data is accessed from the Milk River
Basin web-page.
Review of Water Monitoring in the SEAWA Watershed
8
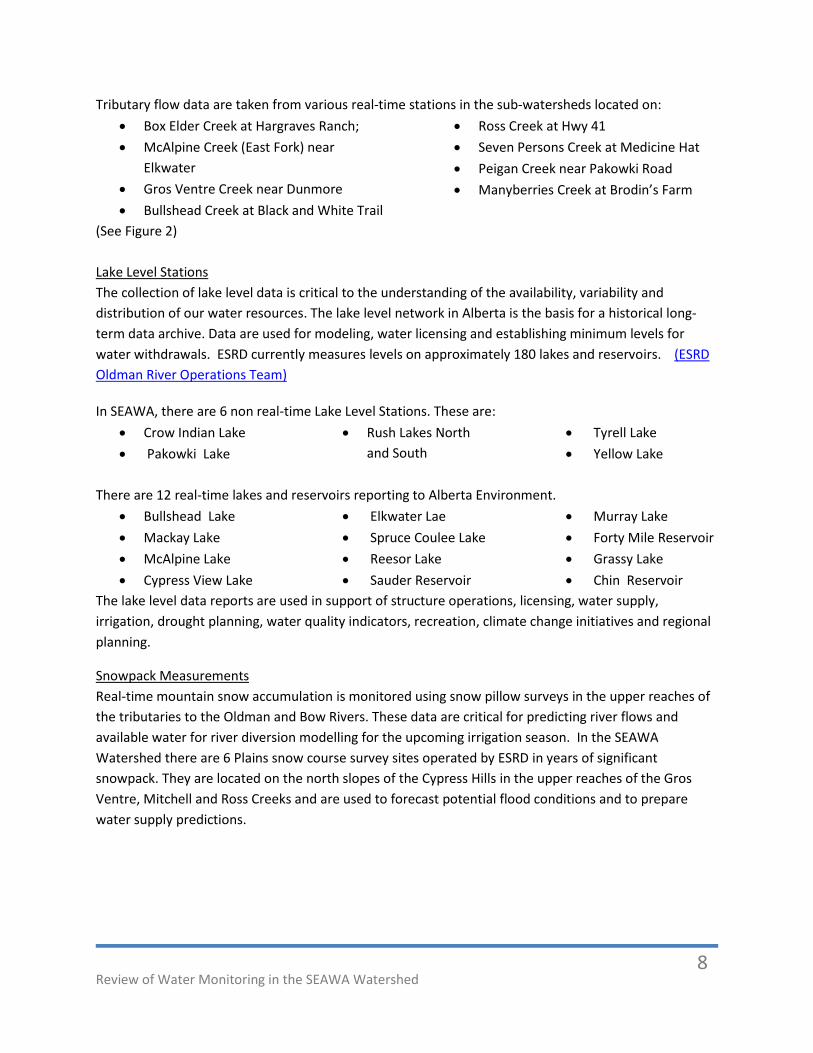
Tributary flow data are taken from various real-time stations in the sub-watersheds located on:
Box Elder Creek at Hargraves Ranch;
McAlpine Creek (East Fork) near
Elkwater
Gros Ventre Creek near Dunmore
Bullshead Creek at Black and White Trail
Ross Creek at Hwy 41
Seven Persons Creek at Medicine Hat
Peigan Creek near Pakowki Road
Manyberries Creek at Brodin’s Farm
(See Figure 2)
Lake Level Stations
The collection of lake level data is critical to the understanding of the availability, variability and
distribution of our water resources. The lake level network in Alberta is the basis for a historical long-
term data archive. Data are used for modeling, water licensing and establishing minimum levels for
water withdrawals. ESRD currently measures levels on approximately 180 lakes and reservoirs. (ESRD
Oldman River Operations Team)
In SEAWA, there are 6 non real-time Lake Level Stations. These are:
Crow Indian Lake
Pakowki Lake
Rush Lakes North
and South
Tyrell Lake
Yellow Lake
There are 12 real-time lakes and reservoirs reporting to Alberta Environment.
Bullshead Lake
Mackay Lake
McAlpine Lake
Cypress View Lake
Elkwater Lae
Spruce Coulee Lake
Reesor Lake
Sauder Reservoir
Murray Lake
Forty Mile Reservoir
Grassy Lake
Chin Reservoir
The lake level data reports are used in support of structure operations, licensing, water supply,
irrigation, drought planning, water quality indicators, recreation, climate change initiatives and regional
planning.
Snowpack Measurements
Real-time mountain snow accumulation is monitored using snow pillow surveys in the upper reaches of
the tributaries to the Oldman and Bow Rivers. These data are critical for predicting river flows and
available water for river diversion modelling for the upcoming irrigation season. In the SEAWA
Watershed there are 6 Plains snow course survey sites operated by ESRD in years of significant
snowpack. They are located on the north slopes of the Cypress Hills in the upper reaches of the Gros
Ventre, Mitchell and Ross Creeks and are used to forecast potential flood conditions and to prepare
water supply predictions.
Review of Water Monitoring in the SEAWA Watershed
9
SURFACE WATER QUALITY MONITORING
There is no single or simple measure of water quality. Depending on the need, water may be tested for a
few characteristics or numerous natural substances and contaminants. Analysis may be done by
collecting a representative water sample from a waterbody and sending it to a laboratory or it may be
analyzed immediately using hand-held electronic meters or kits.
Water quality sampling provides a snapshot in time but over many cycles it can be used to characterize
the nature of the waterbody and provide what is known as baseline data. Interpretation of this data is
used to identify issues or concerns and provides background for planning actions intended to mitigate
problems. Water quality is impacted by natural processes as well as anthropogenic (man-made)
influences or inputs. It may be from a one-time or recurring point source of contamination, or it may be
an event based input caused by rainfall or snowmelt. The inputs are interlinked with ongoing land-use
and as well as new development, both urban and rural.
Real-time reporting of certain water quality is possible using technology similar to that used to report
Water Survey of Canada flow data. For example, the U.S. Geological Survey (USGS) maintains
instruments that continuously record physical and chemical characteristics of the water including
turbidity, pH, specific conductance, temperature, dissolved oxygen, and percent dissolved-oxygen
saturation. Supporting data such as air temperature and barometric pressure are also available at some
sites. This data is compiled and subsequently posted on the USGS website as provisional data pending
validation. (US Geological Survey)
In the SEAWA sub-basin, monitoring will be useful as a planning tool to assess the environment,
understand risks, suggest a course of action, and monitor trends. It is important to fully understand and
define the objectives of any water quality monitoring program before data collection begins. An
excellent resource with information for designing water quality monitoring projects can found on the
AARD website. (Introductory Guide to Surface Water Quality Monitoring in Agriculture, 2006)
The Alberta River Water Quality Index
This index was developed as a way to summarize physical, chemical and biological data into a simple
descriptor of water quality. It provides a snapshot of annual water quality conditions in major rivers of
the province. Only data collected as part of the province's Long-term River Network are used to
calculate Index values. They are calculated annually to inform Albertans about how well anthropogenic
effects are managed. The Index is based on the average of four sub-indices using these four variable
groups:
Metals (up to 22 variables measured quarterly);
Nutrients (6 variables measured monthly);
Bacteria (2 variables measured monthly); and
Pesticides (17 variables measured 4 times during open-water season).
A complete list of parameters can be found on the Alberta ESRD website. (Alberta River Water Quality
Index)
Review of Water Monitoring in the SEAWA Watershed
10
In February 2010, Alberta ESRD released the draft version of "The Water Quality Management
Framework (WQMF) for the South Saskatchewan Regional Plan". For SEAWA, this framework establishes
reach-specific thresholds for water quality in two main-stem river reaches for the South Saskatchewan
River. SEAWA has identified Water Quality Triggers and Limits and has summarized them in the
SEAWA – State of Watershed Report. (SEAWA, 2010)
The Long Term River Network (LTRN)
The LTRN consists of 29 sites located on large provincial rivers, often above and below major population
and activity centres. The network has been in operation since the late 1970’s and has evolved over time.
It provides a reliable long-term data set that is useful in understanding the dynamics of aquatic
ecosystems and human impacts and provides input data for predictive water quality modelling. The
provincial database is accessible to the public from the ESRD website. (Long Term River Network)
There is one LTRN site on the South Saskatchewan River at Medicine Hat. There are also LTRN sites
upstream of the confluence; on the Oldman River at Highway 36 Bridge and on the Bow River at the
Ronalane Bridge on Highway 524.
In the spring of 2012 sampling began at a site on the South Saskatchewan River immediately
downstream of the City of Medicine Hat to evaluate the impacts of the city activities. At this time, the
site is not considered part of the LTRN. Over time, as more data is collected and trends are identified,
SEAWA may want to consider providing rationale to support the inclusion of this site in the LTRN.
Sampling will continue in 2013.
There has never been a Synoptic Survey completed for the lower reach of the South Saskatchewan
River. A synoptic survey is one in which water samples are collected according to river travel time, so
the same portion of water is sampled as it flows down river. This allows researchers to assess the source
and relative load of contaminants entering the river. Synoptic surveys in the basin have been conducted
on the Bow River in 1995-1996 (Sosiak, 1994-1995) and the Oldman River in 1998, 2000 and 2005.
(Saffran, 2005). For the first time ever, a basin wide synoptic survey is planned for August 2013. It will
include the Bow, Oldman, Red Deer and South Saskatchewan Rivers.
Tributary Water Quality
In 2011, monthly sampling was begun on Seven Persons Creek and Ross Creek at locations near their
mouths in the City of Medicine Hat. These sites are sampled year-round, for a wide range of water
quality variables including instantaneous field measurements (pH, temperature, dissolved oxygen,
conductivity), major ions, suspended and dissolved solids. Dissolved and total metals and ultra trace
total mercury are sampled 6 times a year. Pesticides will be sampled from May to August. Sampling will
continue in 2013/2014. After validation the data will be posted to the ESRD Inventory of Sampling
Locations and Water Quality Data (ESRD Water Quality Data). Requests for additional data can be made
to ESRD. Future monitoring work on the tributaries may include a synoptic survey of important indicator
parameters or implementing an event-based sampling program.

Review of Water Monitoring in the SEAWA Watershed
11
Since 1992, Cows and Fish -The Alberta Riparian Management Society has been promoting
improvements in grazing and management of riparian areas with the goal of enhancing landscape health
and productivity. Their hands-on approach uses riparian health assessments as a powerful tool to
demonstrate and educate the public on the benefits of healthy riparian area function. In SEAWA, there
are 32 sites identified of which, 21 are located in the Seven Persons Creek sub-basin (Riemersma &
Andrews, 2007). There is 1 assessment which was commissioned by SEAWA. Future work for SEAWA
may include hiring Cows and Fish staff to develop a more complete data-set of those assessments to
better characterize current riparian conditions in the tributaries.
Water Quality Monitoring in Lake and Reservoirs In 2011, ESRD sampled Rattlesnake (Sauder) Reservoir and in the following year sampling was moved to
Murray Lake. Sampling was conducted 3 to 5 times during the open water season, involving the
collection of a composite epilithic sample from about 10 places in the lake. Data are mainly collected on
major ions and nutrients, with a focus on assessment of trophic status. A temperature / dissolved
oxygen profile is usually also done in the waterbody near its deepest point. Sampling is expected to
continue in 2013 at Forty Mile Reservoir.
GROUNDWATER MONITORING
Groundwater Levels The Groundwater Observation Well Network (GOWN) is an ESRD owned network of groundwater
monitoring wells located in various aquifers throughout the province. Most of these wells are fitted with
specialized electronic equipment that continually record groundwater levels. Regional employees from
ESRD maintain the wells, take manual readings, down-load the loggers and validate the data.
Management staff review the data coming in from the regions, update the provincial database and post
data to the internet.
There are currently 7 GOWN wells with level and quality in SEAWA boundaries:
Forty Mile Coulee 86-1
Pakowki 85-1
Ross Creek 2286E and 2288E
Elkwater 2294E
Foremost Farm 954
Cypress 85-1.
Details on each of the wells and views of the historical levels can be viewed from ESRD’s website.
(GOWN - Groundwater Observation Well Network)
The Alberta Water Well Information Database contains 500,000 water well drilling reports. The reports
may include site specific information on lithology, well construction, groundwater quality, groundwater
elevation and pump test results. Baseline water well test reports have recently been added to the
database. It is unknown how many records pertain to the SEAWA Watershed. (ESRD - Waterwell
Information Database)
Groundwater Quality Groundwater quality monitoring by AENV was initiated in the 1980s and has continued intermittently
until the mid-1990s. Sampling recommenced in 2006 with 30-40 wells sampled annually across the
province and 165 wells were sampled over a 5 year period. The wells are to be sampled every 5 years to
Review of Water Monitoring in the SEAWA Watershed
12
monitor long-term trends. There are another 6 GOWN wells sampled for quality within the SEAWA
boundary.
Hilda East
Hilda West
Many Island Lake North
Many Island Lake South
Medicine Hat North
Suffield 85-1
Variables include major ions, metals, hydrocarbons, nutrients, pesticides, bacteria and gas compounds.
Data can be requested from ESRD.
ESRD also has sporadic data collected from regulated municipal groundwater supply wells within the
area. The majority of these data are held by the respective municipality. Additional water quality data
may be associated with Well Driller Reports and archived in the Water Well Information Database.
4.2 IRRIGATION DISTRICTS
Flow Monitoring in Irrigation Districts
The St. Mary River Irrigation District (SMRID) provides water in two separate blocks within the SEAWA
Watershed. The Central block consists of the Grassy Lake, Burdett, and Bow Island areas, with an
assessed irrigable area of 62,090 ha. The Eastern Block includes the Medicine Hat and Seven Persons
areas with an assessed area of 27,573 ha. (SMRID Annual Report, 2011) In addition, the Ross Creek
Irrigation District (RCID) diverts out of Gros Ventre Creek into Cavan Lake. The RCID provides irrigation
water to 446 ha.
The Irrigation Districts carefully monitor water use and delivery through their system. In order to
increase delivery efficiency the districts are using Supervisory Control and Data Acquisition (SCADA)
systems. With SCADA, they are able to remotely regulate flow across the entire network of
infrastructure. Diversion into and return flow out of the irrigation works is carefully monitored and
reported to ESRD. These return flow data are accounted in annual water budget calculations.
Water Quality in Irrigation Districts
Alberta Agriculture and Rural Development (AARD) – Irrigation and Farm Water Division, is conducting a
multi-year study from 2011-2015 to assess the water quality of the 11 Irrigation Districts in the South
Saskatchewan River Basin in Alberta. This project re-visits sites established from two previous years of
Irrigation water quality sampling in 2006-2007. (AARD- Irrigation Full Report, 2012)
Approximately 90 sites within Alberta's 13 irrigation districts are sampled. The sites include source
water diversion locations, sites within the delivery system, return flow sites as well as river sites
upstream and downstream of irrigation outfalls. Samples are collected four times per year during the
irrigation season (June to September) and analyzed for more than 155 parameters including:
Nutrients
Salinity
Biological
Metals
Pesticides
Review of Monitoring in the SEAWA Watershed
13
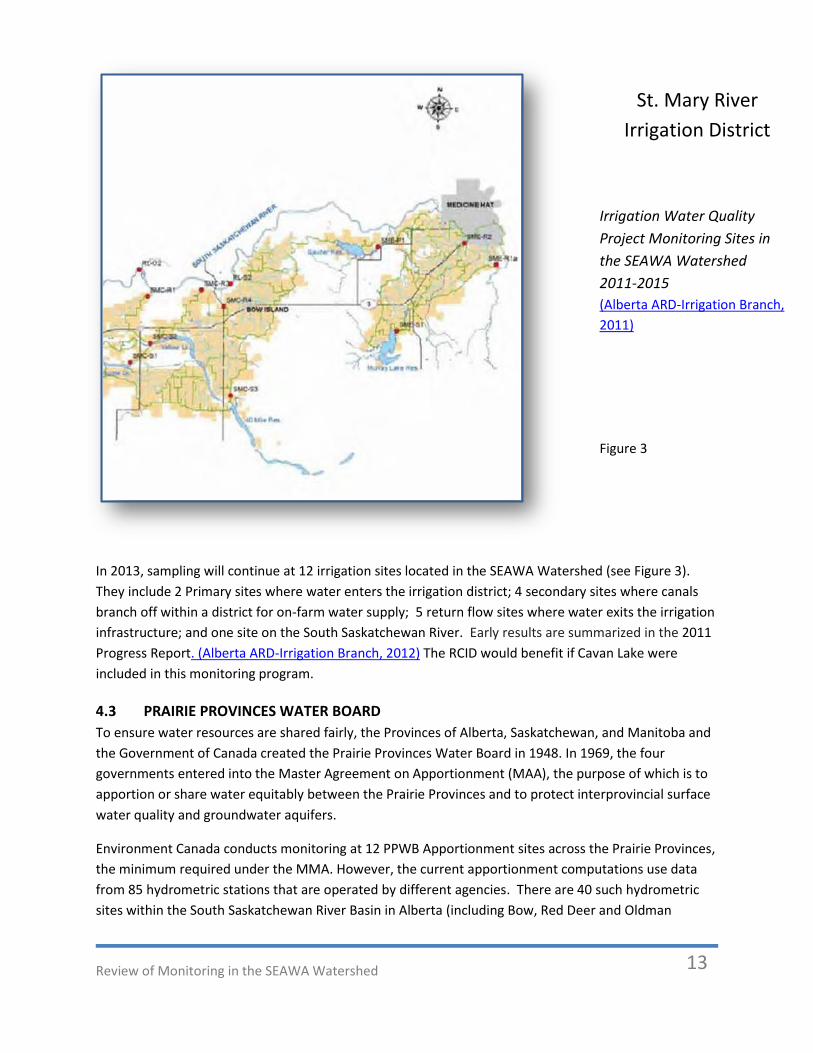
In 2013, sampling will continue at 12 irrigation sites located in the SEAWA Watershed (see Figure 3).
They include 2 Primary sites where water enters the irrigation district; 4 secondary sites where canals
branch off within a district for on-farm water supply; 5 return flow sites where water exits the irrigation
infrastructure; and one site on the South Saskatchewan River. Early results are summarized in the 2011
Progress Report. (Alberta ARD-Irrigation Branch, 2012) The RCID would benefit if Cavan Lake were
included in this monitoring program.
4.3 PRAIRIE PROVINCES WATER BOARD
To ensure water resources are shared fairly, the Provinces of Alberta, Saskatchewan, and Manitoba and
the Government of Canada created the Prairie Provinces Water Board in 1948. In 1969, the four
governments entered into the Master Agreement on Apportionment (MAA), the purpose of which is to
apportion or share water equitably between the Prairie Provinces and to protect interprovincial surface
water quality and groundwater aquifers.
Environment Canada conducts monitoring at 12 PPWB Apportionment sites across the Prairie Provinces,
the minimum required under the MMA. However, the current apportionment computations use data
from 85 hydrometric stations that are operated by different agencies. There are 40 such hydrometric
sites within the South Saskatchewan River Basin in Alberta (including Bow, Red Deer and Oldman
St. Mary River
Irrigation District
Irrigation Water Quality
Project Monitoring Sites in
the SEAWA Watershed
2011-2015
(Alberta ARD-Irrigation Branch,
2011)
Figure 3
Review of Water Monitoring in the SEAWA Watershed
14
Rivers). In the SEAWA Watershed the PPWB operates one site located at Highway 41 at the Sandy Point
Bridge. Data on both flow and quality are acquired at the site. The data are summarized and evaluated
in Prairie Provinces Water Board Annual Reports available on the website. Specific raw data may be
available upon request. (PPWB Annual Reports)
4.4 CITY OF MEDICINE HAT Regional Drinking Water
The South Saskatchewan River is the source of raw water for the City of Medicine Hat. Water quality in
the river fluctuates on a seasonal basis, normally resulting in water quality variables in the following
ranges:
Turbidity 1 to 3,000 NTU
pH 7.6 to 8.8
Total Hardness 130 to 270 mg/l (7.6 to 15.8 grains)
Alkalinity 120 to 240 mg/l
Temperature 2 to 32 Celsius
(City of Medicine Hat, 2013)
The water treatment plant has recently expanded and is now able to meet the water demand for 75,000
customers. The City provides drinking water to the Village of Dunmore and the Hamlet of Seven Persons
and numerous farms along the way. Basic raw water parameters are monitored on a regular basis.
As a drinking water supply, the City of Medicine Hat has a vested interest in maintaining a high quality
water source, and in keeping the river flow volumes high enough to minimize the impact of unwanted
substances in the water. A complete understanding of the In Stream Flow Needs (ISFN) becomes even
more critical in times of drought or when the City starts to consider an approach to take in adapting to
changing climatic conditions. Common adaptation options for the water resources sector all represent
‘no-regrets’ adaptation options, meaning that their implementation would lead to benefits irrespective
of the effects of climate change.
These include:
Water conservation measures;
Improved planning and preparedness for droughts and severe floods;
Improved water quality protection from cultural, industrial and human wastes;
Enhanced monitoring efforts; and
Improved procedures for equitable allocation of water
(Sanford & et.al., 2011)
Trace Organics Research Project
In 2010, Medicine Hat College student Morgan Basiuk researched and reported on the issues
surrounding pharmaceuticals in water. A draft project report posted on the SEAWA website. (Basiuk,
2010)
Subsequently, in 2012, Rachel Brown joined Morgan Basiuk and a project was undertaken related to
Review of Water Monitoring in the SEAWA Watershed
15
these and other trace organic compounds in water. Co-sponsored by SEAWA, the Alberta Association of
Colleges and Technical Institutes (AACTI), the City of Medicine Hat, Hyperion Research Ltd. and a private
donation, the objective was to evaluate a methodology for the determination of several chemicals in
water samples using Enzyme-Linked Immunosorbent Assay (ELISA) kits. The chemicals in question were
linked to pharmaceuticals, personal care products, industrial chemicals and other known endocrine
disruptors.
In 2012, samples were evaluated from Seven Persons Creek, Ross Creek, the South Saskatchewan River,
waste-water treatment plant (influent and effluent), tap water, and de-ionized water using the ELISA
kits. Compounds of interest have been compared to previous research and full reports were created on
alkylphenols, sulfamethazine, sulfamethoxazole, glyphosates, benzo(a)pyrene) and triclosan. Partial
reports were created on estrogens, ethinylestradiol, testosterone, avermectins, 2,4-D, microcystins and
carbamates. With funding, future work will continue in 2013 with samples from the sites evaluated with
standard Mass Spectrometry/Gas Chromatography to further validate the ELISA method.
4.5 MUNICIPAL WATER QUALITY MONITORING
Various acts and codes of practice, administered by ESRD, necessitate a substantial and wide range of
monitoring activities including those required by approvals and licensing. In all cases, operations of the
water systems are guided by an Approval to Operate issued by ESRD for that specific source and
associated works. (ESRD-Approval Viewer)
Water Supply
There are numerous water sources and treatment systems operated by the municipalities. In addition to
the City of Medicine Hat, raw water quality is monitored by the towns, villages and hamlets in Cypress
County and the County of Forty Mile.
Surface water sources serve the City of Medicine Hat; Towns of Redcliff and Bow Island;
Hamlets of Walsh and Seven Persons.
Groundwater sources serve the Town of Foremost; Villages of Elkwater, Empress and
Manyberries; Hamlets of Irvine, Schuler, Hilda, Nemiskam and Etzikom.
Raw water sampling requirements vary, depending on the source but generally require analysis of
turbidity on a daily basis and Escherichia coli on a weekly basis or more frequently where the source is
considered vulnerable. Operation of the waterworks system is carried out by a qualified Water
Treatment and Distribution System Operator. The approval also specifies the monitoring, reporting and
potential remedial action that may be required by the approval holder as a condition to operate the
water supply system. In most cases, the requirements are based on Canadian Drinking Water Quality
Guidelines.
Wastewater Treatment
All municipal treatment systems, whether a village lagoon or the City of Medicine Hat wastewater
treatment plant, are subject to terms and conditions specified in their specific Approval to Operate
issued by ESRD. The City of Medicine Hat wastewater stream is evaluated throughout the treatment

Review of Water Monitoring in the SEAWA Watershed
16
process which includes solid separation, microbial phosphorus removal and UV disinfection. The
majority of the final effluent is discharged into the South Saskatchewan River by means of a submerged
diffuser system. Other municipal wastewater systems are subject to ESRD operational requirements
that regulate their release into the environment. The fate of these wastewater releases from other
municipal or industrial treatment systems may not be well documented and need further evaluation in
the future.
In 2012, a preliminary survey of the South Saskatchewan River from the Highway 879 Bridge to 2.5
kilometers downstream of Medicine Hat, identified 29 locations of potential point source outfalls.
(Hilden, 2012) The sites are a combination of treated wastewater and untreated storm-water outfalls.
This information will prove useful in planning a synoptic survey of river water quality.
4.6 INDUSTRIAL WATER USERS
The amount of water that is allocated to be diverted for industrial use is specified on the water licence
granted and administered by ESRD. The amount of water actually used is reported annually to ESRD. If
there is a waste flow from the industrial process it will be subject to approval with treatment and
monitoring requirements specified on the ESRD Approval document. Although waste outfall locations
are identified in ESRD documentation, future work may be required to evaluate and map the actual
outfall locations. (ESRD - Licence Viewer)
Oil and gas operations typically access water through a Temporary Diversion Licence issued by ESRD that
regulates the quantity of water that may be diverted for each specific case. Conditions of each licence
describe the volume and rate of withdrawal taking into consideration the activity, when the water is
required and where withdrawal is coming from. Where possible, saline groundwater is pumped from
below the Base of Groundwater Protection and after use in the drilling process, the water is usually
returned to the same or deeper formation. The quantity of water used is documented and reported to
ERCB. Return flow to surface water is negligible.
Oil and gas development is regulated by ERCB under the following regulations:
Directive 056: Energy Development and Applications Schedules
Directive 050: Drilling Waste Management (ERCB)
During pipeline installation, every effort is made to manage the development. Some impact to surface
water may be involved in routine tasks such as horizontal directional drilling, the open cut of seasonally
inundated drainages, and discharge of hydrostatic test water (used to pressure test pipelines). These
risks are primarily associated with inadequate erosion and sediment control measures near drainages.
Drilling fluid, made up inert polymers, clay and water, may pose a siltation risk to surface water from
improper onsite disposal of drill fluid, activities such as land-spreading on an area with gradient, or sump
containment that is overwhelmed. These construction-related impacts on the watercourse or wetland
are effectively mitigated with proper attention to industry recognized best management practices and
risk management. ERCB monitors these projects and holds the data or reports, although they may also
Review of Water Monitoring in the SEAWA Watershed
17
be held by the operator. Certain data may be available upon specific request.
4.7 AGRICULTURAL WATER USERS
Aside from irrigation, water allocated for agriculture is primarily for stock watering use. Depending on
the management practice, livestock operations may have a variety of impacts on surface water sources.
Of primary concern are elevated nutrient and bacterial contaminants from manure management
practices.
It is important to establish a baseline level of these contaminants to set achievable targets and to track
progress on improving management practices in the watershed. (A Primer on Water Quality:
Agricultural Contaminants, 2002)
5.0 DISCUSSION
5.1 GAPS and RECOMMENDATIONS
Baseline data is not adequate to enable the development of Water Quality objectives and indicators
for the tributaries.
Recent sampling by ESRD on the tributaries should continue.
The monitoring program should be expanded to include event based sampling.
Consider evaluating Total Phosphorus loading.
Consider having Cows and Fish compile assessment results for the tributaries.
The monitoring site on the river downstream of Medicine Hat is not considered part of the LTRN.
Evaluate the need for an additional LTRN site downstream of Medicine Hat.
Trace Organic results need to be evaluated to select a suite of key analytes as potential indicators, and
to better understand their seasonal variation.
Continued support of the validation project to target a predictable suite of analytes and plan
for tech transfer of ELISA testing to the City.
Conduct an analysis of results related to seasonal variation and eventually trends.
There is a shortage of information on the water quality needs or objectives for stakeholders such as
industry, oil and gas sector, greenhouse operators, rural raw water pipelines, City of Medicine Hat
Parks department, on-farm water and others.
This will form part of the discussion SEAWA will take to stakeholders related to engagement
on the IWMP.
There is a lack of information on the location and quality associated with wastewater outfalls,
municipal waste treatment systems, storm drains and natural drainage courses.
Research and document outfalls and associated operating requirements from ESRD.
Review of Water Monitoring in the SEAWA Watershed
18
Research and report on the correlation and consequence of return flow from Calgary WWTP
into the Bow River compared to Lethbridge WWTP into the Oldman River.
Water quality data on the river are not collected in real-time. Real-time water quality data would
enable a comparative analysis of the seasonal relationship between river flow and water quality.
Install a data sonde upstream of the City.
Plan to conduct the comparative analysis of the City’s In Stream Flow Needs in the future.
Water quality data sets may need to be more accessible
It would be useful for SEAWA to develop a further compilation of data types, sources,
providers and contacts to be posted to their website.
This may also include important data sets that might serve to advance future SoW work.
5.2 ENGAGEMENT OPPORTUNITIES
Monitoring may provide opportunities for engagement. Rural residents take pride in their stewardship
role and understand the value of maintaining the land and water for future generations. Discussions can
take place around the issues and improve linkages with key rural stakeholders.
The urban message should describe the importance of the river and promote stewardship as a way of
life in Medicine Hat. SEAWA can help show the way by continuing to celebrate the river and act as a
conduit for discussion while providing key resources for education and outreach. For example, SEAWA
and partners may consider supplying simple water quality testing kits to allow residents, both rural and
urban, to participate in a Citizen Science type of monitoring project.
Engagement activities in 2013/2014 related to monitoring will include :
Hosting an additional workshop to build on the successful water monitoring workshop held in
October 11, 2012;
Collaborating with provincial water monitoring agencies (development of targets, management
implications, monitoring and data acquisition);
Engaging rural municipality decision-makers (including Irrigation Districts);
Engaging rural water users through discussion of needs, interests, and issues to encourage
Beneficial Management Practices and related monitoring; and
Engaging urban leaders and Watershed Stewardship Groups to determine needs regarding
urban water quality.
5.3 LONG TERM MONITORING STRATEGY
Monitoring-related planning, data collection and analysis will be key activities this coming year as
directed in the IWMP Terms of Reference. As a result, a monitoring strategy will be developed to define
the purpose and scope of monitoring, provide direction for future monitoring throughout the
watershed, and clarify roles and responsibilities for key stakeholders. (Introductory Guide to Surface
Review of Water Monitoring in the SEAWA Watershed
19
Water Quality Monitoring in Agriculture, 2006)
The Monitoring Plan will include the:
Identification and prioritization of data gaps in SEAWA’s six sub-watersheds;
Identification of water quality issues relating to tributaries, and relevant indicators to be monitored; and
Methodology for the collection of qualitative information regarding tributaries from rural residents and land owners.
The IWMP workplan has identified opportunities to advance the development of a monitoring plan
mainly through the involvement of the SEAWA Technical Committee (TC). In response to engagement
activities, the TC will provide input into data gap discussion and issue identification. With this in hand,
the TC would direct the development of the long-term monitoring strategy with the goal of having a
draft strategy to present to the board by the end of 2013. (SEAWA - IWMP, 2013)
6.0 CONCLUSION In the SEAWA Watershed, Alberta Environment and Sustainable Resource Development (AESRD) in
partnership with Water Survey of Canada (WSC) are monitoring stream flow and water levels and
posting the real-time data, along with a large selection of other related data, on their respective web-
sites.
ESRD conducts water quality monitoring in conjunction with the Long Term River Network, 2 recently
established sites on the tributaries, and the Groundwater Observation Well Network. Other water
quality monitoring includes work in the Irrigation Districts by Alberta Agriculture and Rural Development
(AARD); river sampling done by the Prairie Provinces Water Board; operational monitoring by the City of
Medicine Hat water and wastewater treatment plants; monitoring for research into trace organic
compounds and; monitoring related to various regulatory needs in municipal and industrial operations.
Some raw data are archived on the AESRD website but much is held by other agencies and referenced in
various reports.
Since the 1990’s and the upgrades to Calgary and Lethbridge treatment facilities, raw water quality in
the river has markedly improved. However, there are still challenges on the horizon. Nutrient runoff
from snowmelt and flood events can be very significant. Information on the tributaries is lacking and
the impact of outfalls into the main-stem river is unknown as are issues related to trace organic
contaminants. Underpinning all this is the need to understand the long term security of the South
Saskatchewan River as a water supply in light of in-stream flow needs. Thoughtful, well-planned
monitoring programs can help us identify and prioritize issues, engage the residents of the watershed,
suggest solutions and track changes as the basis for a logical way forward.
Review of Water Monitoring in the SEAWA Watershed
20
7.0 REFERENCES Note: Hyperlinks to all reference material are summarized in Appendix B
Alberta ARD. (2002). Retrieved from A Primer on Water Quality: Agricultural Contaminants:
http://www1.agric.gov.ab.ca/$department/deptdocs.nsf/all/wat3347
Alberta ARD. (2006). Introductory Guide to Surface Water Quality Monitoring in Agriculture. Retrieved
from http://www1.agric.gov.ab.ca/$department/deptdocs.nsf/all/wat2417#fundamentals
Alberta ARD-Irrigation Branch. (2011). Water Quality Site Descriptions Appendix A. Retrieved from
http://www1.agric.gov.ab.ca/$Department/deptdocs.nsf/all/irr14080/$FILE/idwqp_2011_2015
_appendixa.pdf
Alberta ARD-Irrigation Branch. (2012). AARD- Irrigation Full Report. Retrieved from AARD:
http://www1.agric.gov.ab.ca/$Department/deptdocs.nsf/all/irr14080/$FILE/idwqp_2011progre
ss_summary_report.pdf
Alberta Department of Municipal Affairs. (n.d.). Alberta Population Lists 2000-2012. Retrieved from
http://municipalaffairs.gov.ab.ca/mc_official_populations.cfm
Alberta ESRD. (2012, March). Environmental Monitoring in Alberta. Retrieved from
http://environment.alberta.ca/03379.html
Alberta ESRD. (2013). River and Stream Flows. Retrieved from Advisories and Monitoring:
http://environment.alberta.ca/apps/basins/default.aspx?Basin=11
Alberta ESRD. (n.d.). Alberta River Water Quality Index. Retrieved from
http://environment.alberta.ca/01275.html
Alberta ESRD. (n.d.). ESRD - Licence Viewer. Retrieved from
http://ssrb.environment.alberta.ca/licence_viewer.html
Alberta ESRD. (n.d.). ESRD - Waterwell Information Database. Retrieved from
http://www.envinfo.gov.ab.ca/GroundWater/
Alberta ESRD. (n.d.). ESRD Water Quality Data. Retrieved from
http://environment.alberta.ca/01288.html
Alberta ESRD. (n.d.). ESRD-Approval Viewer. Retrieved from http://environment.alberta.ca/01519.html
Alberta ESRD. (n.d.). GOWN - Groundwater Observation Well Network. Retrieved from
http://environment.alberta.ca/apps/GOWN/Default.aspx
Alberta ESRD. (n.d.). Long Term River Network. Retrieved from
http://envext02.env.gov.ab.ca/crystal/aenv/viewreport.csp?RName=River%20Network%20Stati
Review of Water Monitoring in the SEAWA Watershed
21
on%20Water%20Quality%20Data
Alberta ESRD Oldman River Operations Team. (n.d.). Water Management Operations Report. Retrieved
from http://www.environment.alberta.ca/forecasting/wmo_reports.html
Basiuk, M. (2010). Information on Pharmaceuticals . Retrieved from SEAWA:
http://www.seawa.ca/reports/SEAWA Watershed Report 2010-10 In Our Water.pdf
Bell, G., & Cole, A. (2013). PPWB. Retrieved from Annual Unit Runoff Study - 2013:
http://www.ppwb.ca/uploads/document/files/national-annual-unit-runoff-study-presentation-
at-prairie-hydrology-workshop_january-29-2013-en.pptx
City of Medicine Hat. (2013). Utilities. Retrieved from http://www.medicinehat.ca/index.aspx?page=574
Davison, R., Dubord, M., & HCL. (2011). Groundwater Summary - SEAWA Watershed. Retrieved from
State of Watershed Report:
http://www.seawa.ca/index.php?option=com_docman&task=doc_download&gid=40&Itemid=
Environment Canada. (2010, December ). Retrieved from Federal Oil Sand Advisory Panel:
http://www.ec.gc.ca/pollution/default.asp?lang=En&n=E9ABC93B%E2%80%901
Hills, B. (2012). AESRD Monitoring Workshop.
Hilsden, K. (2012). The Impact of Surface Water Diversion...South Saskatchewan River Basin. SEAWA.
http://www.seawa.ca/index.php?option=com_content&view=article&id=272&Itemid=197
Pentland, R., Abrahamson, B., & Wiens, L. (2011). Maple Creek (Bigstick Lake Watershed) June, 2010 Flood
http://www.google.ca/url?sa=t&rct=j&q=&esrc=s&frm=1&source=web&cd=1&cad=rja&ved=0CDI
QFjAA&url=http%3A%2F%2Fwww.gov.sk.ca%2Fadx%2Faspx%2FadxGetMedia.aspx%3FmediaId%3
D1339%26PN%3DShared&ei=iHZxUY2LMK-
o4APZ1YDYBw&usg=AFQjCNERB63dNq_TQ1Yw6tqgOkO6X6Yx9w&bvm=bv.45373924,d.dmg
PPWB. (n.d.). PPWB Annual Reports. Retrieved from http://www.ppwb.ca/documents/47/index.html
Prairie Provinces Water Board. (n.d.). Interprovincial Allocation. Retrieved from PPWB.
http://www.ppwb.ca/uploads/document/files/ppwb-annual-report-2010-final-en.pdf
Riemersma, S., & Andrews, S. (2007, march). Overview of Riparian Assessments. Retrieved from Cows
and Fish.org:
http://www.cowsandfish.org/publications/documents/OverviewofRiparianHealthAssessmentsa
ndOtherEvaluations2007report031.pdf
Saffran, K. A. (2005, January). Oldman River - Surface Water Quality Summary Report. Retrieved from
http://oldmanbasin.org/assets/files/Publications/orbwqi_swq_98-03.pdf

Review of Water Monitoring in the SEAWA Watershed
22
Sanford, B., & et.al. (2011). Climate Change Adaptation and Water Governance. Retrieved from Simon
Fraser University, Adaptation to Climate Change Team: http://act-adapt.org/wp-
content/uploads/2011/06/09-11-Water-Background-Report-WEB.pdf
SEAWA. (2010). State of the Watershed. Retrieved from
http://www.seawa.ca/index.php?option=com_content&view=article&id=116&Itemid=113
SEAWA (2013). SEAWA Integrated Watershed Management Plan. Retrieved from
http://www.seawa.ca/index.php?option=com_content&view=article&id=282&Itemid=206
SEAWA. (2011). State of the Watershed: Summary Report. Retrieved from
http://www.seawa.ca/reports/SEAWABookletMarch20.pdf
SMRID. (2011). SMRID Annual Report. Retrieved from
http://www.smrid.ab.ca/SMRID%20Annual%20Report%202010.pdf
Sosiak, A. (1994-1995, 2001). Bow River Synoptic Surveys. Retrieved from Bow River Watershed Council:
http://environment.gov.ab.ca/info/library/7902.pdf
US Geological Survey. (n.d.). Water Quality Data. Retrieved from http://waterdata.usgs.gov/nwis/qw
Water Survey of Canada. (n.d.). The Water Office - Realtime River Flow . Retrieved from
http://www.wateroffice.ec.gc.ca/index_e.html
SEAWA Project funding provided by


![Flood Risk Review Meeting: [Watershed Name]](https://img.pdfslide.net/doc/110x75/5681615f550346895dd0eac4/flood-risk-review-meeting-watershed-name-56cb8e5ebc6c2.jpg)