Embed Size (px)
Citation preview
Faisal et al. EURASIP Journal on Bioinformatics andSystems Biology (2015) 2015:3 DOI 10.1186/s13637-015-0022-9
REVIEW Open Access
The post-genomic era of biologicalnetwork alignmentFazle E Faisal1,2,3, Lei Meng1, Joseph Crawford1,2,3 and Tijana Milenkovic1,2,3*
Abstract
Biological network alignment aims to find regions of topological and functional (dis)similarities between molecularnetworks of different species. Then, network alignment can guide the transfer of biological knowledge fromwell-studied model species to less well-studied species between conserved (aligned) network regions, thuscomplementing valuable insights that have already been provided by genomic sequence alignment. Here, we reviewcomputational challenges behind the network alignment problem, existing approaches for solving the problem, waysof evaluating their alignment quality, and the approaches’ biomedical applications. We discuss recent innovativeefforts of improving the existing view of network alignment. We conclude with open research questions incomparative biological network research that could further our understanding of principles of life, evolution, disease,and therapeutics.
Keywords: Biological network research; Protein-protein interactions; Network alignment; Across-species knowledgetransfer; Functional orthology; Aging
ReviewIntroductionBioinformatics research has revolutionized our under-standing of cellular functioning. The field has openedavenues to unveil complex biological mechanisms andtheir connections to disease. Genomic sequence align-ment, in particular, has improved our biomedical knowl-edge by finding sequence regions of similarities betweengenes in different species, where the regions likely reflectfunctional and evolutionary relationships between thesequences [1–4]. However, genes or their protein productsdo not function in isolation; rather, they carry out cellu-lar processes by interacting with each other. This is whatbiological networks model, such as protein-protein inter-action (PPI), gene regulatory, or metabolic networks. Ina biological network, nodes represent biomolecules (suchas genes or proteins), and edges represent physical orfunctional interactions between the biomolecules (suchas PPIs). For simplicity, henceforth, we use terms “gene”
*Correspondence: [email protected] of Computer Science and Engineering, University of NotreDame, Notre Dame, IN 46556, USA2Interdisciplinary Center for Network Science and Applications, University ofNotre Dame, Notre Dame, IN 46556, USAFull list of author information is available at the end of the article
and “protein” interchangeably. Unlike genomic sequenceresearch, biological network research allows for studyingcomplex cellular processes that emerge from the collectivebehavior of the biomolecules.Due to advancements in high-throughput biotechnolo-
gies (such as yeast two-hybrid (Y2H) assays [5] or affin-ity purification coupled to mass spectrometry (AP/MS)[6]), large-scale PPI and other network data have becomeavailable for many species [7–16]. Given the availabilityof the interactome data, network research is promis-ing to further our understanding of processes of life,evolution, and therapeutics. In particular, analogous togenomic sequence alignment, biological network align-ment aims to find good node mapping between networksof different species that identifies topologically and func-tionally similar (i.e., conserved) network regions. Then,network alignment can be used to efficiently transferthe knowledge of cellular functioning from well-studiedmodel species, such as yeast Saccharomyces cerevisiae,flyDrosophila melanogaster, or worm Caenorhabditis ele-gans, to less well-studied human, between the conservednetwork regions [17–19].Biological network alignment gains importance because
many proteins remain largely functionally unannotated[20–22], especially in human and other species relevant
© 2015 Faisal et al. This is an Open Access article distributed under the terms of the Creative Commons Attribution License(http://creativecommons.org/licenses/by/4.0), which permits unrestricted use, distribution, and reproduction in any medium,provided the original work is properly credited.
Faisal et al. EURASIP Journal on Bioinformatics and Systems Biology (2015) 2015:3 Page 2 of 19
for studying disease [22, 23]. Importantly, many cru-cial biological processes and diseases in human are hardto study experimentally, and hence, the correspondingknowledge needs to be transferred from model species[24–30]. Human aging is an example of such a biologicalprocess. Because susceptibility to many prevalent dis-eases increases with age, studying human aging could aidtherapeutics. Yet, human aging is hard to study experi-mentally due to long human lifespan as well as ethical con-straints. Thus, aging-related knowledge in human needsto be obtained computationally, by transferring experi-mentally obtained aging-related knowledge from modelspecies to human. Traditionally, this transfer has reliedon genomic sequence alignment [31]. However, biolog-ical network data and genomic sequence data can givecomplementary biological insights [32–35], implying thatanalyses of network data can elucidate functional knowl-edge that cannot be extracted from sequence data by cur-rent methods. Thus, restricting alignment to sequencesmay limit the knowledge transfer [32–36]. For example,∼20 % of aging-related genes in model species do nothave sequence-based orthologs in human [37]. And whilesequence alignment can thus not transfer this knowledgebetween the species, network alignment can be used toidentify network-based functional orthologs across thespecies and thus further our knowledge of aging. Similarholds for many other biological processes and diseases.In addition to across-species transfer of functional
knowledge discussed above, just as sequence alignment,network alignment can also be used to infer phyloge-netic relationships of different species based on similari-ties between their biological networks [38–40]. We notethat in the biomedical domain, network alignment hasmostly been used in the context of PPI networks. How-ever, the problem is applicable to other types of biologicalnetworks, such as gene co-expression networks [41]. Fur-ther, network alignment has applications outside of the
biomedical domain [42], with implications on, e.g., userprivacy in online social networks [43].Unlike the computationally tractable “linear” sequence
alignment, exact alignment of large networks, such asbiological ones, is computationally intractable due to thenondeterministic polynomial time (NP)-completeness ofthe underlying subgraph isomorphism problem, whichasks if a network exists as an exact subgraph of anothernetwork [44]. Therefore, efficient heuristic approachesneed to be sought to solve the network alignment problemapproximately.Similar to sequence alignment, network alignment
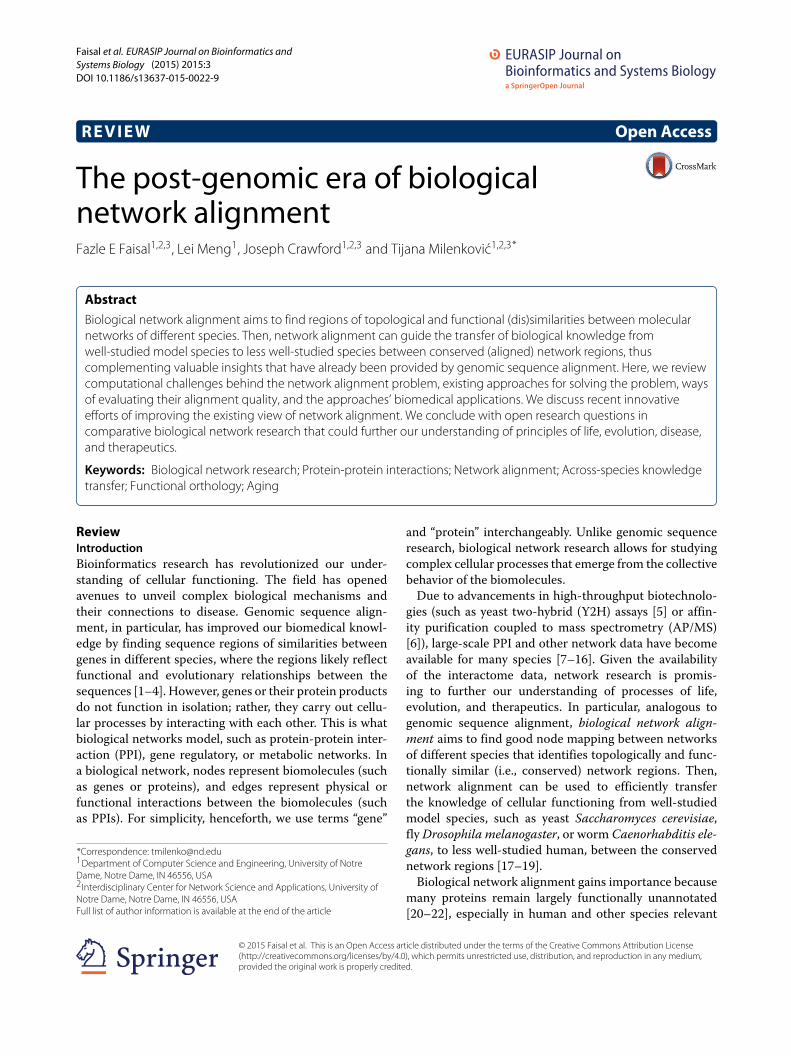
approaches (or network aligners) can be local and global.Local network alignment aims to find smaller networkregions, such as biological pathways or protein complexes,which are highly conserved between larger input net-works (Fig. 1a; for a more formal description, see thefollowing sections). Initial network alignment efforts havefocused on local alignment [45–54]. However, local align-ers are generally not capable of finding large subgraphsthat are topologically and functionally conserved betweeninput networks. Therefore, most of the recent efforts havefocused on global network alignment [18, 19, 25, 38–40,43, 55–82], which typically aims to map well (almost)entire networks to each other. As such, global alignment istypically capable of finding large subgraphs that are con-served between input networks but at potential expense ofsuboptimally matching local network regions (Fig. 1b; fora more formal description, see the following sections).A network alignment approach can also be categorized
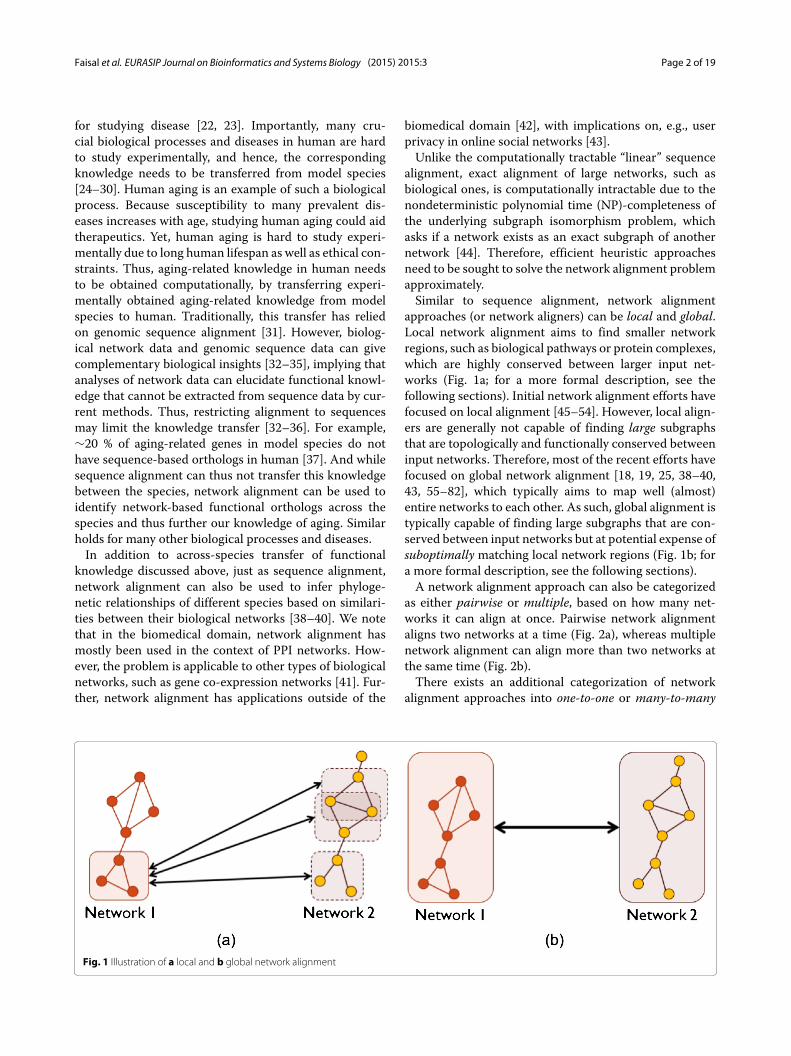
as either pairwise or multiple, based on how many net-works it can align at once. Pairwise network alignmentaligns two networks at a time (Fig. 2a), whereas multiplenetwork alignment can align more than two networks atthe same time (Fig. 2b).There exists an additional categorization of network
alignment approaches into one-to-one or many-to-many
Fig. 1 Illustration of a local and b global network alignment
Faisal et al. EURASIP Journal on Bioinformatics and Systems Biology (2015) 2015:3 Page 3 of 19
Fig. 2 Illustration of a pairwise and bmultiple network alignment
methods. One-to-one network alignment produces one-to-one (or injective) node mapping, where a node froma given network can be mapped to at most one uniquenode from another network (Fig. 2a). On the other hand,many-to-many network alignment produces many-to-many node mapping, where a node from a given networkcan be mapped to several nodes from another network(Fig. 2b). We note that there also exists an approach thatproduces one-to-many node mapping, meaning that itmaps a node from a given network to multiple nodes fromanother network, while a node from the later network canbe mapped to at most one node from the former net-work [83].To date, all local aligners have been of the many-to-
many type, while global aligners have been of both one-to-one and many-to-many types. Further, one-to-one globalaligners have traditionally been associated with pairwisealignment. In this context, nodes in the smaller of thetwo aligned networks are injectively mapped to nodes inthe larger network, thus resulting in aligned node pairs(Fig. 2a). Similarly, many-to-many global aligners have tra-ditionally been associated with multiple alignment. In thiscontext, the output is aligned node clusters rather thanpairs, where each cluster can contain multiple nodes fromthe same network (Fig. 2b). Recently, “hybrid” approacheshave appeared, such as one-to-one alignment of multi-ple networks [75, 77, 78]. In this case, an aligned nodecluster can contain at most one node from each of thealigned networks, and each node can appear in at mostone aligned cluster. Table 1 categorizes some of the mostprominent network alignment approaches as either localor global, pairwise or multiple, and one-to-one or many-to-many. The approaches are discussed in more detail inthe following sections.A general algorithmic idea behind network alignment
approaches is to compute similarities between nodesin different networks with respect to some cost func-tion and rapidly identify from all possible alignments a
high-scoring alignment with respect to the node simi-larities. Many of the existing network alignment algo-rithms use within their node cost function biologicalinformation external to network topology, such as pro-tein sequence similarities. However, to extract the mostfrom each source of biological information, it would begood to know howmuch of new biological knowledge canbe uncovered solely from topology before integrating itwith other sources of biological information [39, 40, 54,60, 69, 72, 73]. Only after methods for topological networkalignment are developed that result in alignments of goodtopological and biological quality, it is beneficial to inte-grate them with other biological (e.g., sequence) data tofurther improve the quality.We note that network alignment is one possible type
of network comparison. There also exists alignment-freenetwork comparison. Approaches of this type “simply”aim to quantify the similarity between different networksby comparing their overall topological properties (e.g.,degree distributions or graphlet-based properties), ignor-ing in the process node correspondence between thenetworks and without aiming to identify conserved edgesor subgraphs [84–88]. On the other hand, network align-ment aims to find good node correspondence betweennetworks that leads to highly similar conserved networkregions. Thus, network alignment and alignment-free net-work comparisons have very different goals. Our focus ison network alignment.Also, there is another type of network comparison,
called network querying, which is more related to networkalignment. Network querying typically evaluates whethera small query subnetwork (e.g., a simple path or a tree-like structure) exists as an exact subgraph of a largertarget network, and if so, it identifies such a query-targetsubnetwork match. Prominent approaches of this typeadopt a “color-coding” idea and ensure a confidence levelof the resulting subnetwork match [89–92]. Unlike net-work querying, network alignment compares networks of
Faisal et al. EURASIP Journal on Bioinformatics and Systems Biology (2015) 2015:3 Page 4 of 19
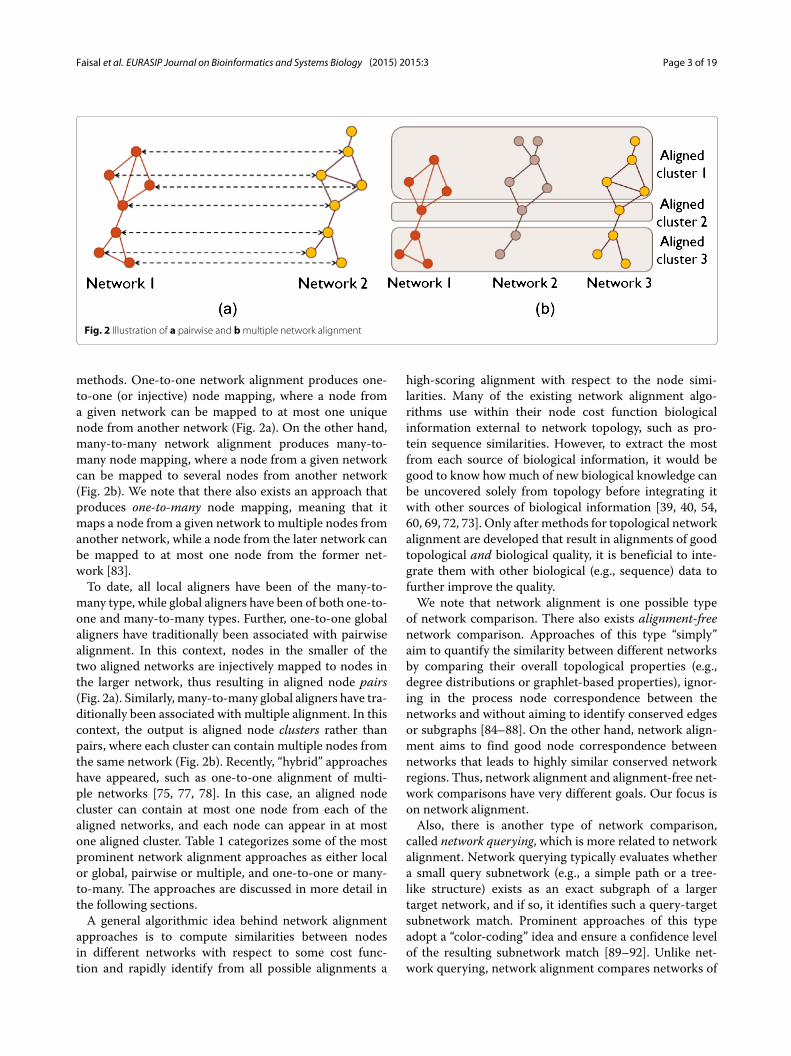
Table 1 Overview of prominent network alignment approaches
Network Local or Pairwise or One-to-one or Link to thealigner global? multiple? many-to-many? software
PathBLAST [93] Local Pairwise Many-to-many http://www.pathblast.org
NetworkBLAST [46] Local Pairwise Many-to-many http://www.cs.tau.ac.il/~bnet/networkblast.htm
MaWISh [48] Local Pairwise Many-to-many http://compbio.case.edu/koyuturk/software/mawish
Graemlin 1.0 [47] Local Multiple Many-to-many http://graemlin.stanford.edu
NetworkBLAST-M [94] Local Multiple Many-to-many http://www.cs.tau.ac.il/~bnet/License-nbm.htm
NetAligner [54] Local Pairwise Many-to-many http://netaligner.irbbarcelona.org
AlignNemo [52] Local Pairwise Many-to-many http://www.sourceforge.net/p/alignnemo/home/Home
AlignMCL [53] Local Pairwise Many-to-many http://sites.google.com/site/alignmcl
IsoRank [55] Global Pairwise One-to-one http://groups.csail.mit.edu/cb/mna
IsoRankN [59] Global Multiple Many-to-many http://groups.csail.mit.edu/cb/mna
GRAAL [38] Global Pairwise One-to-one http://bio-nets.doc.ic.ac.uk/GRAAL_suppl_inf
H-GRAAL [39] Global Pairwise One-to-one http://www.nd.edu/~cone/software_data.html
MI-GRAAL [40] Global Pairwise One-to-one http://bio-nets.doc.ic.ac.uk/MI-GRAAL
GHOST [60] Global Pairwise One-to-one http://www.cs.cmu.edu/~ckingsf/software/ghost
SPINAL [67] Global Pairwise One-to-one http://code.google.com/p/spinal
SMETANA [74] Global Multiple Many-to-many http://www.ece.tamu.edu/~bjyoon/SMETANA
BEAMS [75] Global Multiple Many-to-many http://webprs.khas.edu.tr/~cesim/BEAMS.tar.gz
NetCoffee [76] Global Multiple Many-to-many http://code.google.com/p/netcoffee
FUSE [78] Global Multiple One-to-one Available upon e-mail request until formally published
NETAL [68] Global Pairwise One-to-one http://bioinf.modares.ac.ir/software/netal
GraphM [58] Global Pairwise One-to-one http://cbio.ensmp.fr/~mzaslavskiy/pwp_projects.html
NATALIE 2.0 [64] Global Pairwise One-to-one http://www.mi.fu-berlin.de/w/LiSA/Natalie
GEDEVO-M [77] Global Multiple One-to-one http://gedevo.mpi-inf.mpg.de/multiple-network-alignment
MAGNA [69] Global Pairwise One-to-one http://www.nd.edu/~cone/MAGNA
WAVE [73] Global Pairwise One-to-one Available upon e-mail request until formally published
GREAT [72] Global Pairwise One-to-one Available upon e-mail request until formally published
PINALOG [65] Global Pairwise One-to-one http://www.sbg.bio.ic.ac.uk/~pinalog
In the table, there are eight local and 19 global network aligners. Of the eight local aligners, six are pairwise and two are multiple, and all eight are many-to-many. Of the 19global aligners, 13 are pairwise and six are multiple, and 15 are one-to-one and four are many-to-many. All global pairwise approaches are one-to-one, while global multipleapproaches are either one-to-one or many-to-many
arbitrary sizes, and also, it typically searches for an inexactsubnetwork match between networks. Again, our focus ison network alignment.In the following sections, we discuss the different types
of existing prominent network alignment approaches.After we contrast the different approaches, we discussexisting measures that are used to evaluate alignmentquality of the approaches. Next, we discuss very recentinnovative directions that question the traditional view ofthe network alignment problem. Further, we discuss keybiological applications of network alignment. Finally, wepresent open research questions in comparative biologicalnetwork research that are expected to enhance personal-ized health care via improved understanding of cellularfunctioning, disease, and therapeutics.
Local network alignmentApproaches for local network alignmentWe first discuss pairwise and then multiple local networkaligners.PathBLAST [93] aligns two PPI networks to identify
their conserved pathways. An alignment graph is firstbuilt, in which a node represents a pair of putativeorthologs (one from each network), and an edge repre-sents a conserved interaction. Highest-scoring paths arethen searched for through the alignment graph with adynamic programming approach based on the degreeof protein sequence similarity and the interaction qual-ity. In the process, gaps and mismatches are allowed toaccount for evolution variations and experimental errorsin pathway structure.
Faisal et al. EURASIP Journal on Bioinformatics and Systems Biology (2015) 2015:3 Page 5 of 19
NetworkBLAST [46] is an extension of PathBLAST thataims to identify not just simple linear pathways (as Path-BLAST does) but also more complex network structures,e.g., dense functional modules or protein complexes. Itdoes so by identifying high-scoring seeds in the alignmentgraph (which is similar to PathBLAST’s) and extendingaround the seeds in a greedy fashion.MaWISh [48] is a pairwise local aligner model-
ing evolution (conservation and divergence) of pro-tein interactions. In the alignment graph, evolutionaryinformation is encoded into edge weights through theconcepts of matches, mismatches, and duplication. MaW-ISh addresses network alignment as a maximum weightinduced subgraph problem. Intuitively, it greedily grows asubgraph starting from a seed with maximum gain withrespect to the cost function; a bad move (negative gain) isallowed in order to bypass a poor local optimum.NetAligner [54] is a pairwise aligner featuring
pathway-to-interactome, complex-to-interactome, andinteractome-to-interactome alignments. Also, it is ableto perform both inter- and intra-species alignment ofnetworks of arbitrary topology. NetAligner constructsan initial alignment graph and searches for connectedcomponents in this graph to be used as seeds. Then,nodes from different seeds, which are disconnected in theinitial alignment graph as they do not conserve edges, arenow connected if they conserve indirect interactions (i.e.,three-node paths) in one or both input networks. Finally,NetAligner searches again for connected components insuch extended alignment graph, which are its output.AlignNemo [52] is a recent pairwise local aligner capable
of handling sparse network data. It first uses the conceptof a weighted alignment graph, in which nodes representpairs of orthologs from different species (just as in theprevious methods’ alignment graphs), but edges are nowweighted via a scoring strategy that accounts not only fordirectly conserved interactions but also for indirect inter-actions. So, the more paths connecting the two nodes andthe more paths going through both nodes, the greater theedge weight. Then, a seed-and-extend strategy is used onthe alignment graph to find relatively dense groups ofnodes (i.e., proteins that have more interactions amongthemselves than with the rest of the network), which areAlignNemo’s output.AlignMCL [53] is another recent pairwise local aligner
that is robust to the choice of networks to be aligned.It is based on Markov clustering (MCL), a knowngraph clustering algorithm that simulates random walksusing Markov chains iteratively. AlignMCL first builds aweighted alignment graph the same way as AlignNemo.Next, it applies MCL to this graph to identify conservedprotein modules.Graemlin 1.0 [47] is an early multiple aligner. Based on
a phylogenetic tree of species whose networks are being
aligned, it uses a “progressive alignment” strategy by per-forming successively pairwise alignments of the closestnetwork pairs. It first finds with a seed-and-extend strat-egy a pairwise alignment of the two closest species basedon their phylogenetic relationship. Then, it transforms theresulting alignment together with unaligned nodes fromthe two networks into a new network for use in the nextphase of the progressive alignment.NetworkBLAST-M [94] is also a multiple aligner. It
works with a novel representation of multiple networks,a layered alignment graph, in which each layer corre-sponds to a network and putative orthologs from dif-ferent layers which are connected by inter-layer edges.NetworkBLAST-M then uses a seed-and-extend strategyto identify a high-scoring alignment from the layeredalignment graph. Seeds come from a set of k-spines (ak-spine is a connected subgraph of size k with eachnode coming from a different layer) generated basedon either identical topologies or underlying phylogeny.NetworkBLAST-M performs an expansion around theseed by iteratively adding to the alignment a k-spine thatcontributes the most to the current score, until no k-spinecan be added or the alignment size exceeds the limit.
Alignment quality measures for local network alignmentA variety of approaches have been used to assess thequality of a local alignment, which is the set of con-served networkmodules. Generally, the resultingmodulesare compared against known protein complexes or otherfunctional units to evaluate their overlap. Then, intu-itively, the more conserved network modules there arethat have large overlap with known protein complexes, thebetter the alignment quality. Popular biological alignmentquality measures in the context of local network align-ment, which quantify this notion of “network module–protein complex” overlap, are discussed below. We notethat evaluation of topological alignment quality (e.g., ofthe amount of edges that are conserved by the align-ment) is not common when it comes to local networkalignment. This is because local aligners result in many-to-many node mappings, whereas edge conservation istypically defined with one-to-one node mapping in mind,and thus, it is not clear how to measure topological align-ment quality of many-to-many aligners [38]. Plus, localnetwork aligners are more biologically motivated, mean-ing that they are aimed at mapping protein complexesacross networks, whereas global aligners are more mathe-matically motivated, aiming to solve a modification of thesubgraph isomorphism problem.
1. Gene ontology (GO) [95] semantic similarity. GOsemantic similarity aims to assess to what extent themapped (i.e., conserved) network modules fromdifferent species are functionally related. First, GO
Faisal et al. EURASIP Journal on Bioinformatics and Systems Biology (2015) 2015:3 Page 6 of 19
semantic similarity is computed between each twoproteins in the given module. This can be done inmany ways, e.g., by averaging GO semanticsimilarities across the proteins’ associated GO termpairs [52, 53]. Then, semantic similarity of an entiremodule can be computed by averaging the resultingsimilarities over all mapped protein pairs within themodule. Finally, the score of an alignment can becomputed by summarizing the results over allmapped network modules, thus assigning a singleGO semantic similarity score to the alignment. Thehigher the GO semantic similarity, the better thealignment quality. This measure was used byAlignNemo [52] and AlignMCL [53].
2. Detection of known complexes. Given a conservedmodule produced by a local aligner and a knownprotein complex, precision is the percentage ofproteins in the conserved network module that arealso present in the protein complex, recall is thepercentage of proteins in the protein complex thatare also in the network module, and F-score is theharmonic mean of precision and recall aiming toreconcile the two mutually contradicting measures[52, 54]. Then, the statistics can be summarized overall modules in the alignment. The higher the valuesof these measures, the better the alignment quality.These measures were used by NetAligner [54],AlignNemo [52], and AlignMCL [53].
3. Specificity and sensitivity. For each species,specificity is the percentage of functionally coherentconserved modules, i.e., modules that are statisticallysignificantly enriched in a given GO term, out of allconserved modules. The statistical significance of theenrichment is typically done with respect to thehypergeometric test, corrected for multiplehypothesis testing [96]. Sensitivity is the number ofdistinct GO terms that are statistically significantlyenriched in the given local alignment, i.e., in itsconserved network modules. The higher the values ofthese two measures, the better the alignment quality.These measures were used by NetworkBLAST [94],NetworkBLAST-M [94], and Graemlin 1.0 [47].
Summary of local network aligners: which one to use?Of the pairwise local aligners, PathBLAST [93], Network-BLAST [46], and MaWISh [48] are among the earliestalgorithms. When applied to real-world PPI networks,these pioneering aligners revealed existing as well asnovel functional modules, many of which would not havebeen identified from sequence alignment alone. Path-BLAST has been obsolete for a while now and has notbeen evaluated against any recent local network aligner.NetAligner was shown to be better than NetworkBLASTwhen identifying known functional modules in terms of
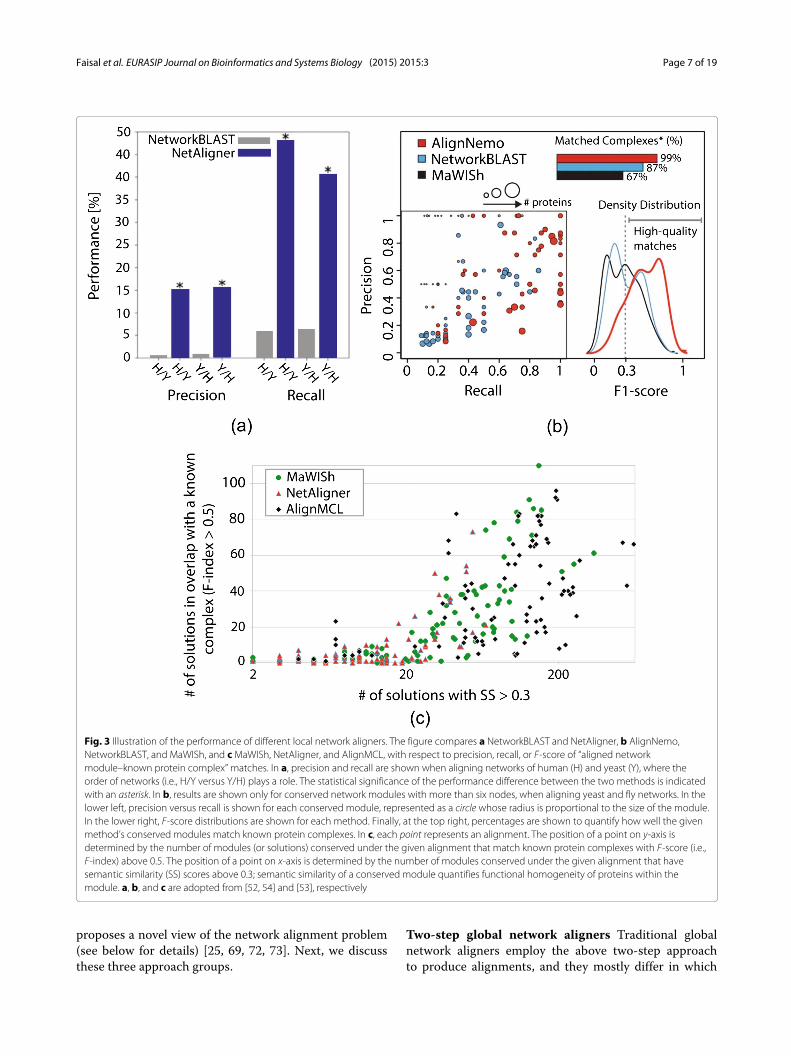
precision and recall (Fig. 3a), perhaps due to NetAl-igner being able to handle sparse complexes, while Net-workBLAST could only identify dense complexes [54].AlignNemo was shown to outperform both MaWIShand NetworkBLAST when detecting protein complexes,while performing comparably to NetAligner (Fig. 3b) [52].AlignMCL was shown to generate more of high-qualityconserved networkmodules that match known complexeswell compared to NetAligner and MaWISh (Fig. 3c) [53].Unlike the above pairwise approaches, Graemlin 1.0
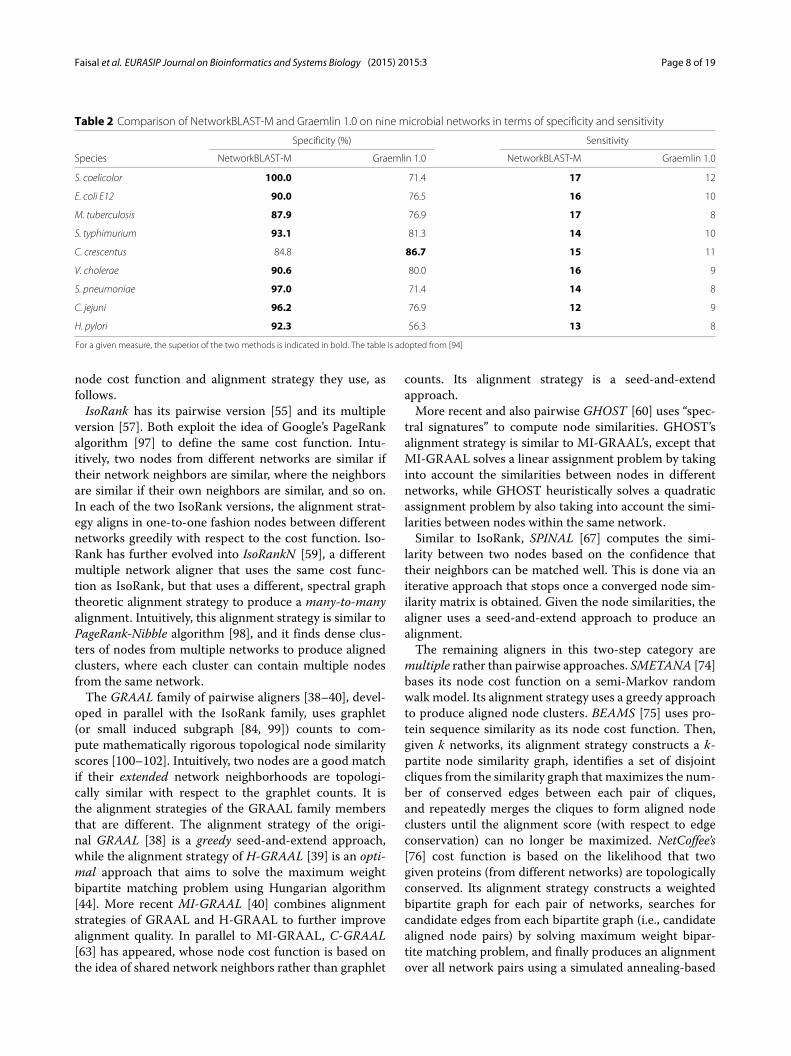
[47] and NetworkBLAST-M [94] are capable of align-ing multiple networks. When compared against eachother, NetworkBLAST-M was shown to outperformGraemlin 1.0 in terms of specificity and sensitivity(Table 2) [94].The above results are overall conclusions. Importantly,
the superiority of an aligner also depends on the choiceof the network data (e.g., synthetic versus real-world net-works, binary Y2H versus co-complex AP/MS networks,etc.) as well as alignment quality measure and evalua-tion framework. Therefore, we recommend a new pair-wise local aligner to be compared against AlignNemoand AlignMCL and a new multiple local aligner to becompared against NetworkBLAST-M.
Global network alignmentApproaches for global network alignmentWe classify prominent global network aligners into threegroups according to their algorithmic design. The firstgroup of methods employ a two-step approach: 1) use acost function to compute pairwise similarities betweennodes in different networks and 2) use an alignment strat-egy to rapidly identify from all possible alignments thehighest-scoring alignment with respect to the total sim-ilarity over all aligned nodes [38–40, 55, 57, 59, 60, 63,67, 74–76, 78]. Although a typical cost function aimsto compute topological similarities between nodes, mostof the global network aligners allow for the integrationof sequence information into the node cost function. Atypical alignment strategy uses the precomputed nodesimilarity matrix resulting from the above step 1 to iter-atively produce an alignment, and it does not allow forupdating the matrix while creating an alignment. How-ever, nodes that are already aligned at a given iterationof the alignment strategy might convey valuable informa-tion for guiding the remaining iterations of the strategy.Therefore, it could be desirable to update the initial nodesimilarity matrix resulting from step 1 in each iterationof step 2. Motivated by this, the second group of recentglobal network aligners allows for iteratively updatingthe node similarity matrix while producing the alignment[68], or they employ an alternative similar idea [58, 64, 77].Finally, the third group of very recent network aligners
Faisal et al. EURASIP Journal on Bioinformatics and Systems Biology (2015) 2015:3 Page 7 of 19
Fig. 3 Illustration of the performance of different local network aligners. The figure compares a NetworkBLAST and NetAligner, b AlignNemo,NetworkBLAST, and MaWISh, and cMaWISh, NetAligner, and AlignMCL, with respect to precision, recall, or F-score of “aligned networkmodule–known protein complex” matches. In a, precision and recall are shown when aligning networks of human (H) and yeast (Y), where theorder of networks (i.e., H/Y versus Y/H) plays a role. The statistical significance of the performance difference between the two methods is indicatedwith an asterisk. In b, results are shown only for conserved network modules with more than six nodes, when aligning yeast and fly networks. In thelower left, precision versus recall is shown for each conserved module, represented as a circle whose radius is proportional to the size of the module.In the lower right, F-score distributions are shown for each method. Finally, at the top right, percentages are shown to quantify how well the givenmethod’s conserved modules match known protein complexes. In c, each point represents an alignment. The position of a point on y-axis isdetermined by the number of modules (or solutions) conserved under the given alignment that match known protein complexes with F-score (i.e.,F-index) above 0.5. The position of a point on x-axis is determined by the number of modules conserved under the given alignment that havesemantic similarity (SS) scores above 0.3; semantic similarity of a conserved module quantifies functional homogeneity of proteins within themodule. a, b, and c are adopted from [52, 54] and [53], respectively
proposes a novel view of the network alignment problem(see below for details) [25, 69, 72, 73]. Next, we discussthese three approach groups.
Two-step global network aligners Traditional globalnetwork aligners employ the above two-step approachto produce alignments, and they mostly differ in which
Faisal et al. EURASIP Journal on Bioinformatics and Systems Biology (2015) 2015:3 Page 8 of 19
Table 2 Comparison of NetworkBLAST-M and Graemlin 1.0 on nine microbial networks in terms of specificity and sensitivity
Specificity (%) Sensitivity
Species NetworkBLAST-M Graemlin 1.0 NetworkBLAST-M Graemlin 1.0
S. coelicolor 100.0 71.4 17 12
E. coli E12 90.0 76.5 16 10
M. tuberculosis 87.9 76.9 17 8
S. typhimurium 93.1 81.3 14 10
C. crescentus 84.8 86.7 15 11
V. cholerae 90.6 80.0 16 9
S. pneumoniae 97.0 71.4 14 8
C. jejuni 96.2 76.9 12 9
H. pylori 92.3 56.3 13 8
For a given measure, the superior of the two methods is indicated in bold. The table is adopted from [94]
node cost function and alignment strategy they use, asfollows.IsoRank has its pairwise version [55] and its multiple
version [57]. Both exploit the idea of Google’s PageRankalgorithm [97] to define the same cost function. Intu-itively, two nodes from different networks are similar iftheir network neighbors are similar, where the neighborsare similar if their own neighbors are similar, and so on.In each of the two IsoRank versions, the alignment strat-egy aligns in one-to-one fashion nodes between differentnetworks greedily with respect to the cost function. Iso-Rank has further evolved into IsoRankN [59], a differentmultiple network aligner that uses the same cost func-tion as IsoRank, but that uses a different, spectral graphtheoretic alignment strategy to produce a many-to-manyalignment. Intuitively, this alignment strategy is similar toPageRank-Nibble algorithm [98], and it finds dense clus-ters of nodes from multiple networks to produce alignedclusters, where each cluster can contain multiple nodesfrom the same network.The GRAAL family of pairwise aligners [38–40], devel-
oped in parallel with the IsoRank family, uses graphlet(or small induced subgraph [84, 99]) counts to com-pute mathematically rigorous topological node similarityscores [100–102]. Intuitively, two nodes are a good matchif their extended network neighborhoods are topologi-cally similar with respect to the graphlet counts. It isthe alignment strategies of the GRAAL family membersthat are different. The alignment strategy of the origi-nal GRAAL [38] is a greedy seed-and-extend approach,while the alignment strategy of H-GRAAL [39] is an opti-mal approach that aims to solve the maximum weightbipartite matching problem using Hungarian algorithm[44]. More recent MI-GRAAL [40] combines alignmentstrategies of GRAAL and H-GRAAL to further improvealignment quality. In parallel to MI-GRAAL, C-GRAAL[63] has appeared, whose node cost function is based onthe idea of shared network neighbors rather than graphlet
counts. Its alignment strategy is a seed-and-extendapproach.More recent and also pairwise GHOST [60] uses “spec-
tral signatures” to compute node similarities. GHOST’salignment strategy is similar to MI-GRAAL’s, except thatMI-GRAAL solves a linear assignment problem by takinginto account the similarities between nodes in differentnetworks, while GHOST heuristically solves a quadraticassignment problem by also taking into account the simi-larities between nodes within the same network.Similar to IsoRank, SPINAL [67] computes the simi-
larity between two nodes based on the confidence thattheir neighbors can be matched well. This is done via aniterative approach that stops once a converged node sim-ilarity matrix is obtained. Given the node similarities, thealigner uses a seed-and-extend approach to produce analignment.The remaining aligners in this two-step category are
multiple rather than pairwise approaches. SMETANA [74]bases its node cost function on a semi-Markov randomwalk model. Its alignment strategy uses a greedy approachto produce aligned node clusters. BEAMS [75] uses pro-tein sequence similarity as its node cost function. Then,given k networks, its alignment strategy constructs a k-partite node similarity graph, identifies a set of disjointcliques from the similarity graph that maximizes the num-ber of conserved edges between each pair of cliques,and repeatedly merges the cliques to form aligned nodeclusters until the alignment score (with respect to edgeconservation) can no longer be maximized. NetCoffee’s[76] cost function is based on the likelihood that twogiven proteins (from different networks) are topologicallyconserved. Its alignment strategy constructs a weightedbipartite graph for each pair of networks, searches forcandidate edges from each bipartite graph (i.e., candidatealigned node pairs) by solving maximum weight bipar-tite matching problem, and finally produces an alignmentover all network pairs using a simulated annealing-based
Faisal et al. EURASIP Journal on Bioinformatics and Systems Biology (2015) 2015:3 Page 9 of 19
approach guided by an objective function; the objectivefunction is a measure of the summation of candidateedge weights, where the weight is defined by the nodecost function. FUSE [78] bases its cost function on anon-negative matrix tri-factorization technique. Given knetworks, its alignment strategy constructs a weightedk-partite graph and solves in approximate fashion themaximum weight k-partite matching problem to produceone-to-one multiple network alignment.
Iterative global network aligners The followingapproaches allow for updating node similarity scorescomputed with respect to the given cost function duringeach iteration of the alignment strategy, or they employ asimilar idea of iteratively improving the alignment as it isbuilt via an optimization strategy.NETAL [68] is a pairwise aligner that iteratively recom-
putes the similarity between two currently unalignednodes based on the current alignment and the expectednumber of conserved interactions incident to the twonodes if the nodes were to be aligned. GraphM [58] isa pairwise aligner that employs a gradient ascent-basediterative approach guided by an objective function to iter-atively find a high-scoring alignment with respect to theobjective function. GraphM uses two variations of theobjective function. The first variation is based on theoverall protein sequence conservation in the alignment.The second variation is based on both the sequence andedge conservation in the alignment. Motivated by themathematical foundations of NATALIE [62], NATALIE2.0 [64] formulates the network alignment problem as aquadratic assignment problem (similar to GHOST) thatis then generalized into an integer linear programmingproblem. Given the NP-completeness of the latter, thealigner adapts a Lagrangian relaxation approach to solvethe problem using a subgradient optimization.Unlike the above three pairwise one-to-one aligners,
GEDEVO-M [77] is a multiple (also one-to-one) aligner.
It generalizes the concept of graph edit distance (GED)between two networks (which is the minimum numberof edge insertions and deletions needed to transform onenetwork into another) into GED for multiple networks,in order to solve multiple network alignment problem byiteratively optimizing a GED-based objective function.
Novel views of network alignment Recently, two majordrawbacks have been recognized with the current view ofthe network alignment problem, as follows.
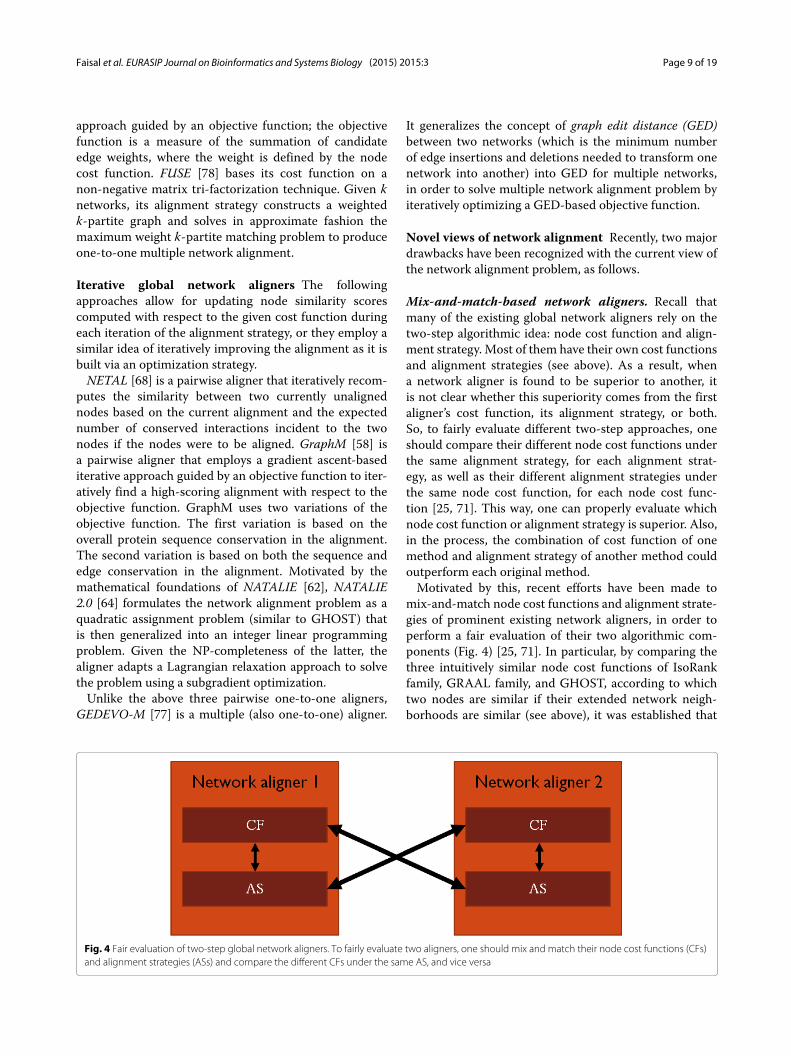
Mix-and-match-based network aligners. Recall thatmany of the existing global network aligners rely on thetwo-step algorithmic idea: node cost function and align-ment strategy. Most of them have their own cost functionsand alignment strategies (see above). As a result, whena network aligner is found to be superior to another, itis not clear whether this superiority comes from the firstaligner’s cost function, its alignment strategy, or both.So, to fairly evaluate different two-step approaches, oneshould compare their different node cost functions underthe same alignment strategy, for each alignment strat-egy, as well as their different alignment strategies underthe same node cost function, for each node cost func-tion [25, 71]. This way, one can properly evaluate whichnode cost function or alignment strategy is superior. Also,in the process, the combination of cost function of onemethod and alignment strategy of another method couldoutperform each original method.Motivated by this, recent efforts have been made to
mix-and-match node cost functions and alignment strate-gies of prominent existing network aligners, in order toperform a fair evaluation of their two algorithmic com-ponents (Fig. 4) [25, 71]. In particular, by comparing thethree intuitively similar node cost functions of IsoRankfamily, GRAAL family, and GHOST, according to whichtwo nodes are similar if their extended network neigh-borhoods are similar (see above), it was established that
Fig. 4 Fair evaluation of two-step global network aligners. To fairly evaluate two aligners, one should mix and match their node cost functions (CFs)and alignment strategies (ASs) and compare the different CFs under the same AS, and vice versa
Faisal et al. EURASIP Journal on Bioinformatics and Systems Biology (2015) 2015:3 Page 10 of 19
the GRAAL family’s graphlet-based node similarity mea-sure is superior to those of IsoRank’s family as well asGHOST [25, 71]. On the other hand, which alignmentstrategy is superior depends on the choice of data set orevaluation criteria. But nonetheless, in each of the twoefforts [25, 71], novel superior network aligners have beenproposed that combine cost function of one method andalignment strategy of another method, confirming that itis important to properly and fairly evaluate the two-stepapproaches as described above.
Edge-focused network aligners. Traditional networkaligners discussed so far (with exception of BEAMS andGraphM) identify from possible alignments the high-scoring alignments with respect to the overall node sim-ilarity (or node conservation). However, the accuracy ofthe alignments is then evaluated with some other measurethat is different than the node similarity used to constructthe alignments. Typically, one measures the amount ofconserved edges. Thus, the traditional methods align sim-ilar nodes between networks hoping to conserve manyedges (after the alignment is constructed!).Instead, MAGNA [69] has recently been proposed that
directly optimizes edge conservation while the alignmentis being constructed, without decreasing in the process thequality of node mapping. Intuitively, this aligner exploitsthe idea of a genetic algorithm to crossover via a novelmathematical concept two parent alignments into a supe-rior child algorithm. MAGNA simulates the population ofalignments that evolves over time for as long as allowedby computational resources and allows the fittest (high-est scoring with respect to edge conservation) alignmentsto proceed to the next generation. Importantly, the ini-tial population of alignments can consist of either ran-dom alignments or alignments from existing methods.Thus, MAGNA can work on top of the alignments ofthe existing methods to further improve their quality. Butimportantly, MAGNA improves upon the existing net-work alignment methods (that optimize node conserva-tion rather than edge conservation) even when run on topof random alignments. MAGNA was recently extendedinto MAGNA++ framework [82], in order to simultane-ously optimize both node and edge conservation, whichfurther improves alignment quality. Further, MAGNA++features a user-friendly graphical interface for domain(e.g., biological) scientists while also offering source codefor easy extensibility by computational scientists.Another edge-focused alignment effort is WAVE [73],
which is not a complete aligner per se, but instead, anovel iterative alignment strategy that can be used on topof any existing node cost function. Importantly, just asMAGNA++, WAVE aims to optimize both node and edgeconservation during the alignment process, unlike previ-ous alignment strategies. For this, it uses a novel measure
of edge conservation that (unlike existing measures thattreat each conserved edge the same) weighs each con-served edge so that edges with highly similar end nodes(with respect to the cost function) are favored. UsingWAVE on top of established node cost functions has ledto superior alignments compared to the existing meth-ods that optimize only node conservation or only edgeconservation or that treat each conserved edge the same.In parallel to WAVE, GREAT [72] has appeared, which
just like WAVE optimizes both node and edge conserva-tion and also weighs each conserved edge to favor con-served edges that are topologically similar over conservededges that are topologically dissimilar. Unlike WAVE,GREAT approaches the network alignment problem froma novel perspective, by aligning well edges between net-works first in order to improve the node cost functionneeded to then align well nodes between the networks.GREAT, the edge-based network aligner, outperformsfairly comparable node-based network aligners. Also, itimproves upon the most recent state-of-the-art meth-ods that aim to optimize node conservation only or edgeconservation only or that treat each conserved edge thesame.We note an alternative novel view of the network align-
ment problem. Namely, unlike the other network aligners,PINALOG [65] first detects clusters (dense subnetworks)in the input networks, aligns the clusters between the net-works, and finally aligns nodes within the aligned clustersusing a seed-and-extend approach.
Alignment quality measures for global network alignmentUnlike local network alignment that is typically evalu-ated only biologically (see above), global network alignersare evaluated both topologically and biologically. Depend-ing on whether a global alignment is pairwise or mul-tiple, given the difference in their input (aligned nodepairs versus aligned node clusters), different measuresof alignment quality are used for the different approachcategories, as follows.
Alignment quality measures for pairwise networkaligners Recall that all pairwise global aligners are alsoone-to-one in nature. Intuitively, a good network alignershould match well nodes between aligned networks, con-serve many edges, and find a large common connectedsubgraph. With this in mind, the following topologicalquality measures are widely used by pairwise one-to-onealigners.
1. Node correctness (NC). NC of an alignment is thepercentage of nodes in the smaller network (in termsof the number of nodes) that are correctly aligned(according to the ground truth node mapping) tonodes in the larger network [38]. Unlike other
Faisal et al. EURASIP Journal on Bioinformatics and Systems Biology (2015) 2015:3 Page 11 of 19
measures discussed below, NC is applicable onlywhen the actual ground truth node mapping betweennetworks is known, which is rarely the case forreal-world networks. Thus, NC is typically computedon synthetic network data, when aligning a networkto its noisy counterparts obtained by, e.g., randomlyadding or rewiring a percentage of edges in theoriginal network [38–40, 60, 69]. The higher the NCscore, the better the alignment quality. This measurewas used by GRAAL [38], H-GRAAL [39],MI-GRAAL [40], GHOST [60], NETAL [68],MAGNA [69], GREAT [72], and WAVE [73], as wellas in a follow-up study on fair evaluation of existingaligners [71].
2. Symmetric substructure score (S3). S3 measures theamount of edge conservation between two alignednetworks [69]. This measure has been introduced toovercome the drawbacks of two other similarmeasures: edge correctness (EC) [38] and inducedconserved structure (ICS) [60]. Namely, EC wasproposed to measure the percentage of edges fromthe smaller network that are mapped to edges fromthe larger network under the given alignment.However, EC might fail to differentiate between twoalignments that one might consider to be of differenttopological quality, as it is defined with respect to thesmaller network but not the larger one [60]. Thus,ICS was defined as the percentage of edges from thesubgraph of the larger network that participates inthe alignment, which are mapped to edges in thesmaller network under the given alignment [60].However, now ICS is defined with respect to thelarger network but not the smaller one. That is, sinceEC is defined with respect to the smaller network, itpenalizes the alignment for having misaligned edgesin the smaller network but not in the larger network.On the other hand, since ICS is defined with respectto the larger network, it penalizes the alignment forhaving misaligned edge in the larger network but notin the smaller network. With this motivation, S3 hasrecently been proposed to improve upon EC and ICSby penalizing for misaligned edges in both the smallerand larger networks [69]. The higher the S3 score, thebetter the alignment quality. This 2014 measure wasused by MAGNA [69], GREAT [72], andWAVE [73],as well as in a follow-up study on fair evaluation ofexisting aligners [71]. In addition, its predecessors ECand ICS were used by GRAAL [38], H-GRAAL [39],MI-GRAAL [40], GHOST [60], and NETAL [68].
3. Size of the largest connected common subgraph(LCCS). Of two alignments with similar S3 scores,one could expose large, contiguous, and topologicallycomplex regions of network similarity, while theother could fail to do so. Thus, in addition to counting
aligned edges, it is important that the aligned edgescluster together to form large connected subgraphsrather than being isolated. In this context, aconnected common subgraph (CCS) is defined to bea connected subgraph (not necessarily induced) thatappears in both networks [39, 40]. The size of thelargest CCS (LCCS) can be measured in terms of thenumber of both nodes and edges [38, 40], and a newsummary measure reconciling the two, which alsopenalizes for misaligned edges in both networks (justas S3 does), has been proposed [69]. The higher theLCCS score, the better the alignment quality. Thismeasure was used by IsoRank [55], GraphM [58], andmost of the aligners that also used NC (see above).
The following biological quality measures are widelyused by pairwise aligners.
1. GO correctness is the percentage of aligned proteinpairs in which the two proteins share at least k GOterms [95], out of all aligned protein pairs in whichboth proteins are annotated with at least k GO terms[38]. GO correctness can be computed with respectto complete GO annotation data, independent of GOevidence code. However, since many GO annotationshave been obtained via sequence comparison, andsince some of the aligners also use sequenceinformation to produce their alignments, GOcorrectness can be biased by the sequenceinformation. Therefore, it is highly recommended toconsider only GO annotations with experimentalevidence codes when computing GO correctness ofan aligner that uses sequence information [38]. Thismeasure was used by GRAAL [38], H-GRAAL [39],MI-GRAAL [40], C-GRAAL [63], GHOST [60],NETAL [68], MAGNA [69], and WAVE [73], as wellas in a follow-up study on fair evaluation of existingaligners [71].
2. GO semantic similarity. We have already discussedthis measure above in the context of local networkalignment. It complements GO correctness, asfollows. GO correctness is a stricter measure thatrequires two proteins in an alignment to share one ormore common GO terms. However, two proteinscan still be functionally similar if they share a similarGO term, without necessarily sharing the same GOterm. GO correctness would fail to identify suchfunctional similarity between two proteins. GOsemantic similarity between two proteins overcomesthe limitation by taking into account the semanticsimilarity between GO terms that the two proteinsare annotated with [103–107]. Just as with localaligners, GO semantic similarity between twoproteins can be computed in many ways, e.g., by
Faisal et al. EURASIP Journal on Bioinformatics and Systems Biology (2015) 2015:3 Page 12 of 19
averaging GO semantic similarities across theproteins’ associated GO term pairs [52, 69, 108].Then, GO semantic similarity of an entire alignmentcan be computed by averaging the resultingsimilarities over all protein pairs in the alignment,thus assigning a single semantic similarity score tothe alignment [52, 69, 108]. This measure was usedby GHOST [60] and MAGNA [69].
Alignment quality measures for multiple networkaligners Recall that most of multiple network alignersare also many-to-many in nature, meaning that multiplenodes in one network can be mapped to multiple nodes inanother network, resulting in a set of aligned node clus-ters. The clusters are typically non-overlapping, but a clus-ter can contain multiple nodes from the same network.For these reasons, different alignment quality measuresare required for multiple network aligners compared topairwise aligners [59]. Intuitively, a goodmultiple networkaligner should produce aligned clusters such that nodes ineach cluster are functionally uniform or consistent. Also,it should produce many such clusters, so that it covers asmany of the nodes from the aligned networks as possi-ble. The following alignment quality measures are widelyused for a multiple network aligner. Among them, thefirst one is a topological measure and the remaining onesare biological measures. (Note that an additional poten-tial measure of topological alignment quality exists, asfollows. BEAMS generalizes the concept of edge conser-vation from pairwise to multiple alignment [75]. WhereasBEAMS uses this measure to define its alignment scorethat is optimized while creating a multiple alignment,nothing prevents one to use this measure to evaluatetopological quality of another aligner’s multiple alignmentafter it is created.)
1. The larger the number of aligned clusters containingat least three nodes, the better the alignment quality.This measure was used by IsoRankN [59], as well asin a follow-up study on fair evaluation of existingaligners [25].
2. A related measure is k-coverage, which counts thenumber of clusters containing proteins from kdifferent networks. This measure was used bySMETANA [74], BEAMS [75], and FUSE [78].
3. Exact cluster ratio is the percentage of alignedclusters in which all proteins share a GO term. Thehigher its value, the better the alignment quality.This measure was used by IsoRankN [59] and in afollow-up study on fair evaluation of existing aligners[25].
4. Exact protein ratio is the percentage of all proteinsthat are in the exact clusters (as defined above). Thehigher its value, the better the alignment quality.
This measure was used by IsoRankN [59] and in afollow-up study on fair evaluation of existing aligners[25].
5. Mean entropy of alignment. First, the entropy of analigned cluster S∗
v is computed as:H(S∗
v ) = H(p1, p2, . . . , pd) = − ∑di=1 pi log pi, where
pi is the percentage of all proteins in S∗v that have GO
term i, and d is the total number of GO terms [59].Then, the mean entropy of the alignment is obtainedby averaging entropies across all clusters in thealignment. The lower the entropy of the alignment,the higher its average within-cluster GO termconsistency, and consequently, the better itsbiological quality. This measure was used byIsoRankN [59], SMETANA [74], BEAMS [75],NetCoffee [76], GEDEVO-M [77], and FUSE [78], aswell as in a follow-up study on fair evaluation ofexisting aligners [25].
6. Normalized mean entropy of alignment. First, thenormalized entropy of an aligned cluster S∗
v iscomputed as: H(S∗
v ) = 1log dH(S∗
v ). Then, the meannormalized entropy is obtained by averagingnormalized entropies across all aligned clusters. Thelower the normalized mean entropy, the better itsbiological quality. This measure was used byIsoRankN [59], SMETANA [74], BEAMS [75],NetCoffee [76], GEDEVO-M [77], and FUSE [78], aswell as in a follow-up study on fair evaluation ofexisting aligners [25].
Evaluating statistical significance of an alignmentWhen aligning networks with an approach, it is impor-tant to measure the statistical significance of the givenalignment quality score. There are several approachesto achieve this. One could compute the probability ofobtaining the same or better score by aligning the actualnetworks with a random aligner [39, 48]. Additionally, onecould compute the probability of obtaining the same orbetter score by aligning random networks with the actualapproach [39]. In this context, random networks shouldcome from an appropriate network null model (i.e., graphfamily), and many network null models exist [109, 110].
Summary of global network aligners: which one to use?Of the pairwise global aligners, IsoRank [55], GraphM[58], GRAAL [38], and H-GRAAL [39] are among theearliest global alignment algorithms and have by nowbeen outperformed by the newer approaches. MI-GRAALwas shown to perform significantly better than IsoRank,GRAAL, and H-GRAAL [40] (Fig. 5). MI-GRAAL andGHOST are mostly comparable to each other [71], withslight superiority of GHOST in some contexts. NETALwas shown to be either superior or comparable to MI-GRAAL [68]. MAGNA, a recent edge-based aligner,
Faisal et al. EURASIP Journal on Bioinformatics and Systems Biology (2015) 2015:3 Page 13 of 19
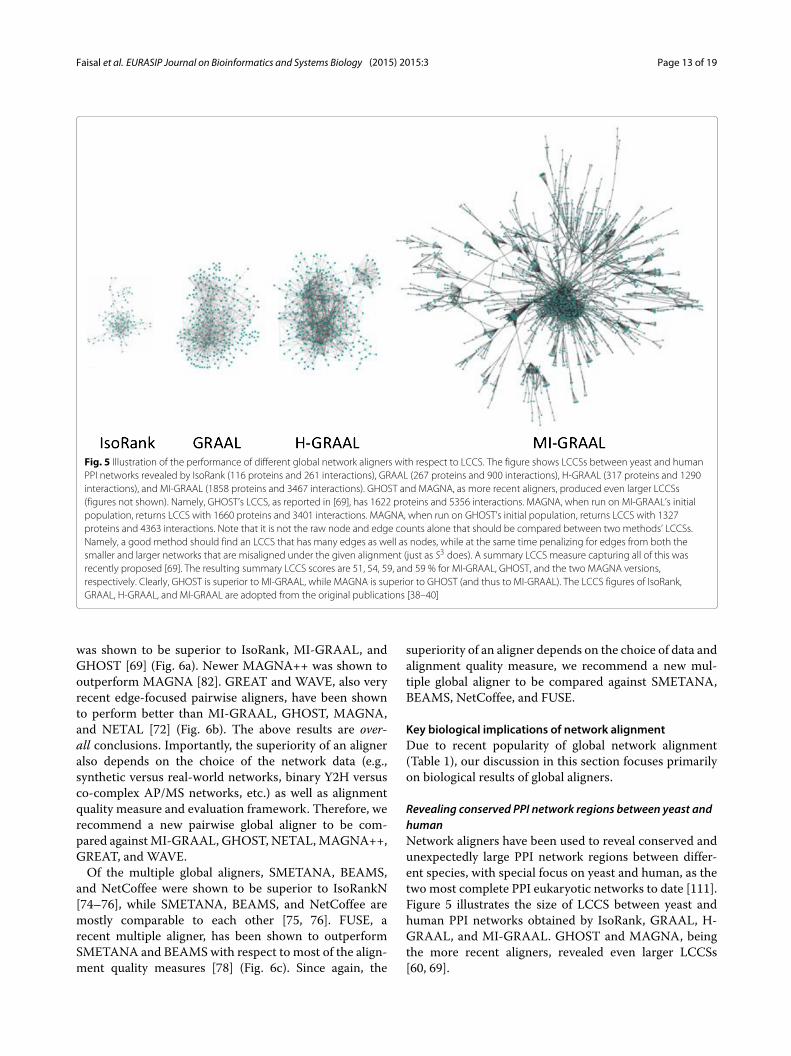
Fig. 5 Illustration of the performance of different global network aligners with respect to LCCS. The figure shows LCCSs between yeast and humanPPI networks revealed by IsoRank (116 proteins and 261 interactions), GRAAL (267 proteins and 900 interactions), H-GRAAL (317 proteins and 1290interactions), and MI-GRAAL (1858 proteins and 3467 interactions). GHOST and MAGNA, as more recent aligners, produced even larger LCCSs(figures not shown). Namely, GHOST’s LCCS, as reported in [69], has 1622 proteins and 5356 interactions. MAGNA, when run on MI-GRAAL’s initialpopulation, returns LCCS with 1660 proteins and 3401 interactions. MAGNA, when run on GHOST’s initial population, returns LCCS with 1327proteins and 4363 interactions. Note that it is not the raw node and edge counts alone that should be compared between two methods’ LCCSs.Namely, a good method should find an LCCS that has many edges as well as nodes, while at the same time penalizing for edges from both thesmaller and larger networks that are misaligned under the given alignment (just as S3 does). A summary LCCS measure capturing all of this wasrecently proposed [69]. The resulting summary LCCS scores are 51, 54, 59, and 59 % for MI-GRAAL, GHOST, and the two MAGNA versions,respectively. Clearly, GHOST is superior to MI-GRAAL, while MAGNA is superior to GHOST (and thus to MI-GRAAL). The LCCS figures of IsoRank,GRAAL, H-GRAAL, and MI-GRAAL are adopted from the original publications [38–40]
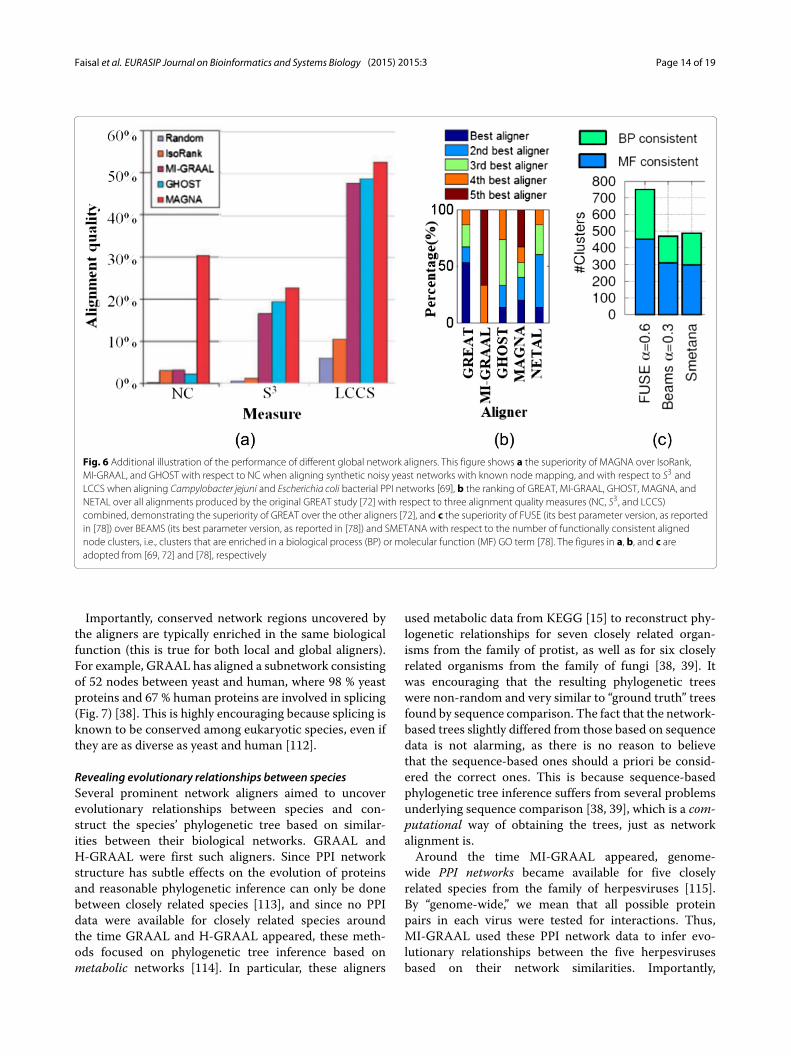
was shown to be superior to IsoRank, MI-GRAAL, andGHOST [69] (Fig. 6a). Newer MAGNA++ was shown tooutperform MAGNA [82]. GREAT and WAVE, also veryrecent edge-focused pairwise aligners, have been shownto perform better than MI-GRAAL, GHOST, MAGNA,and NETAL [72] (Fig. 6b). The above results are over-all conclusions. Importantly, the superiority of an aligneralso depends on the choice of the network data (e.g.,synthetic versus real-world networks, binary Y2H versusco-complex AP/MS networks, etc.) as well as alignmentquality measure and evaluation framework. Therefore, werecommend a new pairwise global aligner to be com-pared againstMI-GRAAL, GHOST, NETAL,MAGNA++,GREAT, and WAVE.Of the multiple global aligners, SMETANA, BEAMS,
and NetCoffee were shown to be superior to IsoRankN[74–76], while SMETANA, BEAMS, and NetCoffee aremostly comparable to each other [75, 76]. FUSE, arecent multiple aligner, has been shown to outperformSMETANA and BEAMSwith respect to most of the align-ment quality measures [78] (Fig. 6c). Since again, the
superiority of an aligner depends on the choice of data andalignment quality measure, we recommend a new mul-tiple global aligner to be compared against SMETANA,BEAMS, NetCoffee, and FUSE.
Key biological implications of network alignmentDue to recent popularity of global network alignment(Table 1), our discussion in this section focuses primarilyon biological results of global aligners.
Revealing conserved PPI network regions between yeast andhumanNetwork aligners have been used to reveal conserved andunexpectedly large PPI network regions between differ-ent species, with special focus on yeast and human, as thetwo most complete PPI eukaryotic networks to date [111].Figure 5 illustrates the size of LCCS between yeast andhuman PPI networks obtained by IsoRank, GRAAL, H-GRAAL, and MI-GRAAL. GHOST and MAGNA, beingthe more recent aligners, revealed even larger LCCSs[60, 69].
Faisal et al. EURASIP Journal on Bioinformatics and Systems Biology (2015) 2015:3 Page 14 of 19
Fig. 6 Additional illustration of the performance of different global network aligners. This figure shows a the superiority of MAGNA over IsoRank,MI-GRAAL, and GHOST with respect to NC when aligning synthetic noisy yeast networks with known node mapping, and with respect to S3 andLCCS when aligning Campylobacter jejuni and Escherichia coli bacterial PPI networks [69], b the ranking of GREAT, MI-GRAAL, GHOST, MAGNA, andNETAL over all alignments produced by the original GREAT study [72] with respect to three alignment quality measures (NC, S3, and LCCS)combined, demonstrating the superiority of GREAT over the other aligners [72], and c the superiority of FUSE (its best parameter version, as reportedin [78]) over BEAMS (its best parameter version, as reported in [78]) and SMETANA with respect to the number of functionally consistent alignednode clusters, i.e., clusters that are enriched in a biological process (BP) or molecular function (MF) GO term [78]. The figures in a, b, and c areadopted from [69, 72] and [78], respectively
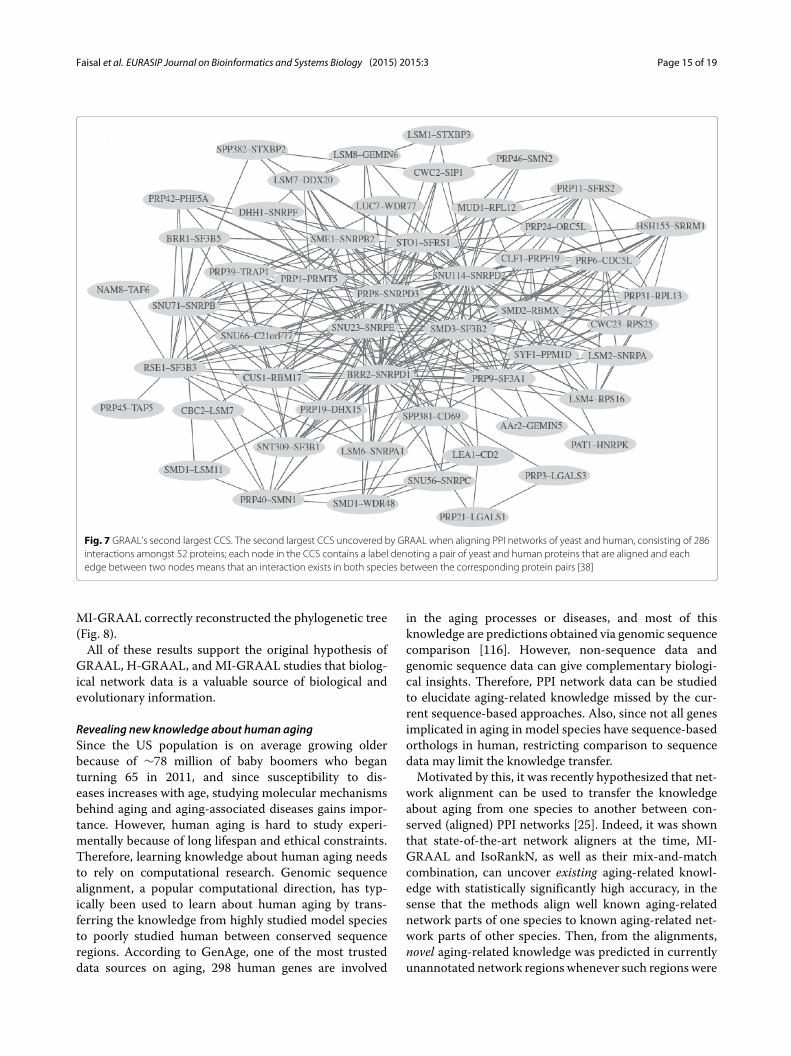
Importantly, conserved network regions uncovered bythe aligners are typically enriched in the same biologicalfunction (this is true for both local and global aligners).For example, GRAAL has aligned a subnetwork consistingof 52 nodes between yeast and human, where 98 % yeastproteins and 67 % human proteins are involved in splicing(Fig. 7) [38]. This is highly encouraging because splicing isknown to be conserved among eukaryotic species, even ifthey are as diverse as yeast and human [112].
Revealing evolutionary relationships between speciesSeveral prominent network aligners aimed to uncoverevolutionary relationships between species and con-struct the species’ phylogenetic tree based on similar-ities between their biological networks. GRAAL andH-GRAAL were first such aligners. Since PPI networkstructure has subtle effects on the evolution of proteinsand reasonable phylogenetic inference can only be donebetween closely related species [113], and since no PPIdata were available for closely related species aroundthe time GRAAL and H-GRAAL appeared, these meth-ods focused on phylogenetic tree inference based onmetabolic networks [114]. In particular, these aligners
used metabolic data from KEGG [15] to reconstruct phy-logenetic relationships for seven closely related organ-isms from the family of protist, as well as for six closelyrelated organisms from the family of fungi [38, 39]. Itwas encouraging that the resulting phylogenetic treeswere non-random and very similar to “ground truth” treesfound by sequence comparison. The fact that the network-based trees slightly differed from those based on sequencedata is not alarming, as there is no reason to believethat the sequence-based ones should a priori be consid-ered the correct ones. This is because sequence-basedphylogenetic tree inference suffers from several problemsunderlying sequence comparison [38, 39], which is a com-putational way of obtaining the trees, just as networkalignment is.Around the time MI-GRAAL appeared, genome-
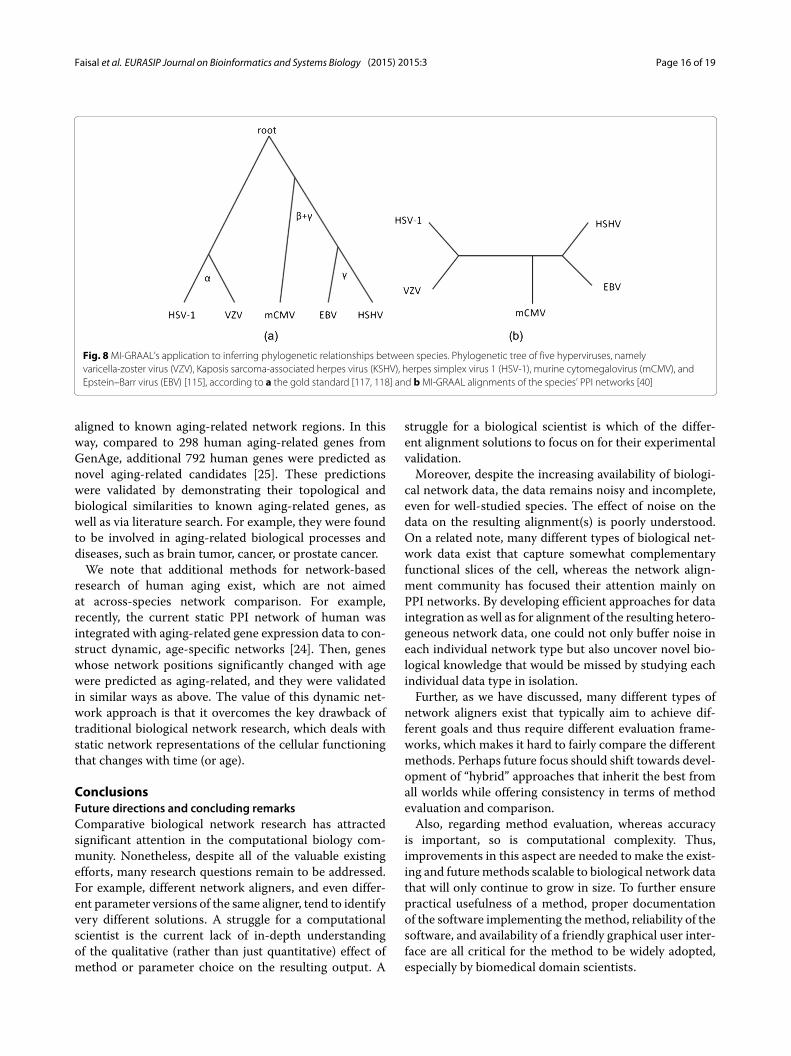
wide PPI networks became available for five closelyrelated species from the family of herpesviruses [115].By “genome-wide,” we mean that all possible proteinpairs in each virus were tested for interactions. Thus,MI-GRAAL used these PPI network data to infer evo-lutionary relationships between the five herpesvirusesbased on their network similarities. Importantly,
Faisal et al. EURASIP Journal on Bioinformatics and Systems Biology (2015) 2015:3 Page 15 of 19
Fig. 7 GRAAL’s second largest CCS. The second largest CCS uncovered by GRAAL when aligning PPI networks of yeast and human, consisting of 286interactions amongst 52 proteins; each node in the CCS contains a label denoting a pair of yeast and human proteins that are aligned and eachedge between two nodes means that an interaction exists in both species between the corresponding protein pairs [38]
MI-GRAAL correctly reconstructed the phylogenetic tree(Fig. 8).All of these results support the original hypothesis of
GRAAL, H-GRAAL, and MI-GRAAL studies that biolog-ical network data is a valuable source of biological andevolutionary information.
Revealing new knowledge about human agingSince the US population is on average growing olderbecause of ∼78 million of baby boomers who beganturning 65 in 2011, and since susceptibility to dis-eases increases with age, studying molecular mechanismsbehind aging and aging-associated diseases gains impor-tance. However, human aging is hard to study experi-mentally because of long lifespan and ethical constraints.Therefore, learning knowledge about human aging needsto rely on computational research. Genomic sequencealignment, a popular computational direction, has typ-ically been used to learn about human aging by trans-ferring the knowledge from highly studied model speciesto poorly studied human between conserved sequenceregions. According to GenAge, one of the most trusteddata sources on aging, 298 human genes are involved
in the aging processes or diseases, and most of thisknowledge are predictions obtained via genomic sequencecomparison [116]. However, non-sequence data andgenomic sequence data can give complementary biologi-cal insights. Therefore, PPI network data can be studiedto elucidate aging-related knowledge missed by the cur-rent sequence-based approaches. Also, since not all genesimplicated in aging in model species have sequence-basedorthologs in human, restricting comparison to sequencedata may limit the knowledge transfer.Motivated by this, it was recently hypothesized that net-
work alignment can be used to transfer the knowledgeabout aging from one species to another between con-served (aligned) PPI networks [25]. Indeed, it was shownthat state-of-the-art network aligners at the time, MI-GRAAL and IsoRankN, as well as their mix-and-matchcombination, can uncover existing aging-related knowl-edge with statistically significantly high accuracy, in thesense that the methods align well known aging-relatednetwork parts of one species to known aging-related net-work parts of other species. Then, from the alignments,novel aging-related knowledge was predicted in currentlyunannotated network regions whenever such regions were
Faisal et al. EURASIP Journal on Bioinformatics and Systems Biology (2015) 2015:3 Page 16 of 19
Fig. 8MI-GRAAL’s application to inferring phylogenetic relationships between species. Phylogenetic tree of five hyperviruses, namelyvaricella-zoster virus (VZV), Kaposis sarcoma-associated herpes virus (KSHV), herpes simplex virus 1 (HSV-1), murine cytomegalovirus (mCMV), andEpstein–Barr virus (EBV) [115], according to a the gold standard [117, 118] and bMI-GRAAL alignments of the species’ PPI networks [40]
aligned to known aging-related network regions. In thisway, compared to 298 human aging-related genes fromGenAge, additional 792 human genes were predicted asnovel aging-related candidates [25]. These predictionswere validated by demonstrating their topological andbiological similarities to known aging-related genes, aswell as via literature search. For example, they were foundto be involved in aging-related biological processes anddiseases, such as brain tumor, cancer, or prostate cancer.We note that additional methods for network-based
research of human aging exist, which are not aimedat across-species network comparison. For example,recently, the current static PPI network of human wasintegrated with aging-related gene expression data to con-struct dynamic, age-specific networks [24]. Then, geneswhose network positions significantly changed with agewere predicted as aging-related, and they were validatedin similar ways as above. The value of this dynamic net-work approach is that it overcomes the key drawback oftraditional biological network research, which deals withstatic network representations of the cellular functioningthat changes with time (or age).
ConclusionsFuture directions and concluding remarksComparative biological network research has attractedsignificant attention in the computational biology com-munity. Nonetheless, despite all of the valuable existingefforts, many research questions remain to be addressed.For example, different network aligners, and even differ-ent parameter versions of the same aligner, tend to identifyvery different solutions. A struggle for a computationalscientist is the current lack of in-depth understandingof the qualitative (rather than just quantitative) effect ofmethod or parameter choice on the resulting output. A
struggle for a biological scientist is which of the differ-ent alignment solutions to focus on for their experimentalvalidation.Moreover, despite the increasing availability of biologi-
cal network data, the data remains noisy and incomplete,even for well-studied species. The effect of noise on thedata on the resulting alignment(s) is poorly understood.On a related note, many different types of biological net-work data exist that capture somewhat complementaryfunctional slices of the cell, whereas the network align-ment community has focused their attention mainly onPPI networks. By developing efficient approaches for dataintegration as well as for alignment of the resulting hetero-geneous network data, one could not only buffer noise ineach individual network type but also uncover novel bio-logical knowledge that would be missed by studying eachindividual data type in isolation.Further, as we have discussed, many different types of
network aligners exist that typically aim to achieve dif-ferent goals and thus require different evaluation frame-works, which makes it hard to fairly compare the differentmethods. Perhaps future focus should shift towards devel-opment of “hybrid” approaches that inherit the best fromall worlds while offering consistency in terms of methodevaluation and comparison.Also, regarding method evaluation, whereas accuracy
is important, so is computational complexity. Thus,improvements in this aspect are needed to make the exist-ing and futuremethods scalable to biological network datathat will only continue to grow in size. To further ensurepractical usefulness of a method, proper documentationof the software implementing themethod, reliability of thesoftware, and availability of a friendly graphical user inter-face are all critical for the method to be widely adopted,especially by biomedical domain scientists.
Faisal et al. EURASIP Journal on Bioinformatics and Systems Biology (2015) 2015:3 Page 17 of 19
Given the tremendous amounts of biological networkdata that are being produced, network alignment will onlycontinue to gain importance. Further advances in thisresearch area could lead to new discoveries about the prin-ciples of life, evolution, disease, and therapeutics, and inthe long run, they could facilitate advances in health careand personalized medicine.
Competing interestsThe authors declare that they have no competing interests.
Authors’ contributionsAll of the authors helped write and approved the manuscript.
AcknowledgementsThis work has been supported by the National Science Foundation CAREERCCF-1452795 and CCF-1319469 grants.
Author details1Department of Computer Science and Engineering, University of NotreDame, Notre Dame, IN 46556, USA. 2Interdisciplinary Center for NetworkScience and Applications, University of Notre Dame, Notre Dame, IN 46556,USA. 3ECK Institute for Global Health, University of Notre Dame, Notre Dame,IN 46556, USA.
Received: 21 January 2015 Accepted: 18 May 2015
References1. SF Altschul, W Gish, W Miller, DJ Lipman, Basic local alignment search
tool. J. Mol. Biol. 215, 403–410 (1990)2. LG Biesecker, JC Mullikin, FM Facio, C Turner, PF Cherukuri, RW Blakesley,
GG Bouffard, PS Chines, P Cruz, NF Hansen, JK Teer, B Maskeri, AC Young,NCS Program, TA Manolio, AF Wilson, T Finkel, P Hwang, A Arai, ATRemaley, V Sachdev, R Shamburek, RO Cannon, ED Green, The ClinSeqproject: piloting large-scale genome sequencing for research ingenomic medicine. Genome Res. 19, 1665–74 (2009)
3. SQ Tsai, AJ Iafrate, JK Joung, Genome editing: a tool for research andtherapy: towards a functional understanding of variants for moleculardiagnostics using genome editing. Nat. Med. 20, 1103–04 (2014)
4. J Alföldi, K Lindblad-Toh, Comparative genomics as a tool to understandevolution and disease. Genome Res. 23, 1063–68 (2013)
5. H Yu, P Braun, MA Yildirim, I Lemmens, K Venkatesan, J Sahalie, THirozane-Kishikawa, F Gebreab, N Li, N Simonis, T Hao, JF Rual, A Dricot,A Vazquez, RR Murray, C Simon, L Tardivo, S Tam, N Svrzikapa, C Fan, ASSmet de, A Motyl, ME Hudson, J Park, X Xin, ME Cusick, T Moore, CBoone, M Snyder, FP Roth, et al., High-quality binary protein interactionmap of the yeast interactome networks. Science. 322, 104–110 (2008)
6. M Gstaiger, R Aebersold, Applying mass spectrometry-based proteomicsto genetics, genomics and network biology. Nat. Rev. Genet. 10,617–627 (2009)
7. BJ Breitkreutz, C Stark, T Reguly, L Boucher, A Breitkreutz, M Livstone, ROughtred, DH Lackner, J Bahler, V Wood, K Dolinski, M Tyers, The BioGRIDInteraction Database: 2008 update. Nucleic Acids Res. 36, 637–640 (2008)
8. S Peri, JD Navarro, TZ Kristiansen, R Amanchy, V Surendranath, BMuthusamy, TK Gandhi, KN Chandrika, N Deshpande, S Suresh, et al.,Human protein reference database as a discovery resource forproteomics. Nucleic Acids Res. 32, 497–501 (2004)
9. JM Cherry, C Adler, C Ball, SA Chervitz, SS Dwight, ET Hester, Y Jia, G Juvik,T Roe, M Schroeder, S Weng, D Botstein, SGD: saccharomyces genomedatabase. Nucleic Acids Res. 26(1), 73–79 (1998)
10. I Xenarios, DW Rice, L Salwinski, MK Baron, EM Marcotte, D Eisenberg,DIP: the database of interacting proteins. Nucleic Acids Res. 28(1),289–291 (2000)
11. I Xenarios, L Salwinski, XJ Duan, P Higney, SM Kim, D Eisenberg, DIP, theDatabase of interacting proteins: a research tool for studying cellularnetworks of protein interactions. Nucleic Acids Res. 30(1), 303–305 (2002)
12. H Hermjakob, L Montecchi-Palazzi, C Lewington, S Mudali, S Kerrien, SOrchard, M Vingron, B Roechert, P Roepstorff, A Valencia, H Margalit, J
Armstrong, A Bairoch, G Cesareni, D Sherman, R Apweiler, IntAct: anopen source molecular interaction database. Nucleic Acids Res.32(suppl 1), 452–455 (2004)
13. KR Brown, I Jurisica, Unequal evolutionary conservation of humanprotein interactions in interologous networks. Genome Biol. 8(5), 95(2007)
14. KR Brown, I Jurisica, Online predicted human interaction database.Bioinformatics. 21(9), 2076–82 (2005)
15. M Kanehisa, S Goto, Y Sato, M Kawashima, M Furumichi, M Tanabe, Data,information, knowledge and principle: back to metabolism in KEGG.Nucleic Acids Res. 42, 199–205 (2014)
16. M Kanehisa, S Goto, KEGG: Kyoto Encyclopedia of Genes and Genomes.Nucleic Acids Res. 28(1), 27–30 (2000)
17. R Sharan, T Ideker, Modeling cellular machinery through biologicalnetwork comparison. Nat. Biotechnol. 24(4), 427–433 (2006)
18. C Clark, J Kalita, A comparison of algorithms for the pairwise alignmentof biological networks. Bioinformatics. 30(16), 2351–59 (2014)
19. N Malod-Dognin, N Pržulj, GR-Align: fast and flexible alignment ofprotein 3D structures using graphlet degree similarity. Bioinformatics.30(9), 1259–1265 (2014)
20. R Sharan, I Ulitsky, R Shamir, Network-based prediction of proteinfunction. Mol. Reprod. Dev. 3(88), 1–13 (2007)
21. SS Dwight, MA Harris, K Dolinski, CA Ball, G Binkley, KR Christie, DG Fisk, LIssel-Tarver, M Schroeder, G Sherlok, A Sethuraman, S Weng, D Botstein,JM Cherry, Saccharomyces genome database (SGD) provides secondarygene annotation using the gene ontology (GO). Nucleic Acids Res. 30,69–72 (2002)
22. NJ Mulder, RO Akinola, GK Mazandu, H Rapanoel, Using biologicalnetworks to improve our understanding of infectious diseases. Comput.Struct. Biotechnol. J. 11(18), 1–10 (2014)
23. K Sun, JP Gonçalves, C Larminie, N Pržulj, Predicting disease associationsvia biological network analysis. BMC Bioinformatics. 15, 304 (2014)
24. FE Faisal, T Milenkovic, Dynamic networks reveal key players in aging.Bioinformatics. 30(12), 1721–1729 (2014)
25. FE Faisal, H Zhao, T Milenkovic, Global network alignment in the contextof aging. IEEE/ACM Trans. Comput. Biol. Bioinform. 12(1), 40–52 (2015)
26. JP Magalhães de, in Redox Metabolism and Longevity Relationships inAnimals and Plants, ed. by CH Foyer, R Faragher, and PJ Thornalley. Agingresearch in the post-genome era: new technologies for an old problem(Taylor and Francis New York, 2009), pp. 99–115
27. LA Ferrarini, L Bertelli, J Feala, AD McCulloch, G Paternostro, A moreefficient search strategy for aging genes based on connectivity.Bioinformatics. 21(3), 338–348 (2005)
28. DEL Promislow, Protein networks, pleiotropy and the evolution ofsenescence. Proc. R Soc. B: Biol. Sci. 1545(271), 1225–1234 (2004)
29. A Kriete, M Lechner, D Clearfield, D Bohmann, Computational systemsbiology of aging. Wiley Interdiscip. Rev. Syst. Biol. Med. 3(4), 414–28(2011)
30. R Reja, AJ Venkatakrishnan, J Lee, BC Kim, JW Ryu, S Gong, J Bhak, D Park,MitoInteractome: Mitochondrial protein interactome database, and itsapplication in ‘aging network’ analysis. BMC Genomics. 10(Suppl 3), 20(2009)
31. SF Altschul, TL Madden, AA Schffer, J Zhang, Z Zhang, W Miller, DJLipman, Gapped BLAST and PSI-BLAST: a new generation of proteindatabase search programs. Nucleic Acids Res. 25, 3389–3402 (1997)
32. V Memiševic, T Milenkovic, N Pržulj, Complementarity of network andsequence information in homologous proteins. J. Integr. Bioinform. 7(3),135 (2010)
33. T Przytycka, YA Kim, Network integration meets network dynamics. BMCBiology. 8(1), 48 (2010)
34. B Berger, J Peng, M Singh, Computational solutions for omics data,. Nat.Rev. Genet. 14(5), 333–46 (2013)
35. CJ Ryan, P Cimermancic, ZA Szpiech, A Sali, RD Hernandez, NJ Krogan,High-resolution network biology: connecting sequence with function.Nat. Rev. Genet. 14, 865–879 (2013)
36. D Gautheret, F Major, R Cedergren, Pattern searching/alignment withRNA primary and secondary structures: an effective descriptor for tRNA.Comput. Appl. Biosci: CABIOS. 6(4), 325–331 (1990)
37. R Tacutu, A Budovsky, VE Fraifeld, The NetAge database: a compendiumof networks for longevity, age-related diseases and associatedprocesses. Biogerontology. 11(4), 513–22 (2010)
Faisal et al. EURASIP Journal on Bioinformatics and Systems Biology (2015) 2015:3 Page 18 of 19
38. O Kuchaiev, T Milenkovic, V Memiševic, W Hayes, N Pržulj, Topologicalnetwork alignment uncovers biological function and phylogeny. J. R.Soc. Interface. 7, 1341–1354 (2010)
39. T Milenkovic, WL Ng, W Hayes, N Pržulj, Optimal network alignment withgraphlet degree vectors. Cancer Inform. 9, 121–137 (2010)
40. O Kuchaiev, N Pržulj, Integrative network alignment reveals large regionsof global network similarity in yeast and human. Bioinformatics.27(10), 1390–96 (2011)
41. SP Ficklin, FA Feltus, Gene coexpression network alignment andconservation of gene modules between two grass species: maize andrice. Plant Physiol. 156(3), 1244–56 (2011)
42. J Tang, T Lou, J Kleinberg, in Proceedings of the Fifth ACM InternationalConference onWeb Search and DataMining. Inferring social ties acrossheterogenous networks (ACM Seattle, WA, USA, 2012), pp. 743–752
43. A Narayanan, E Shi, BIP Rubinstein, in Proceedings of the 2011International Joint Conference on Neural Networks (IJCNN). Link predictionby de-anonymization: how we won the Kaggle social network challenge(IEEE San Jose, CA, USA, 2011), pp. 1825–1834
44. DB West, Introduction to Graph Theory, 2nd. (Prentice Hall, Upper SaddleRiver, NJ, 2001)
45. BP Kelley, Y Bingbing, F Lewitter, R Sharan, BR Stockwell, T Ideker,PathBLAST: a tool for alignment of protein interaction networks. NucleicAcids Res. 32, 83–88 (2004)
46. R Sharan, S Suthram, RM Kelley, T Kuhn, S McCuine, P Uetz, T Sittler, RMKarp, T Ideker, Conserved patterns of protein interaction in multiplespecies. Proc. Natl. Acad. Sci. U S A. 102(6), 1974–1979 (2005)
47. J Flannick, A Novak, SS Balaji, HM Harley, S Batzglou, Graemlin generaland robust alignment of multiple large interaction networks. GenomeRes. 16(9), 1169–1181 (2006)
48. M Koyutürk, Y Kim, U Topkara, S Subramaniam, W Szpankowski, A Grama,Pairwise alignment of protein interaction networks. J. Comput. Biol.13(2), 182–199 (2006)
49. J Berg, M Lassig, Local graph alignment and motif search in biologicalnetworks. Proc. Natl. Acad. Sci. U. S. A. 101, 14689–14694 (2004)
50. Z Liang, M Xu, M Teng, L Niu, NetAlign: a web-based tool for comparisonof protein interaction networks. Bioinformatics. 22(17), 2175–2177 (2006)
51. J Berg, M Lassig, Cross-species analysis of biological networks byBayesian alignment. Proc. Natl. Acad. Sci. 103(29), 10967–10972 (2006)
52. G Ciriello, M Mina, PH Guzzi, M Cannataro, C Guerra, AlignNemo: a localnetwork alignment method to integrate homology and topology. PLOSONE. 7(6), 38107 (2012)
53. M Mina, PH Guzzi, in Proceedings of the 2012 IEEE International Conferenceon Bioinformatics and BiomedicineWorkshops. AlignMCL: comparativeanalysis of protein interaction networks through markov clustering (IEEEPhiladelphia, PA, USA, 2012), pp. 174–181
54. RA Pache, P Aloy, A novel framework for the comparative analysis ofbiological networks. PLOS ONE. 7(2), 31220 (2012)
55. R Singh, J Xu, B Berger, in Proceedings of the 11th Annual InternationalConference on Research in Computational Molecular Biology. Pairwiseglobal alignment of protein interaction networks by matchingneighborhood topology (Springer Oakland, CA, USA, 2007), pp. 16–31
56. J Flannick, AF Novak, CB Do, BS Srinivasan, S Batzoglou, in Proceedings ofthe 12th Annual International Conference on Research in ComputationalMolecular Biology. Automatic parameter learning for multiple networkalignment (Springer Singapore, 2008), pp. 214–231
57. R Singh, J Xu, B Berger, Global alignment of multiple protein interactionnetworks. Proc. Pac. Symp. Biocomput. 13, 303–314 (2008)
58. M Zaslavskiy, F Bach, JP Vert, Global alignment of protein-proteininteraction networks by graph matching methods. Bioinformatics.25(12), 259–267 (2009)
59. C Liao, K Lu, M Baym, R Singh, B Berger, IsoRankN: spectral methods forglobal alignment of multiple protein networks. Bioinformatics.25(12), 253–258 (2009)
60. R Patro, C Kingsford, Global network alignment using multiscale spectralsignatures. Bioinformatics. 28(23), 3105–14 (2012)
61. X Guo, AJ Hartemink, Domain-oriented edge-based alignment ofprotein interaction networks. Bioinformatics. 25(12), 240–1246 (2009)
62. GW Klau, A new graph-based method for pairwise global networkalignment. BMC Bioinformatics. 10(Suppl 1), 59 (2009)
63. V Memiševic, N Pržulj, C-GRAAL: Common-neighbors-based globalgraph alignment of biological networks. Integr. Biol. 4(7), 734–743 (2012)
64. M El-Kebir, J Heringa, GW Klau, Lagrangian Relaxation Applied to SparseGlobal Network Alignment vol. 7036, (New York, 2011)
65. HTT Phan, MJE Sternberg, PINALOG: a novel approach to align proteininteraction networks-implications for complex detection andfunctionprediction. Bioinformatics. 28(9), 1239–45 (2012)
66. L Chindelevitch, C-Y Ma, C-S Liao, B Berger, Optimizing a globalalignment of protein interaction networks. Bioinformatics.29(21), 2765–2773 (2013)
67. AE Aladag, C Erten, SPINAL: scalable protein interaction networkalignment. Bioinformatics. 29(7), 917–924 (2013)
68. B Neyshabur, A Khadem, S Hashemifar, SS Arab, NETAL: a newgraph-based method for global alignment of protein-protein interactionnetworks. Bioinformatics. 29(13), 1654–62 (2013)
69. V Saraph, T Milenkovic, MAGNA: maximizing accuracy in global networkalignment. Bioinformatics. 30(20), 2931–40 (2014)
70. Milenkovic, H Zhao, FE Faisal, in Proceedings of the ACM Conference onBioinformatics, Computational Biology and Biomedical Informatics. Globalnetwork alignment in the context of aging (ACMWashington, DC, USA,2013), pp. 23–32
71. J Crawford, Y Sun, T Milenkovic, Fair evaluation of global networkaligners. arXiv:1407.4824 [q-bio.MN], 17 Jul 2014 (2014)
72. J Crawford, T Milenkovic, GREAT: GRaphlet Edge-based networkAlignmenT, arXiv:1410.5103 [q-bio.MN], 19 Oct 2014 (2014)
73. Y Sun, J Crawford, J Tang, T Milenkovic, Simultaneous optimization ofboth node and edge conservation in network alignment via WAVE,arXiv:1410.3301 [q-bio.MN], 13 Oct 2014 (2014)
74. SME Sahraeian, B-J Yoon, SMETANA: Accurate and scalable algorithm forprobabilistic alignment of large-scale biological networks. PLOS ONE.8(7), 67995 (2013)
75. F Alkan, C Erten, BEAMS: backbone extraction and merge strategy for theglobal many-to-many alignment of multiple PPI networks.Bioinformatics. 30(4), 531–539 (2014)
76. J Hu, B Kehr, K Reinert, NetCoffee: a fast and accurate global alignmentapproach to identify functionally conserved proteins in multiplenetworks. Bioinformatics. 30(4), 540–548 (2014)
77. R Ibragimov, M Malek, J Baumbach, J Guo, in Proceedings of the 2014Conference on Genetic and Evolutionary Computation. Multiple graph editdistance: simultaneous topological alignment of multipleprotein-protein interaction networks with an evolutionary algorithm(ACM Vancouver, BC, Canada, 2014), pp. 277–284
78. V Gligorijevic, N Malod-Dognin, N Pržulj, FUSE: multiple networkalignment via data fusion. arXiv:1410.7585 [q-bio.MN], 3 Nov 2014 (2014)
79. W Ali, T Rito, G Reinert, F Sun, CM Deane, Alignment-free proteininteraction network comparison. Bioinformatics. 30, 430–437 (2014)
80. S Hashemifar, J Xu, HubAlign: an accurate and efficient method forglobal alignment of protein-protein interaction networks.Bioinformatics. 30, 438–444 (2014)
81. A Radu, M Charleston, Node fingerprinting: an efficient heuristic foraligning biological networks. J. Comput. Biol. 21(10), 760–770 (2014)
82. V Vijayan, V Saraph, T Milenkovic, MAGNA++: maximizing accuracy inglobal network alignment via both node and edge conservation.Bioinformatics (2015). doi:10.1093/bioinformatics/btv161
83. F Ay, M Kellis, T Kahveci, SubMAP: aligning metabolic pathways withsubnetwork mappings. J. Comput. Biol. 18(3), 219–235 (2011)
84. N Pržulj, DG Corneil, I Jurisica, Modeling interactome: scale-free orgeometric?. Bioinformatics. 20(18), 3508–3515 (2004)
85. N Pržulj, DG Corneil, I Jurisica, Efficient estimation of graphlet frequencydistributions in protein-protein interaction networks. Bioinformatics.22(8), 974–980 (2006)
86. ÖN Yaveroglu, N Malod-Dognin, D Davis, Z Levnajic, V Janjic, RKarapandza, A Stojmirovic, N Pržulj, Revealing the hidden language ofcomplex networks. Sci. Rep. 4, 4547 (2014)
87. W Hayes, K Sun, N Pržulj, Graphlet-based measures are suitable forbiological network comparison. Bioinformatics. 29(4), 483–91 (2013)
88. ON Yaveroglu, Milenkovic, N Pržulj, Proper evaluation of alignment-freenetwork comparison methods. Bioinformatics (2015). doi:10.1093/bioinformatics/btv170
89. T Shlomi, D Segal, E Ruppin, R Sharan, QPath: a method for queryingpathways in a protein-protein interaction network. BMC Bioinformatics.7(1), 199 (2006)
90. B Dost, T Shlomi, N Gupta, E Ruppin, V Bafna, R Sharan, in Proceedings ofthe 11th Annual International Conference on Research in Computational
Faisal et al. EURASIP Journal on Bioinformatics and Systems Biology (2015) 2015:3 Page 19 of 19
Molecular Biology. QNet: a tool for querying protein interaction networks(Springer Oakland, CA, USA, 2007), pp. 1–15
91. G Guelsoy, B Gandhi, T Kahveci, Topac: alignment of gene regulatorynetworks using topology-aware coloring. J. Bioinform. Comput. Biol.10(01) (2012)
92. MM Hasan, T Kahveci, in Proceedings of the International Conference onBioinformatics, Computational Biology and Biomedical Informatics. Colordistribution can accelerate network alignment (ACM, 2013), p. 52
93. BP Kelley, R Sharan, RM Karp, T Sittler, DE Root, BR Stockwell, T Ideker,Conserved pathways within bacteria and yeast as revealed by globalprotein network alignment. Proc. Natl. Acad. Sci. 100(20), 11394–11399(2003)
94. M Kalaev, V Bafna, R Sharan, in Proceedings of the 12th AnnualInternational Conference on Research in Computational Molecular Biology.Fast and accurate alignment of multiple protein networks (SpringerSingapore, 2008), pp. 246–256
95. M Ashburner, CA Ball, JA Blake, D Botstein, H Butler, JM Cherry, AP Davis,K Dolinski, SS Dwight, JT Eppig, MA Harris, DP Hill, L Issel-Tarver, AKasarskis, S Lewis, JC Matese, JE Richardson, M Ringwald, GM Rubin, GSherlock, Gene ontology: tool for the unification of biology. Nat. Genet.25(1), 25–29 (2000)
96. EI Boyle, S Weng, J Gollub, H Jin, D Botstein, JM Cherry, G Sherlock,Go::termfinder-open source software for accessing gene ontologyinformation and finding significantly enriched gene ontology termsassociated with a list of genes. Bioinformatics. 20(18), 3710–3715 (2004)
97. S Brin, L Page, The anatomy of a large-scale hypertextual web searchengine. Comput. Net. ISDN Syst. 30, 107–117 (1998)
98. R Andersen, F Chung, K Lang, in Proceedings of the 47th Annual IEEESymposium on Foundations of Computer Science. Local graph partitioningusing pagerank vectors (Berkeley, California, USA, 2006), pp. 475–486
99. N Pržulj, Biological network comparison using graphlet degreedistribution. Bioinformatics. 23, 177–183 (2007)
100. T Milenkovic, N Pržulj, Uncovering biological network function viagraphlet degree signatures. Cancer Inform. 6, 257–273 (2008)
101. T Milenkovic, V Memisevic, AK Ganesan, N Pržulj, Systems-level cancergene identification from protein interaction network topology appliedto melanogenesis-related interaction networks. J. R. Soc. Interface.7, 423–437 (2010)
102. RW Solava, RP Michaels, T Milenkovic, Graphlet-based edge clusteringreveals pathogen-interacting proteins. Bioinformatics. 18(28), 480–486(2012)
103. GK Mazandu, NJ Mulder, Dago-fun: Tool for gene ontology-basedfunctional analysis using term information content measures. BMCBioinformatics. 14, 284 (2012)
104. X Song, L Li, PK Srimani, PS Yu, JZ Wang, Measure the semantic similarityof GO terms using aggregate information content. IEEE/ACM Trans.Comput. Biol. Bioinform. 11(3), 468–476 (2014)
105. C Pesquita, D Faria, H Bastos, AO Falcão, FM Couto, in Proceedings of the10th Annual Bio-Ontologies Meeting. Evaluating GO-based semanticsimilarity measures (Vienna, Austria, 2007), pp. 37–40
106. H Caniza, AE Romero, S Heron, H Yang, A Devoto, M Frasca, M Mesiti, GValentini, A Paccanaro, GOssTo: a stand-alone application and a webtool for calculating semantic similarities on the Gene Ontology.Bioinformatics. 30(15), 2235–36 (2014)
107. A Schlicker, T Lengauer, M Albrecht, Improving disease geneprioritization using the semantic similarity of gene ontology terms.Bioinformatics. 26(18), 561–567 (2010)
108. P Guzzi, M Mina, C Guerra, M Cannataro, Semantic similarity analysis ofprotein data: assessment with biological features and issues. Brief.Bioinform. 13(5), 569–585 (2012)
109. T Milenkovic, J Lai, N Pržulj, GraphCrunch: a tool for large networkanalyses. BMC Bioinformatics. 9(70) (2008)
110. O Kuchaiev, A Stevanovic, W Hayes, N Pržulj, GraphCrunch 2: Softwaretool for network modeling, alignment and clustering. BMCBioinformatics. 12(24) (2011)
111. V Janjic, R Sharan, N Pržulj, Modelling the yeast interactome. Sci. Rep.4, 4273 (2014)
112. K Wentz-Hunter, J Potashkin, The evolutionary conservation of thesplicing apparatus between fission yeast and man. Nucleic. Acids. Symp.Ser. 33, 226–228 (1995)
113. I Agrafioti, J Swire, J Abbott, D Huntley, S Butcher, M Stumpf, Comparativeanalysis of the saccharomyces cerevisiae and caenorhabditis elegansprotein interaction networks. BMC Evol. Biol. 5(1) (2005)
114. CV Forst, K Schulten, Phylogenetic analysis of metabolic pathways. J.Mol. Evol. 52(6), 471–489 (2001)
115. E Fossum, CC Friedel, SV Rajagopala, B Titz, A Baiker, T Schmidt, T Kraus, TStellberger, C Rutenberg, S Suthram, S Bandyopadhyay, D Rose, A Brunnvon, M Uhlmann, C Zeretzke, YA Dong, H Boulet, M Koegl, SM Bailer, UKoszinowski, T Ideker, P Uetz, R Zimmer, J Haas, Evolutionarily conservedherpesviral protein interaction networks. PLOS Pathogens. 5(9), 1000570(2009)
116. JP Magalhães de, A Budovsky, G Lehmann, J Costa, Y Li, V Fraifeld, GMMChurch, The human ageing genomic resources: online databases andtools for biogerontologists. Aging Cell. 8(1), 65–72 (2009)
117. DJ McGeoch, D Gatherer, Integrating reptilian herpesviruses into thefamily herpesviridae. J. Virol. 79(2), 725–731 (2005)
118. DJ McGeoch, FJ Rixon, AJ Davison, Topics in herpesvirus genomics andevolution. Virus Res. 117(1), 90–104 (2006)
Submit your manuscript to a journal and benefi t from:
7 Convenient online submission
7 Rigorous peer review
7 Immediate publication on acceptance
7 Open access: articles freely available online
7 High visibility within the fi eld
7 Retaining the copyright to your article
Submit your next manuscript at 7 springeropen.com

![RESEARCH OpenAccess … OpenAccess Anovelvoiceconversionapproachusing admissiblewaveletpacketdecomposition ... posed for voice morphing [17]. …](https://img.pdfslide.net/doc/110x75/5b0354627f8b9ab9598f2a8c/research-openaccess-openaccess-anovelvoiceconversionapproachusing-admissiblewaveletpacketdecomposition.jpg)