Embed Size (px)
Citation preview
© Polish Academy of Sciences (PAN) in Warsaw, 2016; © Institute of Technology and Life Sciences (ITP) in Falenty, 2016
© Polish Academy of Sciences, Committee for Land Reclamation JOURNAL OF WATER AND LAND DEVELOPMENT and Environmental Engineering in Agriculture, 2016 2016, No. 31 (X–XII): 73–85 © Institute of Technology and Life Sciences, 2016 PL ISSN 1429–7426 Available (PDF): http://www.itp.edu.pl/wydawnictwo/journal; http://www.degruyter.com/view/j/jwld
Received 16.05.2016 Reviewed 26.06.2016 Accepted 08.07.2016 A – study design B – data collection C – statistical analysis D – data interpretation E – manuscript preparation F – literature search
An experimental study of the surface and subsurface irrigation methods with respect to soil moisture on grape yard
Sharad J. KADBHANE1) ABCDEF, Vivek L. MANEKAR2) AD
Sardar Vallabhbhai National Institute of Technology, Surat, Gujarat, India; e-mail: [email protected], [email protected]
For citation: Kadbhane S.J., Manekar V.L. 2016. An experimental study of the surface and subsurface irrigation methods with respect to soil moisture on grape yard. Journal of Water and Land Development. No. 31 p. 73–85. DOI: 10.1515/jwld-2016-0038.
Abstract
In this study, field experiment has been carried out on the grape yard during the summer, Rainy, and winter seasons using different irrigation methods and measuring its impact on moisture retention. Six different irrigation methods such as drip irrigation (DI), drip irrigation with plastic mulching (DIPM), drip irrigation with organic mulching (DIOM), subsurface irrigation with stone column (SISC), subsurface irrigation with mud pot (SIMP), and subsurface irrigation with plastic bottles (SIPB) are used during experimental work. CROPWAT-8.0 model (FAO) is used to find out crop water requirements. Soil moisture is measured using soil moisture sensors fixed in the depth of 30 and 60 cm at the same location. Climatic parameters are obtained from the automatic weather station which is located near the experimental field. Multifactorial statistical analysis has been carried out using recorded soil moisture and climatic data. As per experimental results and analysis, it is observed that drip irriga-tion with the plastic mulching method is found to be the best method of irrigation for soil moisture retention among all other methods due to its highest soil moisture retention value as 25–30%. Whereas subsurface irriga-tion with the plastic bottle method is found to be suitable as it retained 15–20% soil moisture and material used in this irrigation method is waste material and the cheapest one.
Key words: drip irrigation, mud pot, organic mulching, plastic mulching, soil moisture retention, subsurface irrigation, surface irrigation
INTRODUCTION
Due to climate change, drought disasters are continuously occurring in the Indian subcontinent. A West Agro Climatic Zone of India having semiarid climatic conditions and it is suffering from the insuf-ficient and uneven rainfall in last few years. Adverse effects of uneven rainfall are that in one part of the country suffers due to water scarcity, whereas other part suffering due to high flood conditions. According to most of Global Circulation Models (GCM), tempe-rature has been increased and precipitation has been decreased globally (Intergovernmental Panel of Cli-mate Change) [IPCC 2007]. Since 1972 drought events
are frequently occurring in the different agro-climatic zones of India [SIKKA 2009]. These situations are shows impact on the food security of the growing population. The Indian government has already passed the food security bill in 2012, but it is difficult to provide sufficient food to the growing population due to such scarcity and drought events. Grape is con-tributed the significant role of complete food. The grape crop is also plays the important role in socio-economic development of the farmers because of its export potential. In the year 2012, India exported 25,85,000 ton grapes [SAXENA 2015]. But recently due to climatic changes and variations in rainfall it is difficult not only to maintain production of grape but
DOI: 10.1515/jwld-2016-0038
74 S.J. KADBHANE, V.L. MANEKAR
© PAN in Warsaw, 2016; © ITP in Falenty, 2016; Journal of Water and Land Development. No. 31 (X–XII)
also to save the grape yards from ruin. To cultivate one hectare of grape yard 0.7 millions of Indian ru- pees required [SAXENA 2015]. Such huge amount is made available only after bank loans. Once grape yard is destroying then it is difficult to repay. It is a chal-lenge to produce grape with water scarcity occurring by climatic changes. So it is urging to study, how to maintain soil moisture level using efficient irrigation systems under such scarce conditions. Some of the researchers have been studied on different surface and subsurface irrigation methods. In case of subsurface irrigation methods if emitters are directly inserted in the subsurface there are chances to clogging, once emitters are clogged, it is difficult to unclog in subsur-face [LAZAROVITCH et al. 2006]. So it is necessary to find out the subsurface irrigation methods without a problem of clogging. The grape yield is possible with the reasonable and planned deficit irrigation us-ing drip [FACI et al. 2014]. ARAGÜÉS et al. [2014] has studied in combination with deficit irrigation strate-gies, its implementation in low-precipitation semiarid areas must be cautiously assessed and monitored. The use of subsurface drip irrigation (SDI) systems may afford an enhancement in irrigation water use produc-tivity. These systems are applying irrigation water straight to the ground [AYARS et al. 1999]. Subsurface drip irrigation method (SDI system) using the perfo-rated PVC pipe is the best method to overcome the clogging problems [MARTÍNEZ, RECA 2014].
In this study, field experiment is carried out on the grape yard using six different irrigation methods. The drip irrigation method which is the most accepted and effective method of irrigation is basically consid-ered in this study for developing different irrigation methods. Developed and used irrigation methods in this experimental study are drip irrigation (DI), drip irrigation with the plastic mulching (DIPM), drip irri-gation with organic mulching (DIOM), subsurface irrigation with the stone column (SISC), subsurface irrigation with the mud pot (SIMP) and subsurface irrigation with plastic bottles (SIPB). Laterals and emitters are common in all those mentioned irrigation systems. In case of the surface irrigation methods wa-ter is released into the atmosphere from the emitters. In the subsurface irrigation methods, water directly reaches the root zone of the crop. Objective of this study is to find out the efficient soil moisture retention and economically affordable irrigation system among six mentioned systems.
MATERIALS AND METHODS
STUDY AREA
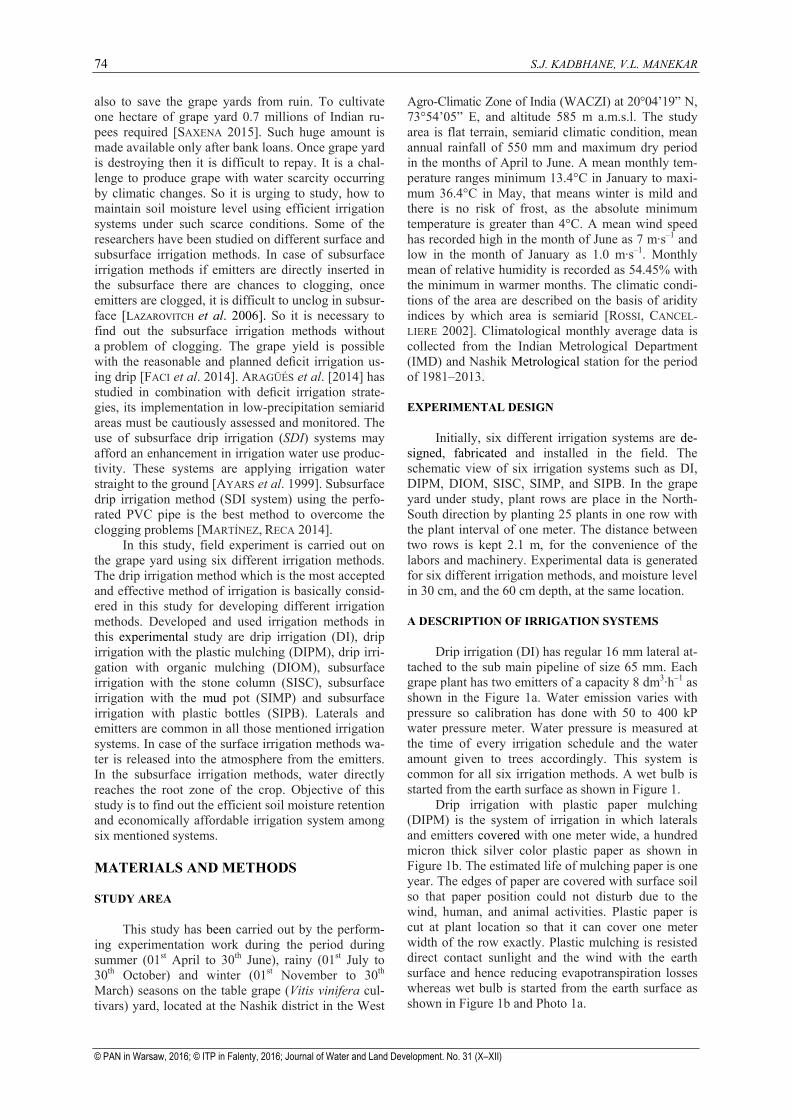
This study has been carried out by the perform-ing experimentation work during the period during summer (01st April to 30th June), rainy (01st July to 30th October) and winter (01st November to 30th March) seasons on the table grape (Vitis vinifera cul-tivars) yard, located at the Nashik district in the West
Agro-Climatic Zone of India (WACZI) at 20°04’19” N, 73°54’05” E, and altitude 585 m a.m.s.l. The study area is flat terrain, semiarid climatic condition, mean annual rainfall of 550 mm and maximum dry period in the months of April to June. A mean monthly tem-perature ranges minimum 13.4°C in January to maxi-mum 36.4°C in May, that means winter is mild and there is no risk of frost, as the absolute minimum temperature is greater than 4°C. A mean wind speed has recorded high in the month of June as 7 m·s–1 and low in the month of January as 1.0 m·s–1. Monthly mean of relative humidity is recorded as 54.45% with the minimum in warmer months. The climatic condi-tions of the area are described on the basis of aridity indices by which area is semiarid [ROSSI, CANCEL-LIERE 2002]. Climatological monthly average data is collected from the Indian Metrological Department (IMD) and Nashik Metrological station for the period of 1981–2013.
EXPERIMENTAL DESIGN
Initially, six different irrigation systems are de-signed, fabricated and installed in the field. The schematic view of six irrigation systems such as DI, DIPM, DIOM, SISC, SIMP, and SIPB. In the grape yard under study, plant rows are place in the North-South direction by planting 25 plants in one row with the plant interval of one meter. The distance between two rows is kept 2.1 m, for the convenience of the labors and machinery. Experimental data is generated for six different irrigation methods, and moisture level in 30 cm, and the 60 cm depth, at the same location.
A DESCRIPTION OF IRRIGATION SYSTEMS
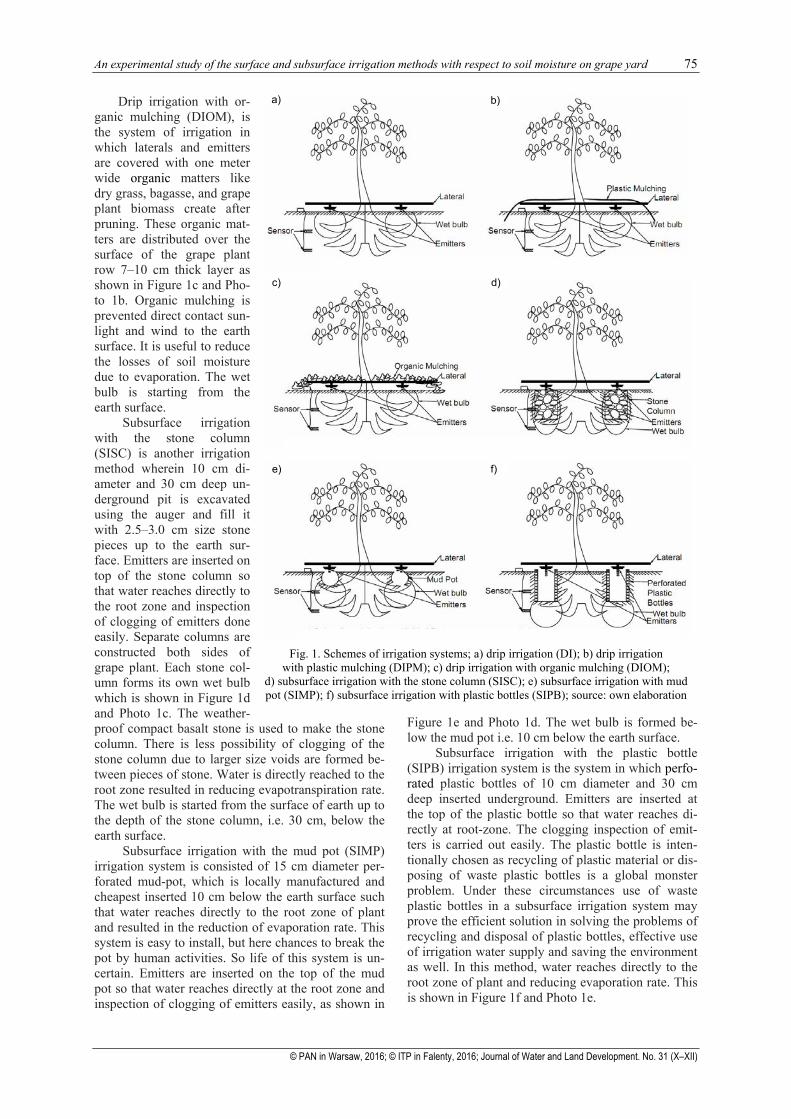
Drip irrigation (DI) has regular 16 mm lateral at-tached to the sub main pipeline of size 65 mm. Each grape plant has two emitters of a capacity 8 dm3·h–1 as shown in the Figure 1a. Water emission varies with pressure so calibration has done with 50 to 400 kP water pressure meter. Water pressure is measured at the time of every irrigation schedule and the water amount given to trees accordingly. This system is common for all six irrigation methods. A wet bulb is started from the earth surface as shown in Figure 1.
Drip irrigation with plastic paper mulching (DIPM) is the system of irrigation in which laterals and emitters covered with one meter wide, a hundred micron thick silver color plastic paper as shown in Figure 1b. The estimated life of mulching paper is one year. The edges of paper are covered with surface soil so that paper position could not disturb due to the wind, human, and animal activities. Plastic paper is cut at plant location so that it can cover one meter width of the row exactly. Plastic mulching is resisted direct contact sunlight and the wind with the earth surface and hence reducing evapotranspiration losses whereas wet bulb is started from the earth surface as shown in Figure 1b and Photo 1a.
An experimental study of the surface and subsurface irrigation methods with respect to soil moisture on grape yard 75
© PAN in Warsaw, 2016; © ITP in Falenty, 2016; Journal of Water and Land Development. No. 31 (X–XII)
Drip irrigation with or-ganic mulching (DIOM), is the system of irrigation in which laterals and emitters are covered with one meter wide organic matters like dry grass, bagasse, and grape plant biomass create after pruning. These organic mat-ters are distributed over the surface of the grape plant row 7–10 cm thick layer as shown in Figure 1c and Pho-to 1b. Organic mulching is prevented direct contact sun-light and wind to the earth surface. It is useful to reduce the losses of soil moisture due to evaporation. The wet bulb is starting from the earth surface.
Subsurface irrigation with the stone column (SISC) is another irrigation method wherein 10 cm di-ameter and 30 cm deep un-derground pit is excavated using the auger and fill it with 2.5–3.0 cm size stone pieces up to the earth sur-face. Emitters are inserted on top of the stone column so that water reaches directly to the root zone and inspection of clogging of emitters done easily. Separate columns are constructed both sides of grape plant. Each stone col-umn forms its own wet bulb which is shown in Figure 1d and Photo 1c. The weather-proof compact basalt stone is used to make the stone column. There is less possibility of clogging of the stone column due to larger size voids are formed be-tween pieces of stone. Water is directly reached to the root zone resulted in reducing evapotranspiration rate. The wet bulb is started from the surface of earth up to the depth of the stone column, i.e. 30 cm, below the earth surface.
Subsurface irrigation with the mud pot (SIMP) irrigation system is consisted of 15 cm diameter per-forated mud-pot, which is locally manufactured and cheapest inserted 10 cm below the earth surface such that water reaches directly to the root zone of plant and resulted in the reduction of evaporation rate. This system is easy to install, but here chances to break the pot by human activities. So life of this system is un-certain. Emitters are inserted on the top of the mud pot so that water reaches directly at the root zone and inspection of clogging of emitters easily, as shown in
Figure 1e and Photo 1d. The wet bulb is formed be-low the mud pot i.e. 10 cm below the earth surface.
Subsurface irrigation with the plastic bottle (SIPB) irrigation system is the system in which perfo-rated plastic bottles of 10 cm diameter and 30 cm deep inserted underground. Emitters are inserted at the top of the plastic bottle so that water reaches di-rectly at root-zone. The clogging inspection of emit-ters is carried out easily. The plastic bottle is inten-tionally chosen as recycling of plastic material or dis-posing of waste plastic bottles is a global monster problem. Under these circumstances use of waste plastic bottles in a subsurface irrigation system may prove the efficient solution in solving the problems of recycling and disposal of plastic bottles, effective use of irrigation water supply and saving the environment as well. In this method, water reaches directly to the root zone of plant and reducing evaporation rate. This is shown in Figure 1f and Photo 1e.
Fig. 1. Schemes of irrigation systems; a) drip irrigation (DI); b) drip irrigation with plastic mulching (DIPM); c) drip irrigation with organic mulching (DIOM);
d) subsurface irrigation with the stone column (SISC); e) subsurface irrigation with mud pot (SIMP); f) subsurface irrigation with plastic bottles (SIPB); source: own elaboration
a) b)
c) d)
e) f)
76 S.J. KADBHANE, V.L. MANEKAR
© PAN in Warsaw, 2016; © ITP in Falenty, 2016; Journal of Water and Land Development. No. 31 (X–XII)
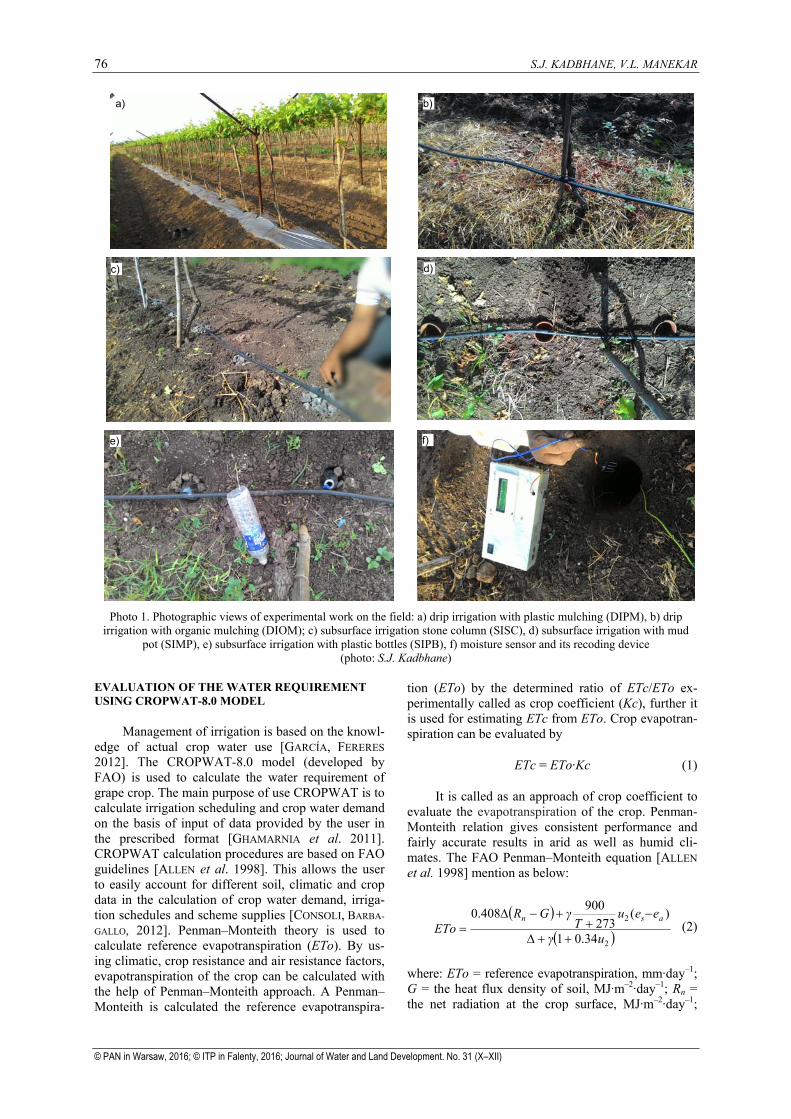
Photo 1. Photographic views of experimental work on the field: a) drip irrigation with plastic mulching (DIPM), b) drip
irrigation with organic mulching (DIOM); c) subsurface irrigation stone column (SISC), d) subsurface irrigation with mud pot (SIMP), e) subsurface irrigation with plastic bottles (SIPB), f) moisture sensor and its recoding device
(photo: S.J. Kadbhane) EVALUATION OF THE WATER REQUIREMENT USING CROPWAT-8.0 MODEL
Management of irrigation is based on the knowl-edge of actual crop water use [GARCÍA, FERERES 2012]. The CROPWAT-8.0 model (developed by FAO) is used to calculate the water requirement of grape crop. The main purpose of use CROPWAT is to calculate irrigation scheduling and crop water demand on the basis of input of data provided by the user in the prescribed format [GHAMARNIA et al. 2011]. CROPWAT calculation procedures are based on FAO guidelines [ALLEN et al. 1998]. This allows the user to easily account for different soil, climatic and crop data in the calculation of crop water demand, irriga-tion schedules and scheme supplies [CONSOLI, BARBA-
GALLO, 2012]. Penman–Monteith theory is used to calculate reference evapotranspiration (ETo). By us-ing climatic, crop resistance and air resistance factors, evapotranspiration of the crop can be calculated with the help of Penman–Monteith approach. A Penman–Monteith is calculated the reference evapotranspira-
tion (ETo) by the determined ratio of ETc/ETo ex-perimentally called as crop coefficient (Kc), further it is used for estimating ETc from ETo. Crop evapotran-spiration can be evaluated by
ETc = ETo·Kc (1)
It is called as an approach of crop coefficient to evaluate the evapotranspiration of the crop. Penman-Monteith relation gives consistent performance and fairly accurate results in arid as well as humid cli-mates. The FAO Penman–Monteith equation [ALLEN et al. 1998] mention as below:
( )
( )2
2
34.01
)(273
900408.0
uγ
eeuTγGR
EToasn
++Δ
−+
+−Δ= (2)
where: ETo = reference evapotranspiration, mm·day–1; G = the heat flux density of soil, MJ·m–2·day–1; Rn = the net radiation at the crop surface, MJ·m–2·day–1;
a) b)
c) d)
e) f)
An experimental study of the surface and subsurface irrigation methods with respect to soil moisture on grape yard 77
© PAN in Warsaw, 2016; © ITP in Falenty, 2016; Journal of Water and Land Development. No. 31 (X–XII)
T = mean of air temperature at 2 m height daily, °C; u2 = wind speed at 2 m height, m·s–1; ∆ = the slope of the vapour pressure curve, kPa·°C–1; ea = the actual vapour pressure, kPa; γ = the psychrometric constant, kPa·°C–1; es = the saturation vapour pressure, kPa; es – ea = the deficit saturation vapour pressure, kPa.
PHENOLOGY OF GRAPE CROP
Kc coefficient is varying with phenological stag-es, so water requirement varies accordingly. The grape crop is pruned twice in a year. First pruning is in the first week of April to germinate the bunch itself in tree branches. Second pruning is in the second week of October. The seasonal dynamics of Kc is af-fected due to an environmental condition (temperate vs tropical) and the age of the grape crop. The sea-sonal crop coefficients are different in two phases, 1. Kc has increased during active growth to peak canopy size and 2. Kc is decreased during leaf senescence. The relationship of Kc and leaf area index cannot unique due to large variation in a canopy structure with pruning and training systems i.e. the link is dif-ferent for decreasing or increasing of Kc [NETZER et al. 2009]. So according to theory mention above Kc value is changed according to the phenological stage, has taken as 0.4 for 0–25 days after pruning, 0.7 for 26–149 days after pruning and 0.5 for 150–180 days after pruning.
SOIL MOISTURE MEASUREMENT USING SENSORS
Two sensors at the different depth at the same location give more beneficial information than they place at the separate location [STEDUTO et al. 2012]. ECH2O of Decagon Devices capacitive sensors are mounted to soil moisture measurement. The resolu-tions of sensors are 0.002 m and have a margin of error of about 2% according to the manufacturer’s declaration. Two 15-cm probes are installed in each location.
As per Indian standards [IS:2720-2] Water/ moisture content of a soil mass is defined as the ratio of the mass of water in the voids to the mass of solids, as shown below in the equation (3)
s
wv V
V=θ (3)
where: θv = soil moisture (m3·m–3), Vw = the volume of water, m3; Vs = the volume of soil, m3.
The water content, which is usually expressed as a percentage, can range from zero (dry soil) to 30% (fully saturated soil). The natural water content of most soils is well under 15%. Sensor probe output readings are calibrated using different moisture level range from the 100 g oven dried sample having 0% water content taken in 10 no of bolus and water is
added 0–30% at the interval of 3% . The sensor probe is inserted in each bowl and output device calibrate accordingly so ensuring the device for giving appro-priate readings. After calibration, sensors are inserted at the shallow depth at 30 cm, while the deeper sensor is placed at 60 cm or even deeper, depending on root depth. Sophisticated electronics instrument is given continuous records of soil moisture at several depths as shown in Photo 1f. Observations are taken periodi-cally once in 2 days.
IRRIGATION SCHEDULING
By using CROPWAT result it is easy to decide the water requirement of the crop. There has the daily water requirement of the crop, but to reduce conven-ience losses and clogging of soil, irrigation is sched-uled once in 5–6 days. Irrigation is scheduled mostly in the early morning period to reduce the surface evaporation losses during the summer. The farm pond is used for irrigation water supply. Water is lift using the 3 Hp electric pump, through the 75 mm PVC pipe-line. The laterals are attached to the pipeline. At the time of irrigation scheduling, water pressure is meas-ured at the end of the lateral using pressure meter RODRÍGUEZ et al. [2009].
Water amount is calculated by the simple rela-tionship, i.e. duration of drip irrigation by using the equation (4):
Duration of irrigation (h) NEC
NIRPIRI⋅
⋅⋅⋅=
1000 (4)
where: RI = the row interval, m; PI = the plant inter-val, m; NIR = the net irrigation requirement, m; EC = irrigation capacity, dm3·h–1; N = the number of emit-ters per plant.
PROPERTIES OF SOIL
Soil investigation is carried out using the field test. A pit of size 1 × 1 × 1.2 m is excavated to collect the soil. The initial available soil moisture is meas-ured using non-disturbed soil sample from the ex-perimental site using the core cutter and soil moisture measured using oven dry method and infiltration rate using a varying head permeability test. Chemical properties of soil are tested in the National Horticul-ture Research and Development Center (NHRDC), Bio-Chemistry Division, Nashik. As per testing re-port, properties are as given, pH 8.41, electrical con-ductivity 0.232 dS·m–1, organic carbon 0.99%, avail-able nitrogen 508.4 kg·ha–1, available phosphorus 25.50 kg·ha–1, available potash 336.0 kg·ha–1, avail-able calcium 640 mg·kg–1, available sodium 260 mg·kg–1, calcium carbonate 11.4%, magnesium 288 mg·kg–1, chlorides 1.59 mg·kg–1, sulphur 9.6 mg·kg–1, copper 2.339 mg·kg–1, iron 1.699 mg·kg–1, manganese 2.220 mg·kg–1, and zinc 0.6724 mg·kg–1.
78 S.J. KADBHANE, V.L. MANEKAR
© PAN in Warsaw, 2016; © ITP in Falenty, 2016; Journal of Water and Land Development. No. 31 (X–XII)
CROPPING TECHNIQUES
All the cropping techniques such as tillage, prun-ing, fertilisers, pesticides and fungicides are common for all the methods. Tillage is done up to 10 cm deep once in summer using 18.5 Hp. tractors to protect cracking in soil surface. Organic like vermin compost and cow dung are use as fertilisers 5 kg per grape plant. Foundation pruning is carried out on 1st April and fruit pruning is carried out 16 October. A Car-bendazim-50% WP and Copper hydroxide was use as fungicides and Diclorovos-50 is use as pesticides. Sometime plant manure use for spraying purpose.
THE COST AND BENEFITS OF IRRIGATION SYSTEMS
Irrigation water sources like well, farm pond and convinced system like pipeline, laterals, and emitters are common in all irrigation system. DI system is not required any addition material, so extra expenses have not indicated. The cost of material and labour is con-sidered in the cost analysis subjected to market rates. In DIPM system, 1 m wide and 100-micron plastic paper is chosen for this system. In the DIOM system, organic material purchased from the organic producer agencies and the organic biomass after pruning is also used as organic mulching material.
Basalt rocks of size 2.5–3.0 cm sizes are pur-chased from nearby stone mining. Mud pots of 10 cm diameter have purchased for the SIMP system. Plastic bottles are purchased from scrap materials shop for the SIPB system. Plastic bottles are first cut from bot-toms and making the perforations of 5 to 10 mm on the vertical surface of the bottle and then placed in the excavated pit.
The benefit of irrigation systems is calculated using percentage water saving in each irrigation sys-tem. The cost of water is considered subjected to market rates as per local water supply agencies at the time of water scarcity.
MULTIFACTORIAL STATISTICS ANALYSIS
Assessment of influences of considered factor on the dependent variables is carried out by multifacto-rial analysis using analysis of variance (ANOVA) method. Only evapotranspiration has considered in analysis to study its effect on the soil moisture level. In this analysis moisture level at the 30 cm and 60 cm depth with DI, DIPM, DIOM, SISC, SIMP, and SIPB system are selected as dependent variable and the irri-gation water considered as independent variable. Sta-tistical analysis is carried out using Microsoft Excel Statistical Analysis Pact-2010.
RESULTS AND DISCUSSIONS
MEASUREMENT OF EVAPOTRANSPIRATION, NET WATER REQUIREMENTS
Water requirement is varying with season, so it is planned during the summer (01st April to 30th June), rainy (01st July to 30th October) and winter (01st No-vember to 30th March) seasons using different irriga-tion methods and measured their effects on soil mois-ture. Climate data is collected on the daily basis from the Ozar (Nashik) weather station, which is located 2.1 km from experimental field. Precipitation mainly occurs in the months of July to October shown in the Table 1. There are very high variations in effective precipitation as compared to reference evapotranspira-tion. Evapotranspiration is taken common for all irri-gation systems so that it easy calculate the water re-quirement of the crop per day, but we can regulate provided water for the crop using sensor readings so that it is easy to find out the amount of water saving.
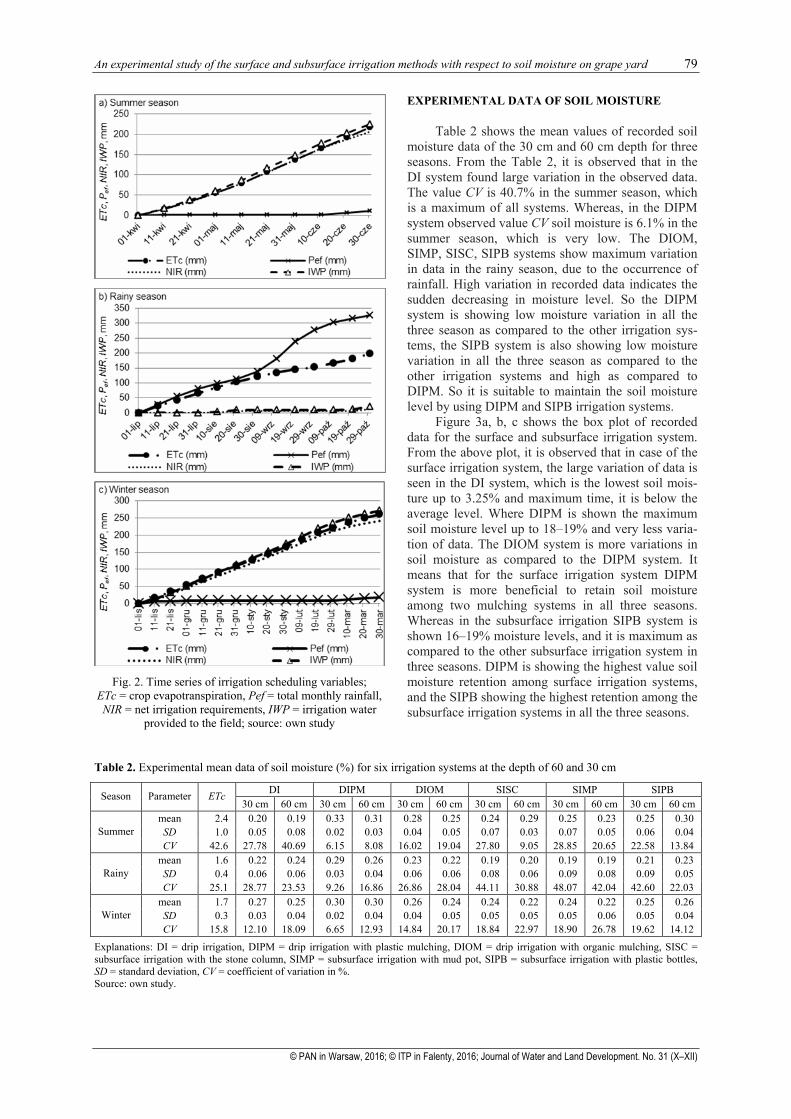
As evapotranspiration increases, net irrigation requirement also increases, but in the month of July to October irrigation requirement is fulfilling by precipi-tation. A net irrigation requirement is the difference of reference evapotranspiration and effective rainfall as shown in Figure 2a, b, c. Hence monthly water de-mands are varying and crop water demand is a maxi-mum in summer i.e. April to June in the study area, as compared to rainy and the winter season.
Table 1. The seasonal climate and irrigation scheduling variables
ETc Pef NIR IWP ε Season Period mm %
April 55.1 1.7 53.5 60.0 5.73 May 82.6 0.6 81.9 90.0 4.71 June 78.7 10.0 68.0 70.0 1.44 mean 72.1 4.1 67.8 73.3 3.96 SD 12.1 4.2 11.6 12.5 1.83
Sum
mer
seas
on
CV(%) 16.8 102.3 17.1 17.0 46.17 July 65.5 80.3 8.0 10.0 11.11
August 55.2 57.2 0.0 0.0 0.00 September 31.8 138.7 5.6 7.0 11.11
October 45.9 49.6 7.8 10.0 12.36 mean 49.6 81.5 5.4 6.8 8.65 SD 12.4 34.9 3.2 4.1 5.02 R
ainy
seas
on
CV(%) 25.0 42.9 60.4 60.5 58.04 November 54.2 9.0 45.3 50.0 4.93 December 56.0 0.1 55.9 60.0 3.54 January 55.8 0.0 55.8 60.0 3.63 February 54.4 0.1 54.2 60.0 5.08
March 39.7 9.7 30.1 35.0 7.53 mean 52.0 3.8 48.3 53.0 4.90 SD 6.2 4.6 9.9 9.8 1.40
Win
ter s
easo
n
CV(%) 11.9 120.5 20.5 18.5 29.20
Explanations: ETc = reference evapotranspiration at standard condi-tions; Pef = total monthly rainfall; NIR = net irrigation requirements; IWP = irrigation water provided to the field; ε = relative deviation between IWP and NIR. SD = standard deviation; CV(%) = coeffi-cient of variation. Source: own study.
An experimental study of the surface and subsurface irrigation methods with respect to soil moisture on grape yard 79
© PAN in Warsaw, 2016; © ITP in Falenty, 2016; Journal of Water and Land Development. No. 31 (X–XII)
Fig. 2. Time series of irrigation scheduling variables;
ETc = crop evapotranspiration, Pef = total monthly rainfall, NIR = net irrigation requirements, IWP = irrigation water
provided to the field; source: own study
EXPERIMENTAL DATA OF SOIL MOISTURE
Table 2 shows the mean values of recorded soil moisture data of the 30 cm and 60 cm depth for three seasons. From the Table 2, it is observed that in the DI system found large variation in the observed data. The value CV is 40.7% in the summer season, which is a maximum of all systems. Whereas, in the DIPM system observed value CV soil moisture is 6.1% in the summer season, which is very low. The DIOM, SIMP, SISC, SIPB systems show maximum variation in data in the rainy season, due to the occurrence of rainfall. High variation in recorded data indicates the sudden decreasing in moisture level. So the DIPM system is showing low moisture variation in all the three season as compared to the other irrigation sys-tems, the SIPB system is also showing low moisture variation in all the three season as compared to the other irrigation systems and high as compared to DIPM. So it is suitable to maintain the soil moisture level by using DIPM and SIPB irrigation systems.
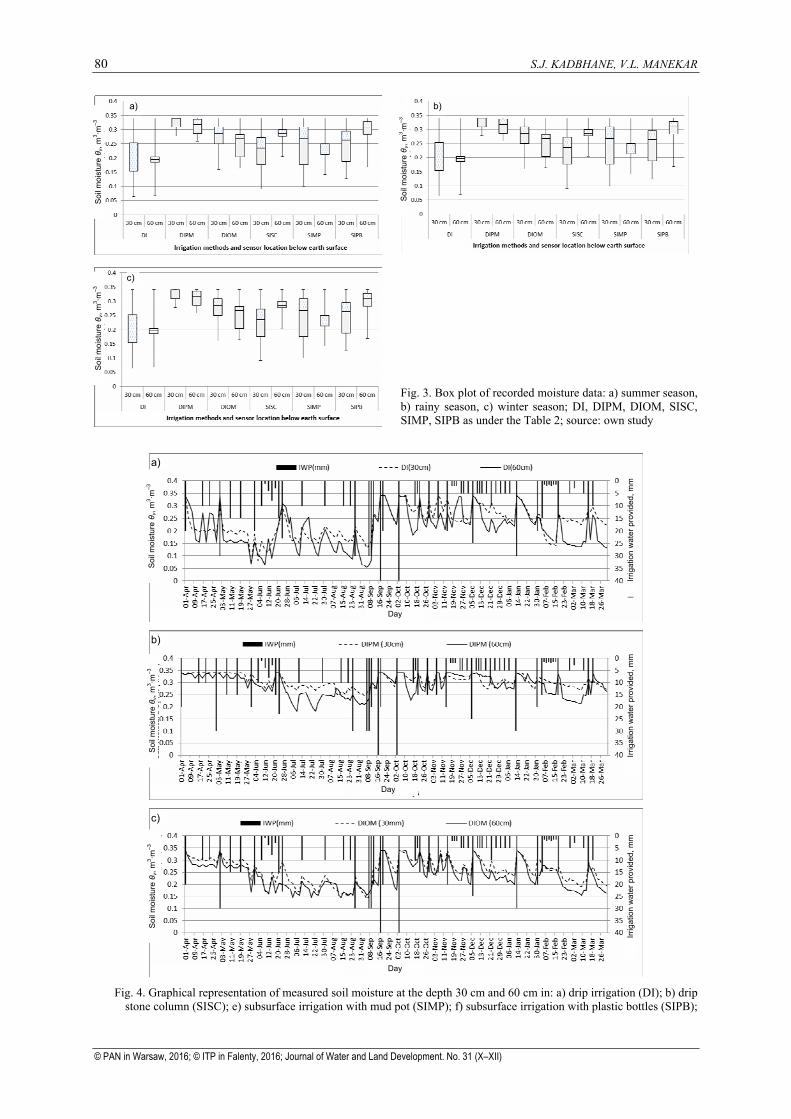
Figure 3a, b, c shows the box plot of recorded data for the surface and subsurface irrigation system. From the above plot, it is observed that in case of the surface irrigation system, the large variation of data is seen in the DI system, which is the lowest soil mois-ture up to 3.25% and maximum time, it is below the average level. Where DIPM is shown the maximum soil moisture level up to 18–19% and very less varia-tion of data. The DIOM system is more variations in soil moisture as compared to the DIPM system. It means that for the surface irrigation system DIPM system is more beneficial to retain soil moisture among two mulching systems in all three seasons. Whereas in the subsurface irrigation SIPB system is shown 16–19% moisture levels, and it is maximum as compared to the other subsurface irrigation system in three seasons. DIPM is showing the highest value soil moisture retention among surface irrigation systems, and the SIPB showing the highest retention among the subsurface irrigation systems in all the three seasons.
Table 2. Experimental mean data of soil moisture (%) for six irrigation systems at the depth of 60 and 30 cm
DI DIPM DIOM SISC SIMP SIPB Season Parameter ETc 30 cm 60 cm 30 cm 60 cm 30 cm 60 cm 30 cm 60 cm 30 cm 60 cm 30 cm 60 cm
mean 2.4 0.20 0.19 0.33 0.31 0.28 0.25 0.24 0.29 0.25 0.23 0.25 0.30 SD 1.0 0.05 0.08 0.02 0.03 0.04 0.05 0.07 0.03 0.07 0.05 0.06 0.04 Summer CV 42.6 27.78 40.69 6.15 8.08 16.02 19.04 27.80 9.05 28.85 20.65 22.58 13.84
mean 1.6 0.22 0.24 0.29 0.26 0.23 0.22 0.19 0.20 0.19 0.19 0.21 0.23 SD 0.4 0.06 0.06 0.03 0.04 0.06 0.06 0.08 0.06 0.09 0.08 0.09 0.05 Rainy CV 25.1 28.77 23.53 9.26 16.86 26.86 28.04 44.11 30.88 48.07 42.04 42.60 22.03
mean 1.7 0.27 0.25 0.30 0.30 0.26 0.24 0.24 0.22 0.24 0.22 0.25 0.26 SD 0.3 0.03 0.04 0.02 0.04 0.04 0.05 0.05 0.05 0.05 0.06 0.05 0.04 Winter CV 15.8 12.10 18.09 6.65 12.93 14.84 20.17 18.84 22.97 18.90 26.78 19.62 14.12
Explanations: DI = drip irrigation, DIPM = drip irrigation with plastic mulching, DIOM = drip irrigation with organic mulching, SISC = subsurface irrigation with the stone column, SIMP = subsurface irrigation with mud pot, SIPB = subsurface irrigation with plastic bottles, SD = standard deviation, CV = coefficient of variation in %. Source: own study.
80 S.J. KADBHANE, V.L. MANEKAR
© PAN in Warsaw, 2016; © ITP in Falenty, 2016; Journal of Water and Land Development. No. 31 (X–XII)
Fig. 3. Box plot of recorded moisture data: a) summer season, b) rainy season, c) winter season; DI, DIPM, DIOM, SISC, SIMP, SIPB as under the Table 2; source: own study
Fig. 4. Graphical representation of measured soil moisture at the depth 30 cm and 60 cm in: a) drip irrigation (DI); b) drip
stone column (SISC); e) subsurface irrigation with mud pot (SIMP); f) subsurface irrigation with plastic bottles (SIPB);
Soi
l moi
stur
e θ v
, m3 ·m
–3
Soi
l moi
stur
e θ v
, m3 ·m
–3
Soi
l moi
stur
e θ v
, m3 ·m
–3
Soi
l moi
stur
e θ v
, m3 ·m
–3
Soi
l moi
stur
e θ v
, m3 ·m
–3
Soi
l moi
stur
e θ v
, m3 ·m
–3
Irrig
atio
n w
ater
pro
vide
d, m
mIrr
igat
ion
wat
er p
rovi
ded,
mm
Irrig
atio
n w
ater
pro
vide
d, m
m
a)
b)
c)
Day
Day
Day
a) b)
c)
An experimental study of the surface and subsurface irrigation methods with respect to soil moisture on grape yard 81
© PAN in Warsaw, 2016; © ITP in Falenty, 2016; Journal of Water and Land Development. No. 31 (X–XII)
AN IMPACT OF IRRIGATION SYSTEMS ON SOIL MOISTURE
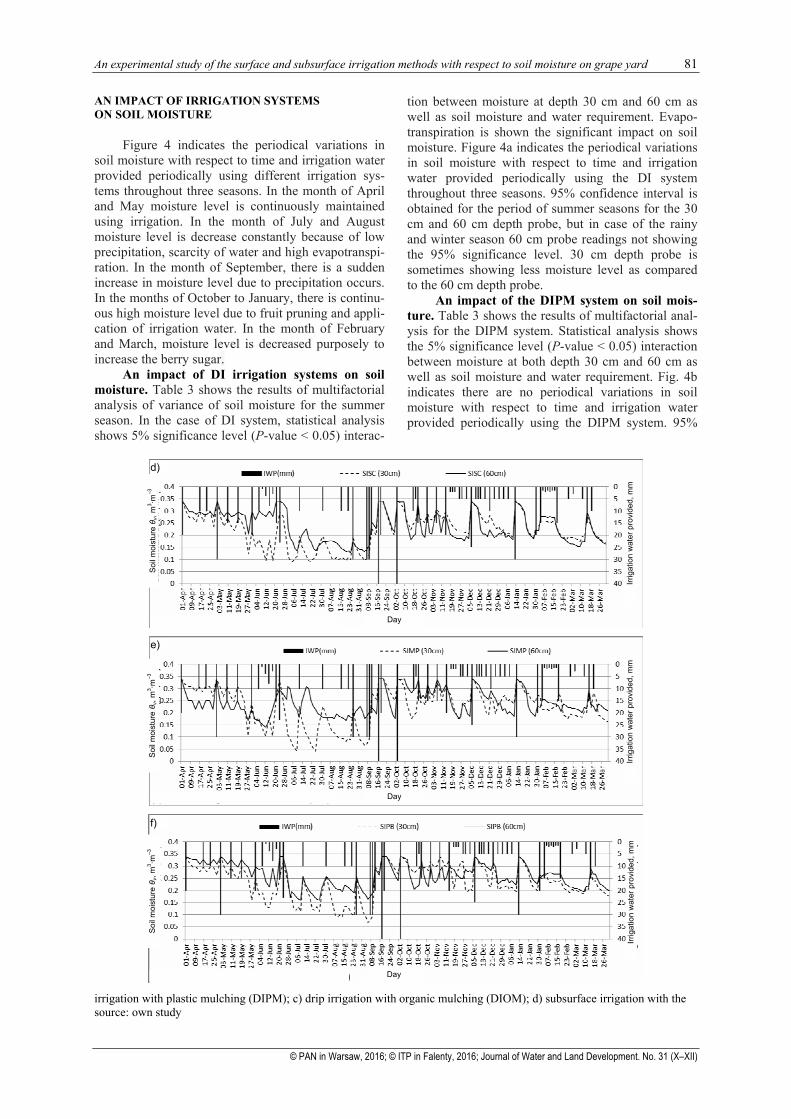
Figure 4 indicates the periodical variations in soil moisture with respect to time and irrigation water provided periodically using different irrigation sys-tems throughout three seasons. In the month of April and May moisture level is continuously maintained using irrigation. In the month of July and August moisture level is decrease constantly because of low precipitation, scarcity of water and high evapotranspi-ration. In the month of September, there is a sudden increase in moisture level due to precipitation occurs. In the months of October to January, there is continu-ous high moisture level due to fruit pruning and appli-cation of irrigation water. In the month of February and March, moisture level is decreased purposely to increase the berry sugar.
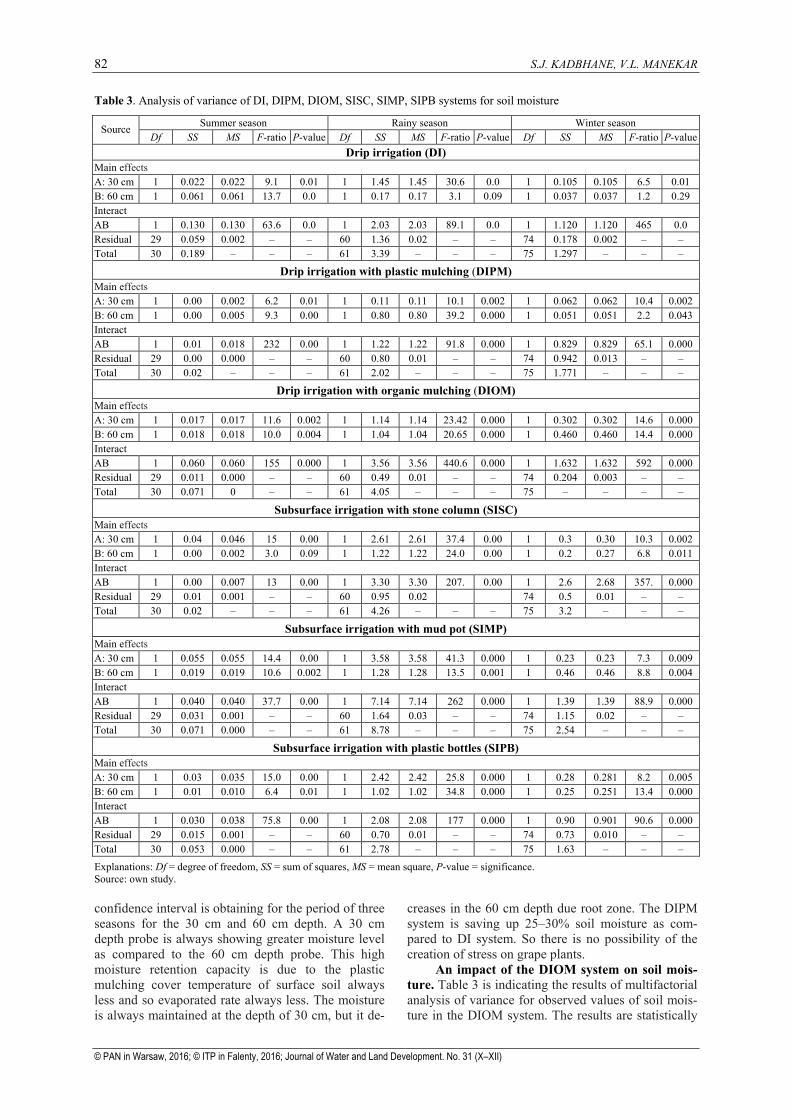
An impact of DI irrigation systems on soil moisture. Table 3 shows the results of multifactorial analysis of variance of soil moisture for the summer season. In the case of DI system, statistical analysis shows 5% significance level (P-value < 0.05) interac-
tion between moisture at depth 30 cm and 60 cm as well as soil moisture and water requirement. Evapo-transpiration is shown the significant impact on soil moisture. Figure 4a indicates the periodical variations in soil moisture with respect to time and irrigation water provided periodically using the DI system throughout three seasons. 95% confidence interval is obtained for the period of summer seasons for the 30 cm and 60 cm depth probe, but in case of the rainy and winter season 60 cm probe readings not showing the 95% significance level. 30 cm depth probe is sometimes showing less moisture level as compared to the 60 cm depth probe.
An impact of the DIPM system on soil mois-ture. Table 3 shows the results of multifactorial anal-ysis for the DIPM system. Statistical analysis shows the 5% significance level (P-value < 0.05) interaction between moisture at both depth 30 cm and 60 cm as well as soil moisture and water requirement. Fig. 4b indicates there are no periodical variations in soil moisture with respect to time and irrigation water provided periodically using the DIPM system. 95%
irrigation with plastic mulching (DIPM); c) drip irrigation with organic mulching (DIOM); d) subsurface irrigation with the source: own study
Soi
l moi
stur
e θ v
, m3 ·m
–3
Soi
l moi
stur
e θ v
, m3 ·m
–3
Soi
l moi
stur
e θ v
, m3 ·m
–3
Irrig
atio
n w
ater
pro
vide
d, m
mIrr
igat
ion
wat
er p
rovi
ded,
mm
Irrig
atio
n w
ater
pro
vide
d, m
m
d)
e)
f)
Day
Day
Day
82 S.J. KADBHANE, V.L. MANEKAR
© PAN in Warsaw, 2016; © ITP in Falenty, 2016; Journal of Water and Land Development. No. 31 (X–XII)
Table 3. Analysis of variance of DI, DIPM, DIOM, SISC, SIMP, SIPB systems for soil moisture
Summer season Rainy season Winter season Source Df SS MS F-ratio P-value Df SS MS F-ratio P-value Df SS MS F-ratio P-value
Drip irrigation (DI) Main effects A: 30 cm 1 0.022 0.022 9.1 0.01 1 1.45 1.45 30.6 0.0 1 0.105 0.105 6.5 0.01 B: 60 cm 1 0.061 0.061 13.7 0.0 1 0.17 0.17 3.1 0.09 1 0.037 0.037 1.2 0.29 Interact AB 1 0.130 0.130 63.6 0.0 1 2.03 2.03 89.1 0.0 1 1.120 1.120 465 0.0 Residual 29 0.059 0.002 – – 60 1.36 0.02 – – 74 0.178 0.002 – – Total 30 0.189 – – – 61 3.39 – – – 75 1.297 – – –
Drip irrigation with plastic mulching (DIPM) Main effects A: 30 cm 1 0.00 0.002 6.2 0.01 1 0.11 0.11 10.1 0.002 1 0.062 0.062 10.4 0.002 B: 60 cm 1 0.00 0.005 9.3 0.00 1 0.80 0.80 39.2 0.000 1 0.051 0.051 2.2 0.043 Interact AB 1 0.01 0.018 232 0.00 1 1.22 1.22 91.8 0.000 1 0.829 0.829 65.1 0.000 Residual 29 0.00 0.000 – – 60 0.80 0.01 – – 74 0.942 0.013 – – Total 30 0.02 – – – 61 2.02 – – – 75 1.771 – – –
Drip irrigation with organic mulching (DIOM) Main effects A: 30 cm 1 0.017 0.017 11.6 0.002 1 1.14 1.14 23.42 0.000 1 0.302 0.302 14.6 0.000 B: 60 cm 1 0.018 0.018 10.0 0.004 1 1.04 1.04 20.65 0.000 1 0.460 0.460 14.4 0.000 Interact AB 1 0.060 0.060 155 0.000 1 3.56 3.56 440.6 0.000 1 1.632 1.632 592 0.000 Residual 29 0.011 0.000 – – 60 0.49 0.01 – – 74 0.204 0.003 – – Total 30 0.071 0 – – 61 4.05 – – – 75 – – – –
Subsurface irrigation with stone column (SISC) Main effects A: 30 cm 1 0.04 0.046 15 0.00 1 2.61 2.61 37.4 0.00 1 0.3 0.30 10.3 0.002 B: 60 cm 1 0.00 0.002 3.0 0.09 1 1.22 1.22 24.0 0.00 1 0.2 0.27 6.8 0.011 Interact AB 1 0.00 0.007 13 0.00 1 3.30 3.30 207. 0.00 1 2.6 2.68 357. 0.000 Residual 29 0.01 0.001 – – 60 0.95 0.02 74 0.5 0.01 – – Total 30 0.02 – – – 61 4.26 – – – 75 3.2 – – –
Subsurface irrigation with mud pot (SIMP) Main effects A: 30 cm 1 0.055 0.055 14.4 0.00 1 3.58 3.58 41.3 0.000 1 0.23 0.23 7.3 0.009 B: 60 cm 1 0.019 0.019 10.6 0.002 1 1.28 1.28 13.5 0.001 1 0.46 0.46 8.8 0.004 Interact AB 1 0.040 0.040 37.7 0.00 1 7.14 7.14 262 0.000 1 1.39 1.39 88.9 0.000 Residual 29 0.031 0.001 – – 60 1.64 0.03 – – 74 1.15 0.02 – – Total 30 0.071 0.000 – – 61 8.78 – – – 75 2.54 – – –
Subsurface irrigation with plastic bottles (SIPB) Main effects A: 30 cm 1 0.03 0.035 15.0 0.00 1 2.42 2.42 25.8 0.000 1 0.28 0.281 8.2 0.005 B: 60 cm 1 0.01 0.010 6.4 0.01 1 1.02 1.02 34.8 0.000 1 0.25 0.251 13.4 0.000 Interact AB 1 0.030 0.038 75.8 0.00 1 2.08 2.08 177 0.000 1 0.90 0.901 90.6 0.000 Residual 29 0.015 0.001 – – 60 0.70 0.01 – – 74 0.73 0.010 – – Total 30 0.053 0.000 – – 61 2.78 – – – 75 1.63 – – –
Explanations: Df = degree of freedom, SS = sum of squares, MS = mean square, P-value = significance. Source: own study.
confidence interval is obtaining for the period of three seasons for the 30 cm and 60 cm depth. A 30 cm depth probe is always showing greater moisture level as compared to the 60 cm depth probe. This high moisture retention capacity is due to the plastic mulching cover temperature of surface soil always less and so evaporated rate always less. The moisture is always maintained at the depth of 30 cm, but it de-
creases in the 60 cm depth due root zone. The DIPM system is saving up 25–30% soil moisture as com-pared to DI system. So there is no possibility of the creation of stress on grape plants.
An impact of the DIOM system on soil mois-ture. Table 3 is indicating the results of multifactorial analysis of variance for observed values of soil mois-ture in the DIOM system. The results are statistically
An experimental study of the surface and subsurface irrigation methods with respect to soil moisture on grape yard 83
© PAN in Warsaw, 2016; © ITP in Falenty, 2016; Journal of Water and Land Development. No. 31 (X–XII)
significant because of statistical analysis shows the 5% significance level (P-value < 0.05) interaction between moisture at both depth 30 cm and 60 cm as well as soil moisture and water requirement. Figure 4c is showing the periodical variations in soil moisture with respect to the time and irrigation water provided in the DIOM system. The 30 cm depth and 60 cm depth sensors are showing 95% confidence interval obtained for soil moisture at the period of three sea-sons.
30 cm depth probe is always showing greater moisture value as compared to the 60 cm depth probe. Moisture retention capacity is near about 10–12% less as compared to the plastic mulching because evapora-tion can’t stop completely. There are chances to pass air from organic matters. So this system is less effec-tive for moisture retention as compared to DIPM, but better than plain DI method because it is saving 13–18% more water than DI system.
An impact of SISC system on soil moisture. Table 3 shows the results of multifactorial analysis of variance of soil moisture in SISC system. Statistical analysis shows the 5% significance level (P-value < 0.05) in the moisture observation at depth 30 cm and 60 cm soil moisture values are not significant (P-value > 0.05).Whereas the interaction result shows the 95% significant level in all season except 60 cm probe results in the summer season. Figure 4d indi-cates the periodical variations in soil moisture with respect to time and irrigation water provided periodi-cally using the SISC system. 30 cm depth probe is always showing the smaller moisture level as com-pared to the 60 cm depth probe. It means due to the SISC system water provided directly at the root zone. The 60 cm depth sensor indicates that there is 10–12% water saving as compared to the DI system.
An impact of the SIMP system on soil mois-ture. Table 3 indicated the results of multifactorial analysis of variance for observed values of soil mois-ture in the SIMP system. The results are statistically significant because of statistical analysis shows the 5% significance level (P-value < 0.05) interaction between moisture at both depth 30 cm and 60 cm as well as soil moisture and water requirement.
The Figure 4e is shown periodical variations in soil moisture with respect to time and irrigation water provided in the SIMP system. 95% confidence inter-val obtained for the period of three seasons for the 30 cm and 60 cm depth. A 30 cm depth probe is most of the time showing greater moisture value as compared to the 60 cm probe. It is clear that the SIMP system can’t behave like the subsurface irrigation system be-cause in the subsurface irrigation system 60 cm probe always shows greater value. Moisture retention capac-ity is about 6–10% more as compared to DI.
An impact of the SIPB system on soil mois-ture. Table 3 indicated the results of multifactorial analysis of variance for observed values of soil mois-ture in the SIPB system. The results are statistically significant because of statistical analysis shows the 5% significance level (P-value < 0.05) interaction between moisture at both depth 30 cm and 60 cm as well as soil moisture and water requirement. Figure 4f indicates the periodical variations in soil moisture with respect to time and irrigation water provided pe-riodically using the SIPB system. Variation in ob-served data is less as compare to other subsurface methods. 30 cm depth probe is always showing small-er moisture level as compared to the 60 cm depth probe. It means is that due to SIPB system water pro-vided directly at the root zone. The 60 cm depth sen-sor indicates that there is 15–20% water saving as compared to the DI system.
BENEFIT-COST ANALYSIS OF IRRIGATION SYSTEMS
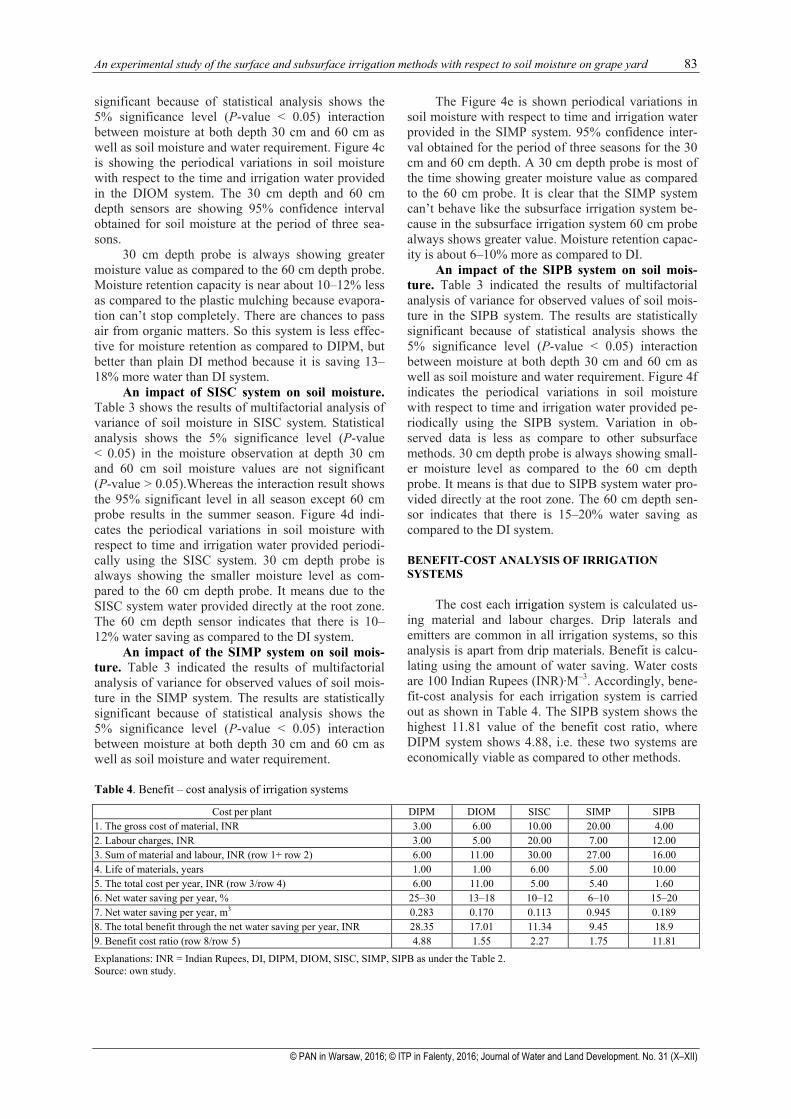
The cost each irrigation system is calculated us-ing material and labour charges. Drip laterals and emitters are common in all irrigation systems, so this analysis is apart from drip materials. Benefit is calcu-lating using the amount of water saving. Water costs are 100 Indian Rupees (INR)·M–3. Accordingly, bene-fit-cost analysis for each irrigation system is carried out as shown in Table 4. The SIPB system shows the highest 11.81 value of the benefit cost ratio, where DIPM system shows 4.88, i.e. these two systems are economically viable as compared to other methods.
Table 4. Benefit – cost analysis of irrigation systems
Cost per plant DIPM DIOM SISC SIMP SIPB 1. The gross cost of material, INR 3.00 6.00 10.00 20.00 4.00 2. Labour charges, INR 3.00 5.00 20.00 7.00 12.00 3. Sum of material and labour, INR (row 1+ row 2) 6.00 11.00 30.00 27.00 16.00 4. Life of materials, years 1.00 1.00 6.00 5.00 10.00 5. The total cost per year, INR (row 3/row 4) 6.00 11.00 5.00 5.40 1.60 6. Net water saving per year, % 25–30 13–18 10–12 6–10 15–20 7. Net water saving per year, m3 0.283 0.170 0.113 0.945 0.189 8. The total benefit through the net water saving per year, INR 28.35 17.01 11.34 9.45 18.9 9. Benefit cost ratio (row 8/row 5) 4.88 1.55 2.27 1.75 11.81
Explanations: INR = Indian Rupees, DI, DIPM, DIOM, SISC, SIMP, SIPB as under the Table 2. Source: own study.
84 S.J. KADBHANE, V.L. MANEKAR
© PAN in Warsaw, 2016; © ITP in Falenty, 2016; Journal of Water and Land Development. No. 31 (X–XII)
CONCLUSIONS
Based on the experiment carried out in summer, rainy, and winter seasons, it is observed that the mois-ture-retention level in the DIPM system found great-est among all systems of irrigation under the study period. The moisture level is maintained to 25–30% greater than the regular drip irrigation system. This increase in soil moisture retention level is due plastic cover which acts as temperature resisting material. The benefit-cost ratio is observed to be 4.88 for the same system, which is moderate among its class.
Subsurface irrigation with plastic bottles (SIPB) is showing higher soil moisture retention level as compared to other subsurface irrigation systems in all three season. The moisture level is maintaining 15–20% greater than the regular drip irrigation system. This increase in soil moisture level is due to applica-tion of water directly to the root zone, so evaporation from surface soil is prevented. The benefit-cost ratio is observed to be 11.81 for the same system which is highest among its class. Hence it is recommended to use the SIPB irrigation system because it is water ef-ficient, most economical and helps in recycling the plastic waste.
ACKNOWLEDGMENTS “ATMA – Maharashtra Agriculture department, India, and Water Users Association, Maharashtra Irrigation depart-ment, India” has given support this work. Authors are thankful to the chairman and all members of the ATMA for their extended support and inspiration to carry out this work. Authors are also grateful to Indian Metrological De-partment Pune to support this study by sharing valuable data and information.
REFERENCES
ALLEN R., PEREIRA L.S., RAES D., SMITH M., 1998. Crop evapotranspiration. Guidelines for computing crop wa-ter requirements. Irrigation and Drainage Paper. No. 56. Rome. FAO. ISBN 92-5-104219-5 pp. 300.
ARAGÜÉS R., MEDINA E.T., CLAVERIA I., MARTÍNEZ-COB A., FACI J. 2014. Regulated deficit irrigation, soil saliniza-tion and soil sodification in a table grape vineyard drip-irrigated with moderately saline waters. Agricultural Water Management. Vol. 134 p. 84–93.
AYARS J.E., PHENE C.J., HUTMACHER R.B., DAVIS K.R., SCHONEMAN R.A., VAIL S.S., MEAD R.M. 1999. Subsur-face drip irrigation of row crops: A review of 15 years of research at the Water Management Research Labora-tory. Agricultural Water Management. Vol. 42. Iss. 1 p. 1–27.
CONSOLI S., BARBAGALLO S. 2012. Estimating water re-quirements of an irrigated mediterranean vineyard using a satellite-based approach. Journal of Irrigation and Drainage Engineering. Vol. 138. Iss. 10 p. 896–904.
DU T., KANG S., ZHANG J., LI F., YAN B. 2008. Water use efficiency and fruit quality of table grape under alternate
partial root-zone drip irrigation. Agricultural Water Management. Vol. 95. Iss. 6 p. 659–668.
FACI J.M., BLANCO O., MEDINA E.T., MARTÍNEZ-COB A. 2014. Effect of post veraison regulated deficit irrigation in production and berry quality of Autumn Royal and Crimson table grape cultivars. Agricultural Water Man-agement. Vol. 134 p. 73–83.
GARCÍA-VILA M., FERERES E. 2012. Combining the simula-tion crop model AquaCrop with an economic model for the optimization of irrigation management at farm level. European Journal of Agronomy. Vol. 36. Iss. 1 p. 21–31.
GHAMARNIA H., ARJI I., SEPEHRI S., NOROZPOUR S., KHO-DAEI E. 2011. Evaluation and comparison of drip and conventi onal irrigation methods on sugar beets in a semiarid region. Journal of Irrigation and Drainage Engineering. Vol. 138. Iss. 1 p. 90–97.
Government of India 2014. Hand book on horticulture sta-tistics 2014. New Delhi. Ministry of Agriculture De-partment of Agriculture and Cooperation pp. 34.
IPCC 2007. An assessment of the Intergovernmental Panel on Climate Change. Climate Change: Synthesis Report. 4 p. 26–40.
IS:2720-2 1973. Methods of test for soils. P.2: Determina-tion of water content. Second revision. New Delhi. Bu-reau of Indian Standards pp. 18.
LAZAROVITCH N., SHANI U., THOMPSON T., WARRICK A. 2006. Soil hydraulic properties affecting discharge uni-formity of gravity-fed subsurface drip irrigation sys-tems. Journal of Irrigation and Drainage Engineering. Vol. 132. Iss. 6. DOI: 10.1061/(ASCE)0733-9437 (2006)132:6(531) p. 531–536.
MARTÍNEZ J., RECA J. 2014. Water use efficiency of surface drip irrigation versus an alternative subsurface drip irri-gation method. Journal of Irrigation and Drainage Engi-neering. Vol. 745. Iss. 1 p. 733–743.
NETZER Y., YAO C.R., SHENKER M., BRAVDO B.A., SCHWARTZ A. 2009. Water use and the development of seasonal crop coefficients for Superior Seedless grape-vines trained to an open-gable trellis system. Irrigation Science. Vol. 27. Iss. 2 p. 109–120.
RODRIGUEZ-SINOBAS L., GIL M., JUANA L., SANCHEZ R. 2009. Water distribution in laterals and units of subsur-face drip irrigation. I: Simulation. Journal of Irrigation and Drainage Engineering. Vol. 135. Iss. 6 p. 721–728. DOI: 10.1061/(ASCE)IR.1943-4774.0000058.
ROSSI G., CANCELLIERE A. 2002. At-site and regional drought identification by Redim model. In: Tools for drought mitigation in Mediterranean regions. Eds. G. Rossi, A. Cancelliere, L.S. Pereira, T. Oweis, M. Shat-anawi, A. Zairi. Ser. Water Science and Technology Li-brary. Vol. 44. New York. Springer p. 37–54.
SAXENA M. (ed.) 2015. Indian Horticulture database. New Delhi. Ministry of Agriculture, Government of India pp. 286.
SIKKA D.R. 2009. Two decades of medium-range weather forecasting in India: National Centre for Medium-Range Weather Forecasting. Center for Ocean-Land-Atmos-phere Studies Technical Report. No. 276 pp. 100.
STEDUTO P., HSIAO T.C., FERERES E., RAES D. 2012. Crop yield response to water. Irrigation and Drainage Paper. No. 66. Rome. FAO p. 270–275.
An experimental study of the surface and subsurface irrigation methods with respect to soil moisture on grape yard 85
© PAN in Warsaw, 2016; © ITP in Falenty, 2016; Journal of Water and Land Development. No. 31 (X–XII)
Sharad J. KADBHANE, Vivek L. MANEKAR
Badania powierzchniowego i podpowierzchniowego nawadniania w nawiązaniu do wilgotności gleby w winnicy
STRESZCZENIE
Przeprowadzono eksperyment polowy w winnicy w czasie lata, pory mokrej i zimowej, stosując różne me-tody nawadniania i mierząc jego wpływ na zachowanie wilgotności w glebie. Zastosowano sześć metod nawad-niania: nawadnianie kroplowe, nawadnianie kroplowe z przykrywaniem syntetyczną włókniną, nawadnianie kroplowe z mulczowaniem organicznym, podpowierzchniowe nawadnianie z kolumnami z kamieni, podpo-wierzchniowe nawadnianie z glinianymi naczyniami i nawadnianie za pomocą butelek plastikowych. Do oceny zapotrzebowania uprawy na wodę zastosowano model CROPWAT 8.0. Wilgotność gleby mierzono czujnikami wprowadzonymi do gleby na głębokość 30 i 60 cm. Parametry klimatyczne uzyskano z automatycznej stacji po-godowej usytuowanej w pobliżu pola doświadczalnego. Wieloczynnikową analizę statystyczną przeprowadzono z wykorzystaniem pomierzonej wilgotności gleby i danych klimatycznych. Metoda kroplowego nawadniania z przykrywaniem syntetyczną włókniną okazała się najlepsza spośród wszystkich zastosowanych metod z powo-du największej retencji wilgoci glebowej (25–30%). Użyteczna okazała się także metoda podpowierzchniowego nawadniania z plastikowymi butelkami, ponieważ zatrzymywała 15–20% wilgoci glebowej.
Słowa kluczowe: ceramika porowata, mulczowanie, nawadnianie kroplowe, nawadnianie podpowierzchniowe, nawadnianie powierzchniowe, retencja wody glebowej, włóknina syntetyczna