Embed Size (px)
Citation preview

REW
AR
DIN
G
PLA
CES
ANNUAL REPORT 2015

Cover image:
Meridian Building
33 Customhouse Quay, Wellington

04 Highlights
05 Results Overview
07 Our Strategy
14 Chairman’s Report
16 Board of Directors
18 Management Report
24 Portfolio 2015
27 Financial Statements
62 Corporate Governance
69 Investor Relations
71 Statutory Information
74 Corporate Directory
3DNZ PROPERTY FUND LIMITED | ANNUAL REPORT 2015
CONTENTS

1. Distributable profit is a non-GAAP financial measure adopted by DNZ to assist DNZ and investors in assessing DNZ’s profit available for distribution. It is defined as
net profit/(loss) before income tax adjusted for non-recurring and/or non-cash items and current tax. Further information, including the calculation of distributable
profit and the adjustments to net profit before income tax, is set out in note 6 to the financial statements on page 36.
2. The valuations of all properties disposed of during the 12 months from 1 April 2014 have been disregarded in this calculation. The portfolio was independently valued at
$780.2 million as at 31 March 2014 and $872.4 million as at 31 March 2015.
3. Net Tangible Assets (NTA) per share.
4. Weighted Average Lease Term (WALT).
$32.1m UP 15.9%DISTRIBUTABLE PROFIT1 AFTER INCOME TAX
35.1%BANK LOAN TO VALUE RATIO
5.1%NET VALUATION INCREASE2
5.1 YEARS PORTFOLIO WALT4
$39.6m UP 13.1%OPERATING PROFIT BEFORE OTHER INCOME AND INCOME TAX
10.25 CPS UP 13.9%ANNUAL CASH DIVIDEND
NTA3 $1.81UP FROM $1.69 AS AT 31 MARCH 2014
4 DNZ PROPERTY FUND LIMITED | ANNUAL REPORT 2015
HIGHLIGHTS

Financial Performance2015
($m)2014
($m)Change
($m)Change
%
Net rental income 57.2 57.4 (0.1) (0.2)
Operating profit before net finance expenses, other income and income tax 52.6 49.9 2.7 5.4
Net finance expenses (13.0) (14.9) 1.9 12.5
Operating profit before other income and income tax 39.6 35.0 4.6 13.1
Other income 37.7 14.0 23.7 169.4
Net profit before income tax 77.3 49.0 28.3 57.7
Income tax expense (8.5) (7.4) (1.0) (13.7)
Net profit after income tax attributable to shareholders 68.8 41.6 27.3 65.6
Basic earnings per share – weighted 23.16 cents 14.50 cents
Distributable profit before income tax 40.3 35.0 5.3 15.1
Distributable profit after income tax 32.1 27.7 4.4 15.9
Basic distributable profit after income tax per share – weighted 10.80 cents 9.67 cents
Five Year Financial Summary2015 ($m)
2014 ($m)
2013 ($m)
2012 ($m)
2011 ($m)
Net rental income 57.2 57.4 53.5 52.9 52.0
Operating profit before net finance expenses, other income/(expenses) and income tax 52.6 49.9 47.0 46.8 44.0
Net finance expenses (13.0) (14.9) (15.6) (18.0) (22.2)
Operating profit before other income/(expenses) and income tax 39.6 35.0 31.3 28.8 21.8
Other income/(expenses) 37.7 14.0 22.2 (3.0) (47.3)
Net profit/(loss) before income tax 77.3 49.0 53.5 25.8 (25.5)
Income tax expense (8.5) (7.4) (8.0) (5.0) (9.6)
Net profit/(loss) after income tax attributable to shareholders 68.8 41.6 45.5 20.8 (35.1)
Basic earnings per share – weighted 23.16 cents 14.50 cents 18.33 cents 8.39 cents (15.42) cents
Distributable profit before income tax 40.3 35.0 29.8 27.8 23.0
Distributable profit after income tax 32.1 27.7 24.0 27.8 21.9
Basic distributable profit after income tax per share – weighted 10.80 cents 9.67 cents 9.64 cents 11.22 cents 9.60 cents
Property values 872.4 780.2 667.0 658.3 637.7
Bank debt drawn 305.9 268.2 246.4 267.3 252.9
Bank loan to value ratio 35.1% 34.4% 36.9% 40.6% 40.4%
NTA per share1 $1.81 $1.69 $1.62 $1.53 $1.54
Adjusted NTA per share2 $1.82 $1.69 $1.64 $1.55 $1.55
Note: Values in the tables above are calculated based on the numbers in the financial statements for each respective
financial year and may not sum due to rounding.
1. Excludes intangibles.
2. Excludes intangibles and after tax fair value of interest rate derivatives.
5DNZ PROPERTY FUND LIMITED | ANNUAL REPORT 2015
RESULTS OVERVIEW

A good location is pivotal to the success of my business.STEVE GIANOUTSOS
Director, Mojo Coffee
Meridian Building
33 Customhouse Quay
Wellington

Our strategy is to invest in a portfolio of places with ‘Enduring Demand’ – places that attract the highest demand in all market conditions.
DNZ believes the core determinant of property investment performance over the long term is the demand for the business space that we provide to our customers.
Ultimately that space is a workplace, a place of business; it is used by our customers and their staff, visitors and customers. To be the best, our places need to provide accessibility, amenity, functionality and a value proposition that is compelling. It is a combination of location, building design and management style that will ensure our places are always in demand in all market conditions – we refer to it as ‘Enduring Demand’.
7DNZ PROPERTY FUND LIMITED | ANNUAL REPORT 2015
OUR STRATEGY

Our brand is all about being sustainable, so committing to this building was an obvious choice for us. The open space and layout also creates an environment that is great for our people to work together and fits with our informal culture where working collaboratively is hugely valued.GUY WAIPARA General Manager External Relations
Meridian Energy
Meridian Building
33 Customhouse Quay
Wellington
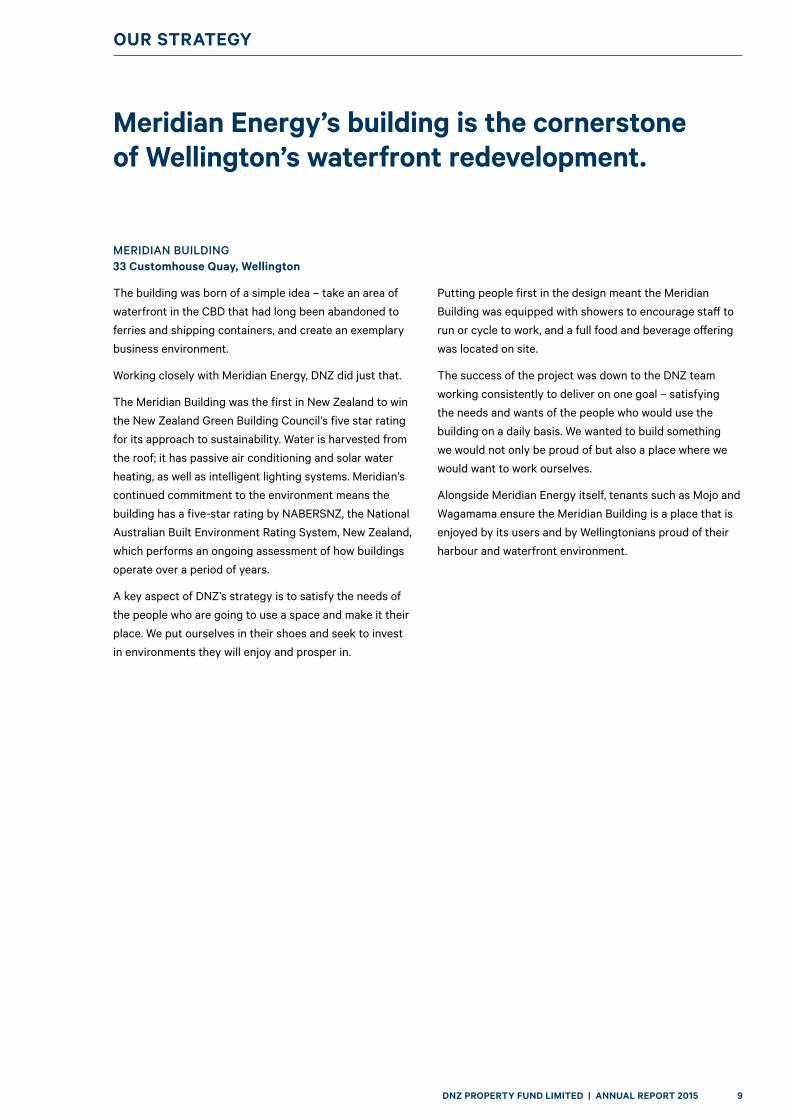
Meridian Energy’s building is the cornerstone of Wellington’s waterfront redevelopment.
MERIDIAN BUILDING 33 Customhouse Quay, Wellington
The building was born of a simple idea – take an area of
waterfront in the CBD that had long been abandoned to
ferries and shipping containers, and create an exemplary
business environment.
Working closely with Meridian Energy, DNZ did just that.
The Meridian Building was the first in New Zealand to win
the New Zealand Green Building Council’s five star rating
for its approach to sustainability. Water is harvested from
the roof; it has passive air conditioning and solar water
heating, as well as intelligent lighting systems. Meridian’s
continued commitment to the environment means the
building has a five-star rating by NABERSNZ, the National
Australian Built Environment Rating System, New Zealand,
which performs an ongoing assessment of how buildings
operate over a period of years.
A key aspect of DNZ’s strategy is to satisfy the needs of
the people who are going to use a space and make it their
place. We put ourselves in their shoes and seek to invest
in environments they will enjoy and prosper in.
Putting people first in the design meant the Meridian
Building was equipped with showers to encourage staff to
run or cycle to work, and a full food and beverage offering
was located on site.
The success of the project was down to the DNZ team
working consistently to deliver on one goal – satisfying
the needs and wants of the people who would use the
building on a daily basis. We wanted to build something
we would not only be proud of but also a place where we
would want to work ourselves.
Alongside Meridian Energy itself, tenants such as Mojo and
Wagamama ensure the Meridian Building is a place that is
enjoyed by its users and by Wellingtonians proud of their
harbour and waterfront environment.
9DNZ PROPERTY FUND LIMITED | ANNUAL REPORT 2015
OUR STRATEGY

DNZ has been really good in accommodating our company at our Penrose site and their design team has been very helpful in developing the premises to our needs. We’ve decided to take early advantage of our right to expand and will relocate our manufacturing plant so that we are contained in a fit-for purpose and unified working environment.ROBIN SIMPSON CEO, Hydraulink
25 O’Rorke Road
Penrose, Auckland

Ensuring customer needs are met is critical to DNZ. The business park at 25 O’Rorke Road provides high-quality business space to a range of logistics, manufacturing and service companies. The five completed buildings in the business park have been developed by DNZ, and are designed and built to meet the specific requirements of each customer.
25 O’RORKE ROAD
Penrose, Auckland
The site is well located in the central Penrose industrial
precinct in Auckland. It provides excellent access to
the seaport, airport, rail freight facilities and motorway
network. The site is also within easy walking distance to
passenger rail, close to Mt Smart Stadium and includes a
popular on-site café, Kreem Café. As a result, 25 O’Rorke
Road is in high demand by companies like Laminex and
Hydraulink, both of which have warehousing and office
facilities at the site.
Reflecting the ability of the site to adapt to differing
requirements, Laminex wanted one location to house
both a warehouse and office. That meant creating an
environment which safely accommodated heavy vehicle
movements as well as people.
Similarly Hydraulink wanted a property that was more
than just a warehouse for its hoses and fittings. The
business park needed to be able to provide easy access
for Hydraulink’s fleet of mobile service units and for
the customers who visit for over-the-counter sales.
The resulting building design and layout achieved
these goals.
Demand for space at 25 O’Rorke Road is high,
with Hydraulink expanding its footprint, leading to
increased interest in the final stage of development
at the business park.
11DNZ PROPERTY FUND LIMITED | ANNUAL REPORT 2015
OUR STRATEGY

The Buchan Group are proud to be associated with NorthWest, unquestionably one of Auckland’s emerging Landmark projects. The design heralds the next generation for retail centres, both in planning and ambience. Contemporary architectural forms and typologies create the exterior, which is complimented by the clean, crisp lines of the interior combined with ambience and warmth achieved through the application of natural materials and lighting.DAVID THORNTON Principal, The Buchan Group

The largest shopping centre project currently under construction in New Zealand, NorthWest Shopping Centre, is scheduled to open in October this year.
NORTHWEST SHOPPING CENTRE
Westgate, Auckland
The centre is a much-needed modern, high-quality
retail facility for the local community. The large existing
catchment is one of the least developed in terms of retail
facilities. The new shopping centre, together with the
surrounding amenities, will serve not only the existing
community, but also an incredibly fast-growing part
of Auckland.
As Auckland expands, the north-western corridor is a vital
component in the growth of the city. NorthWest Shopping
Centre, situated to the west of both downtown Auckland
and the North Shore, services a key part of that growth.
Part of DNZ’s approach is to work with the best partners
to deliver places that ensure enduring demand from
tenants and their customers alike. DNZ appointed
renowned retail architects, The Buchan Group, to ensure
that the project represents contemporary international
design and suits the needs of modern retailers.
NorthWest Shopping Centre is at the heart of the Westgate
Town Centre. It is fully integrated within a modern walkable
precinct that will include a traditional main street, town
square and community facilities, including a library.
DNZ has been working to include the best brands in each
category of retailers and to give our customers a well-
rounded shopping experience. We have secured a strong
fashion mix which includes some iconic New Zealand and
Australian brands. We have a comprehensive health and
beauty offer, a full range of retail services, and a food
offering that will satisfy every appetite, from our world-
class food-court to café-style dining. It will be a place
where Aucklanders can work, shop and play.
13DNZ PROPERTY FUND LIMITED | ANNUAL REPORT 2015
OUR STRATEGY

DNZ has delivered a great return for our shareholders and has surpassed our previous year’s result.
Following the completed organisation restructure, the executive team is highly focused on the fundamentals of the business and delivering a high-performing property portfolio. The aim is to provide good returns to investors and meet the needs of stakeholders and the communities in which they are located, by providing them with Rewarding Places. Careful investment selection, astute asset management and disciplined capital management are the hallmarks we strive for.
Core to our strategy is focusing on properties with Enduring Demand, which will deliver consistent returns through varying market conditions.
As a result, the distributable profit per share is well ahead of last year’s results and is consistent with our annual goal for dividend growth. Overall, it has been a very successful year for the Company with a particularly solid profit result.
14 DNZ PROPERTY FUND LIMITED | ANNUAL REPORT 2015
CHAIRMAN’S REPORT

Overall, the Board of DNZ is very happy with the
Company’s progress and future direction. We believe
that our strategy, combined with a sound portfolio
and experienced executive team, will deliver top-tier
performance relative to the listed property sector.
DISTRIBUTION POLICY AND DIVIDEND
DNZ’s Distribution Policy is to deliver shareholders
consistent dividends and long-term growth. The
Company’s policy is to distribute between 95% and 100%
of Distributable Profit, which is defined as net profit/(loss)
before tax adjusted for non-recurring and/or cash items
and current taxation, with the intention that dividends are
paid broadly in line with operating earnings. As a result
of tax treatments on disposals of properties and interest
capitalised on development projects, the distributable
profit does not align with underlying operating earnings.
The Board has therefore refined the Distribution Policy to
further align the current tax position with the underlying
operating earnings by removing the tax on disposals
of properties and interest capitalised on development
projects from the calculation of Distributable Profit.
For the fourth quarter of the 31 March 2015 financial
year, being the period 1 January 2015 to 31 March 2015,
the Board approved a cash dividend of 3.125 cents per
share (cps). The final quarter’s dividend will lift the full
year’s dividend to 10.25 cps, an increase of 13.9% on the
previous year’s dividend of 9.0 cps.
Maximising returns for shareholders remains fundamental
to the Company’s activities and we are still targeting
annual dividend growth of at least 2.5% in the future.
Therefore, the Company is targeting to deliver an annual
cash dividend of at least 10.50 cps to shareholders for
the 2016 financial year.
Thank you for your support.
On behalf of the Board,
TIM STOREY Chairman
STRATEGIC REVIEW DELIVERS RESULTS
The result for the year ended 31 March 2015 shows
a significant gain over the previous year’s outcomes.
In addition to an increase in the distributable profit per
share, DNZ’s share price also rose during the course of the
year in a sector which has gained appreciably overall.
These results are a reflection of a well-focused and
experienced management team that is delivering and,
at times, exceeding the ambitious goals that the Company
sets. They are also indicative of a carefully managed
portfolio that is constantly reviewed and repositioned
to provide an enduring and consistently above-average
return, irrespective of changes in the market. Our work
in re-focusing our portfolio is well advanced and DNZ
has divested $32m of property in this year’s planned
divestment programme.
The economic environment in which DNZ is operating has
continued to improve and this has benefited our business.
The stable conditions have enabled us to maintain high
occupancy across the portfolio and our rental income
has improved overall, allowing for divestments.
DEVELOPMENT STRATEGY
DNZ’s principal focus remains on the Auckland region
where the characteristics of our strategy of investing
in properties with Enduring Demand can be found.
NorthWest Shopping Centre, our retail development at
Westgate, has progressed according to plan and has
been well received by prospective tenants, with all of
the internal retail space leased, including all specialty
stores, kiosks and both anchors. Its future potential is very
significant and it will be opened on time in October this
year. NorthWest Shopping Centre exemplifies the selection,
management and design that our strategy calls for, which
will deliver real value to all the tenants, staff, visitors and
investors connected with the project. It sets the standard
for our approach to similar projects in the future.
15DNZ PROPERTY FUND LIMITED | ANNUAL REPORT 2015
CHAIRMAN’S REPORT

DNZ’s Board comprises a blend of skills, experience and expertise that sit naturally with the Company’s ambition. Board members are drawn from leadership positions in their various professions reflecting their in-depth knowledge of their sectors. They have delivered a clear vision for the Company and are actively engaged in ensuring that it delivers its objectives.
TIM STOREY Chairman (Independent)
Tim was appointed Chair of DNZ in 2009. He has more
than 30 years’ business experience across a range of
sectors and has practised as a lawyer in Australia and
New Zealand, retiring from the Bell Gully partnership
in 2006. Tim is a member of the Institute of Directors
in New Zealand (Inc) and is a director of Reading
Entertainment Inc (US listed), JustKapital Litigation
Partners Limited (ASX Listed) and a number
of private companies.
MICHELLE TIERNEY Director (Independent) (appointed 17 July 2014)
Michelle has more than 20 years’ experience in the
property industry and is a senior executive with ASX50
company The GPT Group, where she has significant
experience in funds management, property and asset
management, general management and strategy
development. Michelle is Fund Manager of the $3.8 billion
GPT Wholesale Shopping Centre Fund and is responsible
for developing and implementing strategic objectives and
driving the fund’s financial performance. She has held a
directorship with GPT Property Management Pty Limited
and an alternate directorship with the Shopping Centre
Council of Australia. Michelle has held multiple senior
roles at GPT and is active on the executive of several
Australian industry associations, including as a member of
the Australian Institute of Company Directors, Women on
Boards Australia and the Property Council of Australia’s
Women & Diversity in Property Committee and as
an Associate of the Australian Property Institute.
16 DNZ PROPERTY FUND LIMITED | ANNUAL REPORT 2015
BOARD OF DIRECTORS

JOHN HARVEY Director (Independent)
John has over 35 years’ professional experience as a chartered
accountant. He was a partner in PricewaterhouseCoopers for
23 years and held a number of management and governance
responsibilities. John retired from PwC in June 2009 to pursue
a career as a director. He holds a Bachelor of Commerce
degree from the University of Canterbury. He is a member of
the Institute of Directors in New Zealand (Inc) and is currently
a director of Port Otago Limited, Kathmandu Holdings Limited,
Heartland Bank Limited, Ballance Agri-Nutrients Limited and
New Zealand Opera Limited.
MICHAEL STIASSNY Director (Independent)
Michael has widespread experience in all matters financial.
He is the senior partner of KordaMentha in New Zealand
– a chartered accountancy firm specialising in financial
consulting work. He is currently Chairman of Vector Limited,
Tower Limited and Ngati Whatua Orakei Whai Rawa Limited,
as well as a director of a number of public and private
companies. Michael is a Fellow of the Institute of Directors
in New Zealand (Inc) (FInstD) and Vice-President of the
Institute of Directors in New Zealand Inc.
DAVID VAN SCHAARDENBURG Director (Independent)
David is a Principal of the investment firm, New Zealand
Funds Management. He has worked in financial analysis
and portfolio management roles for 25 years, including
three years in London. From 1994 he directed Fundsource
Limited, New Zealand’s leading investment research group,
and from 1997 was Chief Investment Officer at NZ Funds,
overseeing the management of $1 billion across a variety
of asset classes. David has a Bachelor of Commerce
from The University of Auckland and holds a Chartered
Accountant (CA) designation from the Chartered
Accountants Australia and New Zealand.
Working with the executive team, the Board has endorsed a clearly defined strategy that focuses on consistent and Enduring Demand for high-quality property offerings that are designed and created to deliver value to all those who use them.
17DNZ PROPERTY FUND LIMITED | ANNUAL REPORT 2015
BOARD OF DIRECTORS

DNZ has delivered a positive result for the year in favourable market conditions and with the support of a leaner, more efficient business. A comprehensive review of our strategy has clarified the direction of the Company and provided us with two central pillars that will characterise our future work – ‘Enduring Demand’ which maximises returns on a sustained basis and ‘Rewarding Places’ which keep giving real value to tenants, staff, visitors and investors connected with our properties. Our future focus will remain firmly on delivering profit to our shareholders and operating a highly efficient, results oriented company.
18 DNZ PROPERTY FUND LIMITED | ANNUAL REPORT 2015
MANAGEMENT REPORT

FINANCIAL PERFORMANCE
The key financial outcomes for the 2015 financial year are:
• Net rental income of $57.2m, marginally down 0.2%
• Operating profit before other income and income tax
of $39.6m, up 13.1%
• Net profit after income tax attributable to shareholders
of $68.8m, up 65.6%
• Distributable profit before income tax of $40.3m, up 15.1%
• Distributable profit after income tax of $32.1m, up 15.9%
• Annual cash dividend of 10.25 cps, up 13.9%
• NTA value increased 12 cents to $1.81, up 7.1%
Peter Alexander (Chief Executive) Jennifer Whooley (Chief Financial Officer)
19DNZ PROPERTY FUND LIMITED | ANNUAL REPORT 2015
MANAGEMENT REPORT

PORTFOLIO BY SECTOR
as at 31 March 2015 (by contract rental1)
PORTFOLIO BY LOCATION
as at 31 March 2015 (by contract rental1)
Industrial
19%
Office
31%
Bulk Retail
23%
Retail
27%
1%
South Island
20%
Wellington
22%
RegionalNorth Island
57%
Auckland
LEASE EXPIRY PROFILE3
as at 31 March 2015 (by contract rental1)
TOP TEN TENANTS2
as at 31 March 2015 (by contract rental1)
0 2 4 6 8 10 12 14 16 18
2016
2017
2018
2019
2020
2021
2025
2030
2022
2026
2033
2023
2027
2024
2028
Financial Year
% of Portfolio Contract Rental
1. Contract Rental is the amount of rent payable by each tenant, plus other amounts payable to DNZ by that tenant under the terms of the relevant lease as at 31 March
2015, annualised for the 12 month period on the basis of the occupancy level for the relevant property as at 31 March 2015, and assuming no default by the tenant.
2. Based on Contract Rental for all properties leased to individual tenants and their affiliates as at 31 March 2015. The numbers to the left of each bar represent the
number of properties leased by the tenant.
3. Represents the scheduled expiry for each lease, excluding any rights of renewal that may be granted under each lease, for the entire portfolio as at 31 March 2015,
as a percentage of Portfolio Contract Rental.
0% 2% 4% 6% 8% 10% 12%
Bunnings
ASB
Foodstuffs
The Warehouse
Westpac
Progressive
NZ Government
Fletcher Building
Meridian Energy
Lion
% of Portfolio Contract Rental
4
5
3
3
3
2
2
4
1
1
20 DNZ PROPERTY FUND LIMITED | ANNUAL REPORT 2015
MANAGEMENT REPORT

PORTFOLIO VALUATION
The annual independent market valuations at year-end
resulted in the property portfolio value increasing by a
net 5.1% or $38.7m on a like-for-like1 basis. DNZ’s property
portfolio is now valued at $872.4m with a weighted
average capitalisation rate across the portfolio of 7.73%.
LEASE TRANSACTIONS
DNZ completed a total of 203 lease transactions in the
12 months to 31 March 2015, comprising the following:
• 125 rent reviews over 180,960m2 for a total annual
rental of $32.1m
• 42 lease renewals over 18,671m2 for a total annual
rental of $5.0m
• 36 new lettings completed over 13,205m2 for a total
annual rental of $3.2m
Renewals
Lease transactions of note include the renewal of the
Countdown leases at Fenton Street, Rotorua, and
Mt Wellington Shopping Centre, Auckland, for terms
of five and six years respectively. Other renewals
of note include IAG (three years) and ClearPoint
(five years) at 7-9 Fanshawe Street, Auckland.
New lettings
The Capital S.M.A.R.T. development at 25 O’Rorke Road,
Penrose, was completed in October 2014. The six year
lease to Capital S.M.A.R.T. is subject to annual CPI reviews.
The new Burger Fuel premises at Mt Wellington Shopping
Centre, Auckland, were completed in February 2015,
with Burger Fuel committed to the Centre for a term
of eight years.
Other significant new lettings include a nine year lease
to the Ministry of Women’s Affairs at 22 The Terrace,
Wellington, and a six year lease to FX Networks at
25 Teed Street, Auckland.
The remaining lease expiries as at 31 March 2015 for the
2016 financial year represent 5.8% of contract rental.
Based on the current lease expiry profile, 13.0% of contract
rental expires in the 2017 financial year. Lease expiries
are proactively managed and provide a relatively low risk
profile providing contracted future rental income streams.
Post-Balance Date lease transactions
Post balance date, the following transactions have resulted
in a reduction in the lease expiry profile, for the 2016
financial year to 3.75%:
• NZ Post has extended its commitment at Bay Central
Shopping Centre, Tauranga, for a further six years.
• The Warehouse has committed to a three year term
from late 2015 at 35 MacLaggan Street, Dunedin.
1. The valuations of all properties disposed of during the 12 months from 1 April 2014 have been disregarded in this calculation. As at 31 March 2014,
the portfolio was independently valued at $780.2 million.
21DNZ PROPERTY FUND LIMITED | ANNUAL REPORT 2015
MANAGEMENT REPORT

DEVELOPMENT PROJECTS NorthWest Shopping Centre, Westgate, Auckland
NorthWest Shopping Centre, previously known as the
Westgate Mall project, is on schedule to open in October
2015. At the end of the 2015 financial year, construction
of the project was 70% completed and 100 tenancies
had been confirmed. The internal shopping centre has
been completely leased, with only seven retail tenancies
remaining to be filled on the main street and nine office
suites. Amongst the many retail tenants, the shopping
centre will include a flagship Farmers department store
and a Countdown supermarket.
Located adjacent to the North Western Motorway and the
newly completed Upper Harbour Motorway, the Westgate
Town Centre (of which the Shopping Centre will form part)
is also planned to feature an extensive network of parks
and walkways and include areas for outdoor dining and
a large, pedestrian-friendly civic space.
The NorthWest project is on target to meet or better
its anticipated return on cost. The net operating income
yield on development cost is expected to exceed the
7.75% forecast when the project was announced. The
value on completion is forecast to be $170m, ahead of
the $160m previously indicated. The NorthWest Shopping
Centre project is being funded through the Company’s
debt capacity and the sale of non-core assets. DNZ will
continue its divestment programme to allow for these
types of developments, in line with our strategy of
investing in properties with Enduring Demand.
Westgate Stage Two
DNZ has also commenced design work on the Westgate
Stage Two development, being a further 7,000m2 of retail,
dining and office space on land opposite NorthWest
Shopping Centre.
Westgate Stage Two will be a complementary offer to
NorthWest Shopping Centre and will provide greater
critical mass, increased visitation and a broader range of
categories for customers. These factors are expected to
deliver higher total retail sales overall. Westgate Stage Two
is anticipated to cost approximately $30m and provide a
minimum initial yield of over 7%. The exact timing of the
project is yet to be finalised but completion is targeted for
late 2016. DNZ will fund the development through the sale
of non-core assets.
DNZ’s work on Westgate Stage Two is being undertaken
further to a conditional right in our original agreement
to acquire the NorthWest Shopping Centre land from
Westgate Town Centre Limited (WTCL). WTCL has
disputed DNZ’s entitlement to exercise the agreement’s
conditional right. DNZ disagrees with WTCL’s position and
considers that the terms of the agreement with WTCL are
clear. DNZ and WTCL are currently engaged in dispute
resolution processes. We look forward to a positive
resolution to this development.
Johnsonville Shopping Centre Redevelopment
DNZ is planning to deliver a contemporary shopping centre
for the people of Johnsonville, a growing catchment area
under-served by retail. We therefore believe this represents
a good opportunity for the Company.
The redeveloped centre is intended to service the northern
suburbs of Wellington and improve Johnsonville’s retail
offer substantially.
A resource consent is in place to extend the centre
significantly, and DNZ is currently reviewing how best
to proceed with the project. We hope to have this
review completed by late 2015.
Artist’s impressionArtist’s impression
22 DNZ PROPERTY FUND LIMITED | ANNUAL REPORT 2015
MANAGEMENT REPORT

PETER ALEXANDER Chief Executive
JENNIFER WHOOLEY Chief Financial Officer
REAL ESTATE INVESTMENT MANAGEMENT
DNZ continues to investigate opportunities in the area of
real estate investment management. Income generating
assets, such as commercial real estate, clearly hold appeal
for investors and there is global interest in investing in the
New Zealand economy.
DNZ manages Diversified NZ Property Fund Limited and
receives management fee income for managing its assets.
We are in the process of restructuring Diversified NZ
Property Fund with its existing investors to enable easier
access for new investors.
We are also seeking new opportunities to leverage the
core competencies of our business into new investment
management initiatives.
CAPITAL MANAGEMENT
During the 2015 financial year, DNZ refinanced its bank
facility with our banking partners ANZ Bank New Zealand
Limited, Commonwealth Bank of Australia, Bank of
New Zealand and Westpac New Zealand Limited, extending
the term of the two tranches of $200m each for a further
one year. Tranche A now expires on 31 October 2017 and
Tranche B expires on 31 October 2019. More favourable
line fees and margins were also achieved.
As at 31 March 2015, DNZ had drawn bank facilities of
$306m and had interest rate hedging in place equivalent
to 74% of drawn bank borrowings. The LVR ratio was 35.1%,
which sits comfortably in DNZ’s target of a mid 30% to
low 40% range and well below DNZ’s banking covenant
limit of 50%. Our exposure to interest rate fluctuations
is minimal and only extends to the non-hedged portions
of drawn bank borrowings.
DNZ’s weighted average cost of debt (including margins
and line fees) was 5.6% as at 31 March 2015 and the
weighted average hedging term, including forward
rate swaps, was 2.9 years.
OUTLOOK
DNZ looks forward to a sustained period of progressive
growth. The completion of NorthWest Shopping Centre will
be a key activity in the coming year and will have a very
positive effect on earnings growth. We will continue our
targeted divestment programme that, together with the
flexibility and capacity in our balance sheet, will enhance
our performance and provide better returns in accordance
with our strategy. We will also actively seek opportunities
to grow our real estate investment management business
by leveraging our increased capability in this area.
DNZ continues to have an acute focus on key areas that
will deliver the greatest returns to shareholders in the
2016 financial year and beyond.
Johnsonville Shopping Centre, Wellington.
23DNZ PROPERTY FUND LIMITED | ANNUAL REPORT 2015
MANAGEMENT REPORT

Address CityTenants
(no.)Major Tenant (s) Occupancy
Net Lettable Area (m2)
WALT2 (years)
Valuation
($000)
Net Contract
Rental ($000)
Market Cap
RateContract
Yield
OFFICE33 Corinthian Drive Auckland 1 ASB Bank 100.0% 10,936 1.5 34,000 2,800 7.88% 8.24%
7-9 Fanshawe Street Auckland 15 IAG, IPFX, ClearPoint 100.0% 4,804 2.7 13,600 1,657 9.75% 12.18%
650 Great South Road Auckland 4 Inland Revenue Department, healthAlliance
84.3% 8,335 3.4 28,300 2,219 8.50% 7.84%
80 Greys Avenue Auckland 2 DDB New Zealand, Serato 100.0% 5,450 3.8 16,200 1,355 8.25% 8.36%
21-25 Teed Street Auckland 11 Beam Global (NZ), NZACU 100.0% 4,071 3.7 19,200 1,461 7.13% 7.61%
51 Corinthian Drive Auckland 4 Westpac (NZ) Investments 100.0% 3,412 5.6 14,700 1,098 7.38% 7.47%
33 Customhouse Quay Wellington 5 Meridian Energy 100.0% 5,245 4.0 33,400 2,433 7.25% 7.29%
1 Grey Street Wellington 13 Westpac (NZ) Investments 98.2% 10,467 4.8 48,750 3,736 7.88% 7.66%
22 The Terrace Wellington 8 Qual IT, Department of Internal Affairs
89.2% 4,780 3.6 15,000 1,092 8.50% 7.28%
OFFICE TOTAL 63 96.5% 57,500 3.6 223,150 17,852 7.95% 8.00%
INDUSTRIAL
30 Airpark Drive Auckland 1 DHL Supply Chain (New Zealand)
100.0% 13,733 4.7 19,350 1,367 7.25% 7.06%
22 Ha Crescent Auckland - Vacant – 8,757 – 8,150 – 8.00% –
8 Reg Savory Place Auckland 1 National Glass 100.0% 4,025 2.4 6,000 478 7.00% 7.97%
20 Rockridge Avenue Auckland 1 NZ Merchants 100.0% 10,239 2.0 10,600 836 7.50% 7.89%
460 Rosebank Road Auckland 1 Croxley Stationery 100.0% 12,263 1.0 9,100 875 8.50% 9.62%
11 Springs Road Auckland 1 Lion - Beer, Spirits and Wine
100.0% 21,349 2.5 21,100 1,895 8.25% 8.98%
25 O'Rorke Road Auckland 5 Laminex, AA Insurance, Hydraulink
100.0% 26,151 7.6 47,735 3,305 6.84% 6.92%
15 Rockridge Avenue Auckland 1 Eagle Auto Services Japan 100.0% 2,216 2.3 1,900 227 8.25% 11.95%
415 East Tamaki Road Auckland 1 Goodyear & Dunlop Tyres (NZ)
100.0% 9,727 6.1 13,300 1,016 7.50% 7.64%
15 Ride Way Auckland 1 Express Couriers 100.0% 6,027 2.4 8,100 600 7.25% 7.40%
34 Airpark Drive Auckland 1 MPI International 100.0% n/a 12.8 4,500 252 6.50% 5.59%
20-22 Pollen Street Auckland 1 Colorite 100.0% 2,271 1.4 5,200 433 7.50% 8.33%
INDUSTRIAL TOTAL 15 92.5% 116,758 4.6 155,035 11,283 7.40% 7.28%
OVERVIEW AS AT 31 MARCH 2015 AS AT 31 MARCH 2014
Properties 41 46
Tenants 281 292
Net Lettable Area (m²) 334,694 364,916
Net Contract Rental1 ($m) 58.5 61.2
WALT2 (years) 5.1 5.5
Occupancy Rate (% by area) 96.6 99.5
Portfolio Value ($m) 872.4 780.2
24 DNZ PROPERTY FUND LIMITED | ANNUAL REPORT 2015
PORTFOLIO 2015

25DNZ PROPERTY FUND LIMITED | ANNUAL REPORT 2015
PORTFOLIO 2015
Address CityTenants
(no.)Major Tenant (s) Occupancy
Net Lettable Area (m2)
WALT 2
(years)
Valuation
($000)
Net Contract
Rental ($000)
Market Cap
RateContract
Yield
RETAILCnr Mt Wellington Highway & Penrose Road
Auckland 23 Countdown, Supercheap Auto
100.0% 9,013 4.0 36,300 2,505 7.13% 6.90%
Cnr Ward, Bryce & Tristram Streets
Hamilton 18 Kmart 95.4% 8,119 2.5 13,900 1,397 9.50% 10.05%
Johnsonville Shopping Centre (50%)
Wellington 89 Specialty Retail 98.4% 6,946 3.6 34,100 2,644 8.54% 7.75%
61 Silverdale Street Auckland 39 Countdown, The Warehouse 99.8% 22,961 8.0 82,500 5,748 7.00% 6.97%
65 Chapel Street Tauranga 23 Rebel Sport, Briscoes 98.7% 16,299 2.4 35,200 2,878 8.00% 8.18%
RETAIL TOTAL 192 98.8% 63,339 5.0 202,000 15,172 7.63% 7.51%
BULK RETAIL446 Te Rapa Road Hamilton 1 Bunnings 100.0% 12,763 4.2 18,000 1,528 8.13% 8.49%
Cnr Tremaine Avenue & Railway Road
Palmerston North
1 Bunnings 100.0% 13,730 4.2 16,100 1,452 8.35% 9.02%
26-48 Old Taupo Road Rotorua 1 Bunnings 100.0% 13,940 4.2 16,600 1,418 8.25% 8.54%
230-240 Fenton Street Rotorua 1 Countdown 100.0% 5,172 5.4 13,500 1,050 8.13% 7.78%
78 Courtenay StreetNew Plymouth
1 Pak'nSave 100.0% 8,522 14.5 21,200 1,594 7.40% 7.52%
9 Gloucester Street Napier 1 New World 100.0% 4,386 14.5 12,200 889 7.35% 7.29%
2 Carr Road, Mt Roskill
Auckland 1 Bunnings 100.0% 11,601 11.9 29,700 2,116 6.88% 7.13%
Cnr Te Irirangi Drive & Bishop Dunn Place
Auckland 1 Mitre 10 100.0% 12,124 2.6 17,200 1,517 8.25% 8.82%
48 Miramar Avenue Wellington 1 New World 100.0% 3,162 14.5 10,100 739 7.25% 7.32%
35 MacLaggan Street Dunedin 1 The Warehouse 100.0% 6,433 0.3 6,800 819 10.50% 12.04%
BULK RETAIL TOTAL 10 100.0% 91,832 7.6 161,400 13,123 7.84% 8.13%
LAND / DEVELOPMENT39 Corinthian Drive Auckland n/a n/a n/a n/a 5,720 176 n/a n/a
NorthWest Shopping Centre
Auckland n/a n/a n/a n/a 112,800 n/a n/a n/a
LAND/DEVELOPMENT TOTAL
118,520 176
TOTAL INVESTMENT PROPERTIES
280 96.5% 329,429 5.1 860,105 57,605 7.72% 7.74%
NON-CURRENT ASSETS HELD FOR SALELots 82, 83, 85 Tauriko Industrial Estate
Tauranga n/a n/a n/a n/a 1,315 n/a n/a n/a
170-180 Taradale Road Napier n/a n/a n/a n/a 4,250 123 n/a n/a
Cnr Anglesea & Liverpool Streets
Hamilton 1 Countdown 100.0% 5,265 3.8 6,700 813 9.00% 12.14%
TOTAL NON-CURRENT ASSETS HELD FOR SALE
1 100.0% 5,265 3.8 12,265 937 9.00% 12.14%
TOTAL PORTFOLIO
281 96.6% 334,694 5.1 872,370 58,542 7.73% 7.78%
Totals may not sum due to rounding. The occupancy %, WALT, market cap rate and contract yield for the property class and overall totals are a weighted average.
1. Contract Rental is the amount of rent payable by each tenant, plus other amounts payable to DNZ by that tenant under the terms of the relevant lease as at 31 March
2015, annualised for the 12 month period on the basis of the occupancy level for the relevant property as at 31 March 2015, and assuming no default by the tenant.
2. Weighted Average Lease Term (WALT).


27DNZ PROPERTY FUND LIMITED | ANNUAL REPORT 2015
FINANCIAL STATEMENTS – FOR THE YEAR ENDED 31 MARCH 2015
28 Consolidated Statement of Comprehensive Income
29 Consolidated Statement of Changes in Equity
30 Consolidated Statement of Financial Position
31 Consolidated Statement of Cash Flows
32 Notes to the Consolidated Financial Statements
61 Independent Auditors’ Report

The attached notes form part of and are to be read in
conjunction with these financial statements.28 DNZ PROPERTY FUND LIMITED | ANNUAL REPORT 2015
CONSOLIDATED STATEMENT OF COMPREHENSIVE INCOME FOR THE YEAR ENDED 31 MARCH 2015
Notes2015
$0002014
$000
Rental income 3 60,713 61,991
Property operating expenses (3,497) (4,638)
Net rental income 57,216 57,353
Management fee income 1,474 1,540
Less corporate expenses
Corporate overhead expenses (4,294) (6,138)
Restructuring costs – (686)
Administration expenses (1,827) (2,203)
Total corporate expenses 4 (6,121) (9,027)
Operating profit before net finance expenses, other (expenses)/income and income tax 52,569 49,866
Finance income 257 226
Finance expenses (13,270) (15,106)
Net finance expenses 5 (13,013) (14,880)
Operating profit before other (expenses)/income and income tax 39,556 34,986
Other (expenses)/income
Loss on disposal of investment properties 9,11 (460) (1,281)
Net change in fair value of other investments (244) (1)
Net change in fair value of investment properties 9,11 38,435 18,662
Impairment of work in progress 10 – (3,372)
Net profit before income tax 77,287 48,994
Income tax expense 15 (8,452) (7,432)
Net profit after income tax attributable to shareholders 68,835 41,562
Other comprehensive income:
Items that may be reclassified subsequently to profit or loss
Movement in cash flow hedges, net of tax 18 (4,683) 6,996
Total other comprehensive income after tax (4,683) 6,996
Total comprehensive income after tax attributable to shareholders 64,152 48,558
Basic earnings per share (cents) 18 23.16 14.50
Diluted earnings per share (cents) 18 23.14 14.47

The attached notes form part of and are to be read in
conjunction with these financial statements. 29DNZ PROPERTY FUND LIMITED | ANNUAL REPORT 2015
CONSOLIDATED STATEMENT OF CHANGES IN EQUITY FOR THE YEAR ENDED 31 MARCH 2015
Notes
Share capital
$000
Retained earnings
$000
Other reserves
$000Total $000
Balance at 31 March 2013 431,391 (18,131) (4,876) 408,384
Transactions with shareholders:
Dividends paid 7 – (26,298) – (26,298)
Issue of shares 18 69,815 – – 69,815
Capital raising expenses (1,569) – – (1,569)
Shares issued under Dividend Reinvestment Plan 18 6,197 – – 6,197
Movement in employee long term share incentive plan 18 – – 154 154
Total transactions with shareholders 74,443 (26,298) 154 48,299
Other comprehensive income:Transfer from options reserve on vesting of employee
long term share incentive plan 18 – 477 (477) –
Movement in cash flow hedges, net of tax 18 – – 6,996 6,996
Total other comprehensive income – 477 6,519 6,996
Net profit after income tax – 41,562 – 41,562
Total comprehensive income – 42,039 6,519 48,558
Balance at 31 March 2014 505,834 (2,390) 1,797 505,241
Transactions with shareholders:
Dividends paid 7 – (27,865) – (27,865)
Movement in employee long term share incentive plan 18 – – 18 18
Total transactions with shareholders – (27,865) 18 (27,847)
Other comprehensive income:Transfer from options reserve on vesting/forfeiture
of employee long term share incentive plan 18 – 267 (267) –
Movement in cash flow hedges, net of tax 18 – – (4,683) (4,683)
Total other comprehensive income – 267 (4,950) (4,683)
Net profit after income tax – 68,835 – 68,835
Total comprehensive income – 69,102 (4,950) 64,152
Balance at 31 March 2015 505,834 38,847 (3,135) 541,546

The attached notes form part of and are to be read in
conjunction with these financial statements.30 DNZ PROPERTY FUND LIMITED | ANNUAL REPORT 2015
TIM STOREY Chairman
JOHN HARVEY Director
CONSOLIDATED STATEMENT OF FINANCIAL POSITION AS AT 31 MARCH 2015
Notes2015
$0002014
$000
Current assets
Cash and cash equivalents 8,19 4,431 4,440
Trade and other receivables 13,19,20 654 793
Prepayments 184 181
Other current assets 431 92
Non-current assets held for sale 11 12,265 1,650
Inventory 12 685 –
18,650 7,156
Non-current assets
Investment properties 9 860,105 778,500
Work in progress 10 161 8,761
Property, plant and equipment 363 359
Intangible asset 22 3,000 3,000
Derivative financial instruments 16,19 126 3,561
Other investments 19,20 1,358 –
865,113 794,181
Total assets 883,763 801,337
Current liabilities
Trade and other payables 14,19 14,865 8,734
Current tax liability 1,931 1,794
Derivative financial instruments 16,19 48 218
16,844 10,746
Non-current liabilities
Bank borrowings 17,19 305,339 267,741
Deferred tax liability 15 15,602 16,416
Derivative financial instruments 16,19 4,432 1,193
325,373 285,350
Total liabilities 342,217 296,096
Net assets 541,546 505,241
Share capital 18 505,834 505,834
Retained earnings 38,847 (2,390)
Reserves 18 (3,135) 1,797
Equity 541,546 505,241
For and on behalf of the Board of Directors, dated 21 May 2015:

The attached notes form part of and are to be read in
conjunction with these financial statements. 31DNZ PROPERTY FUND LIMITED | ANNUAL REPORT 2015
CONSOLIDATED STATEMENT OF CASH FLOWS FOR THE YEAR ENDED 31 MARCH 2015
Notes2015
$0002014
$000
Cash flows from operating activities
Rent received 61,940 61,602
Management fee income 1,474 1,540
Interest received 254 215
Dividends received 3 11
Interest paid (12,934) (15,162)
Operating expenses (10,537) (12,015)
Goods and services tax (616) (952)
Income tax paid (7,309) (6,747)
Net cash provided by operating activities 8 32,275 28,492
Cash flows from investing activities
Proceeds from disposal of investment properties 30,574 18,769
Proceeds from disposal of fixed assets 6 2
Proceeds from disposal of other investments – 494
Capital expenditure on investment properties (70,657) (17,875)
Acquisition of investment 20 (1,602) –
Acquisition of investment properties – (103,391)
Fixed assets purchased (120) (105)
Net cash applied to investing activities (41,799) (102,106)
Cash flows from financing activities
Drawdown on bank borrowings 68,440 106,947
Repayment of bank borrowings (31,060) (85,637)
Proceeds from equity issued 18 – 69,815
Capital raising expenses – (1,569)
Dividends paid (27,865) (20,101)
Net cash provided by financing activities 9,515 69,455
Net decrease in cash and cash equivalents held (9) (4,159)
Opening cash and cash equivalents 4,440 8,599
Closing cash and cash equivalents 4,431 4,440

NOTES TO THE CONSOLIDATED FINANCIAL STATEMENTS
32 DNZ PROPERTY FUND LIMITED | ANNUAL REPORT 2015
FOR THE YEAR ENDED 31 MARCH 2015
NOTE 1: ACCOUNTING POLICIES
Reporting EntityThe financial statements presented are those of DNZ Property Fund Limited (the Parent) and its subsidiary, DNZ Holdings
Limited (together referred to as “DNZ”). The Parent is domiciled in New Zealand and is registered under the Companies
Act 1993. The Parent is also an FMC reporting entity under Part 7 of the Financial Markets Conduct Act 2013. The financial
statements of DNZ have been prepared in accordance with the requirements of Part 7 of the Financial Markets Conduct
Act 2013 and the NZX Main Board Listing Rules. In accordance with the Financial Markets Conduct Act 2013, because
group financial statements are prepared and presented for the Parent and its subsidiary, separate financial statements for
the Parent are no longer required to be prepared and presented. DNZ is designated as a profit-oriented entity for financial
reporting purposes.
The Parent is registered on the Main Board equity market of NZX Limited (NZX) and is principally involved in the
ownership and management of investment properties in New Zealand.
The financial statements were approved for issue by the Board of Directors (Board) on 21 May 2015.
Basis of preparation These financial statements comply with New Zealand Generally Accepted Accounting Practice (NZ GAAP), which
includes New Zealand equivalents to International Financial Reporting Standards (NZ IFRS) and other applicable Financial
Reporting Standards as appropriate for profit-oriented entities. The financial statements comply with International
Financial Reporting Standards (IFRS).
The financial statements have been prepared under the historical cost convention, as modified by the revaluation of
certain classes of assets and liabilities as identified in the specific accounting policies below and the accompanying notes.
The presentation currency is New Zealand dollars ($). Amounts shown have been rounded to the nearest thousand dollars
($000), unless stated otherwise.
Significant accounting policies, estimates and judgementsIn the application of NZ IFRS, the Board and management are required to make judgements, estimates and assumptions
about carrying values of assets and liabilities that are not readily apparent from other sources. The estimates and
associated assumptions are based on experience and other factors that are believed to be reasonable under the
circumstances, the results of which form the basis of making the judgements. Actual results may differ from the estimates,
judgements and assumptions made by the Board and management.
Estimates and underlying assumptions are reviewed on an ongoing basis. Revisions to accounting estimates are
recognised in the period in which the estimate is revised and in any future periods affected.
Judgements made by management in the application of NZ IFRS that have significant effects on the financial statements
and estimates with a significant risk of material adjustments in the next year are disclosed, where applicable, in the
relevant notes to the financial statements.
In particular, information about significant areas of estimation uncertainty that have the most significant effect on the
amount recognised in the financial statements is disclosed in the relevant notes as follows:
• Investment properties (note 9)
• Deferred tax (note 15)
• Interest rate derivatives (note 16)
• Intangible asset (note 22)

NOTE 1: ACCOUNTING POLICIES (CONTINUED)
33DNZ PROPERTY FUND LIMITED | ANNUAL REPORT 2015
NOTES TO THE CONSOLIDATED FINANCIAL STATEMENTS (CONTINUED)
FOR THE YEAR ENDED 31 MARCH 2015
New standards, amendments and interpretations The new standards, amendments to published standards, and interpretations which may impact DNZ and which are
mandatory for DNZ’s financial periods beginning on or after 1 April 2015 or later periods, but which DNZ has not adopted
early, are as follows:
– NZ IFRS 9, Financial Instruments (Effective date: periods beginning on or after 1 January 2018), addresses the
classification, measurement and recognition of financial assets and financial liabilities and replaces the guidance in
NZ IAS 39 Financial Instruments – Recognition and Measurement. DNZ intends to adopt NZ IFRS 9 effective from
1 April 2018 and has yet to assess its full impact.
– NZ IFRS 15: Revenue from contracts with customers (Effective date: periods beginning on or after 1 January 2017) deals
with revenue recognition and establishes principles for reporting useful information to users of financial statements
about the nature, amount, timing and uncertainty of revenue and cash flows arising from an entity’s contracts with
customers. Revenue is recognised when a customer obtains control of a good or service and thus has the ability
to direct the use and obtain the benefits from the good or service. DNZ intends to adopt NZ IFRS 15 effective from
1 April 2017 and has yet to assess its full impact.
All standards will be adopted at their effective date (except for those standards that are not applicable to DNZ).
Changes in accounting policiesThere have been no changes in accounting policies from the prior period and all policies have been applied consistently
throughout the year. Where a change in the presentational format of the financial statements has been made during the
period, comparative figures have been restated accordingly. Where material, additional disclosure has been provided in the
notes to the financial statements.
NOTE 2: OPERATING SEGMENTS
Operating segments are reported in a manner consistent with the internal reporting provided to the chief operating
decision-maker. The chief operating decision-maker has been identified as the Board, as it makes all key strategic
resource allocation decisions (such as those concerning acquisition, divestment and significant capital expenditure).
DNZ is internally reported as a single operating segment to the chief operating decision-maker, hence no further
disclosures of reportable segments have been made.
DNZ’s revenue streams are earned from investment properties owned in New Zealand, with no specific exposure to
geographical risk. DNZ has a diverse client base, and targets to have no one tenant representing greater than 10% of the
portfolio contract rental. However, the tenant Bunnings has contributed $6,516,337 or 10.93% (2014: $6,336,565 or 10.13%)
of DNZ’s portfolio contract rental as at balance date.

34 DNZ PROPERTY FUND LIMITED | ANNUAL REPORT 2015
NOTES TO THE CONSOLIDATED FINANCIAL STATEMENTS (CONTINUED)
FOR THE YEAR ENDED 31 MARCH 2015
NOTE 3: RENTAL INCOME
Rental income from the investment properties is recognised on a straight-line basis over the lease term. Lease incentives
provided in relation to letting the investment properties are amortised on a straight-line basis over the non-cancellable
portion of the lease to which they relate, as a reduction of rental income.
2015 $000
2014 $000
Rental income 61,185 61,753
Capitalised lease incentives 1,067 1,367
Lease incentive amortisation (1,102) (1,080)
Fixed rental income (437) (49)
60,713 61,991
Leases are classified at their inception as either operating or finance leases based on the economic substance of the
agreement so as to reflect the risks and rewards incidental to ownership. Leases in which a significant portion of the risks
and rewards of ownership are retained by the lessor are classified as operating leases. DNZ has determined that it retains
all significant risks and rewards of ownership of the leases and has therefore classified the leases as operating leases.
Property leased out under operating leases is included in investment property in the statement of financial position.
The future aggregate minimum rentals receivable under non-cancellable operating leases are as follows:
2015 $000
2014 $000
No later than 1 year 57,099 59,340
Later than 1 year and no later than 5 years 155,392 169,783
Later than 5 years 96,754 115,004
309,245 344,127
NOTE 4: CORPORATE EXPENSES
2015 $000
2014 $000
Corporate overhead expenses includes:
Salaries and other short term benefits 3,521 5,107
Administration expenses includes:
Auditors’ remuneration
– Statutory audit services 143 140
– Other services 5 12
Movement in employee long term share incentive schemes (note 18) 18 154
Depreciation expense 108 109
Other audit services in the current year related to an IT outsourcing process assessment and in the prior year related to
market analysis on executive packages.

35DNZ PROPERTY FUND LIMITED | ANNUAL REPORT 2015
NOTES TO THE CONSOLIDATED FINANCIAL STATEMENTS (CONTINUED)
FOR THE YEAR ENDED 31 MARCH 2015
NOTE 5: NET FINANCE EXPENSES
Interest income is recognised on a time-proportional basis using the effective interest rate.
Where DNZ borrows funds specifically for the purpose of obtaining a qualifying asset, the amount of borrowing costs
capitalised are the actual borrowing costs incurred on that borrowing, less any investment income on the temporary
investment of those borrowings. A qualifying asset is one that takes six months or longer to prepare for its intended use
or sale. As at 31 March 2015, $3,416,256 borrowing costs have been capitalised using an average capitalisation rate of 5.0%
including line fee and margin (2014: $Nil).
Where DNZ borrows funds generally and uses them to fund a qualifying asset, the amount of borrowing costs capitalised
is determined by applying a capitalisation rate to the expenditure on that asset. The capitalisation rate is the weighted
average of the borrowing costs applicable to the borrowings that are outstanding during the period, other than borrowings
made specifically for the purpose of funding a qualifying asset.
Other borrowing costs are expensed when incurred and are recognised using the effective interest rate.
2015 $000
2014 $000
Finance income
Interest income:
– Bank interest income 211 215
– Other income 46 11
257 226
Finance expenses
Interest expenses:
– Bank borrowings 16,672 15,096
– Capitalised interest (3,416) –
– Other interest expenses 14 10
13,270 15,106
Net finance expenses 13,013 14,880

36 DNZ PROPERTY FUND LIMITED | ANNUAL REPORT 2015
NOTES TO THE CONSOLIDATED FINANCIAL STATEMENTS (CONTINUED)
FOR THE YEAR ENDED 31 MARCH 2015
NOTE 6: DISTRIBUTABLE PROFIT
Distributable profit consists of net profit before income tax, adjusted for non-recurring and/or non-cash items and current
tax as follows:
2015 $000
2014 $000
Net profit before income tax 77,287 48,994
NZ IFRS and other non-recurring and non-cash adjustments:
– Net change in fair value of investment properties (38,435) (18,662)
– Net change in fair value of other investments 244 1
– Loss on disposal of investment properties 460 1,281
– Impairment of work in progress – 3,372
– Net rent free incentives 35 (287)
– Net lease contribution incentives 98 (44)
– Fixed rental income 437 49
– Other adjustments 126 264
Distributable profit before income tax 40,252 34,968
Current tax expense (7,445) (7,256)
Adjusted for:
– Tax expense on capitalised interest (957) –
– Tax expense on depreciation recovered on disposal of investment properties 258 –
Distributable profit after income tax 32,108 27,712
Weighted average number of shares for purpose of basic distributable profit per share (000)
297,228 286,586
Basic distributable profit after income tax per share – weighted (cents) 10.80 9.67
Weighted average number of shares for purpose of diluted distributable profit per share (000)
297,428 287,273
Diluted distributable profit after income tax per share – weighted (cents) 10.80 9.65
31 March 2015
Weighted average number of shares for purpose of diluted distributable profit per share in the current year has been adjusted for: – 200,185 remaining rights issued in October 2012 under the long term share incentive scheme three (note 21).
31 March 2014
Weighted average number of shares for purpose of diluted distributable profit per share in the prior year was adjusted for: – 206,250 remaining rights issued in August 2010 under the long term share incentive scheme one (note 21); – 165,316 remaining rights issued in July 2011 under the long term share incentive scheme two (note 21); and – 315,912 remaining rights issued in October 2012 under the long term share incentive scheme three (note 21).
NOTE 7: DIVIDENDS PAID AND PROPOSED
The following dividends were declared and paid during the year:2015
$0002014
$000
Q4 2014 Final dividend 2.25 cents (Q4 2013 2.25 cents) 6,688 6,454
Q1 2015 Interim dividend 2.375 cents (Q1 2014 2.25 cents) 7,059 6,589
Q2 2015 Interim dividend 2.375 cents (Q2 2014 2.25 cents) 7,059 6,610
Q3 2015 Interim dividend 2.375 cents (Q3 2014 2.25 cents) 7,059 6,645
Total dividends paid 27,865 26,298
Dividend approved subsequent to balance date: Q4 2015 Final dividend 3.125 cents (Q4 2014 2.25 cents) (note 27).
Dividends are recognised as a liability in DNZ’s financial statements in the period in which the dividends are approved.
Supplementary dividends of $115,537 (2014 $97,560) were paid to shareholders not resident in New Zealand for which DNZ received a foreign investor tax credit entitlement.

37DNZ PROPERTY FUND LIMITED | ANNUAL REPORT 2015
NOTES TO THE CONSOLIDATED FINANCIAL STATEMENTS (CONTINUED)
FOR THE YEAR ENDED 31 MARCH 2015
NOTE 8: STATEMENT OF CASH FLOWS RECONCILIATION
Cash and cash equivalents include cash in hand, deposits held at call with banks and other short-term highly liquid
investments with original maturities of three months or less. These assets are short term in nature and the carrying value
is approximate to their fair value. Cash and cash equivalents are classified as loans and receivables. They are subsequently
measured at amortised cost.
2015 $000
2014 $000
Cash and cash equivalents
Cash at bank 4 7
Cash on deposit 4,427 4,433
4,431 4,440
Reconciliation of net profit after income tax attributable to shareholders to net cash from operating activities:
Net profit after income tax 68,835 41,562
Add/(less) non-cash items:
Movement in deferred tax (note 15) 1,007 176
Net change in fair value of investment properties (38,435) (18,662)
Net change in fair value of other investments 244 1
Impairment of work in progress – 3,372
Loss on disposal of investment properties 460 1,281
Loss on disposal of fixed assets 2 2
Movement in impairment provision (note 13) 9 (19)
Capitalised lease incentives (1,154) (1,567)
Lease incentive amortisation 1,272 1,236
Fixed rental income 437 49
Refinancing cost amortisation (43) (494)
Movement in employee long term share incentive plan 18 154
Depreciation expense 108 109
32,760 27,200
Less activities classified as investing activity:
Capitalised expenditure on investment properties (6,801) (1,687)
25,959 25,513
Add activity classified as financing activity:
Refinancing cost 260 553
26,219 26,066
Movement in working capital:
Decrease/(increase) in trade and other receivables 130 (265)
(Increase)/decrease in prepayments and other current assets (342) 351
Increase in trade and other payables 6,131 1,928
Increase in tax payable 137 412
Net cash provided by operating activities 32,275 28,492

38 DNZ PROPERTY FUND LIMITED | ANNUAL REPORT 2015
NOTES TO THE CONSOLIDATED FINANCIAL STATEMENTS (CONTINUED)
FOR THE YEAR ENDED 31 MARCH 2015
NOTE 9: INVESTMENT PROPERTIES
Investment properties comprise freehold land, leasehold land, buildings and improvements that are held either to
earn rental income or for capital appreciation or both. Investment property is initially stated at cost, including related
transaction costs, and then at fair value as determined every year by an independent registered valuer.
Any gain or loss arising from a change in the fair value of the investment property is recognised in the statement of
comprehensive income within net changes in fair value of investment properties. Subsequent expenditure is charged
to the asset’s carrying amount only when it is probable that future economic benefits associated with the item will flow
to DNZ and the cost of the item can be measured reliably. All other repairs and maintenance costs are expensed to the
statement of comprehensive income during the period in which they are incurred.
Lease incentives are capitalised to the respective investment properties in the statement of financial position and
amortised on a straight-line basis over the non-cancellable portion of the lease to which they relate.
Investment properties are de-recognised when they have been disposed of. The net gain or loss on disposal of investment
property is calculated as the difference between the carrying amount of the investment property at the time of the
disposal and the net proceeds on the disposal, and is included in the statement of comprehensive income in the reporting
period in which the disposal occurs.
The investment properties are not depreciated for accounting purposes.
Office $000
Industrial $000
Retail $000
Bulk Retail $000
Land/ Development
$000Total$000
Balance at 31 March 2013 211,775 149,100 109,200 159,090 6,090 635,255
Acquisitions – – 78,085 – 25,306 103,391
Subsequent capital expenditure 1,898 7,280 1,025 641 (24) 10,820
Net capitalised incentives 259 66 12 (6) – 331
Fixed rental income (383) 34 5 295 – (49)Transfer from non-current assets held for sale – 2,360 – 7,730 – 10,090
Net change in fair value 8,101 5,395 2,343 345 2,478 18,662
Balance at 31 March 2014 221,650 164,235 190,670 168,095 33,850 778,500
Subsequent capital expenditure 1,729 4,902 854 109 69,034 76,628
Transfer from work in progress – 99 – – 8,662 8,761
Net capitalised incentives (368) 210 46 (6) – (118)
Fixed rental income (476) (81) 131 (11) – (437)Transfer to non-current assets held for sale – – – (10,950) – (10,950)
Disposals (9,150) (21,600) – – – (30,750)
Net change in fair value 9,765 7,270 10,299 4,163 6,974 38,471
Balance at 31 March 2015 223,150 155,035 202,000 161,400 118,520 860,105
Capitalised expenditure consists of fit-outs and other physical enhancements to the investment properties, with ownership
of such capital amounts being retained by DNZ.
Capital expenditure commitments contracted for:
As at 31 March 2015, DNZ had the following major commitments:
• $3,109,000 (2014: $3,023,000) in total for various capital expenditure works to be undertaken on a number
of investment properties in the next financial year;
• $52,368,000 for the completion of the enclosed shopping centre at NorthWest Shopping Centre, Auckland.
Subsequent to balance date, DNZ has committed to a further $117,000 in total for various capital expenditure works
to be undertaken on a number of investment properties in the next financial year.
DNZ has no other major capital commitments as at balance date.

39DNZ PROPERTY FUND LIMITED | ANNUAL REPORT 2015
NOTES TO THE CONSOLIDATED FINANCIAL STATEMENTS (CONTINUED)
FOR THE YEAR ENDED 31 MARCH 2015
NOTE 9: INVESTMENT PROPERTIES (CONTINUED)
In the current year, DNZ settled on the sale of the following investment properties for $31,250,000, with the resulting
overall loss on sale of $484,939 reflected in the statement of comprehensive income:
– 968 Great South Road, Auckland
– 13 Jarden Mile, Wellington
– 12 Tyers Road, Wellington
– 709 Te Rapa Road, Hamilton
– 8 Rockridge Ave, Auckland
Valuation basisThe fair value of an investment property represents the estimated price for which an investment property could be sold
on the date of valuation in an orderly transaction between market participants.
The accepted methods for assessing the current market value of an investment property are the Capitalisation and the
Discounted Cash Flow approaches. Valuations of investment properties which are not yet complete are based on an
independent valuer’s assessment of the fair value at completion and adjusted to reflect the stage of completion of
a project and the costs to complete.
Each approach derives a value based on market inputs, including:
• recent comparable transactions;
• forecast future rentals, based on the actual location, type and quality of the investment properties, and supported by
the terms of any existing lease, other contracts or external evidence such as current market rents for similar properties;
• vacancy assumptions based on current and expected future market conditions after expiry of any current lease;
• maintenance and capital requirements including necessary investments to maintain functionality of the property for its
expected useful life; and
• appropriate discount rates derived from recent comparable market transactions reflecting the uncertainty in the amount
and timing of cashflows.
The Capitalisation approach is considered a ‘point in time’ view of the investment property’s value, based on the current
contract and market income and an appropriate market yield or return for the particular investment property. Capital
adjustments are then made to the value to reflect under or over renting, pending capital expenditure, and upcoming
expiries, including allowance for lessee incentives and leasing costs.
The Discounted Cash Flow approach adopts a ten year investment horizon and makes appropriate allowances for rental
income growth and leasing costs on expiries, with an estimated terminal value at the end of the investment period. The
Present Value is a reflection of market based income (inflows) and expenditure (outflows) projections over the ten year
period discounted at a market analysed return.
In deriving a market value under each approach, all assumptions are based, where possible, on market based evidence and
transactions for properties with similar locations, construction detail and quality of lessee covenant. The adopted market
value is a weighted combination of both the Capitalisation and the Discounted Cash Flow approaches.
The valuations are performed by independent registered valuers who hold an annual practising certificate with the Valuers
Registration Board and are members of the New Zealand Institute of Valuers. Valuers are engaged on terms ensuring
no valuer values the same investment property for more than three consecutive years. In the current and prior year, the
investment properties have been valued by Colliers International NZ Limited (Colliers), Jones Lang LaSalle Limited (JLL),
Bayleys Valuations Limited (Bayleys), CBRE Limited (CBRE) and Savills (NZ) Limited (Savills). In the prior year some
investment properties were also valued by Colliers International (Wellington Valuation) Limited (Colliers). All valuations
are dated effective 31 March.

40 DNZ PROPERTY FUND LIMITED | ANNUAL REPORT 2015
NOTES TO THE CONSOLIDATED FINANCIAL STATEMENTS (CONTINUED)
FOR THE YEAR ENDED 31 MARCH 2015
NOTE 9: INVESTMENT PROPERTIES (CONTINUED)
Valuation basis (continued)At each reporting date, DNZ’s asset managers:
• verify all major inputs to the independent valuation report;
• assess property valuation movements when compared to the prior year valuation report; and
• hold discussions with DNZ’s executive team on the processes and results of the valuations.
DNZ’s executive team review the valuations performed by the independent valuers for financial reporting purposes.
This team reports directly to the Chief Executive. Discussions of valuation processes and results are held between
members of the executive team and the independent valuers, and the Chief Executive and Audit Committee, at least
once every six months, in line with DNZ’s reporting dates.
Breakdown of valuation by valuer:2015
$0002014
$000
Colliers 322,200 502,930
CBRE 189,520 102,600
JLL 182,485 114,900
Bayleys 129,600 27,600
Savills 36,300 30,470
860,105 778,500
DNZ fair values its investment properties by way of the following fair value measurement hierarchy levels:
Level 1 – quoted prices (unadjusted) in active markets for identical assets or liabilities;
Level 2 – inputs other than quoted prices included within level 1 that are observable for the asset or liability, either directly
(as prices) or indirectly (derived from prices);
Level 3 – inputs for the asset or liability that are not based on observable market data.
Investment property measurements are categorised as Level 3 in the fair value hierarchy. During the year there were
no transfers of investment properties between levels of the fair value hierarchy.
The key inputs used to measure fair value of investment properties, along with their sensitivity to significant increase
or decrease, are as follows: Fair value measurement sensitivity to significant:
Valuation Method
Significant Input Description
Increase in input
Decrease in input
Market capitalisation rate
The capitalisation rate is applied to the market income to assess an investment property’s value. The capitalisation rate is derived from detailed analysis of factors such as comparable sales evidence and leasing transactions in the open market taking into account location, tenant covenant – lease term and conditions, weighted average lease term (WALT), size and quality of the investment property.
Decrease Increase Capitalisation
Discount rate The discount rate is applied to future cash flows of an investment property to provide a net present value equivalent. The discount rate adopted takes into account recent comparable market transactions, prospective rates of return for alternative investments and apparent risk.
Decrease Increase Discounted Cash Flow
Market rental The valuer’s assessment of net market income for both occupied and vacant areas of the investment property.
Increase Decrease Capitalisation & Discounted Cash Flow
Weighted rental growth rate %
The weighted average rental growth rate applied to the market rental in the 10 year cash flow projection.
Increase Decrease Discounted Cash Flow

41DNZ PROPERTY FUND LIMITED | ANNUAL REPORT 2015
NOTES TO THE CONSOLIDATED FINANCIAL STATEMENTS (CONTINUED)
FOR THE YEAR ENDED 31 MARCH 2015
NOTE 9: INVESTMENT PROPERTIES (CONTINUED)
Valuation basis (continued)Generally, a change in the assumption made for the adopted capitalisation rate is accompanied by a directionally similar
change in the adopted discount rate. It may also result in an adjustment to the terminal yield. The adopted capitalisation
rate forms part of the income capitalisation approach and the adopted discount rate forms part of the discounted cash
flow approach.
When calculating fair value using the income capitalisation approach, the net market rent has a strong interrelationship
with the adopted capitalisation rate given the methodology involves assessing the total net market income receivable from
the property and capitalising this in perpetuity to derive a capital value. In theory, an increase in the net market rent and
an increase (softening) in the adopted capitalisation rate could potentially offset the impact to the fair value. The same
can be said for a decrease in the net market rent and a decrease (tightening) in the adopted capitalisation rate.
A directionally opposite change in the net market rent and the adopted capitalisation rate could potentially magnify
the impact to the fair value.
When assessing a discounted cash flow, the adopted discount rate and adopted terminal yield have a strong
interrelationship in deriving a fair value given the discount rate will determine the rate in which the terminal value is
discounted to the present value.
In theory, an increase (softening) in the adopted discount rate and a decrease (tightening) in the adopted terminal yield
could potentially offset the impact to the fair value. The same can be said for a decrease (tightening) in the discount rate
and an increase (softening) in the adopted terminal yield. A directionally similar change in the adopted discount rate and
the adopted terminal yield could potentially magnify the impact to the fair value.
The following tables detail the ranges used for each key significant input disclosed for the various investment property class:
As at 31 March 2015Market
capitalisation rateDiscount
rate Market rental
$/sqm
Weighted rental growth rate
(average 10 years)
Office 7.13% to 9.75% 8.75% to 12.00% 182-464 0.58%-2.82%
Industrial 6.50% to 8.50% 8.75% to 10.25% 73-188 2.55%-3.00%
Retail 7.00% to 9.50% 9.25% to 10.50% 155-384 2.30%-3.30%
Bulk Retail 6.88% to 10.50% 8.50% to 10.50% 99-233 0.91%-2.44%
Total Portfolio 6.50% to 10.50% 8.50% to 12.00% 73-464 0.58%-3.30%
As at 31 March 2014Market
capitalisation rateDiscount
rate Market rental
$/sqm
Weighted rental growth rate
(average 10 years)
Office 7.25% to 10.00% 9.00% to 10.50% 162-435 0.45%-2.82%
Industrial 6.75% to 8.75% 9.25% to 10.25% 71-187 2.10%-2.75%
Retail 7.13% to 10.00% 9.50% to 10.50% 179-403 2.26%-3.13%
Bulk Retail 7.13% to 11.75% 9.00% to 12.75% 71-218 2.32%-2.93%
Total Portfolio 6.75% to 11.75% 9.00% to 12.75% 71-435 0.45%-3.13%

42 DNZ PROPERTY FUND LIMITED | ANNUAL REPORT 2015
NOTES TO THE CONSOLIDATED FINANCIAL STATEMENTS (CONTINUED)
FOR THE YEAR ENDED 31 MARCH 2015
NOTE 9: INVESTMENT PROPERTIES (CONTINUED)
Valuation basis (continued)
Valuer2015
$000Market
cap rate %Occupancy
%WALT years
Office33 Corinthian Drive, Auckland CBRE 34,000 7.88 100.0 1.57-9 Fanshawe Street, Auckland Bayleys 13,600 9.75 100.0 2.7650 Great South Road, Auckland CBRE 28,300 8.50 84.3 3.480 Greys Avenue, Auckland Bayleys 16,200 8.25 100.0 3.821-25 Teed Street, Auckland CBRE 19,200 7.13 100.0 3.751 Corinthian Drive, Auckland CBRE 14,700 7.38 100.0 5.633 Customhouse Quay, Wellington Bayleys 33,400 7.25 100.0 4.01 Grey Street, Wellington CBRE 48,750 7.88 98.2 4.822 The Terrace, Wellington CBRE 15,000 8.50 89.2 3.6Office total 223,150 7.95 96.5 3.6
Industrial30 Airpark Drive, Auckland CBRE 19,350 7.25 100.0 4.722 Ha Crescent, Auckland JLL 8,150 8.00 0.0 0.08 Reg Savory Place, Auckland JLL 6,000 7.00 100.0 2.420 Rockridge Avenue, Auckland JLL 10,600 7.50 100.0 2.0460 Rosebank Road, Auckland JLL 9,100 8.50 100.0 1.011 Springs Road, Auckland JLL 21,100 8.25 100.0 2.525 O’Rorke Road, Auckland JLL 47,735 6.84 100.0 7.615 Rockridge Avenue, Auckland JLL 1,900 8.25 100.0 2.3415 East Tamaki Road, Auckland JLL 13,300 7.50 100.0 6.115 Ride Way, Auckland JLL 8,100 7.25 100.0 2.434 Airpark Drive, Auckland CBRE 4,500 6.50 100.0 12.820-22 Pollen Street, Auckland JLL 5,200 7.50 100.0 1.4Industrial total 155,035 7.40 92.5 4.6
RetailCnr Mt Wellington Highway & Penrose Road, Auckland Savills 36,300 7.13 100.0 4.0Cnr Ward, Bryce & Tristram Streets, Hamilton Colliers 13,900 9.50 95.4 2.5Johnsonville Shopping Centre, Wellington (50%) JLL 34,100 8.54 98.4 3.661 Silverdale Street, Auckland Colliers 82,500 7.00 99.8 8.065 Chapel Street, Tauranga Colliers 35,200 8.00 98.7 2.4Retail total 202,000 7.63 98.8 5.0
Bulk retail446 Te Rapa Road, Hamilton Colliers 18,000 8.13 100.0 4.2Cnr Tremaine Avenue & Railway Road, Palmerston North Bayleys 16,100 8.35 100.0 4.226-48 Old Taupo Road, Rotorua Colliers 16,600 8.25 100.0 4.2230-240 Fenton Street, Rotorua Colliers 13,500 8.13 100.0 5.478 Courtenay Street, New Plymouth Bayleys 21,200 7.40 100.0 14.59 Gloucester Street, Napier Bayleys 12,200 7.35 100.0 14.52 Carr Road, Auckland Colliers 29,700 6.88 100.0 11.9Cnr Te Irirangi Drive & Bishop Dunn Place, Auckland JLL 17,200 8.25 100.0 2.648 Miramar Avenue, Wellington Bayleys 10,100 7.25 100.0 14.535 MacLaggan Street, Dunedin Bayleys 6,800 10.50 100.0 0.3Bulk retail total 161,400 7.84 100.0 7.6
Land/development*39 Corinthian Drive, Auckland CBRE 5,720*NorthWest Shopping Centre, Auckland Colliers 112,800Total fair value of investment properties 860,105 7.72 96.5 5.1
*These investment properties are being held for development or are vacant land, consequently the market cap rate,
occupancy rate and WALT are not applicable.
The market cap rate %, occupancy % and WALT years for the property class totals and total investment properties are
a weighted average.

43DNZ PROPERTY FUND LIMITED | ANNUAL REPORT 2015
NOTES TO THE CONSOLIDATED FINANCIAL STATEMENTS (CONTINUED)
FOR THE YEAR ENDED 31 MARCH 2015
NOTE 9: INVESTMENT PROPERTIES (CONTINUED)
Valuation basis (continued)
Valuer2014
$000Market
cap rate %Occupancy
%WALT years
Office33 Corinthian Drive, Auckland CBRE 33,500 8.00 100.0 2.57-9 Fanshawe Street, Auckland Bayleys 12,150 10.00 100.0 2.0650 Great South Road, Auckland CBRE 25,600 8.50 90.1 2.28 Rockridge Avenue, Auckland CBRE 6,900 9.25 100.0 1.680 Greys Avenue, Auckland Bayleys 15,450 8.50 100.0 4.221-25 Teed Street, Auckland CBRE 17,500 7.50 100.0 3.251 Corinthian Drive, Auckland Colliers 13,700 7.50 100.0 6.333 Customhouse Quay, Wellington Colliers 32,300 7.25 100.0 5.01 Grey Street, Wellington Colliers 47,600 7.88 100.0 5.722 The Terrace, Wellington Colliers 14,350 8.38 100.0 4.313 Jarden Mile, Wellington Colliers 2,600 7.50 100.0 3.0Office total 221,650 8.05 98.7 3.8
Industrial30 Airpark Drive, Auckland CBRE 15,100 7.50 100.0 5.5968 Great South Road, Auckland JLL 6,500 7.75 100.0 6.022 Ha Crescent, Auckland JLL 8,100 8.00 100.0 0.98 Reg Savory Place, Auckland JLL 5,550 7.63 100.0 3.420 Rockridge Avenue, Auckland JLL 10,400 8.00 100.0 3.0460 Rosebank Road, Auckland JLL 9,400 8.50 100.0 2.011 Springs Road, Auckland JLL 20,750 8.50 100.0 3.525 O’Rorke Road, Auckland Colliers 43,185 7.24 100.0 8.715 Rockridge Avenue, Auckland Colliers 1,820 8.75 100.0 3.2415 East Tamaki Road, Auckland JLL 13,150 7.50 100.0 7.115 Ride Way, Auckland JLL 7,100 7.75 100.0 3.434 Airpark Drive, Auckland CBRE 4,000 6.75 100.0 13.920-22 Pollen Street, Auckland JLL 4,950 8.00 100.0 2.412 Tyers Road, Wellington Colliers 2,430 8.00 100.0 0.5709 Te Rapa Road, Hamilton JLL 11,800 8.00 100.0 11.6Industrial total 164,235 7.75 100.0 5.8
RetailCnr Mt Wellington Highway & Penrose Road, Auckland Savills 30,470 7.58 98.9 2.1Cnr Ward, Bryce & Tristram Streets, Hamilton Colliers 13,600 10.00 93.3 3.3Johnsonville Shopping Centre, Wellington (50%) Colliers 34,100 8.54 98.9 3.661 Silverdale Street, Auckland Colliers 78,500 7.13 99.8 9.065 Chapel Street, Tauranga Colliers 34,000 8.13 98.7 2.7Retail total 190,670 7.83 98.5 5.2
Bulk retailCnr Anglesea & Liverpool Streets, Hamilton Colliers 7,100 9.00 100.0 4.8446 Te Rapa Road, Hamilton Colliers 17,400 8.38 100.0 5.2Cnr Tremaine Avenue & Railway Road, Palmerston North Colliers 15,800 8.35 100.0 5.226-48 Old Taupo Road, Rotorua Colliers 16,100 8.38 100.0 5.2230-240 Fenton Street, Rotorua Colliers 12,800 8.50 100.0 1.4170-180 Taradale Road, Napier Colliers 4,175 8.75 100.0 2.378 Courtenay Street, New Plymouth Colliers 20,980 7.38 100.0 15.59 Gloucester Street, Napier Colliers 11,900 7.25 100.0 15.52 Carr Road, Auckland Colliers 27,900 7.25 100.0 12.9Cnr Te Irirangi Drive & Bishop Dunn Place, Auckland JLL 17,200 8.25 100.0 3.648 Miramar Avenue, Wellington Colliers 9,850 7.13 100.0 15.535 MacLaggan Street, Dunedin Colliers 6,890 11.75 100.0 1.3Bulk retail total 168,095 8.08 100.0 7.9
Land/development*39 Corinthian Drive, Auckland Colliers 6,150*NorthWest Shopping Centre land, Auckland Colliers 27,700Total fair value of investment properties 778,500 7.94 99.5 5.5
*These investment properties were being held for development or are vacant land and consequently the market cap rate, occupancy rate and WALT were not applicable.
The market cap rate %, occupancy % and WALT years for the property class totals and total investment properties are a weighted average.

44 DNZ PROPERTY FUND LIMITED | ANNUAL REPORT 2015
NOTES TO THE CONSOLIDATED FINANCIAL STATEMENTS (CONTINUED)
FOR THE YEAR ENDED 31 MARCH 2015
NOTE 10: WORK IN PROGRESS
Work in progress is investment property which is being developed by DNZ for rental purposes, and is initially stated at
cost and subsequently carried at fair value. Fair value measurement is only applied if it is considered that the fair value
can be reliably measured. In order to evaluate whether the fair value of work in progress can be determined reliably,
management considers:
• The provisions of the construction contract
• The stage of completion
• Whether the project/property is standard (typical for the market) or non-standard
• The level of reliability of cash inflows after completion
• The development risk specific to the property
The fair value of investment property reflects, among other things, rental income contracted by leases and assumptions
about rental income from future leases in light of the current market conditions. The fair value also reflects, on a similar
basis, the cash outflows that could be expected in respect of the investment property. However, when work in progress
is at an early stage in a development, fair value cannot be determined and the work in progress is stated at cost less any
impairment.
2015 $000
2014 $000
Johnsonville Shopping Centre, Wellington 161 –
NorthWest Shopping Centre, Auckland – 8,662
25 O’Rorke Road, Auckland – Capital S.M.A.R.T. – 99
161 8,761
31 March 2015
Work in progress costs for Johnsonville Shopping Centre, Wellington, have been incurred in relation to the future
development of the shopping centre.
31 March 2014
For NorthWest Shopping Centre, Auckland, costs were incurred in relation to the enclosed shopping centre development.
This development has now been classified as investment property.
For 25 O’Rorke Road, Auckland – Capital S.M.A.R.T., costs were incurred in relation to a new warehouse and
office facility. This development was completed in October 2014 and has now been classified as investment property.
The feasibility for the future development of the shopping centre at Johnsonville Shopping Centre, Wellington, was
updated to reflect an estimated escalation in costs for a delay in the construction timetable along with other refinements.
These changes resulted in an overall increase in costs for the feasibility which exceeded the value on completion and
resulted in the carrying work in progress value being impaired by $3,183,277.
Costs were incurred in relation to the future development of an office building at 39 Corinthian Drive, Auckland.
The overall cost of this feasibility exceeded value on completion and resulted in the carrying work in progress being
impaired by $188,429.

45DNZ PROPERTY FUND LIMITED | ANNUAL REPORT 2015
NOTES TO THE CONSOLIDATED FINANCIAL STATEMENTS (CONTINUED)
FOR THE YEAR ENDED 31 MARCH 2015
NOTE 11: NON-CURRENT ASSETS HELD FOR SALE
Non-current assets held for sale are investment properties DNZ is in the process of disposing of. They are stated at
the lower of carrying amount or fair value and are classified as non-current assets held for sale under NZ IFRS 5 –
Non-Current Assets Held for Sale and Discontinued Operations.
31 March 2015
• Lots 82,83,85 Tauriko Industrial Estate, Tauranga
• 170-180 Taradale Road, Napier
• Corner Anglesea & Liverpool Streets, Hamilton
The fair value of these investment properties as at 31 March 2015 is $12,265,000. A movement in their fair value of
($36,252) (2014: $Nil) was recorded in the statement of comprehensive income as a component of the net change in fair
value of investment properties.
These investment properties are expected to be sold during the next twelve months. The directors have put these
investment properties up for sale as they do not meet the current strategic investment goals of DNZ.
On 9 June 2014, DNZ settled on the sale of Lot 84, Tauriko Industrial Estate, Tauranga, for $337,415, with the resulting gain
on sale of $24,932 reflected in the statement of comprehensive income.
31 March 2014
• Lots 82-85 Tauriko Industrial Estate, Tauranga
The fair value of this investment property was $1,650,000 as at 31 March 2014.
NOTE 12: INVENTORY
DNZ’s inventory relates to a property that is being developed and where there is an option held by another party to buy
the property within the short term. The property is held at the lower of cost and net realisable value. Net realisable value
is the estimated selling price in the ordinary course of business less costs to complete development and selling expenses.
2015 $000
2014 $000
Westgate Stage Two, Auckland 685 –
685 –
DNZ plans to develop a further 7,000m2 of retail, dining and office space on land opposite its NorthWest Shopping
Centre, in a project known as ‘Westgate Stage Two’. DNZ’s work on Westgate Stage Two is being performed further to
a conditional right in its original agreement to acquire the NorthWest Shopping Centre land from Westgate Town Centre
Limited (WTCL) in 2013. Under that agreement, following the occurrence of certain events:-
• DNZ can obtain an initial 35 year ground lease from the landowner, WTCL, at no cost and there is no annual ground
rental payable.
• WTCL can acquire the development from DNZ within three years of the ground lease’s effective date, at a price equal
to 115% of DNZ’s total development cost, including holding costs.
• If WTCL does not acquire the development within the three year period, DNZ can obtain freehold title to the land for $1.
DNZ has obtained a ground lease effective from 19 December 2014. WTCL has disputed DNZ’s entitlement to obtain the
ground lease. DNZ disagrees with WTCL’s position and considers that the terms of its agreement with WTCL are clear.
DNZ and WTCL are currently engaged in dispute resolution processes to resolve the matter.
The Westgate Stage Two project is at a preliminary planning phase and is expected to cost approximately $30 million.
As at 31 March 2015, DNZ had committed to $1,935,000 for feasibility and development costs of the Westgate Stage Two.

46 DNZ PROPERTY FUND LIMITED | ANNUAL REPORT 2015
NOTES TO THE CONSOLIDATED FINANCIAL STATEMENTS (CONTINUED)
FOR THE YEAR ENDED 31 MARCH 2015
NOTE 13: TRADE AND OTHER RECEIVABLES
Trade and other receivables are recognised and carried initially at their fair value plus directly attributable costs,
and subsequently measured at amortised cost less impairment losses. An impairment provision is made when there is
objective evidence (such as the probability of insolvency or significant financial difficulties of the debtor) that DNZ will
not be able to collect all of the amounts due under the original terms of the invoice.
2015 $000
2014 $000
Current
Trade and other receivables 588 657
Less impairment provision (137) (128)
Related party receivable (note 20) 203 264
654 793
Carrying amount 654 793
Amount not due at balance date – –
Less than 30 days 547 630
Over 30 days 107 163
Movement in impairment provision:
Opening balance (128) (147)
(Additional)/release of impairment provision (9) 19
Closing balance (137) (128)
Bad and impaired debts in the statement of comprehensive income:
– Bad debts written off 96 82
– Movement in impairment provision 9 (19)
105 63
NOTE 14: TRADE AND OTHER PAYABLES
Trade and other payables represent unsecured liabilities for goods and services provided to DNZ prior to the end of the
financial year which are unpaid.
2015 $000
2014 $000
Current
Unsecured liabilities
Trade payables 1,900 2,334
Sundry creditors and accruals 12,965 6,400
14,865 8,734

47DNZ PROPERTY FUND LIMITED | ANNUAL REPORT 2015
NOTES TO THE CONSOLIDATED FINANCIAL STATEMENTS (CONTINUED)
FOR THE YEAR ENDED 31 MARCH 2015
NOTE 15: INCOME TAX
Current and deferred tax is calculated on the basis of the laws enacted or substantively enacted at the reporting date.
The income tax expense is represented by:2015
$0002014
$000
Current tax 7,445 7,256
Deferred tax 1,007 176
Income tax expense per the statement of comprehensive income 8,452 7,432
Net profit before income tax 77,287 48,994
Prima facie income tax using the company tax rate of 28% 21,640 13,718
(Decrease)/increase in income tax due to:
Net change in fair value of investment properties (10,762) (5,225)
Non-taxable income – (233)
Depreciation (2,405) (2,590)
Depreciation recovered on disposal of investment properties 258 (107)
Non-deductible expenses 298 1,565
Expenditure deductible for tax (1,430)
Over-provision in prior year (3) (130)
Temporary differences (151) 258
Current tax expense 7,445 7,256
Depreciation 662 429
Other 345 (253)
Deferred tax charged to profit or loss 1,007 176
Income tax expense per the statement of comprehensive income 8,452 7,432
Deferred tax is provided, using the liability method, on all temporary differences between the tax base of assets and
liabilities and their carrying amounts for financial reporting purposes.
For deferred tax liabilities or assets arising on investment property measured at fair value, it is assumed that the carrying
amounts of the investment property will be recovered through sale. Investment properties are independently valued each
year (note 9) and the valuation includes a split between the land and building components. Deferred tax is provided on
the depreciation claimed to date on the building component of the investment properties and this places reliance on the
valuation split provided by the valuers.
Deferred income tax assets and liabilities are offset when there is a legally enforceable right to offset current tax assets
against current tax liabilities and when the deferred income tax assets and liabilities relate to income taxes levied by the
same taxation authority on either the same taxable entity or different taxable entities.

48 DNZ PROPERTY FUND LIMITED | ANNUAL REPORT 2015
NOTES TO THE CONSOLIDATED FINANCIAL STATEMENTS (CONTINUED)
FOR THE YEAR ENDED 31 MARCH 2015
NOTE 15: INCOME TAX (CONTINUED)
The deferred tax has been shown as a non-current liability in the statement of financial position.
2015 $000
2014 $000
Deferred tax assets
Deferred tax assets to be recovered within 12 months 149 522
Deferred tax assets to be recovered after more than 12 months 1,241 334
1,390 856
Deferred tax liabilities
Deferred tax liabilities to be incurred within 12 months (451) (21)
Deferred tax liabilities to be incurred after more than 12 months (16,541) (17,251)
(16,992) (17,272)
Net deferred tax liability (15,602) (16,416)
The gross movement on the deferred income tax account is as follows:2015
$0002014
$000
Opening balance (16,416) (13,520)
Charged to profit or loss (1,007) (176)
Credited/(charged) to other comprehensive income 1,821 (2,720)
Closing balance (15,602) (16,416)
2014$000
Recognised in profit or loss
$000
Recognised in other
comprehensive income
$0002015
$000
Deferred tax assets
Derivative financial instruments 395 – 859 1,254
Other temporary differences 461 (325) – 136
856 (325) 859 1,390
Deferred tax liabilities
Building depreciation (16,223) (662) – (16,885)
Derivative financial instruments (997) – 962 (35)
Reinstatement receipts (52) (15) – (67)
Other investments accrued interest – (5) – (5)
(17,272) (682) 962 (16,992)

49DNZ PROPERTY FUND LIMITED | ANNUAL REPORT 2015
NOTES TO THE CONSOLIDATED FINANCIAL STATEMENTS (CONTINUED)
FOR THE YEAR ENDED 31 MARCH 2015
NOTE 15: INCOME TAX (CONTINUED)
2013$000
Recognised in profit or loss
$000
Recognised in other
comprehensive income
$0002014
$000
Deferred tax assets
Derivative financial instruments 2,118 – (1,723) 395
Other temporary differences 239 222 – 461
2,357 222 (1,723) 856
Deferred tax liabilities
Building depreciation (15,794) (429) – (16,223)
Derivative financial instruments – – (997) (997)
Reinstatement receipts (83) 31 – (52)
(15,877) (398) (997) (17,272)
2015 $000
2014 $000
Imputation credits
Opening balance 1,810 1,392
Tax payments, net of refunds 5,387 5,362
Anticipated tax payments to meet current year income tax expense 1,931 1,808
Credits attached to dividends received 2 1
Credits attached to dividends paid (7,190) (6,753)
Imputation credits available for use in subsequent reporting periods 1,940 1,810
NOTE 16: DERIVATIVE FINANCIAL INSTRUMENTS
Interest rate derivatives (derivative financial instruments) are initially recognised at fair value on the date a derivative
contract is entered into and are subsequently measured at their fair value at each reporting date. Fair value is defined
as the price that would be received to sell an asset, or paid to transfer a liability in an orderly transaction between market
participants at the measurement date.
At the inception of the transaction, DNZ documents the relationship between hedging instruments and hedged items,
as well as its risk management objectives and strategy for undertaking various hedging transactions. DNZ also documents
its assessment, both at hedge inception and on an ongoing basis, of whether the derivatives that are used in hedging
transactions are highly effective in offsetting changes in fair value or cash flows of hedged items.
The full fair value of a hedging derivative is classified as a non-current asset or liability when the remaining maturity of the
hedged item is more than 12 months and as a current asset or liability when the remaining maturity of the hedged item
is less than 12 months.
The effective portion of changes in the fair value of derivatives that are designated and qualify as cash flow hedges
is recognised as other comprehensive income in the statement of comprehensive income. The gain or loss relating to
the ineffective portion is recognised immediately in the statement of comprehensive income within finance expenses.
DNZ has fair valued its interest rate derivatives as Level 2 as at 31 March 2015 (2014: Level 2). There have been no
transfers between Level 1 and 2 during the respective periods.

50 DNZ PROPERTY FUND LIMITED | ANNUAL REPORT 2015
NOTES TO THE CONSOLIDATED FINANCIAL STATEMENTS (CONTINUED)
FOR THE YEAR ENDED 31 MARCH 2015
NOTE 16: DERIVATIVE FINANCIAL INSTRUMENTS (CONTINUED)
Interest rate derivative fair values are independently valued and are calculated using a discounted cash flow model using
forward interest rates extracted from observable yield curves. Discount rates include an adjustment for counterparty credit
risk. The effect of discounting is generally insignificant for Level 2 derivatives. The independent valuer reports directly to the
Chief Financial Officer. Discussions of valuation processes and results are held between the Chief Financial Officer and the
independent valuer semi-annually.
At balance date, the outstanding interest rate derivative contracts were:
2015 $000
2014 $000
Active interest rate derivative contracts 225,000 190,000
Forward dated interest rate derivative contracts 120,000 125,000
Total notional principal amounts 345,000 315,000
At balance date, the fixed interest rates ranged from 3.25% to 5.14% (2014: 3.25% to 5.14%), the weighted average interest rate
(excluding forward starts) was 4.28% (2014: 4.36%), and the main floating rate was BKBM. Gains and losses recognised in
the cash flow hedge reserve in equity (note 18) on interest rate derivative contracts as at 31 March 2015 will be continuously
released to the statement of comprehensive income within finance expenses until the repayment of the bank borrowings.
At balance date, if the floating interest rates on hedged bank borrowings had been 1% higher, with other variables remaining
constant, equity would have been $8,585,321 (2014: $6,463,337) higher for the year. If the floating interest rates on the
hedged bank borrowings had been 1% lower, with other variables remaining constant, equity would have been $9,067,180
(2014: $7,040,843) lower for the year. There would have been no impact on profit in either year. The interest rate sensitivity
analysis is performed by using an instantaneous parallel shift in the par yield curve at the testing date.
DNZ does not hold derivative financial instruments for trading purposes.
NOTE 17: BANK BORROWINGS
Borrowings are recognised initially at fair value, net of transaction costs incurred. Borrowings are subsequently stated at
amortised cost; any difference between the proceeds (net of transaction costs) and the redemption value is recognised in the
statement of comprehensive income over the period of the borrowings using the effective interest method. Borrowings are
classified as current liabilities unless DNZ has an unconditional right to defer settlement of the liability for at least 12 months
after the reporting date.
2015 $000
2014 $000
Non-current
Facility drawn down 305,876 268,236
Borrowing costs (537) (495)
Total borrowings 305,339 267,741
Facility drawn down 305,876 268,236
Undrawn facility available 94,124 131,764
Total facility available 400,000 400,000
Weighted average interest rate for drawn debt (inclusive of current interest
rate derivatives, margins and line fees) at balance date 5.60% 5.75%

51DNZ PROPERTY FUND LIMITED | ANNUAL REPORT 2015
NOTES TO THE CONSOLIDATED FINANCIAL STATEMENTS (CONTINUED)
FOR THE YEAR ENDED 31 MARCH 2015
NOTE 17: BANK BORROWINGS (CONTINUED)
On 31 October 2014, DNZ refinanced its bank facility extending the term of the two tranches of $200 million each for
a further one year, with Tranche A now expiring 31 October 2017, and Tranche B now expiring 31 October 2019. More
favourable line fees and margin were also achieved. DNZ’s secured borrowings are via syndicated senior secured facilities
with ANZ Bank New Zealand Limited, Bank of New Zealand, Commonwealth Bank of Australia and Westpac New Zealand
Limited. The bank security on the facilities is managed through a security agent who holds a first registered mortgage on
all the investment properties owned by DNZ and a registered first ranking security interest under a General Security Deed
over substantially all the assets of DNZ. The interest rate on the facility was 4.54% as at balance date (2014: 3.97%).
NOTE 18: EQUITY
Share CapitalShares are classified as equity when there is no obligation to transfer cash or other assets. Incremental costs directly
attributable to the issue of new shares or options are shown in equity as a deduction, net of tax, from the proceeds.
$000
Opening balance 31 March 2013 431,391
Issue of shares 69,815
Capital raising expenses (1,569)
Shares issued under DRP 6,197
Closing balance 31 March 2014 505,834
Current year transactions –
Closing balance 31 March 2015 505,834
Number of shares on issue 000
Opening balance 31 March 2013 250,449
Shares issued under the long term share incentive plan 702
Shares issued under Private Placement 35,714
Shares issued under Share Purchase Plan 5,967
Shares issues under DRP 4,024
Closing balance 31 March 2014 296,856
Shares issued under the long term share incentive plan 372
Closing balance 31 March 2015 297,228
There is only one class of shares, being ordinary shares, and they rank equally with each other. All issued shares are
fully paid and have no par value. Shareholders can appoint up to eight directors.
The Dividend Reinvestment Plan (DRP) was in place for the first three quarter dividends for the 2014 financial year.
A discount for the shares issued under the DRP was set at 1% on the five day weighted average trading price of the shares
commencing the day after the record dates.
On 8 April 2013, DNZ issued 702,479 ordinary shares under its long term share incentive schemes one, two and three
and on 11 April 2014, issued 371,566 ordinary shares under its long term share incentive schemes one and two.
On 30 May 2013, DNZ issued 35,714,285 ordinary shares under the Private Placement. The shares were issued at $1.68
and raised gross proceeds of $60 million.
On 5 July 2013, DNZ issued 5,966,572 ordinary shares under the Share Purchase Plan to 1,257 participating shareholders.
The shares were issued at $1.645 and raised $9.815 million.

52 DNZ PROPERTY FUND LIMITED | ANNUAL REPORT 2015
NOTES TO THE CONSOLIDATED FINANCIAL STATEMENTS (CONTINUED)
FOR THE YEAR ENDED 31 MARCH 2015
NOTE 18: EQUITY (CONTINUED)
Basic and diluted earnings per shareBasic and diluted earnings per share amounts are calculated by dividing net profit after income tax attributable
to shareholders by the weighted average number of shares on issue.
2015 $000
2014 $000
Net profit after income tax attributable to shareholders 68,835 41,562
Weighted average number of shares for purpose of basic earnings per share (000)
(Refer note 6) 297,228 286,586
Basic earnings per share – weighted (cents) 23.16 14.50
Weighted average number of shares for purpose of diluted earnings per share (000)
(Refer note 6) 297,428 287,273
Diluted earnings per share – weighted (cents) 23.14 14.47
Reserves2015
$0002014
$000
Reserves consist of:
Cash flow hedge reserve (3,135) 1,548
Options reserve – 249
Closing balance (3,135) 1,797
Cash flow hedge reserve
Opening balance 1,548 (5,448)
Movement in fair value of interest rate derivatives (6,504) 9,716
Tax on fair value movement 1,821 (2,720)
Closing balance (3,135) 1,548
Options reserve
Opening balance 249 572
Movement in employee long term share incentive plan 18 154
Transfer to retained earnings on vesting/forfeiture of employee long term share incentive plan (267) (477)
Closing balance – 249
NOTE 19: FINANCIAL ASSETS AND LIABILITIES
A financial instrument is recognised if DNZ becomes a party to the contractual provisions of the instrument. Financial
assets are de-recognised if DNZ’s contractual rights to the cash flows expire, or if DNZ transfers them without retaining
control or substantially all risks and rewards of the asset. Financial liabilities are de-recognised if DNZ’s obligations
specified in the contract are extinguished.

53DNZ PROPERTY FUND LIMITED | ANNUAL REPORT 2015
NOTES TO THE CONSOLIDATED FINANCIAL STATEMENTS (CONTINUED)
FOR THE YEAR ENDED 31 MARCH 2015
NOTE 19: FINANCIAL ASSETS AND LIABILITIES (CONTINUED)
Financial assetsDepending on the purpose for which the investments were acquired, DNZ classifies its investments as financial assets
at fair value through profit or loss and loans and receivables. The classification depends on the purpose for which the
financial assets were acquired. Management determines the classification of its investments at initial recognition and
re-evaluates this designation at every reporting date.
Other investments
Other investments relate to DNZ’s investment in Diversified NZ Property Fund Limited. The investment is carried at fair
value through profit or loss. It was initially recognised at trade date at fair value and transaction costs were expensed
in the statement of comprehensive income. Gains or losses arising from the changes in fair value are presented in the
statement of comprehensive income in the period in which they arise.
Loans and receivables
Loans and receivables are non-derivative financial assets with fixed or determinable payments that are not quoted in an
active market. They are included in current assets, except for those with maturities greater than 12 months after balance
date, which are classified as non-current assets.
Loans and receivables are initially recognised at fair value plus transaction costs and are thereafter carried at amortised
cost using the effective interest method. DNZ assesses at each balance date whether there is objective evidence (such
as significant financial difficulty of the obligor, breach of contract, or it becomes probable that the debtor will enter
bankruptcy) that a financial asset or a group of financial assets is impaired. The amount of the loss is recognised in the
statement of comprehensive income.
Financial liabilitiesThis category includes all financial liabilities other than those designated as fair value through profit or loss for the year.
Liabilities in this category are measured at amortised cost and include borrowings and other payables.
2015 $000
2014 $000
Summary of financial instruments
Non-derivative financial assets
Classified as loans and receivables
Cash and cash equivalents 4,431 4,440
Trade and other receivables 654 793
NZX bond 75 75
Total non-derivative financial assets at amortised cost 5,160 5,308
Other investments 1,358 –
Total non-derivative financial assets at fair value through profit or loss 1,358 –
Non-derivative financial liabilities
Trade and other payables 14,865 8,734
Bank borrowings 305,339 267,741
Total non-derivative financial liabilities at amortised cost 320,204 276,475
Derivative financial instruments used for hedging
Interest rate derivative (liabilities)/assets (4,354) 2,150
Total derivative financial instruments used for hedging (4,354) 2,150

54 DNZ PROPERTY FUND LIMITED | ANNUAL REPORT 2015
NOTES TO THE CONSOLIDATED FINANCIAL STATEMENTS (CONTINUED)
FOR THE YEAR ENDED 31 MARCH 2015
NOTE 19: FINANCIAL ASSETS AND LIABILITIES (CONTINUED)
DNZ’s activities expose it to a variety of financial risks: market risk (including price risk and cash flow interest rate risk),
credit risk and liquidity risk.
Risk management is carried out by the Board. The Board identifies and evaluates financial risks in close co-operation
with management. The Board provides written principles for overall risk management, as well as written policies covering
specific areas, such as interest rate risk, credit risk, use of derivative financial instruments and non-derivative financial
instruments, and investing excess liquidity.
Market riskAs DNZ has no significant interest bearing assets, its income and operating cash flows are substantially independent of
changes in market interest rates.
DNZ’s interest rate risk arises from bank borrowings (note 17). Borrowings issued at variable rates expose DNZ to cash
flow interest rate risk. Borrowings issued at fixed rates expose DNZ to fair value interest rate risk. The long term interest
rate policy provides bands that are applied on a rolling basis, which provide for both a high level of fixed interest rate cover
over the near term, as well as a lengthy period of known fixed interest rate cover for a portion of term debt.
DNZ manages its cash flow interest rate risk by using floating to fixed interest rate derivatives. Such interest rate
derivatives have the economic effect of converting borrowings from floating to fixed rates. Under the interest rate
derivatives, DNZ agrees with other parties to exchange, at quarterly intervals, the difference between floating contract
rates and fixed rate interest amounts calculated by reference to the agreed notional principal amounts. As DNZ holds
interest rate derivatives, there is a risk that their economic value will fluctuate because of changes in market interest rates.
The value of interest rate derivatives is disclosed in note 16 and it is acknowledged that there will be fluctuations in their
economic value as a result of changes in market interest rates. DNZ’s exposure to interest rate fluctuations is minimal,
to the extent of all the non-hedged portions of bank borrowings.
DNZ’s exposure to variable interest rate risk and the effective weighted average interest rate for interest bearing financial
assets and liabilities is as follows:
2015 $000
2014 $000
Financial assets
Cash and cash equivalents 4,431 4,440
NZX bond 75 75
Other investments 1,358 –
Financial liabilities
Bank borrowings 305,339 267,741
The interest rate applicable at balance date for cash and cash equivalent balances was 2.50% (2014: 2.25%), for NZX bond
was 3.79% (2014: 3.50%), for other investments 4.0%, and for bank borrowings was 4.54% (2014: 3.97%). DNZ’s exposure
to interest rates is hedged through the use of interest rate derivatives. The weighted average interest rate for drawn debt
(inclusive of current interest rate derivatives, margins and line fees) of the bank borrowings at balance date was 5.60%
(2014: 5.75%).
Trade and other receivables and payables are interest free and have settlement dates within one year. All other assets
and liabilities are non-interest bearing.

55DNZ PROPERTY FUND LIMITED | ANNUAL REPORT 2015
NOTES TO THE CONSOLIDATED FINANCIAL STATEMENTS (CONTINUED)
FOR THE YEAR ENDED 31 MARCH 2015
NOTE 19: FINANCIAL ASSETS AND LIABILITIES (CONTINUED)
Credit riskIn the normal course of business, DNZ incurs credit risk from trade receivables and transactions with financial institutions.
The risk associated with trade receivables is managed with a credit policy which includes performing credit evaluations
on all customers requiring credit, and ensures that only those customers with appropriate credit histories are provided
with credit. In addition, receivable balances are monitored on an ongoing basis, with the result that DNZ’s exposure to
bad debts is not significant. As DNZ has a wide spread of tenants over many industry sectors, it is not exposed to any
significant concentration of credit risk. Amounts which are past due are not considered impaired as the majority are due
from tenants that have demonstrated a good past payment history.
The risk from financial institutions is managed by placing cash and deposits with high credit quality financial institutions
only. DNZ has placed its cash and deposits with ANZ Bank New Zealand Limited, which is AA- rated by Standard & Poor’s.
DNZ is not exposed to any other concentrations of credit risk.
Liquidity risk Prudent liquidity risk management implies maintaining sufficient cash, the availability of funding through an adequate
amount of committed credit facilities, and the ability to close out market positions. DNZ’s liquidity position is monitored
on a regular basis and is reviewed monthly by the Board to ensure compliance with internal policies and banking
covenants per DNZ’s syndicated lending facility.
DNZ generates sufficient cash flows from its operating activities to meet its obligations arising from its financial liabilities
and has the bank facility available to cover potential shortfalls. Further detail about the undrawn bank facility available is
given in note 17. The following table outlines DNZ’s liquidity profile based on contractual non-discounted cash flows.
Total$000
0-6 mths $000
6-12 mths$000
1-2 yrs$000
2-5 yrs$000
>5 yrs$000
31 March 2015 Trade and other payables 14,865 14,865 – – – –
Secured bank borrowings 329,957 3,744 3,744 7,489 314,980 –
Derivative financial instruments 40,154 4,798 4,777 9,429 18,505 2,645
384,976 23,407 8,521 16,918 333,485 2,645
31 March 2014
Trade and other payables 8,734 8,734 – – – –
Secured bank borrowings 297,055 3,565 3,640 7,130 282,720 –
Derivative financial instruments 36,373 4,142 3,917 7,608 17,484 3,222
342,162 16,441 7,557 14,738 300,204 3,222
Capital risk managementDNZ’s capital structure includes debt and equity, comprising shares, reserves and retained earnings as shown in the
statement of financial position. DNZ’s objectives when managing capital are to safeguard DNZ’s ability to continue as
a going concern in order to provide returns for shareholders, and to maintain an optimal capital structure to reduce
the cost of capital. In order to maintain or adjust the capital structure, DNZ may adjust the amount of dividends paid to
shareholders, return capital to shareholders, buy back shares, issue new shares or sell assets to reduce debt.
As part of its capital risk management, DNZ is required to comply with covenants imposed under its banking facility.
The Board regularly monitors these covenants and provides six monthly compliance certificates to the banks as part
of this process. DNZ has complied with these covenants during the current and previous years.
Fair valuesThe carrying value of the following financial assets and liabilities approximate their fair value: cash and cash equivalents,
trade and other receivables, other current assets, other investments, trade and other payables and bank borrowings.
56 DNZ PROPERTY FUND LIMITED | ANNUAL REPORT 2015
NOTES TO THE CONSOLIDATED FINANCIAL STATEMENTS (CONTINUED)
FOR THE YEAR ENDED 31 MARCH 2015
NOTE 20: RELATED PARTY DISCLOSURES
The following transactions with a related party took place:2015
$0002014
$000
Diversified NZ Property Fund Limited
– Manager’s fee income 703 694
– Building management fee income 137 138
– Accounting fee income 30 30
– Leasing fee income 113 133
– Project management fee income 17 106
– Rent paid (6) (6)
The following balance was receivable from a related party:
Diversified NZ Property Fund Limited 203 264
DNZ manages Diversified NZ Property Fund Limited (Diversified) and receives management fee income for managing
its assets. The balance receivable was unsecured, non-interest bearing and payable quarterly in arrears. DNZ is related to
Diversified by a degree of common directorship. Tim Storey and Peter Alexander are directors of Diversified. Diversified
is the joint arrangement partner in the Johnsonville Shopping Centre unincorporated joint arrangement.
On 14 November 2014, DNZ acquired 2,126,571 convertible notes (approximately 2%) in Diversified for $1,602,315. The
convertible notes were previously held by Diversified Management Limited (50% owned by interests associated with Paul
Duffy – former Chief Executive of DNZ). Diversified Management Limited had originally acquired the convertible notes in
connection with its role as manager of Diversified, a role assumed by DNZ in 2010. Ownership of the convertible notes by
the Manager aligns the interests of DNZ with the investors in Diversified. Paul Duffy was a director of Diversified until
31 January 2014.
On 11 April 2014, Paul Duffy received 53,751 shares under the long term share incentive scheme two.
Under DNZ’s dividend reinvestment plan, John Harvey, Michael Stiassny and Tim Storey each acquired 1,608 ordinary
shares on 12 September 2013, 1,737 ordinary shares on 13 December 2013 and 1,810 ordinary shares on 14 March 2014.
2015 $000
2014 $000
Directors’ fees 278 225
Chairman’s fees 130 130
408 355
No other benefits have been provided by DNZ to a director for services as a director or in any other capacity, other than
those amounts disclosed in note 21.

57DNZ PROPERTY FUND LIMITED | ANNUAL REPORT 2015
NOTES TO THE CONSOLIDATED FINANCIAL STATEMENTS (CONTINUED)
FOR THE YEAR ENDED 31 MARCH 2015
NOTE 21: REMUNERATION
2015 $000
2014 $000
Key management personnel costs
Salary and other short term benefits 2,136 2,851
Restructuring costs – 467
Rights issued under employee long term share incentive schemes 18 154
2,154 3,472
Key management personnel includes the Chief Executive (Peter Alexander) and the members of the executive team. In
the current year, $442,000 of salary and other short term benefits for executive team members has been capitalised to
NorthWest Shopping Centre, Auckland, development. The prior year also included the former Chief Executive (Paul Duffy).
Long term share incentive plan DNZ operates a long term share incentive plan for the executive team that is intended to align the interests of key
employees with the interests of shareholders and provide a continuing incentive to key employees over the long term
horizon. DNZ receives services from the employees in exchange for the employees receiving share based payments
only if specified hurdles, relating to the performance of the company, are achieved.
The share performance rights are measured at fair value at grant date and expensed over the period during which the
employee becomes unconditionally entitled to the shares, based on the estimate of shares that will eventually vest.
Where a tranche has the ability to be retested, the spreading of the share performance right expense is calculated by
valuing each tranche as two share performance rights, one to the first test date and one to the second test date. The
expense for each instrument is then spread over the relevant periods. The fair value of the share performance rights
which are either vested or forfeited are transferred from the options reserve to retained earnings.
Three schemes have been implemented under the plan. On 11 April 2014, DNZ issued 371,566 ordinary shares under the
long term share incentive schemes one and two. All shares have now been issued under schemes one and two and there
are no available tranches left under these schemes. Under scheme three, all shares have been issued for tranche one,
however no shares have been issued with regard to tranches two and three as the hurdles had not been achieved as at
31 March 2015. The share performance rights, with regard to tranches two and three, have now lapsed and the scheme
is at an end.
The participating employees are liable for the income tax cost of the award of shares and may choose to sell some or all
shares to fund this cost upon issue of the shares. The participants receive one share for every performance right that
vests on a tranche date for nil consideration.
Further share performance rights under the long term share incentive plan may be issued on an annual basis. However,
the terms of the plan, eligible participants, and offers of further share performance rights may be modified by the Board
from time to time, subject to the requirements of the NZX Main Board Listing Rules and applicable laws.
2015 $000
2014 $000
Performance Rights
Opening balance 687 1,405
Rights granted – –
Rights exercised (372) (703)
Rights forfeited (315) (15)
Closing balance – 687

58 DNZ PROPERTY FUND LIMITED | ANNUAL REPORT 2015
NOTES TO THE CONSOLIDATED FINANCIAL STATEMENTS (CONTINUED)
FOR THE YEAR ENDED 31 MARCH 2015
NOTE 22: INTANGIBLE ASSET
The indefinite life intangible asset relates to the amount paid for the acquisition of the management agreement for
Diversified NZ Property Fund Limited. The amount is not amortised but instead is tested for impairment annually or
more frequently if events or changes in circumstances indicate that they might be impaired. It is carried at cost less
accumulated impairment losses.
2015 $000
2014 $000
Indefinite life intangible 3,000 3,000
An impairment test has been carried out and the Board considers that no impairment exists at balance date (2014: $Nil).
31 March 2015
An independent valuation was undertaken by Deloitte Corporate Finance (Deloitte). The valuation assumes that there
is low risk of change to the terms and fee structure over the forecast period, but reflects the risk of termination by
calculating the value of the Management Agreement under three scenarios and then probability-weighting them to arrive
at a single range of value.
The three scenarios are:
• 10 year discounted cash flow value, based on DNZ forecasts;
• 20 year discounted cash flow value, based on extending the forecasts provided by DNZ; and
• a wind-up scenario in the current fiscal year.
The 10 year and 20 year discounted cash flows assume:
• Diversified continues to own two assets: Remarkables Park Town Centre and 50% of Johnsonville Shopping Centre.
Pukekohe Mega Centre is assumed to be sold in the near term;
• additional equity of $30m for development;
• no further equity raising or acquisition of property;
• capital value movements adopt 2% increase pa;
• corporate overhead estimated at 55% of gross revenue; and
• the continuation of the management agreement without variation or material change.
Deloitte used the Brennan Lally variant of the Capital Asset Pricing Model to estimate a cost of equity for the Management
Agreement. They assess the post-tax, nominal cost of equity (and therefore WACC) for the contract period to be
approximately 8.0%.
31 March 2014
Management prepared a valuation using the following key assumptions:
• Diversified continues to own the existing assets for ten years;
• cash flows assume perpetuity as the management agreement has perpetual rights of renewal;
• capital value movements are 2.50% per annum which is consistent with long term growth rates;
• corporate overhead is in the range of 55-60% of gross revenue;
• no capital raisings within the forecast period; and
• all capital works are debt funded.
The discount rate was estimated assuming equity funding, with the cost of equity calculated using the Capital Asset
Pricing Model. The pre-tax discount rate used was 13.95%.
These assumptions have been based on management’s past experience and market analysis of transactions.

59DNZ PROPERTY FUND LIMITED | ANNUAL REPORT 2015
NOTES TO THE CONSOLIDATED FINANCIAL STATEMENTS (CONTINUED)
FOR THE YEAR ENDED 31 MARCH 2015
NOTE 23: INTEREST IN UNINCORPORATED JOINT ARRANGEMENT
An unincorporated joint arrangement is a joint arrangement with another party in which DNZ has several liabilities
in respect of costs and liabilities, and shares in any resulting output.
DNZ has a joint arrangement with Diversified NZ Property Fund Limited relating to the investment property at
Johnsonville Shopping Centre, Wellington. As a result, DNZ accounts for its 50% share of assets, liabilities, revenue
and expenses. DNZ is the manager of the joint arrangement.
2015 $000
2014 $000
Assets
Current assets 23 51
Non-current assets 161 –
184 51
Liabilities
Current liabilities 220 311
Non-current liabilities – –
220 311
Net liabilities (36) (260)
Share of rental income 2,934 2,948
Share of expenses (647) (3,655)
Net share of profit/(loss) 2,287 (707)
In the prior year, an impairment loss of $3,183,277 was recognised in the carrying work in progress value and was included
in the share of expenses (note 10).
NOTE 24: INVESTMENT IN SUBSIDIARY
A subsidiary is an entity controlled by the Parent. The Parent controls an entity when the Parent has power over the
investee, is exposed to, or has rights to, variable returns from its involvement with the entity and has the ability to affect
those returns through its power over the entity. The financial statements of the subsidiary are included in the financial
statements of DNZ from the date that control commences until the date that control ceases. The subsidiary applies the
same accounting policies as DNZ.
The acquisition method of accounting has been used to consolidate the subsidiary of the Parent. All inter-company
transactions and balances between DNZ companies have been eliminated.
Country of incorporation
Parent entity
DNZ Property Fund Limited New Zealand
Subsidiary of DNZ Property Fund Limited
DNZ Holdings Limited New Zealand
The subsidiary is 100% owned and has a 31 March balance date. It is principally involved in the ownership of investment
properties and is also involved in the development of investment property.

60 DNZ PROPERTY FUND LIMITED | ANNUAL REPORT 2015
NOTES TO THE CONSOLIDATED FINANCIAL STATEMENTS (CONTINUED)
FOR THE YEAR ENDED 31 MARCH 2015
NOTE 25: OPERATING LEASE COMMITMENTS
DNZ is committed under eleven (2014: ten) operating leases where DNZ is the lessee. There are seven leases at the
corner of Anglesea and Liverpool Streets, Hamilton, one at 7-9 Fanshawe Street, Auckland, one at 33 Customhouse Quay,
Wellington, one at NorthWest Shopping Centre and one at the Westgate Stage Two land, Auckland.
The commitments below only reflect the amounts payable under current signed lease contracts up until the next rent
review, at which time the terms of the leases will be renegotiated.
2015 $000
2014 $000
Payable
– no later than 1 year 716 716
– later than 1 year and no later than 5 years 1,444 1,940
– later than 5 years 353 573
2,513 3,229
Payments, including prepayments made under operating leases (net of any incentives received from the lessor), are
charged to the statement of comprehensive income on a straight-line basis over the period of the lease.
NOTE 26: CONTINGENT LIABILITIES
DNZ has no contingent liabilities at balance date (2014: $Nil).
NOTE 27: SUBSEQUENT EVENTS
On 21 May 2015, DNZ declared a cash dividend for the period 1 January 2015 to 31 March 2015 of 3.125 cents per share,
to be paid on 19 June 2015 to all shareholders on DNZ’s register at the close of business on 5 June 2015. This dividend
will carry imputation credits of 0.6583 cents per share. This dividend has not been recognised in the financial statements.
On 21 May 2015, DNZ suspended the implementation of the DRP for the dividend for the period 1 January 2015 to
31 March 2015.
There have been no other material events subsequent to balance date.

61DNZ PROPERTY FUND LIMITED | ANNUAL REPORT 2015
Independent Auditor’s Reportto the shareholders of DNZ Property Fund Limited
Report on the Financial StatementsWe have audited the Group financial statements of DNZ Property Fund Limited (“the Company”) on pages 28 to 60, which
comprise the statement of financial position as at 31 March 2015, the statement of comprehensive income, the statement
of changes in equity and the statement of cash flows for the year then ended, and the notes to the financial statements
that include a summary of significant accounting policies and other explanatory information for the Group. The Group
comprises the Company and the entities it controlled at 31 March 2015 or from time to time during the financial year.
Directors’ Responsibility for the Financial StatementsThe Directors are responsible for the preparation and fair presentation of these financial statements in accordance with
New Zealand Equivalents to International Financial Reporting Standards and International Financial Reporting Standards
and for such internal controls as the Directors determine are necessary to enable the preparation of financial statements
that are free from material misstatement, whether due to fraud or error.
Auditors’ ResponsibilityOur responsibility is to express an opinion on these financial statements based on our audit. We conducted our audit
in accordance with International Standards on Auditing (New Zealand) and International Standards on Auditing.
These standards require that we comply with relevant ethical requirements and plan and perform the audit to obtain
reasonable assurance about whether the financial statements are free from material misstatement.
An audit involves performing procedures to obtain audit evidence about the amounts and disclosures in the financial
statements. The procedures selected depend on the auditors’ judgement, including the assessment of the risks of material
misstatement of the financial statements, whether due to fraud or error. In making those risk assessments, the auditors
consider the internal controls relevant to the Company’s preparation and fair presentation of the financial statements
in order to design audit procedures that are appropriate in the circumstances, but not for the purpose of expressing an
opinion on the effectiveness of the Company’s internal control. An audit also includes evaluating the appropriateness of
accounting policies used and the reasonableness of accounting estimates, as well as evaluating the overall presentation
of the financial statements.
We believe that the audit evidence we have obtained is sufficient and appropriate to provide a basis for our audit opinion.
We are independent of the Group. Other than in our capacity as auditors, providers of other assurance services and an IT
outsourcing process assessment we have no relationship with, or interests in, the Group.
OpinionIn our opinion, the financial statements on page 28 to 60 present fairly, in all material respects, the financial position of
the Group as at 31 March 2015, and its financial performance and cash flows for the year then ended in accordance with
New Zealand Equivalents to International Financial Reporting Standards and International Financial Reporting Standards.
Restriction on Use of our ReportThis report is made solely to the Company’s shareholders, as a body, in accordance with the Companies Act 1993. Our
audit work has been undertaken so that we might state those matters which we are required to state to them in an
auditors’ report and for no other purpose. To the fullest extent permitted by law, we do not accept or assume responsibility
to anyone other than the Company and the Company’s shareholders, as a body, for our audit work, for this report or for the
opinions we have formed.
Chartered Accountants Auckland
21 May 2015

The Board of DNZ is committed to undertaking its corporate governance responsibilities in accordance with best practice
governance principles. The Board believes that DNZ’s corporate governance practices generally meet the requirements of
the principles and guidelines set out in the New Zealand Financial Markets Authority’s Corporate Governance Handbook
(the Principles) and the NZX Corporate Governance Best Practice Code (the NZX Code), except where expressly stated
otherwise below.
The Board has adopted a set of policies and charters in relation to corporate governance which can be found in the
Corporate Responsibility section of DNZ’s website www.dnzproperty.com. These include a Code of Ethics, a Board Charter,
a Market Disclosure Policy, a Remuneration & Nomination Committee Charter and an Audit & Risk Committee Charter.
The following report is based on the Principles.
PRINCIPLE 1: ETHICAL STANDARDS
Directors should set high standards of ethical behaviour, and hold management accountable for delivering those standards throughout the organisation.
DNZ has adopted a Code of Ethics that sets out how Directors and employees should conduct themselves to maintain high
ethical standards and to avoid conflict between their private financial activities and their part in the conduct of Company
business. The Code of Ethics includes procedures for reporting and resolving breaches of the Code. The Code of Ethics is
included in the DNZ employee handbook and enforced as part of the general terms and conditions of employment.
At the date of this Annual Report, no instances of unethical behaviour had been identified and reported to the Board.
DNZ has policies to prevent insider trading which are contained in its Securities Trading Policies and Guidelines. These
guidelines require Directors and employees and their associated persons to obtain consent before they trade in DNZ’s
shares. The policy provides for limited trading windows at the time of Company announcements at the end of the financial
year and financial half year. Trading shares while in possession of material information is prohibited at all times. Employees
have a duty of confidentiality in relation to any confidential information in relation to DNZ and are not allowed to disclose
such information to third parties without ensuring that appropriate procedures are in place to ensure that confidentiality
is maintained.
PRINCIPLE 2: BOARD COMPOSITION AND PERFORMANCE
To ensure an effective board, there should be a balance of independence, skills, knowledge, experience and perspectives.
Board Size and CompositionThe Board has a maximum of eight Directors and a minimum of three, of which at least two must be ordinarily resident in
New Zealand. At least one-third of the Directors must be Independent Directors (as defined in the Listing Rules) and meet the
Board Charter criteria set out on page 63. There are currently five Directors appointed, who are all Independent Directors
and meet these criteria. Details of the Directors’ skills and expertise are contained in the profiles on pages 16 and 17.
DiversityDNZ is committed to providing a positive working environment where diversity in all its forms is respected and embraced.
DNZ has implemented a Diversity Policy and the Board has reviewed its diversity achievements against its prior year’s
objectives and the Diversity Policy. The Board considers that DNZ has achieved its objectives under the Diversity Policy
for the period to 31 March 2015 as:
• The CEO reports twice a year to the Board on diversity-related matters;
• DNZ utilises a variety of channels to ensure a range of suitably qualified candidates are identified for available roles
within the Company. These channels include the use of external recruiting agencies as appropriate, internal referrals,
and consideration of internal candidates. All candidates are vetted to ensure they hold appropriate qualifications and
skills. Suitable candidates then undergo a comprehensive interview process, and reference checks are undertaken
before an offer of employment is made. The recruitment procedures ensure that a wide range of potential candidates
are considered at all levels of DNZ’s structure, including at both Board and senior management level; and
62 DNZ PROPERTY FUND LIMITED | ANNUAL REPORT 2015
CORPORATE GOVERNANCE

63DNZ PROPERTY FUND LIMITED | ANNUAL REPORT 2015
CORPORATE GOVERNANCE
• DNZ utilised EY to undertake a market review of the executive team and selected non-executive roles to ensure that
there is pay equity at all levels to minimise inadvertent discrimination that may affect retention and career progression,
which in turn may affect diversity at executive management levels.
As at 31 March 2015, DNZ had one female officer (2014: one) out of six officers (2014: five) and one female director
(2014: none) out of the five (2014: four) currently appointed directors.
Director IndependenceIn addition to the NZX requirements, a non-executive Director is considered to be independent providing he or she:
a) does not hold more than five percent of the Company’s class of listed voting securities;
b) is not employed in an executive capacity by the Company or its subsidiaries;
c) is not a principal or employee of a professional advisor to the Company and/or its entities whose billing exceeds
ten percent of the advisor’s total revenues;
d) is not a significant supplier to or customer of the Company. (A significant supplier is defined as one whose revenues
from the Company exceed ten percent of the supplier’s total revenue; a significant customer is defined as one whose
purchases from the Company exceed ten percent of the customer’s total purchases);
e) has no material contractual relationship with the Company;
f) has no other interest or relationship that could interfere with his or her ability to act in the best interests
of the Company and independently of management; and
g) is determined by the Board to be independent in character and judgement.
The Board has reviewed the status of each of the Directors and confirms that, as at 31 March 2015, all Directors
are independent.
CompositionAs at 31 March 2015, the Board comprised the following:
Timothy Ian Mackenzie Storey Chairman (appointed 1 April 2009)
Edward John Harvey Director (appointed 15 September 2009)
Michael Peter Stiassny Director (appointed 9 April 2010)
David Gregory van Schaardenburg Director (appointed 12 May 2010)
Michelle Patricia Tierney Director (appointed 17 July 2014)
Candidates for appointment as a director are nominated by the Remuneration & Nomination Committee and are voted
on by shareholders.
Board PerformanceThe Board undertakes an annual evaluation of its performance, both as a group and as individual Directors. The outcomes
from the performance review are used to improve Board processes and identify areas for improvement for the following
year.
The NZX Code encourages Directors to take a portion of their remuneration under a performance-based equity security
compensation plan. DNZ does not operate any form of equity compensation scheme for Directors, although Paul Duffy,
as former Chief Executive and former Director, participated in the Company’s long term share incentive plan as described
on page 66.
The Company has produced a detailed Corporate Governance Handbook for the Board and training is provided as and
when required.

64 DNZ PROPERTY FUND LIMITED | ANNUAL REPORT 2015
PRINCIPLE 3: BOARD COMMITTEES
The Board should use committees where this will enhance its effectiveness in key areas, while retaining board responsibility.
The Board has established two board committees: Audit & Risk and Remuneration & Nomination.
Audit & Risk CommitteeJohn Harvey, Chairman (Independent)
Michael Stiassny (Independent)
Tim Storey (Independent)
The Audit & Risk Committee’s Charter requires that the Committee be comprised solely of non-executive Directors, with
at least three members (and the majority of members) being Independent Directors. The Chairperson of the Committee
shall be an Independent Director and may not be the Chairperson of the Board. All Committee members need to be
financially literate, and at least one member must have accounting or related financial management expertise.
Meetings of the Committee are held at least twice a year, having regard to the Company’s reporting and audit cycle,
at the discretion of the Chairperson, or if requested by any Committee member, the Chief Executive or external audit.
The NZX Code proposes that Directors who are not members of the Audit Committee and employees should only attend
Audit Committee meetings at the invitation of the Audit Committee. The Company’s Audit & Risk Committee Charter
provides Directors who are not members of the Committee with the right to attend meetings of the Committee.
The Committee provides assistance to the Directors in fulfilling their responsibility to the shareholders, potential
shareholders, and investment community relating to corporate accounting and reporting practices of the Company,
and the quality and integrity of financial reports of the Company. In so doing, it is the responsibility of the Committee to
maintain free and open communication between the Directors and the external auditors about the financial management
of the Company.
The Board believes that the Audit & Risk Committee has the appropriate level of financial expertise to perform its duties.
Remuneration & Nomination CommitteeMichael Stiassny, Chairman (Independent)
John Harvey (Independent)
Tim Storey (Independent)
David van Schaardenburg (Independent)
Michelle Tierney (Independent)
The Remuneration & Nomination Committee’s Charter requires that the Committee comprise at least three non-
executive Directors of the Board, with at least three members (and the majority of members) being Independent Directors.
The Chairperson of the Committee shall be an Independent Director and may not be the Chairperson of the Board.
Meetings of the Committee are held at least twice a year or at the discretion of the Chairperson, or if requested by any
Committee member or the Chief Executive.
The objectives of the Committee include recommending remuneration packages for Directors to shareholders, ensuring
that the Company has in place a sound remuneration policy framework designed to ensure that the Company’s executive
team is fairly and equitably remunerated, that appropriate and required disclosure is made of Director and executive
remuneration, that there is an environment and framework where management talent and potential is assessed and
developed in line with the requirements of the Company, and to ensure that robust succession planning exists.
The Committee is responsible for reviewing the mix of skills and experience of Directors on the Board and succession
planning to identify candidates to fill Board vacancies as and when they arise.
CORPORATE GOVERNANCE

65DNZ PROPERTY FUND LIMITED | ANNUAL REPORT 2015
Meeting AttendanceBoard
MeetingsAudit & Risk
Committee
Remuneration & Nomination
Committee
Total Number of Meetings Held 12 3 2
John Harvey 12 3 2
Michael Stiassny 12 3 2
Tim Storey 12 3 2
David van Schaardenburg 12 – 2
Michelle Tierney* 8 – 1
* Appointed 17 July 2014.
PRINCIPLE 4: REPORTING AND DISCLOSURE
The Board should demand integrity in financial reporting and in the timeliness and balance of corporate disclosures.
To meet the requirements of the NZX, DNZ has adopted a Market Disclosure Policy to provide guidance in the area
of market disclosure and the release of material information.
DNZ is committed to:
a) Ensuring that shareholders and the market are provided with full and timely information about its activities;
b) Complying with the general and continuous disclosure principles contained in the NZX Main Board Listing Rules
and the Companies Act 1993; and
c) Ensuring that all market participants have equal opportunities to receive externally available information issued
by the Company.
A Disclosure Committee, comprising the Chief Executive, Chief Financial Officer (Disclosure Officer) and Chairman,
is responsible for making decisions about what information is material information and ensuring that appropriate
disclosures are made in a timely manner to the market.
The Audit & Risk Committee is tasked with overseeing the quality and integrity of all financial reporting. The Committee
reviews the annual and half-year financial statements and has direct access, as necessary, to the Company’s external auditors.
As the Board is ultimately responsible for preparing the Annual Report (including financial statements that comply with
generally accepted accounting practice), annual financial statements are signed by two directors after approval by the
whole Board and the auditors provide an opinion that the financial statements present fairly, in all material respects, the
financial position of the Group as at 31 March 2015, and its financial performance and cash flows for the year then ended
in accordance with New Zealand Equivalents to International Financial Reporting Standards and International Financial
Reporting Standards.
PRINCIPLE 5: REMUNERATION
The remuneration of directors and executives should be transparent, fair, and reasonable.
The remuneration paid to Directors and executives is disclosed on pages 71 to 73 of this Annual Report and in the notes
to the financial statements on pages 34, 56 and 57. The Remuneration & Nomination Committee is responsible for, among
other things, recommending Director remuneration packages to shareholders and setting executives’ remuneration
packages. The Remuneration & Nomination Committee is required, under the Remuneration & Nomination Committee
Charter, to obtain such information and advice as it thinks necessary.
CORPORATE GOVERNANCE

66 DNZ PROPERTY FUND LIMITED | ANNUAL REPORT 2015
Employee Incentive Schemes
Short Term Incentive Scheme
The Company operates a short term incentive scheme under which all permanent, full-time employees, including the
Chief Executive, can become eligible to receive a cash incentive on an annual basis in addition to their base salary. The
maximum amount of the incentive is set prior to the start of the financial year and entitlement to the incentive is subject
to pre-agreed hurdles, as determined by the Remuneration & Nomination Committee, being met. Details of the total
amount that has been paid under the short term incentive scheme can be found on page 72 of this Annual Report.
Long Term Share Incentive Plan
DNZ operates a long term share incentive plan for the executive team. This plan is intended to align the interests of key
employees with the interests of shareholders and provide a continuing incentive to key employees over the long term.
The Remuneration & Nomination Committee has taken advice from executive remuneration consultants as to the form of
the long term share incentive plan. Further details of the long term incentive plan can be found on page 73 of this Annual
Report and in the notes to the financial statements on page 57. Three schemes have been implemented under the plan.
Further share performance rights under the long term share incentive plan may be issued on an annual basis. However,
the terms of the plan, eligible participants, and offers of further share performance rights may be modified by the Board
from time to time, subject to the requirements of the NZX Main Board Listing Rules and applicable laws.
PRINCIPLE 6: RISK MANAGEMENT
Directors should have a sound understanding of the key risks faced by the business. The Board should regularly verify that the entity has appropriate processes that identify and manage potential and relevant risks.
DNZ has in place business risk management processes and policies to minimise its exposure to financial and operational
risk. Internal systems have been designed to:
• Identify material risks.
• Assess the impact of specific risks.
• Identify strategies to mitigate risk.
• Monitor and report progress on risk mitigation strategies.
The Board has established an Audit & Risk Committee which, under its Charter, is responsible for:
• Ensuring that management has established a risk management framework which includes policies and procedures
to effectively identify, treat, monitor and report key business risks.
• Reviewing the procedures for identifying business risks and controlling their financial impact on the Company.
• Reviewing management’s and the external auditor’s reports on the effectiveness of systems for internal control, financial
reporting and risk management.
• Ensuring that the Board receives regular risk management compliance certificates and reviews reports on the principal
business risks at least annually.
• Reviewing key insurance policy terms and cover adequacy and making recommendations to the Board for adoption of
the insurance cover.
Further risk management matters are contained under the heading “Investment Policy & Strategy” in the “About Us”
section of DNZ’s website www.dnzproperty.com.
CORPORATE GOVERNANCE

67DNZ PROPERTY FUND LIMITED | ANNUAL REPORT 2015
PRINCIPLE 7: AUDITORS
The Board should ensure the quality and independence of the external audit process.
The Audit & Risk Committee is responsible for the monitoring of the external audit process. It has responsibilities under
its Charter to:
• Meet with the external auditors and financial management of the Company to review the scope of work of the proposed
audit and half year review for the current year and the procedures to be utilised, the adequacy of the external auditor’s
compensation and, at the conclusion thereof, review such audit or review, including any comments or recommendations
of the external auditors.
• Review reports received from regulators and other legal and regulatory bodies, including matters that may have
a material effect on the financial statements or related company compliance policies.
• Review the internal audit function of the Company, including the independence and authority of its reporting obligations,
the proposed audit plans for the coming year and the coordination of such plans with the external auditors.
• Receive on a regular basis a summary of findings from any completed internal audits and a progress report on the
internal audit plan (if any), with explanations for any deviations from the original plan.
• Report the results of the annual audit to the Board, including whether the financial statements comply with applicable
laws and regulations. If requested by the Board, invite the external auditors to attend the full Board meeting to assist
in reporting the results of the annual audit or to answer other Directors’ questions (alternatively, the other Directors,
particularly the other Independent Directors, may be invited to attend the Committee meeting during which the results
of the annual audit are reviewed).
• Review the nature and scope of other professional services provided to the Company by the external auditors and
consider the relationship to the auditor’s independence.
• On an annual basis, assess and confirm to the Board the independence of the external auditor.
• Make recommendations to the Board as to the appointment or discharge of external auditors.
• Establish the external auditor’s fees, subject to shareholder approval.
• On a quarterly basis, review and monitor the ratio of non-audit to audit fees.
• Ensure that the external auditor or lead audit partner is changed at least every five years.
The Audit & Risk Committee meets at least once a year with the external auditors, without any members of management
present. The Board invites the auditor to attend Board Meetings or Committee Meetings as required. Directors are free
to make direct contact with the auditor as necessary to obtain independent advice and information.
PRINCIPLE 8: SHAREHOLDER RELATIONS
The Board should foster constructive relationships with shareholders that encourage them to engage with the entity.
DNZ believes a high level of disclosure and communication to shareholders is very important. Shareholders deserve to be
provided with all the information possible about the performance of their investment and to be informed of any significant
transactions by the Company.
Further information regarding shareholder relations, including reporting to shareholders, the Annual Meeting and investor
services, can be found in the Investor Relations section on pages 69 and 70.
CORPORATE GOVERNANCE

68 DNZ PROPERTY FUND LIMITED | ANNUAL REPORT 2015
PRINCIPLE 9: STAKEHOLDER INTERESTS
The Board should respect the interests of stakeholders, taking into account the entity’s ownership type and its fundamental purpose.
DNZ recognises that there are a number of significant stakeholders in DNZ that are affected by the Company’s activities.
DNZ aims to manage its business to produce positive outcomes for all stakeholders, including tenants, contractors, service
providers, banks, employees and the communities in which our properties reside.
DNZ supports addressing issues related to ESG - Environmental Sustainability, Social Responsibility and Corporate
Governance. As part of this process, DNZ is a signatory to the United Nations Principles for Responsible Investment.
For further details visit www.unpri.org.
DNZ is committed to being a responsible member of the corporate community in providing a positive work environment
for our staff and supporting targeted community partnerships. Our children are the future of New Zealand. As a New
Zealand company, we endeavour through targeted community partnerships to help less fortunate young people to build
a positive future and maximise their development potential. DNZ is a sponsor of:
• Foundation for Youth Development (FYD) whose aim is to inspire all school age New Zealand children to reach their
full potential through programmes that help build self-esteem, promote good values, and which teach valuable life,
education and health skills. FYD’s programmes include Kiwi Can (years 1-8), Stars (years 9 and 12 & 13), Project K
(year 10), Career Navigator (years 10-13) and MYND.
• Keystone Property Education Trust provides grants to students who would not normally be able to afford tertiary
education, with specific emphasis on education in the property profession. DNZ sees the involvement in Keystone
Property Education Trust as a valuable contribution to educating quality property professionals for the future.
CORPORATE GOVERNANCE

DNZ believes a high level of disclosure and communication to shareholders is very important. Shareholders deserve
to be provided with all the information possible about the performance of their investment and to be informed on
any significant transactions by the Company.
REPORTING TO SHAREHOLDERS
Reporting to shareholders is provided through the Annual and Interim Reports. Events of interest within DNZ’s
portfolio that occur between regular reporting periods are communicated on-line, via market announcements to the
NZX (www.nzx.com, stock code DNZ) and on DNZ’s website (www.dnzproperty.com), meeting the need for the market
to be informed in a timely manner.
The Annual and Interim Reports are available electronically on the Company’s website and shareholders can request
hard copies by contacting the Company’s Share Registrar (contact details below).
ANNUAL MEETING
Shareholders are encouraged to attend the Annual Meeting and take the opportunity to meet the Board of DNZ and to
ask questions about the performance of the Company. The Chair provides time for questions from the floor and these
are answered by the appropriate member of the Board or executive team. The Company’s external auditor attends the
meeting and is available to take questions on the preparation of the financial statements and the auditor’s report.
The next Annual Meeting is scheduled for 11am on Wednesday, 22 July 2015, at The Remuera Room, Ellerslie Racecourse,
80-100 Ascot Ave, Greenlane, Auckland.
SHARE REGISTRAR
The Share Registrar is the first point of contact for shareholders with queries about their investments. Computershare
Investor Services Limited is the Share Registrar for DNZ and has responsibility for administering and maintaining the share
register. Computershare can be contacted as detailed below:
Phone: +64 9 488 8777
Fax: +64 9 488 8787
Email: [email protected]
Mail: Computershare Investor Services Limited, Private Bag 92119, Victoria St West, Auckland 1142.
Shareholders can view their holding details and update their personal details online on Computershare’s Investor
Centre website – visit www.computershare.co.nz/investorcentre – you will need your Investor Number and FIN to access
this service.
SUBSTANTIAL SECURITY HOLDERS
As at 31 March 2015, the names of all persons who are substantial product holders in DNZ for the purposes of the Financial
Markets Conduct Act 2013 are as follows:
ShareholderNumber of
Ordinary Shares
Accident Compensation Corporation 23,686,834AMP Capital Investors (NZ) Limited (held by BNP Paribas Nominees (NZ) Limited on behalf of AMP Capital Investors (NZ) Limited)
14,907,409
The number of ordinary shares listed above are as per DNZ’s share register or the last substantial security holder notice
filed. As this notice is required to be filed only if the total holding of a shareholder changes by 1% or more since the last
notice filed, the number noted in this table may differ from that shown in the list of 20 largest holdings of quoted equity
securities on page 70.
The total number of ordinary shares of DNZ as at 31 March 2015 was 297,227,683.
69DNZ PROPERTY FUND LIMITED | ANNUAL REPORT 2015
INVESTOR RELATIONS

70 DNZ PROPERTY FUND LIMITED | ANNUAL REPORT 2015
INVESTOR RELATIONS
SHAREHOLDER DISTRIBUTION AS AT 31 MARCH 2015*
Rank Holder NameNumber of
Shares% of Total
Issued Shares
1. Accident Compensation Corporation – NZCSD 23,686,834 7.97
2. BNP Paribas Nominees (NZ) Limited – NZCSD 18,090,203 6.09
3. ANZ Wholesale Trans-Tasman Property Securities Fund – NZCSD 13,977,153 4.70
4. Forsyth Barr Custodians Limited 10,351,874 3.48
5. Custodial Services Limited 9,844,091 3.31
6. Guardian Nominees No 2 Limited – WPAC Wholesale Property Trust – NZCSD 7,844,217 2.64
7. ANZ Wholesale Property Securities – NZCSD 7,799,718 2.62
8. Citibank Nominees (New Zealand) Limited – NZCSD 7,507,250 2.53
9. MFL Mutual Fund Limited – NZCSD 7,383,461 2.48
10. Forsyth Barr Custodians Limited 6,005,314 2.02
11. TEA Custodians Limited Client Property Trust Account – NZCSD 5,565,200 1.87
12. National Nominees New Zealand Limited – NZCSD 4,429,833 1.49
13. Custodial Services Limited 4,300,794 1.45
14. Investment Custodial Services Limited 4,078,474 1.37
15. FNZ Custodians Limited 3,548,347 1.19
16. HSBC Nominees (New Zealand) Limited – NZCSD 3,405,606 1.15
17. Custodial Services Limited 2,742,386 0.92
18. NZPT Custodians (Grosvenor) Limited 2,729,500 0.92
19. Superlife Trustee Nominees Limited 2,669,318 0.90
20. Forsyth Barr Custodians Limited 2,557,061 0.86
Shares held by 20 largest shareholders 148,516,634 49.97
Balance of shares held 148,711,049 50.03
Total Issued Shares 297,227,683 100.00
SHAREHOLDER DISTRIBUTION AS AT 31 MARCH 2015*
Shareholder RangeNumber of
Shareholders Number of Shares% of Total
Issued Shares
1 to 499 37 7,134 0.00
500 to 999 37 25,570 0.01
1,000 to 1,999 154 248,489 0.08
2,000 to 4,999 700 2,406,643 0.81
5,000 to 9,999 1,536 10,703,588 3.60
10,000 to 49,999 2,816 60,148,632 20.24
50,000 to 99,999 354 23,741,291 7.99
100,000 to 499,999 178 30,384,009 10.22
500,000 to 999,999 6 3,820,293 1.29
1,000,000 and above 16 165,742,034 55.76
Total 5,834 297,227,683 100.00
* Shares held by New Zealand Central Securities Depository Limited (NZCSD) are grouped under a single legal holding
as reflected in the Shareholder Distribution table. The 20 Largest Holdings of Quoted Equity Securities table shows the
beneficial holder of the shares in the NZCSD register – the above may not sum due to rounding.

ENTRIES RECORDED IN THE INTERESTS REGISTER
The following interest register entries were recorded for the Company for the year ended 31 March 2015.
Directors’ Interests in Transactions
Specific disclosures
There were no specific disclosures made during the year of any interests in transactions entered into by DNZ or
its subsidiary.
General disclosures
Edward John Harvey No additional interest register entries recorded
Michael Peter Stiassny Queenstown Airport Corporation Limited Director
Timothy Ian Mackenzie Storey JustKapital Partners Limited Director
David Gregory van Schaardenburg No additional interest register entries recorded
Michelle Patricia Tierney No additional interest register entries recorded
Share Dealings by DirectorsNo share dealings by Directors were recorded during the year ended 31 March 2015.
Securities of the Company in which each Director had a relevant interest as at 31 March 2015
DirectorOrdinary
Shares
Timothy Ian Mackenzie Storey 121,792
Edward John Harvey 121,792
Michael Peter Stiassny 121,792
David Gregory van Schaardenburg 75,165
LOANS TO DIRECTORS
There are no loans to Directors.
USE OF COMPANY INFORMATION
No Director has requested, pursuant to section 145(3) of the Companies Act 1993, to use information received in their
capacity as a Director that would not otherwise have been available to them.
NZX WAIVERS
No waivers from the NZX Main Board Listing Rules were granted to the Company or relied on by the Company during
the 12 months preceding 31 March 2015.
DIRECTORS’ REMUNERATION
The non-executive Directors of the Company received fees as set out below.
Director
Directors Fees 2015
$
Directors Fees 2014
$
Tim Storey 130,000 130,000
John Harvey 75,000 75,000
Michael Stiassny 75,000 75,000
David van Schaardenburg 75,000 75,000
Michelle Tierney* 53,125 –
408,125 355,000
* Appointed 17 July 2014.
71DNZ PROPERTY FUND LIMITED | ANNUAL REPORT 2015
STATUTORY INFORMATION

72 DNZ PROPERTY FUND LIMITED | ANNUAL REPORT 2015
STATUTORY INFORMATION
DONATIONS AND SPONSORSHIPS
The Company and its subsidiary made no donations in the year ending 31 March 2015.
DNZ is a sponsor of the Foundation for Youth Development (FYD) and the Keystone Property Education Trust. Further
information can be found on page 68 of the Annual Report. During the year, DNZ paid $40,000 to FYD and $10,000 to
Keystone Property Education Trust by way of sponsorship.
REMUNERATION OF EMPLOYEES
The overall remuneration structure is designed to deliver rewards that are competitive in the labour markets in which
DNZ competes for staff. Full time employees receive a base salary and take part in the short term incentive scheme
(including the Chief Executive). Members of the executive team also participate in the long term share incentive plan.
Salaries are reviewed annually with effect from 1 April.
The number of employees or former employees of the Company who received remuneration and other benefits in their
capacity as employees, the value of which was in excess of $100,000 and was paid or accrued to those employees in
relation to the financial year ended 31 March 2015, are listed below.
Remuneration includes salary and benefits paid, incentive payments accrued for the year ended 31 March 2015 and the
value of shares rights issued to members of the executive team.
Remuneration rangeNumber of employees
$110,000 - $119,999 2
$120,000 - $129,999 2
$140,000 - $149,999 2
$180,000 - $189,999 1
$250,000 - $259,999 1
$260,000 - $269,999 3
$280,000 - $289,999 1
$420,000 - $429,999 2
$1,060,000 - $1,069,999 1
Total number of employees 15
Key Management Personnel Costs2015
$0002014
$000
Salary and other short term benefits 2,136 2,851
Rights issued under employee long term share incentive schemes 18 154
2,154 3,005
Key management personnel includes the Chief Executive (Peter Alexander) and the members of the executive team. In
the current year, $442,000 of salary and other short term benefits for executive team members has been capitalised to
NorthWest Shopping Centre, Auckland, development. The prior year also included the former Chief Executive (Paul Duffy).
CHIEF EXECUTIVE
The Chief Executive receives a base salary of $600,000 per annum and, for the year ending 31 March 2015, is eligible
for bonuses as if awarded under the short term incentive scheme and executive team long term incentive plan. The
remuneration and other benefits received or accrued for the Chief Executive for the year ended 31 March 2015 are
included in the above remuneration range table.
SHORT TERM INCENTIVE SCHEME
DNZ operates a short term incentive scheme under which employees can become eligible to receive a cash incentive
on an annual basis in addition to base salary. For the year ended 31 March 2015, the total amount earned under the short
term incentive scheme was $560,579 which was paid on 29 April 2015.

73DNZ PROPERTY FUND LIMITED | ANNUAL REPORT 2015
LONG TERM SHARE INCENTIVE PLAN
DNZ operates a long term share incentive plan for the executive team. This plan is intended to align the interests of key
employees with the interests of shareholders and provide a continuing incentive to key employees over the long term.
Three schemes have been implemented under the plan. All shares have now been issued under schemes one and two and
there are no available tranches left under these schemes. Under scheme three, all shares have been issued for tranche
one, however no shares have been issued with regard to tranches two and three as the hurdles were not achieved as at
31 March 2015. The share performance rights, with regard to tranches two and three, have now lapsed and the scheme
is at an end.
The Chief Executive was eligible for a bonus of $240,000 as if awarded under the long term share incentive plan.
This amount was paid on 29 April 2015.
Further share performance rights under the long term share incentive plan may be issued on an annual basis. However,
the terms of the plan, eligible participants, and offers of further share performance rights may be modified by the Board
from time to time, subject to the requirements of the NZX Main Board Listing Rules and applicable laws.
Long Term Share Performance Rights 2015 2014
Opening balance 687,478 1,404,957
Rights granted – –
Rights exercised (371,566) (702,479)
Rights forfeited (315,912) (15,000)
Closing balance – 687,478
AUDITORS’ FEES
The amount payable by DNZ to PricewaterhouseCoopers as audit fees in respect of the financial year ended 31 March
2015 was $142,750. DNZ also paid PricewaterhouseCoopers $5,250 in relation to an IT outsourcing process assessment.
Given the low level of fees and that the work did not impact the financial statements or the audit, the Board does not
believe this work compromised auditor independence.
FULLY OWNED SUBSIDIARY – DNZ HOLDINGS LIMITED
The Directors of DNZ Holdings Limited, as at 31 March 2015, were:
Timothy Ian Mackenzie Storey
Edward John Harvey
Michael Peter Stiassny
David Gregory van Schaardenburg
Michelle Patricia Tierney
Tim Storey was appointed on 8 April 2009 and has held office since that time. John Harvey, Michael Stiassny and David
van Schaardenburg were appointed on 17 October 2013. Michelle Tierney was appointed on 17 July 2014. No additional
fees were paid to the Directors in respect of this role. The entries in the interest register for the year ending 31 March 2015
in respect of the Company are also disclosed for DNZ Holdings Limited.
DIRECTORS’ STATEMENT
This Annual Report is dated 21 May 2015 and is signed for and on behalf of the Board by:
TIM STOREY Chairman
JOHN HARVEY Director
STATUTORY INFORMATION
BOARD OF DIRECTORS
• Tim Storey
• John Harvey
• Michael Stiassny
• David van Schaardenburg
• Michelle Tierney
REGISTERED OFFICE
DNZ Property Fund Limited
Level 2, 80 Greys Avenue
AUCKLAND 1010
PO Box 6320
Wellesley Street
AUCKLAND 1141
Telephone: +64 9 912 2690
Telephone: 0800 436 977
Facsimile: +64 9 912 2693
Email: [email protected]
www.dnzproperty.com
SHARE REGISTRAR
Computershare Investor Services Limited
Level 2
159 Hurstmere Road
Takapuna
Private Bag 92119
Victoria Street West
AUCKLAND 1142
Telephone: +64 9 488 8777
Facsimile: +64 9 488 8787
Email: [email protected]
SOLICITORS
Bell Gully
Level 21, Vero Centre
48 Shortland Street
PO Box 4199
AUCKLAND 1140
Level 21
171 Featherston Street
PO Box 1291
WELLINGTON 6140
AUDITORS
PricewaterhouseCoopers
PricewaterhouseCoopers Tower
188 Quay Street
Private Bag 92162
AUCKLAND 1142
BANKERS
ANZ Bank New Zealand Limited
Bank of New Zealand
Commonwealth Bank of Australia
Westpac New Zealand Limited
74 DNZ PROPERTY FUND LIMITED | ANNUAL REPORT 2015
CORPORATE DIRECTORY

75DNZ PROPERTY FUND LIMITED | ANNUAL REPORT 2015

DNZ Property Fund Limited
Level 2 80 Greys Avenue Auckland 1010 PO Box 6320 Wellesley Street Auckland 1141 New Zealand