Embed Size (px)
Citation preview
© 2008 Rexer Analytics Proprietary & Confidential
September, 2008
Rexer Analytics 2008
Data Miner Survey
© 2008 Rexer Analytics Proprietary & Confidential 1
Overview
Executive Summary
Methodology
Primary Findings
Appendix: Additional Findings
© 2008 Rexer Analytics Proprietary & Confidential
Executive Summary
© 2008 Rexer Analytics Proprietary & Confidential 3
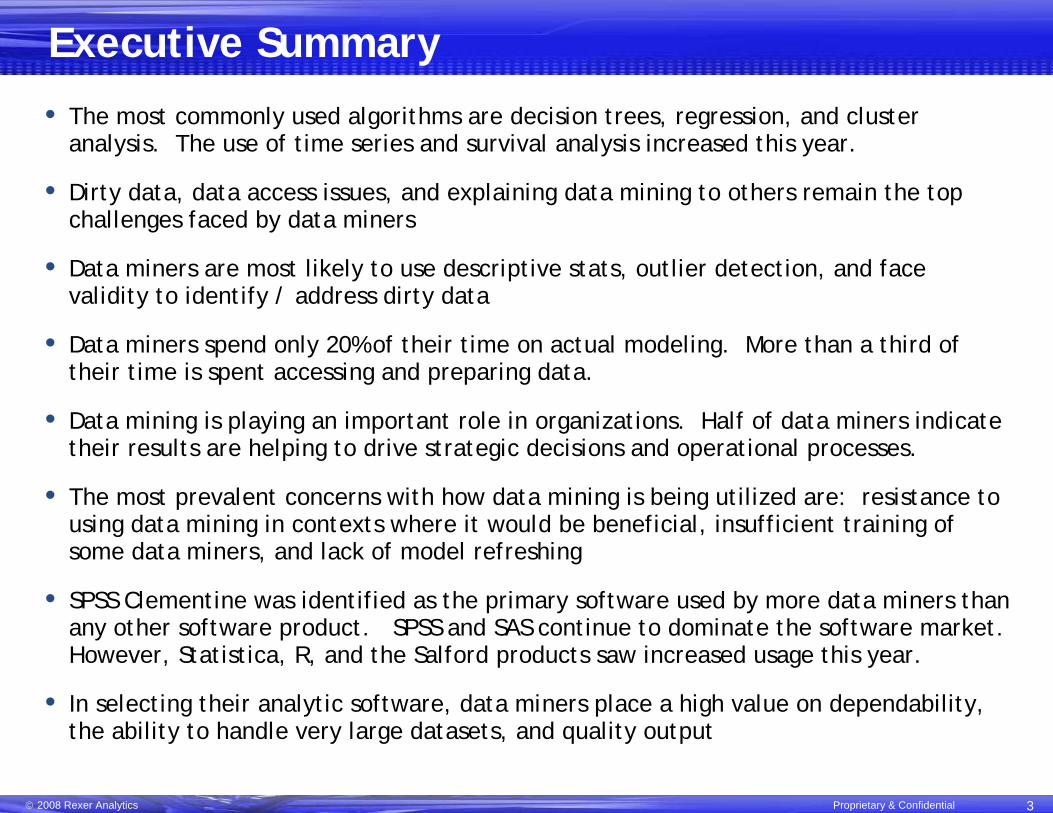
Executive Summary
• The most commonly used algorithms are decision trees, regression, and cluster analysis. The use of time series and survival analysis increased this year.
• Dirty data, data access issues, and explaining data mining to others remain the top challenges faced by data miners
• Data miners are most likely to use descriptive stats, outlier detection, and face validity to identify / address dirty data
• Data miners spend only 20% of their time on actual modeling. More than a third of their time is spent accessing and preparing data.
• Data mining is playing an important role in organizations. Half of data miners indicate their results are helping to drive strategic decisions and operational processes.
• The most prevalent concerns with how data mining is being utilized are: resistance to using data mining in contexts where it would be beneficial, insufficient training of some data miners, and lack of model refreshing
• SPSS Clementine was identified as the primary software used by more data miners than any other software product. SPSS and SAS continue to dominate the software market. However, Statistica, R, and the Salford products saw increased usage this year.
• In selecting their analytic software, data miners place a high value on dependability, the ability to handle very large datasets, and quality output
© 2008 Rexer Analytics Proprietary & Confidential
Methodology
© 2008 Rexer Analytics Proprietary & Confidential 5
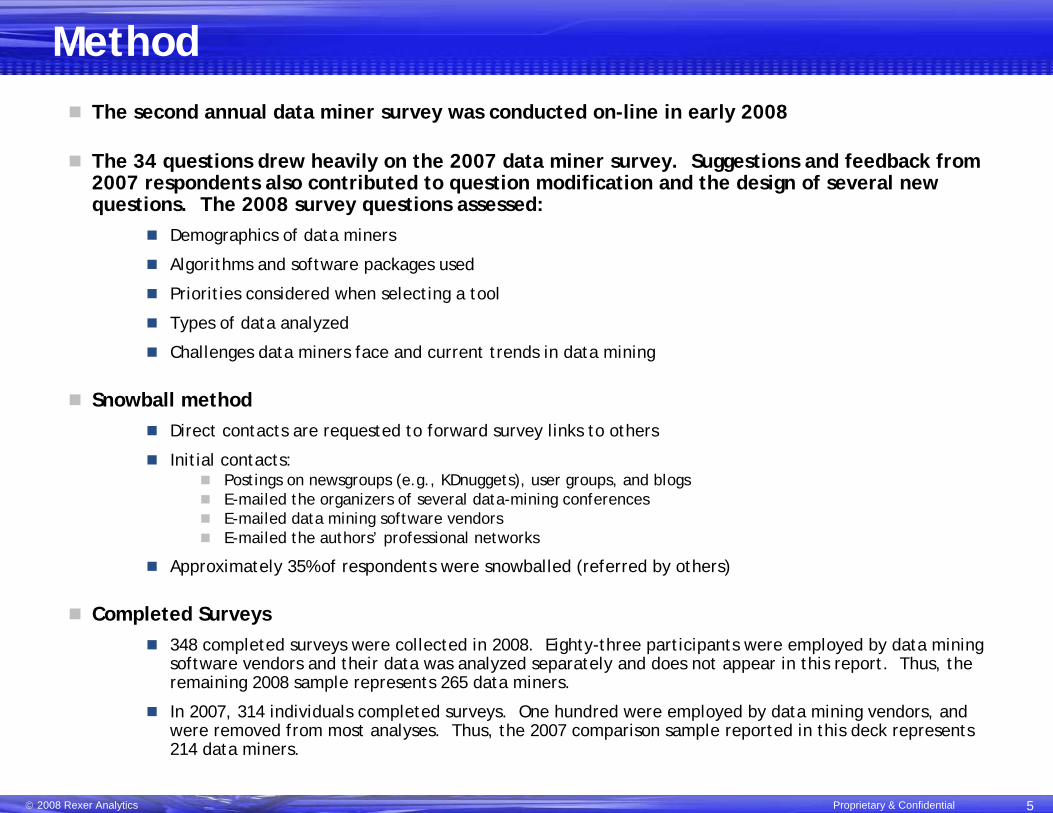
MethodThe second annual data miner survey was conducted on-line in early 2008
The 34 questions drew heavily on the 2007 data miner survey. Suggestions and feedback from 2007 respondents also contributed to question modification and the design of several new questions. The 2008 survey questions assessed:
Demographics of data miners
Algorithms and software packages used
Priorities considered when selecting a tool
Types of data analyzed
Challenges data miners face and current trends in data mining
Snowball methodDirect contacts are requested to forward survey links to others
Initial contacts: Postings on newsgroups (e.g., KDnuggets), user groups, and blogsE-mailed the organizers of several data-mining conferencesE-mailed data mining software vendorsE-mailed the authors’ professional networks
Approximately 35% of respondents were snowballed (referred by others)
Completed Surveys348 completed surveys were collected in 2008. Eighty-three participants were employed by data mining software vendors and their data was analyzed separately and does not appear in this report. Thus, the remaining 2008 sample represents 265 data miners.
In 2007, 314 individuals completed surveys. One hundred were employed by data mining vendors, and were removed from most analyses. Thus, the 2007 comparison sample reported in this deck represents 214 data miners.
© 2008 Rexer Analytics Proprietary & Confidential
Primary Findings
© 2008 Rexer Analytics Proprietary & Confidential 7
6%
6%
9%
9%
10%
13%
13%
16%
17%
18%
18%
29%
36%
51%51%
36%
30%
17%
16%
15%
6%
13%
11%
10%
10%
8%
11%
3%
3% 3%
3%
-100% -80% -60% -40% -20% 0% 20% 40% 60% 80% 100%
Hospitality/entertainment/sports
Military/Security
Other
Non-Profit
Pharmaceutical
Government
Medical
Technology
Internet-based
Manufacturing
Insurance
Retail
Telecommunications
Academic
Financial
CRM/Marketing
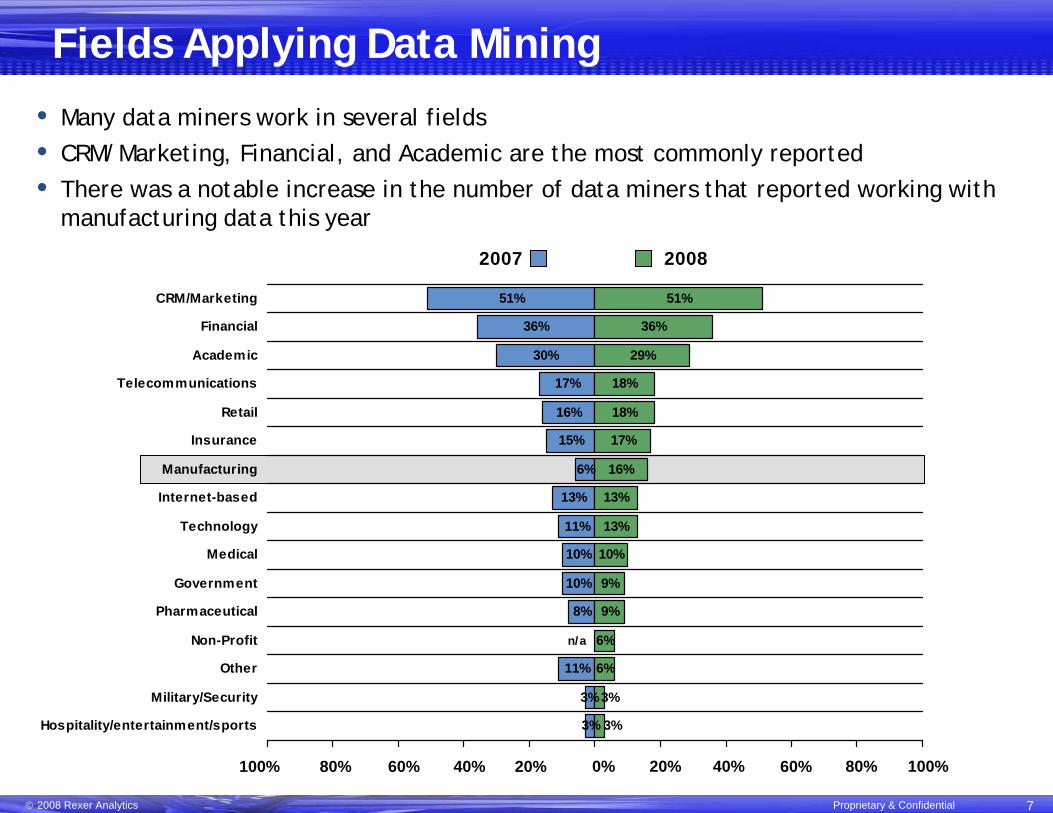
Fields Applying Data Mining
20082007
n/a
• Many data miners work in several fields• CRM/Marketing, Financial, and Academic are the most commonly reported• There was a notable increase in the number of data miners that reported working with
manufacturing data this year
20%40%60%80%100% 0% 20% 40% 60% 80% 100%
© 2008 Rexer Analytics Proprietary & Confidential 8
20082007
6%
12%
13%
14%
15%
17%
23%
24%
25%
30%
36%
39%
42%
46%
75%
79%
80%
11%
10%
9%
18%
18%
16%
23%
20%
77%
79%
72%
31%
42%
36%
36%
4%
-100% -80% -60% -40% -20% 0% 20% 40% 60% 80% 100%
GM D H
Other
P ro prietary
Genetic algo rithms
Link analysis
R ule induct io n
B undling(bo o st ing/ bagging/ etc)
Survival analysis
B ayesian
Suppo rt vecto r machines (SVM )
T ext M ining
F acto r analysis
A sso ciat io n rules
N eural nets
T ime-series
C luster analysis
D ecisio n trees
R egressio n
20%40%60%80%100% 0% 20% 40% 60% 80% 100%
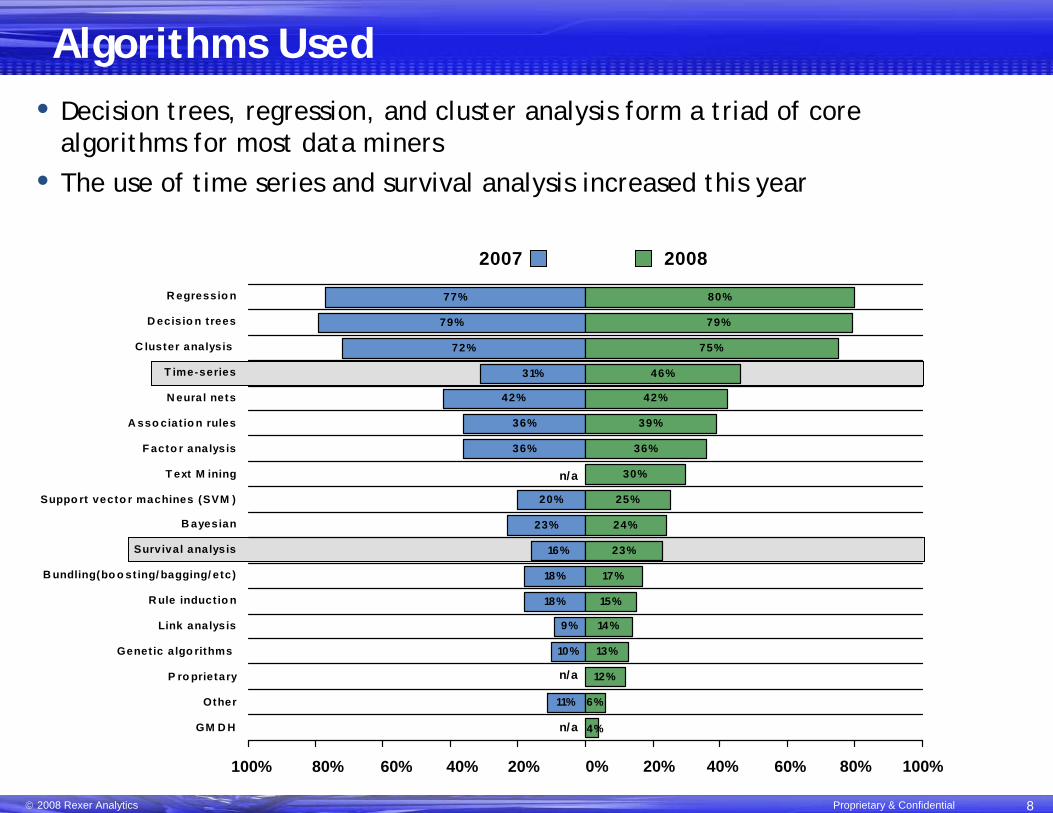
Algorithms Used• Decision trees, regression, and cluster analysis form a triad of core
algorithms for most data miners• The use of time series and survival analysis increased this year
n/a
n/a
n/a
© 2008 Rexer Analytics Proprietary & Confidential 9
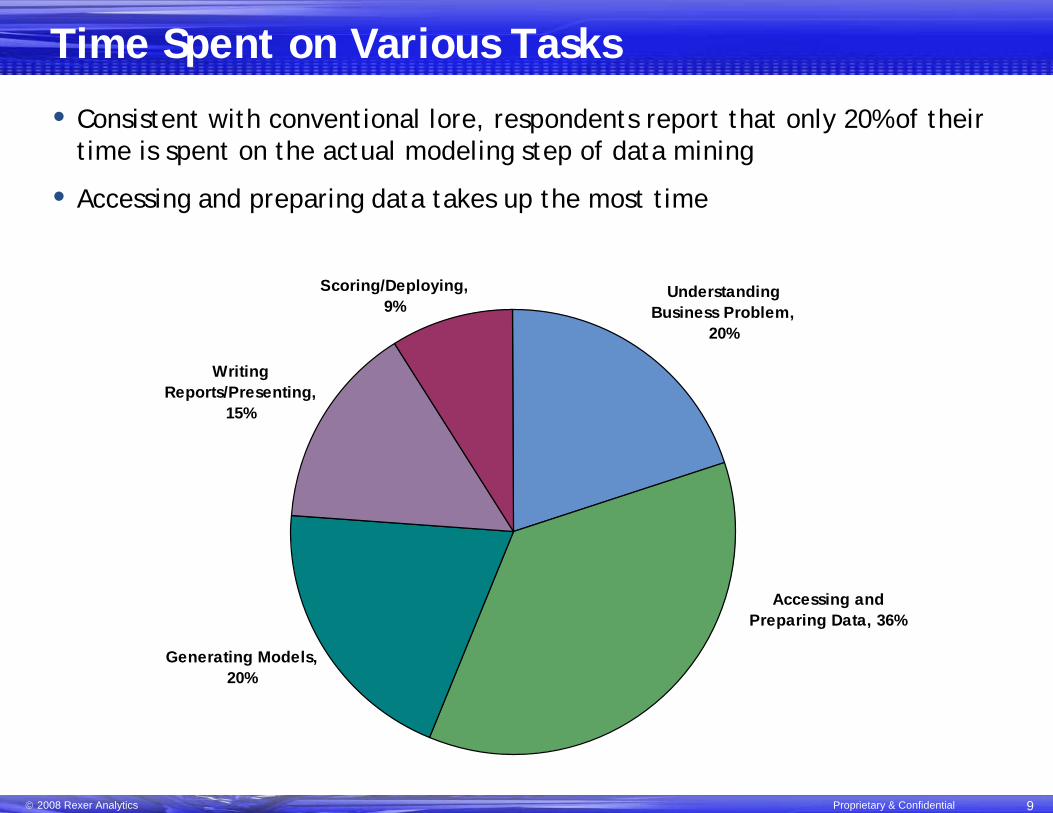
Time Spent on Various Tasks
Understanding Business Problem,
20%
Scoring/Deploying, 9%
Writing Reports/Presenting,
15%
Generating Models, 20%
Accessing and Preparing Data, 36%
• Consistent with conventional lore, respondents report that only 20% of their time is spent on the actual modeling step of data mining
• Accessing and preparing data takes up the most time
© 2008 Rexer Analytics Proprietary & Confidential 10
1%
18%
22%
26%
40%
43%
51%
51%
0% 10% 20% 30% 40% 50% 60% 70% 80% 90% 100%
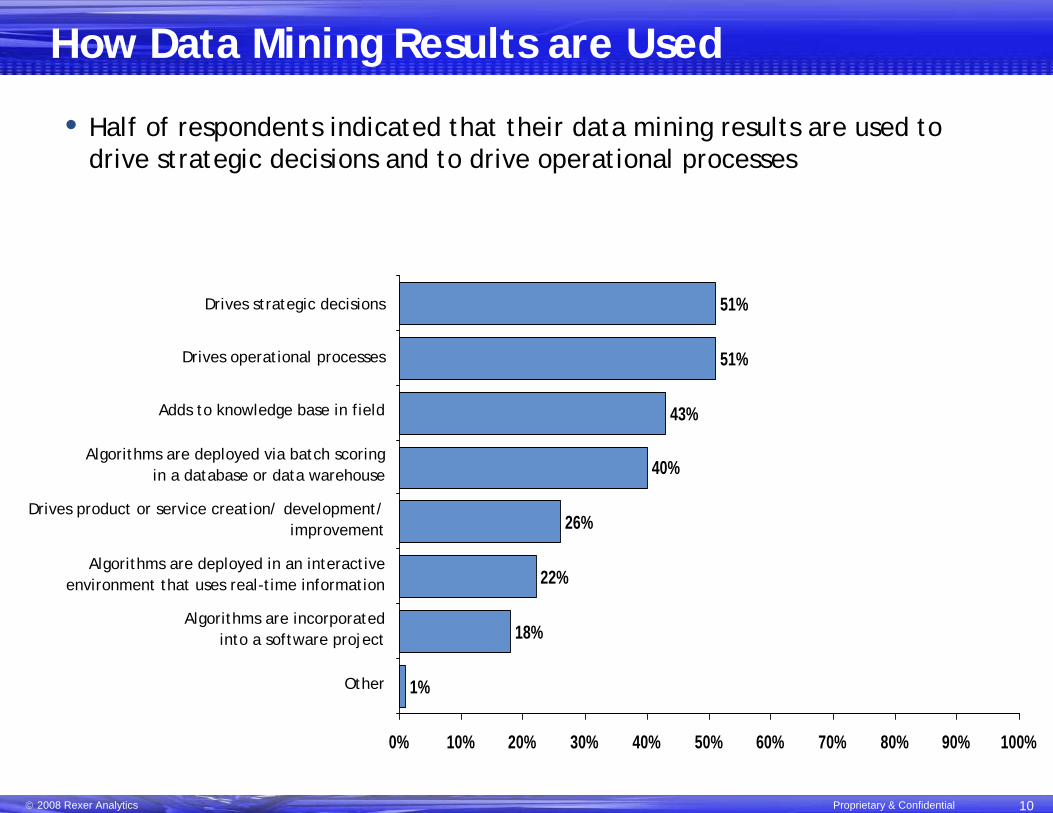
How Data Mining Results are Used
• Half of respondents indicated that their data mining results are used to drive strategic decisions and to drive operational processes
Drives strategic decisions
Drives operational processes
Adds to knowledge base in field
Algorithms are deployed via batch scoring in a database or data warehouse
Drives product or service creation/ development/ improvement
Algorithms are deployed in an interactive environment that uses real-time information
Algorithms are incorporated into a software project
Other
© 2008 Rexer Analytics Proprietary & Confidential 11
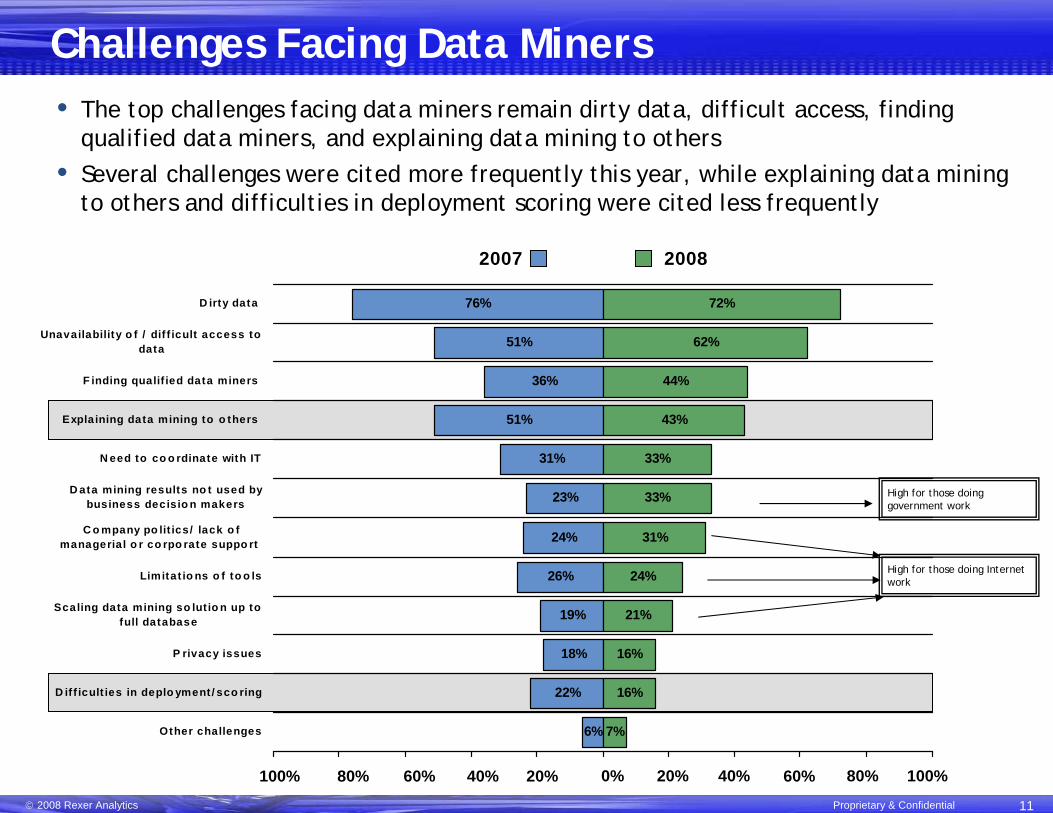
7%
16%
16%
21%
24%
31%
33%
33%
43%
44%
62%
72%
6%
22%
18%
19%
26%
24%
23%
31%
51%
36%
51%
76%
-100% -80% -60% -40% -20% 0% 20% 40% 60% 80% 100%
Other challenges
D if f icult ies in deplo yment/ sco ring
P rivacy issues
Scaling data mining so lutio n up tofull database
Limitat io ns o f to o ls
C o mpany po lit ics/ lack o fmanagerial o r co rpo rate suppo rt
D ata mining results no t used bybusiness decisio n makers
N eed to co o rdinate with IT
Expla ining data mining to o thers
F inding qualif ied data miners
Unavailability o f / dif f icult access todata
D irty data
20082007
20%40%60%80%100% 0% 20% 40% 60% 80% 100%
Challenges Facing Data Miners• The top challenges facing data miners remain dirty data, difficult access, finding
qualified data miners, and explaining data mining to others• Several challenges were cited more frequently this year, while explaining data mining
to others and difficulties in deployment scoring were cited less frequently
High for those doing government work
High for those doing Internet work
© 2008 Rexer Analytics Proprietary & Confidential 12
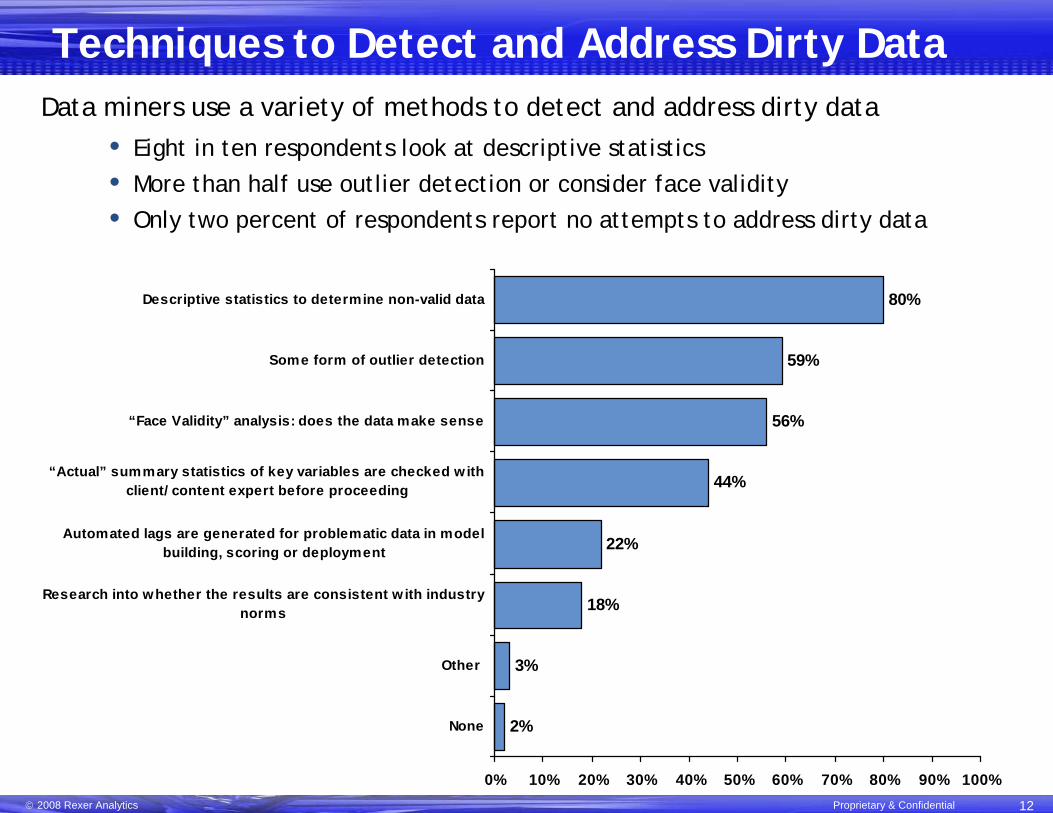
2%
3%
18%
22%
44%
56%
59%
80%
0% 10% 20% 30% 40% 50% 60% 70% 80% 90% 100%
None
Other
Research into whether the results are consistent w ith industrynorms
Automated lags are generated for problematic data in modelbuilding, scoring or deployment
“Actual” summary statistics of key variables are checked w ithclient/ content expert before proceeding
“Face Validity” analysis: does the data make sense
Some form of outlier detection
Descriptive statistics to determine non-valid data
Techniques to Detect and Address Dirty Data
• Eight in ten respondents look at descriptive statistics• More than half use outlier detection or consider face validity• Only two percent of respondents report no attempts to address dirty data
Data miners use a variety of methods to detect and address dirty data
© 2008 Rexer Analytics Proprietary & Confidential 13
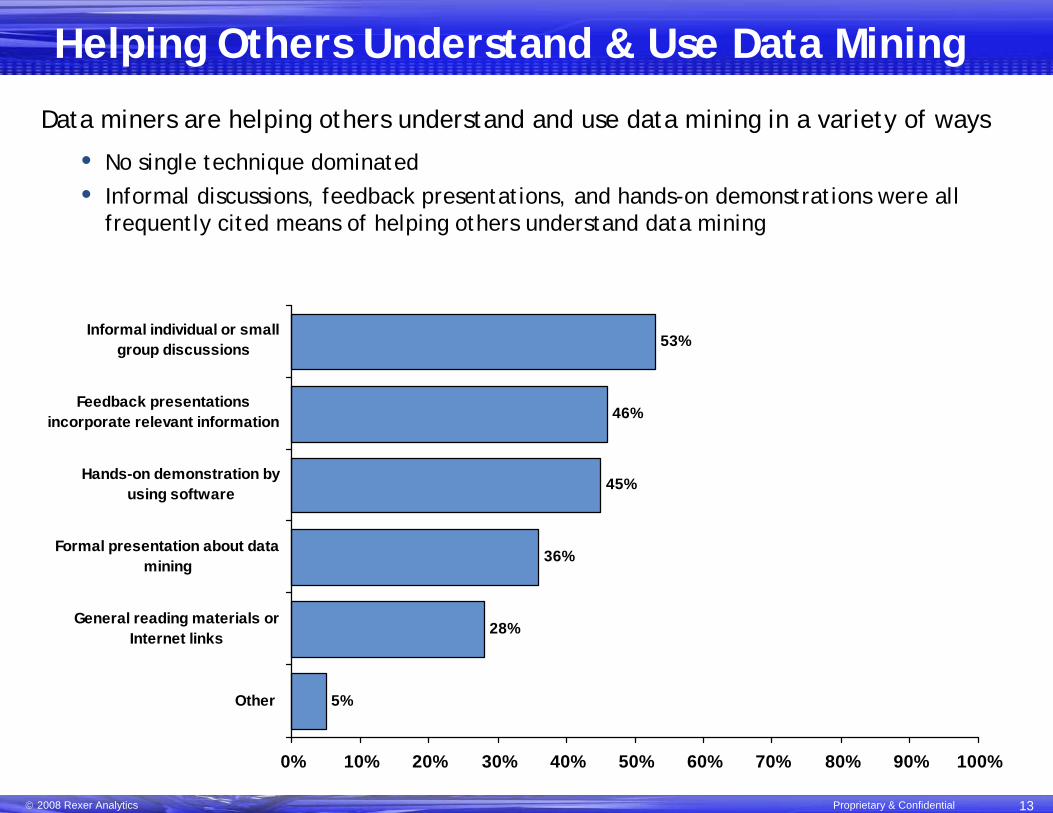
5%
28%
36%
45%
46%
53%
0% 10% 20% 30% 40% 50% 60% 70% 80% 90% 100%
Other
General reading materials orInternet links
Formal presentation about datamining
Hands-on demonstration byusing software
Feedback presentationsincorporate relevant information
Informal individual or smallgroup discussions
Helping Others Understand & Use Data Mining
Data miners are helping others understand and use data mining in a variety of ways
• No single technique dominated• Informal discussions, feedback presentations, and hands-on demonstrations were all
frequently cited means of helping others understand data mining
© 2008 Rexer Analytics Proprietary & Confidential 14
18%
13%12%
7% 7%6%
5% 5%4%
3% 3% 3% 3%
11%
0%
2%
4%
6%
8%
10%
12%
14%
16%
18%
20%
SPS
S C
lem
entin
e
SAS
Stat
istic
a (S
tats
oft)
SAS
Ente
rpris
eM
iner
SPS
S
Rapi
d M
iner R
Oth
er c
omm
erci
alto
ol
Mic
roso
ft SQ
LS
erve
r
KXE
N
Mat
lab
Wek
a
Your
ow
n co
de
Oth
er
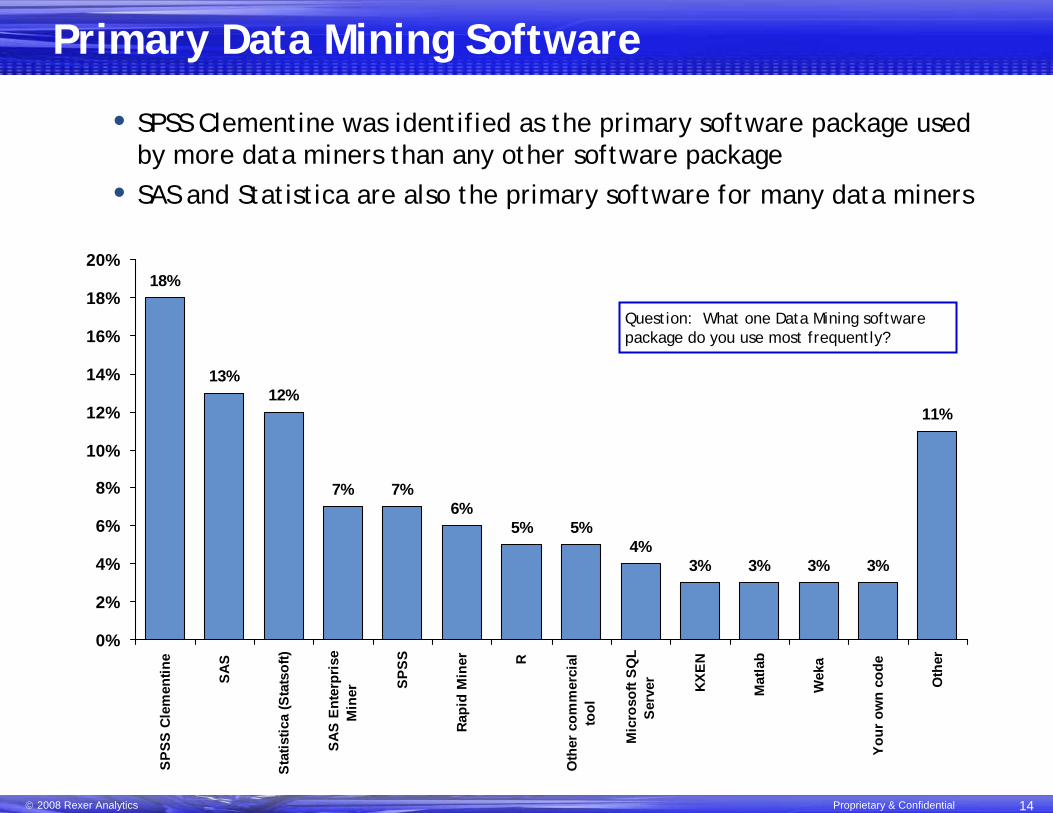
Primary Data Mining Software
• SPSS Clementine was identified as the primary software package used by more data miners than any other software package
• SAS and Statistica are also the primary software for many data miners
Question: What one Data Mining software package do you use most frequently?
© 2008 Rexer Analytics Proprietary & Confidential 15
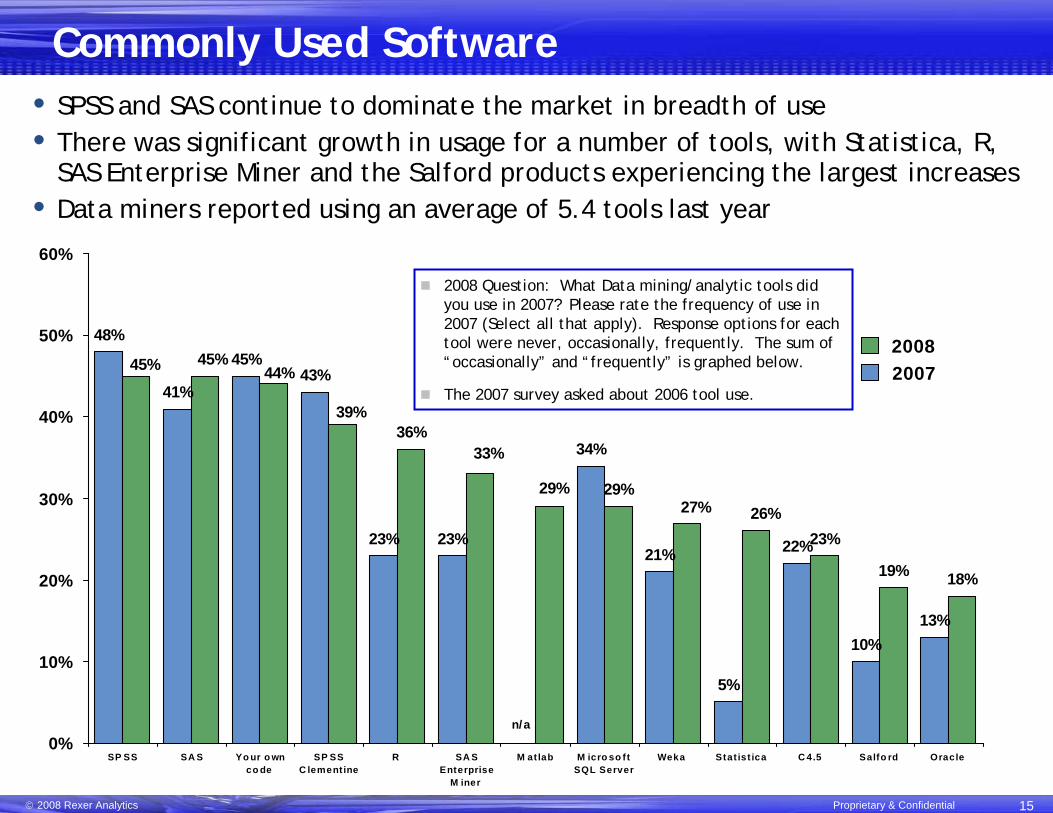
Commonly Used Software
20082007
48%
41%
45%43%
23% 23%
34%
21%
5%
22%
10%13%
29%
23%
19% 18%
27%29%
33%36%
39%
44%45%45%
26%
0%
10%
20%
30%
40%
50%
60%
SP SS SA S Yo ur o wnco de
SP SSC lement ine
R SA SEnterprise
M iner
M at lab M icro so ftSQL Server
Weka Stat ist ica C 4.5 Salfo rd Oracle
• SPSS and SAS continue to dominate the market in breadth of use• There was significant growth in usage for a number of tools, with Statistica, R,
SAS Enterprise Miner and the Salford products experiencing the largest increases• Data miners reported using an average of 5.4 tools last year
n/a
2008 Question: What Data mining/analytic tools did you use in 2007? Please rate the frequency of use in 2007 (Select all that apply). Response options for each tool were never, occasionally, frequently. The sum of “occasionally” and “frequently” is graphed below.
The 2007 survey asked about 2006 tool use.
© 2008 Rexer Analytics Proprietary & Confidential 16
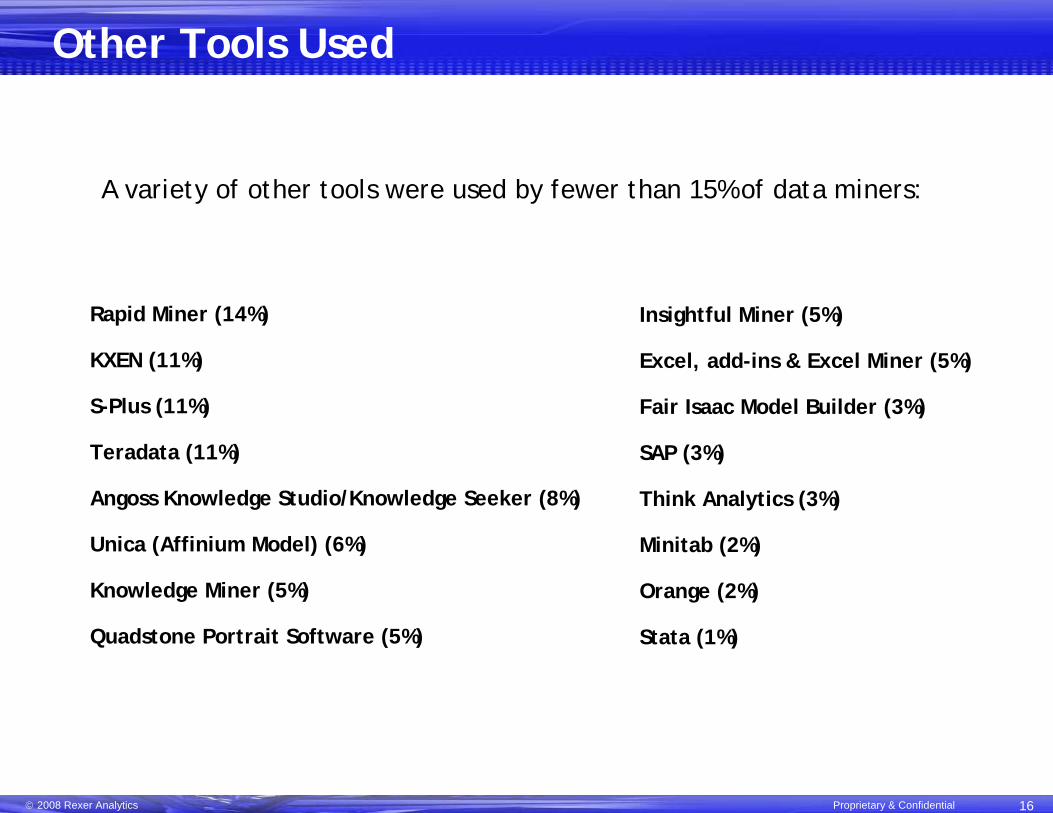
Other Tools Used
Rapid Miner (14%)
KXEN (11%)
S-Plus (11%)
Teradata (11%)
Angoss Knowledge Studio/Knowledge Seeker (8%)
Unica (Affinium Model) (6%)
Knowledge Miner (5%)
Quadstone Portrait Software (5%)
A variety of other tools were used by fewer than 15% of data miners:
Insightful Miner (5%)
Excel, add-ins & Excel Miner (5%)
Fair Isaac Model Builder (3%)
SAP (3%)
Think Analytics (3%)
Minitab (2%)
Orange (2%)
Stata (1%)
© 2008 Rexer Analytics Proprietary & Confidential 17
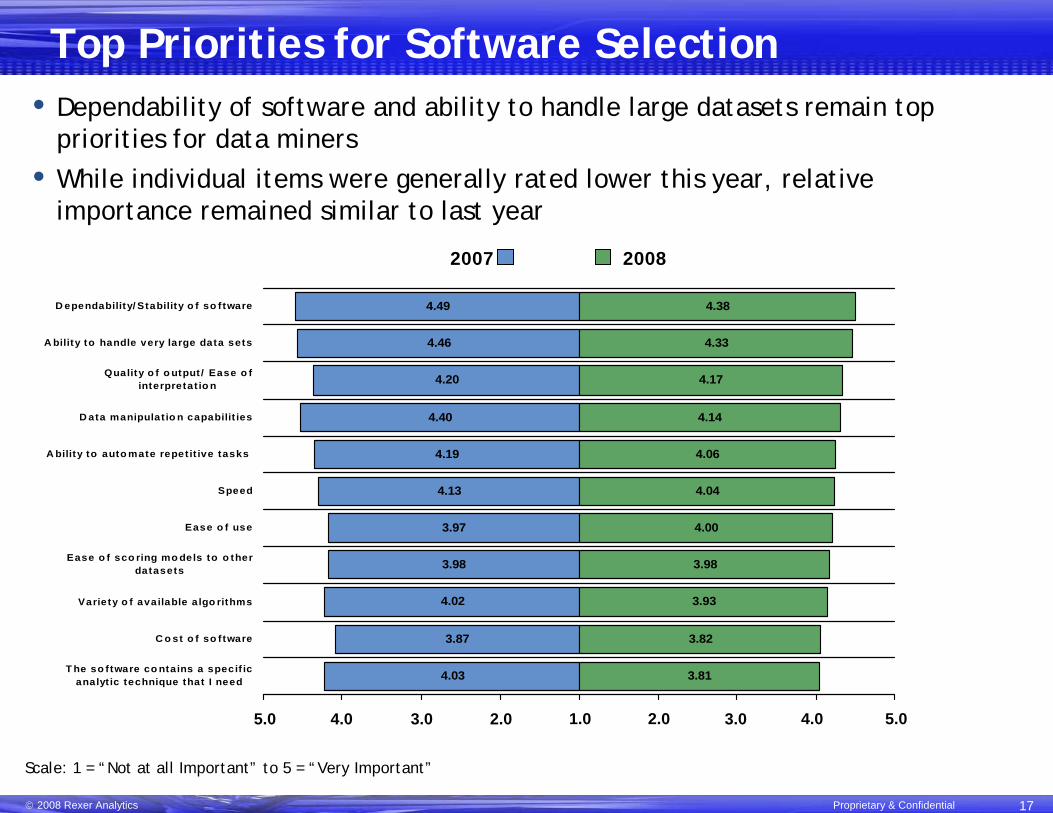
3.81
3.82
3.93
3.98
4.00
4.04
4.06
4.14
4.17
4.33
4.38
4.03
3.87
4.02
3.98
3.97
4.13
4.19
4.40
4.20
4.46
4.49
-5.0 -3.8 -2.5 -1.3 0.0 1.3 2.5 3.8 5.0
T he so ftware co ntains a specif icanalyt ic technique that I need
C o st o f so ftware
Variety o f available a lgo rithms
Ease o f sco ring mo dels to o therdatasets
Ease o f use
Speed
A bility to auto mate repet it ive tasks
D ata manipulat io n capabilit ies
Quality o f o utput / Ease o finterpretat io n
A bility to handle very large data sets
D ependability/ Stability o f so ftware
20082007
2.03.04.05.0 1.0 2.0 3.0 4.0 5.0
Top Priorities for Software Selection• Dependability of software and ability to handle large datasets remain top
priorities for data miners• While individual items were generally rated lower this year, relative
importance remained similar to last year
Scale: 1 = “Not at all Important” to 5 = “Very Important”
© 2008 Rexer Analytics Proprietary & Confidential 18
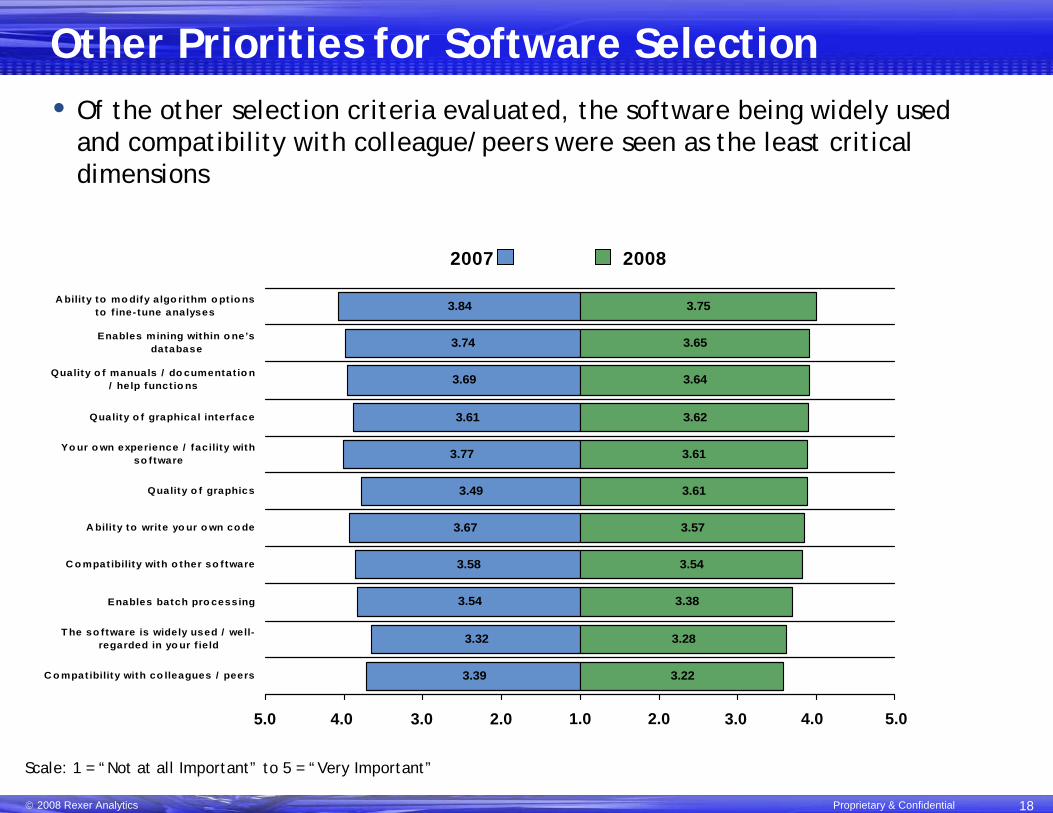
3.22
3.28
3.38
3.54
3.57
3.61
3.61
3.62
3.64
3.65
3.75
3.39
3.32
3.54
3.58
3.67
3.49
3.77
3.61
3.69
3.74
3.84
-5.0 -3.8 -2.5 -1.3 0.0 1.3 2.5 3.8 5.0
C o mpatibility with co lleagues / peers
T he so ftware is widely used / well-regarded in yo ur f ield
Enables batch pro cessing
C o mpat ibility with o ther so ftware
A bility to write yo ur o wn co de
Quality o f graphics
Yo ur o wn experience / facility withso ftware
Quality o f graphical interface
Quality o f manuals / do cumentat io n/ help funct io ns
Enables mining within o ne’sdatabase
A bility to mo dify algo rithm o ptio nsto f ine-tune analyses
20082007
2.03.04.05.0 1.0 2.0 3.0 4.0 5.0
Other Priorities for Software Selection• Of the other selection criteria evaluated, the software being widely used
and compatibility with colleague/peers were seen as the least critical dimensions
Scale: 1 = “Not at all Important” to 5 = “Very Important”
© 2008 Rexer Analytics Proprietary & Confidential 19
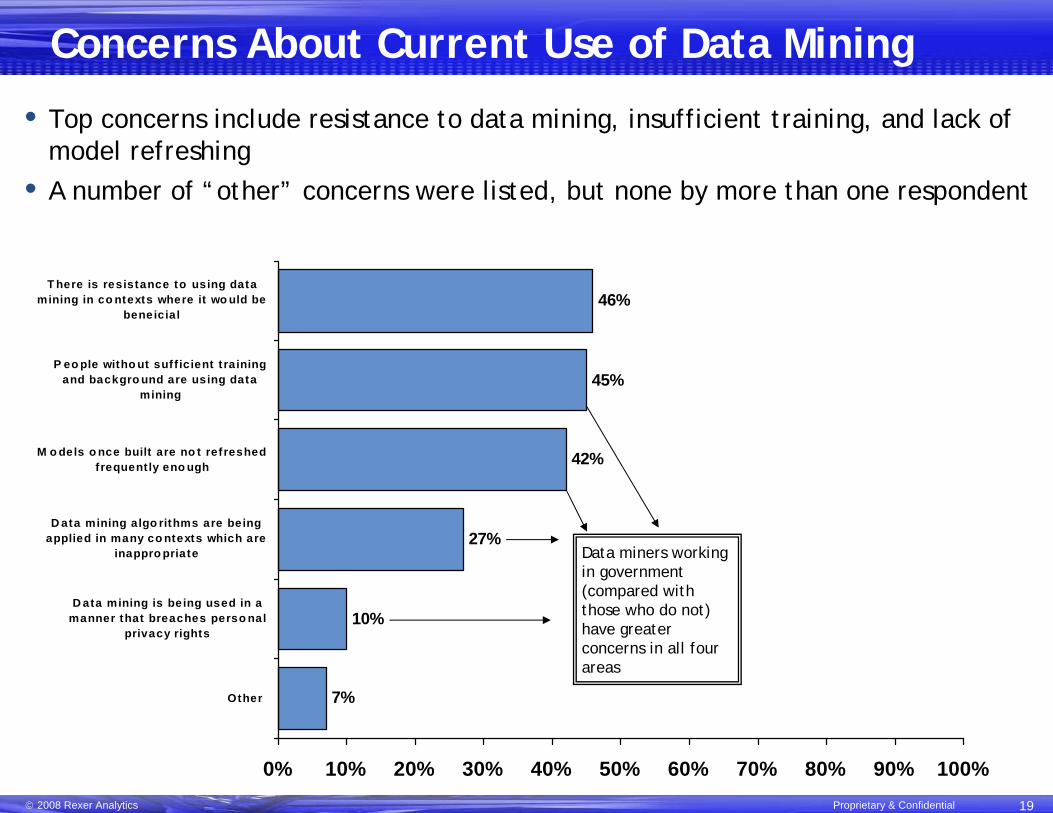
7%
10%
27%
42%
45%
46%
0% 10% 20% 30% 40% 50% 60% 70% 80% 90% 100%
Other
D ata mining is being used in amanner that breaches perso nal
privacy rights
D ata mining algo rithms are beingapplied in many co ntexts which are
inappro priate
M o dels o nce built are no t refreshedfrequently eno ugh
P eo ple witho ut suff icient t rainingand backgro und are using data
mining
T here is resistance to using datamining in co ntexts where it wo uld be
beneicial
Concerns About Current Use of Data Mining
• Top concerns include resistance to data mining, insufficient training, and lack of model refreshing
• A number of “other” concerns were listed, but none by more than one respondent
Data miners working in government (compared with those who do not) have greater concerns in all four areas
© 2008 Rexer Analytics Proprietary & Confidential 20
Predicted Advances in the Next 5-10 Years
Data miners predicted a wide variety of dramatic advances in the field in the near future
• Advances in medicine/pharmaceuticals and text mining were mentioned by the largest number of respondents
• A number of respondents also identified marketing, web analytics and national security as areas ripe for advancement
© 2008 Rexer Analytics Proprietary & Confidential
Appendix:
Additional Findings

© 2008 Rexer Analytics Proprietary & Confidential
Demographics
© 2008 Rexer Analytics Proprietary & Confidential 23
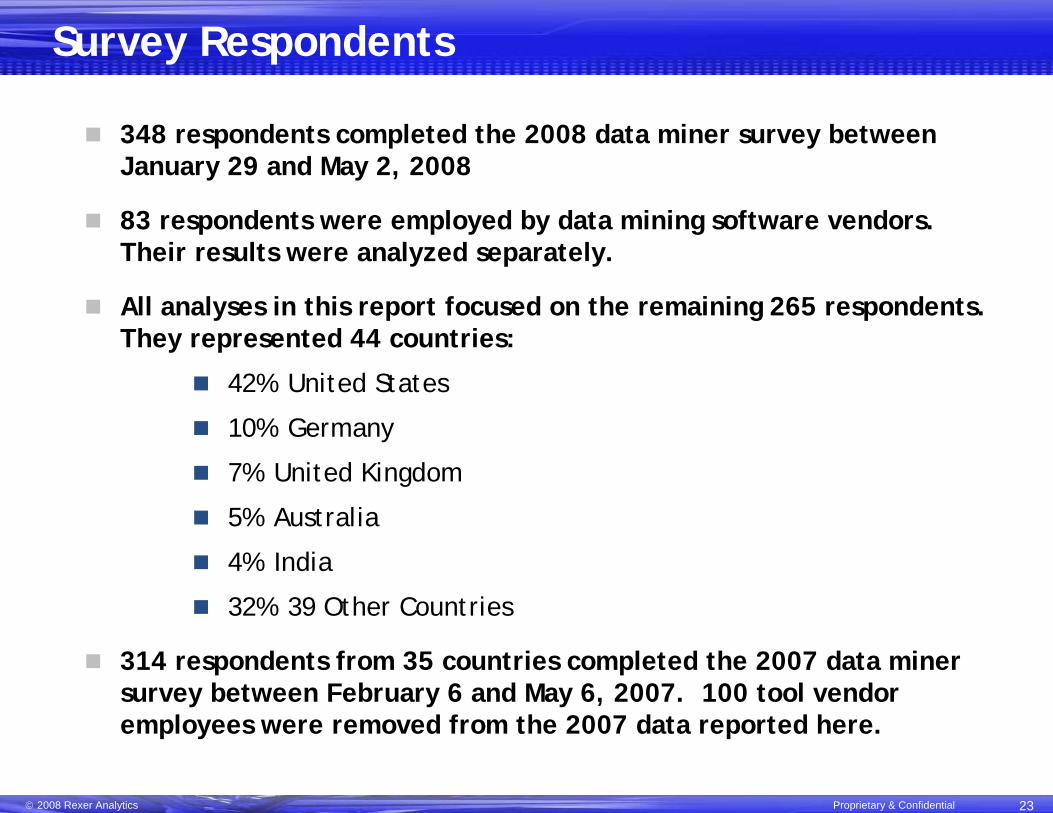
Survey Respondents
348 respondents completed the 2008 data miner survey between January 29 and May 2, 2008
83 respondents were employed by data mining software vendors. Their results were analyzed separately.
All analyses in this report focused on the remaining 265 respondents. They represented 44 countries:
42% United States
10% Germany
7% United Kingdom
5% Australia
4% India
32% 39 Other Countries
314 respondents from 35 countries completed the 2007 data miner survey between February 6 and May 6, 2007. 100 tool vendor employees were removed from the 2007 data reported here.
© 2008 Rexer Analytics Proprietary & Confidential 24
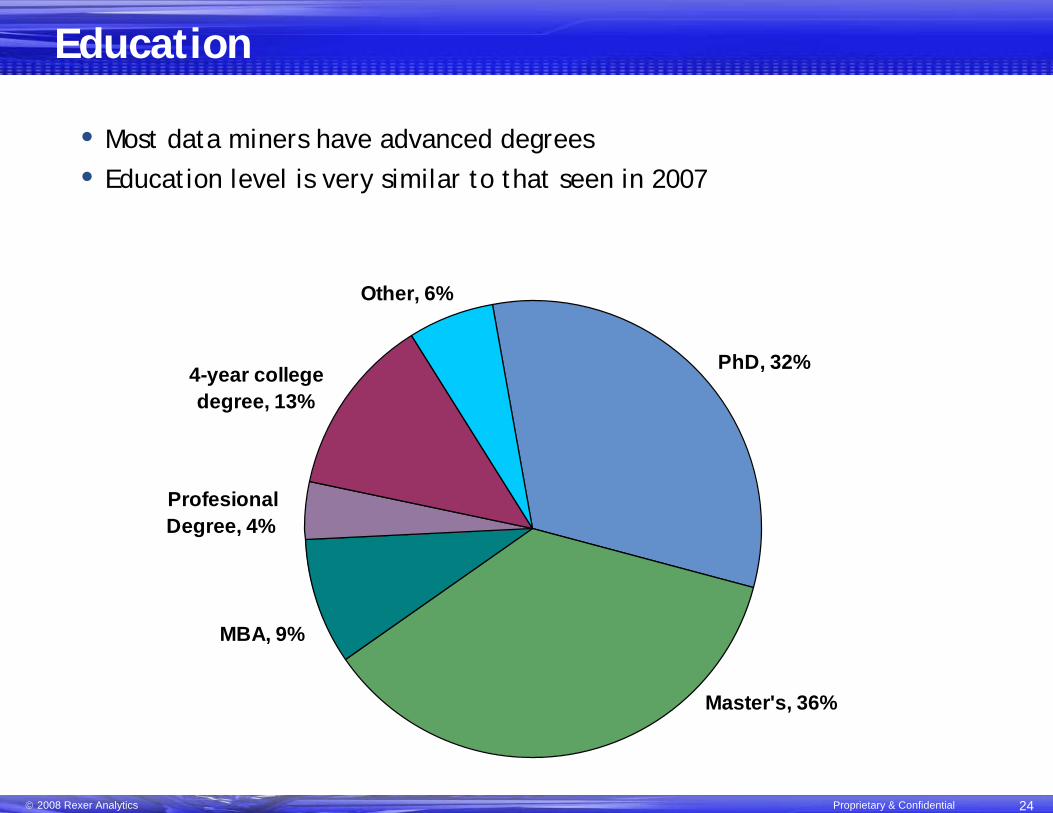
Education
PhD, 32%
Other, 6%
4-year college degree, 13%
Profesional Degree, 4%
MBA, 9%
Master's, 36%
• Most data miners have advanced degrees• Education level is very similar to that seen in 2007
© 2008 Rexer Analytics Proprietary & Confidential 25
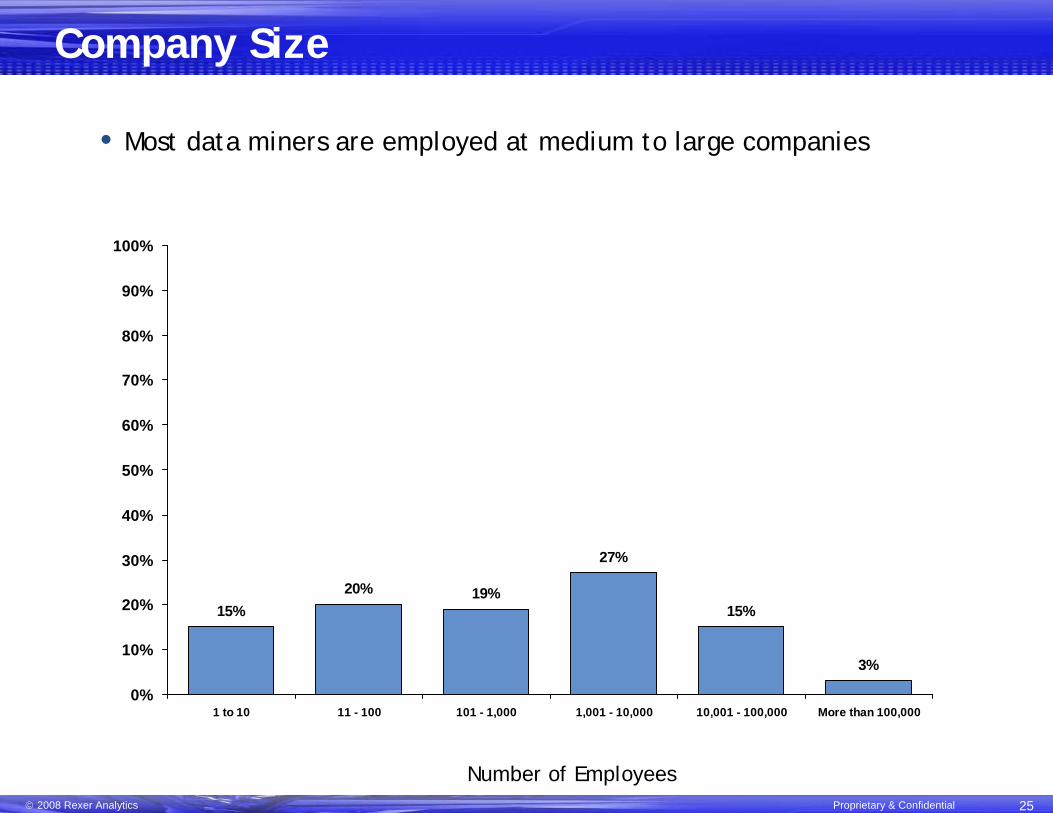
Company Size
• Most data miners are employed at medium to large companies
15%20% 19%
27%
15%
3%
0%
10%
20%
30%
40%
50%
60%
70%
80%
90%
100%
1 to 10 11 - 100 101 - 1,000 1,001 - 10,000 10,001 - 100,000 More than 100,000
Number of Employees
© 2008 Rexer Analytics Proprietary & Confidential 26
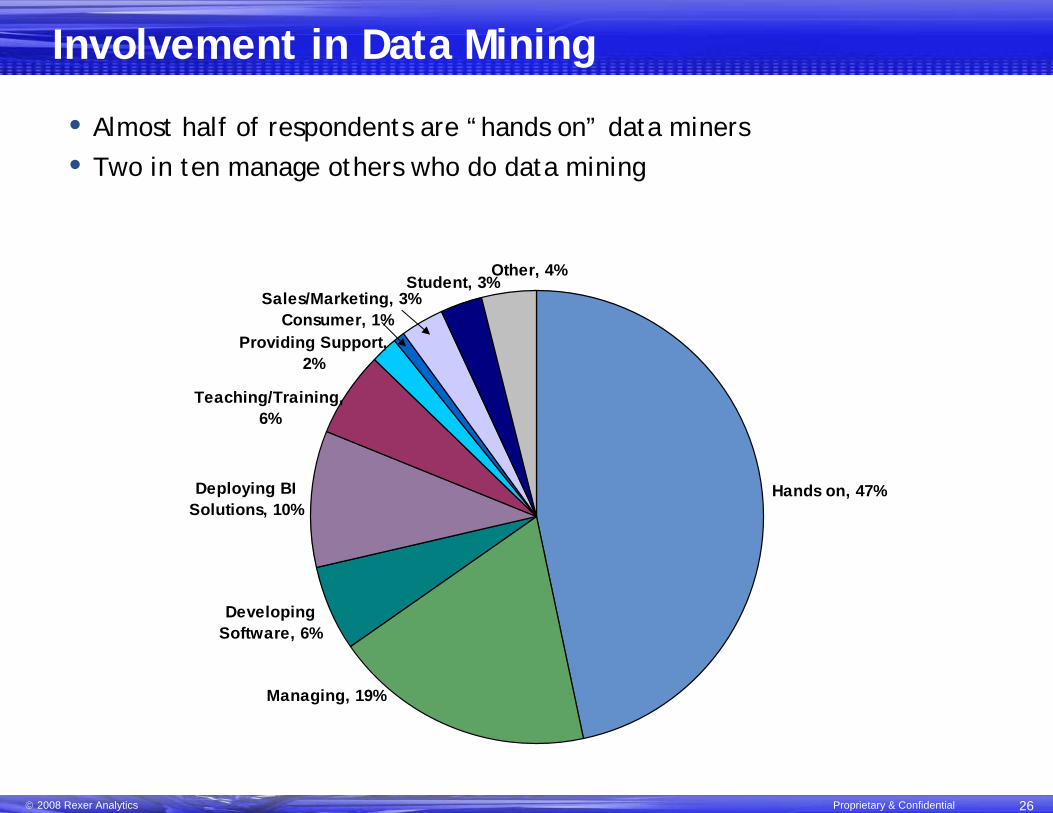
Involvement in Data Mining
Consumer, 1%Sales/Marketing, 3%
Student, 3%Other, 4%
Hands on, 47%
Providing Support, 2%
Teaching/Training, 6%
Deploying BI Solutions, 10%
Developing Software, 6%
Managing, 19%
• Almost half of respondents are “hands on” data miners• Two in ten manage others who do data mining
© 2008 Rexer Analytics Proprietary & Confidential 27
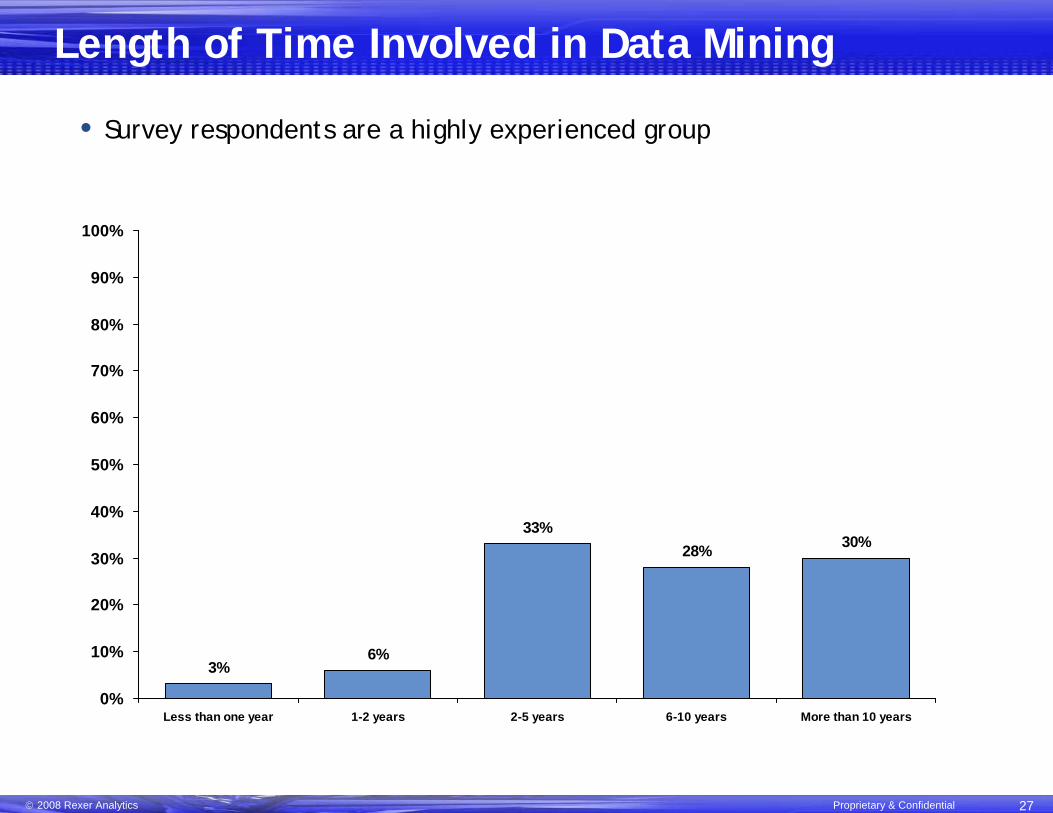
Length of Time Involved in Data Mining
• Survey respondents are a highly experienced group
3%6%
33%28% 30%
0%
10%
20%
30%
40%
50%
60%
70%
80%
90%
100%
Less than one year 1-2 years 2-5 years 6-10 years More than 10 years
© 2008 Rexer Analytics Proprietary & Confidential
Data Analyzed
© 2008 Rexer Analytics Proprietary & Confidential 29
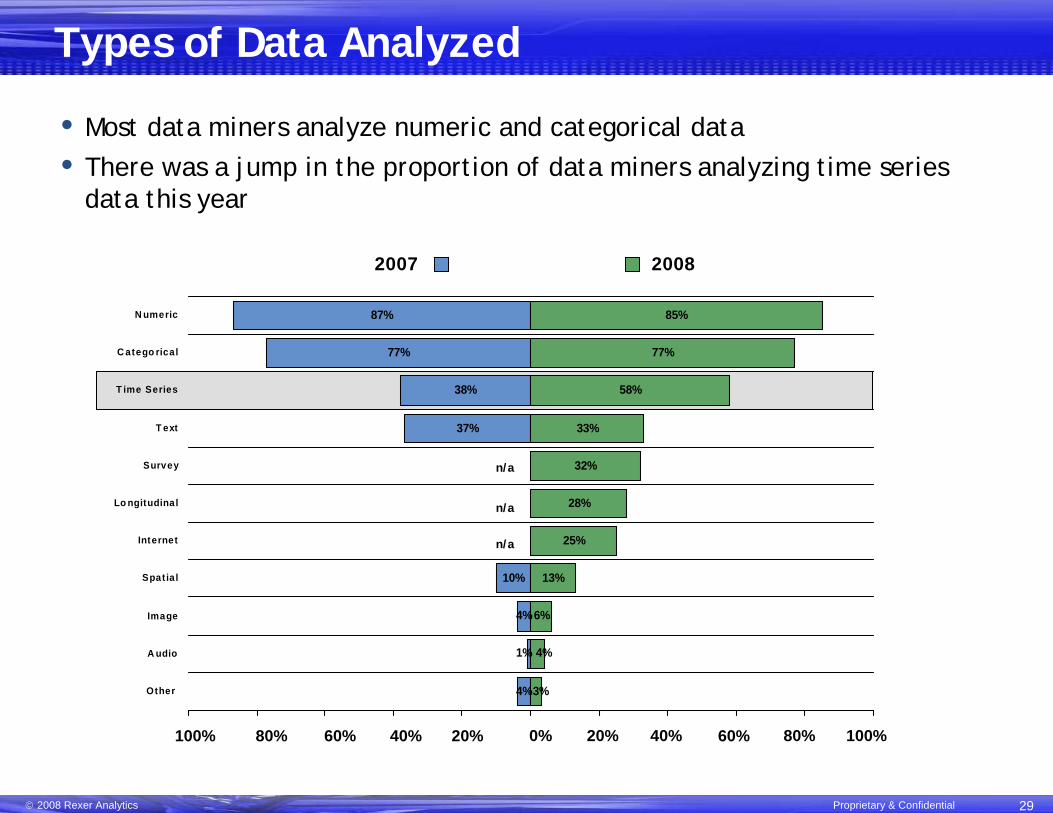
6%
13%
25%
28%
32%
33%
58%
77%
85%
4%
4%
10%
37%
38%
77%
87%
1%
3%
4%
-100% -80% -60% -40% -20% 0% 20% 40% 60% 80% 100%
Other
A udio
Image
Spatia l
Internet
Lo ngitudinal
Survey
T ext
T ime Series
C atego rical
N umeric
20082007
20%40%60%80%100% 0% 20% 40% 60% 80% 100%
Types of Data Analyzed
• Most data miners analyze numeric and categorical data• There was a jump in the proportion of data miners analyzing time series
data this year
n/a
n/a
n/a
© 2008 Rexer Analytics Proprietary & Confidential 30
Number of Records
20082007
12% 11%
22%
34%
22%
3%5%
11%
20%
29% 30%
7%
0%
10%
20%
30%
40%
50%
60%
70%
80%
90%
100%
1,000 or fewerrecords
1,001 - 10,000records
10,001 - 100,000records
100,001 - 1 Millionrecords
1 Million - 100 Millionrecords
More than 100 Millionrecords
• There is a wide range in the size of datasets typically analyzed• A greater proportion of respondents reported analyzing datasets over a
million records this year
© 2008 Rexer Analytics Proprietary & Confidential
Use of Data Mining Software
© 2008 Rexer Analytics Proprietary & Confidential 32
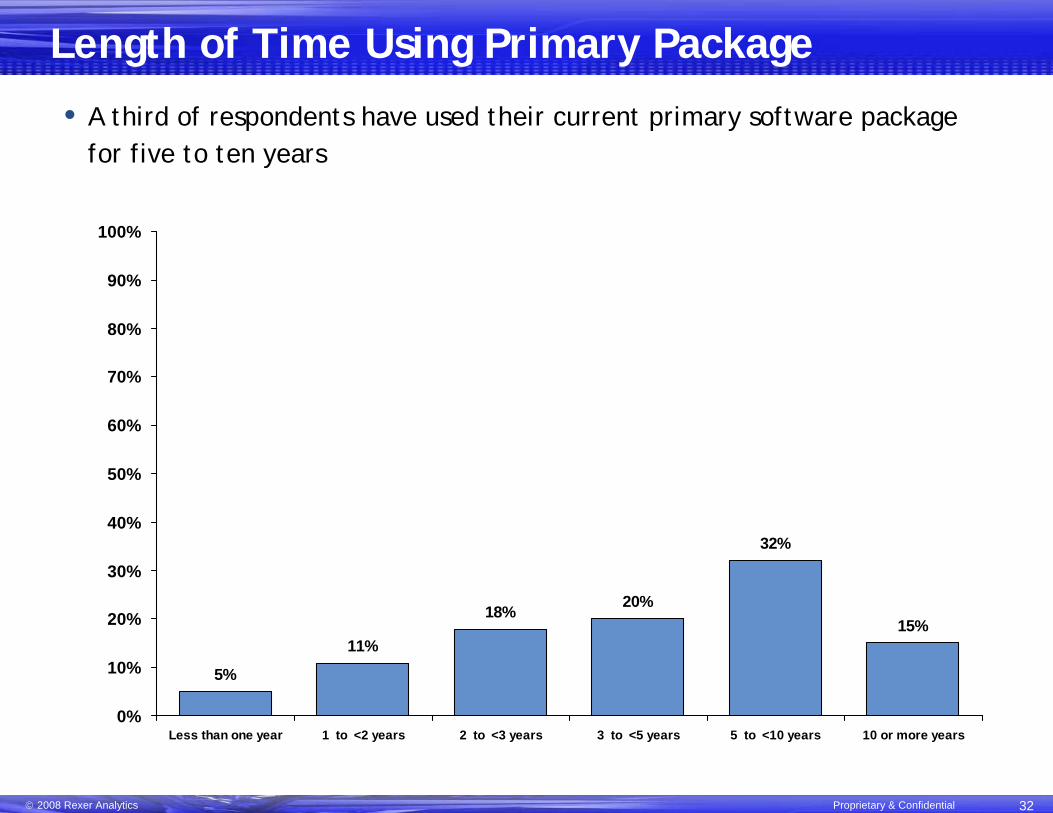
Length of Time Using Primary Package
• A third of respondents have used their current primary software package for five to ten years
5%
11%
18% 20%
32%
15%
0%
10%
20%
30%
40%
50%
60%
70%
80%
90%
100%
Less than one year 1 to <2 years 2 to <3 years 3 to <5 years 5 to <10 years 10 or more years
© 2008 Rexer Analytics Proprietary & Confidential 33
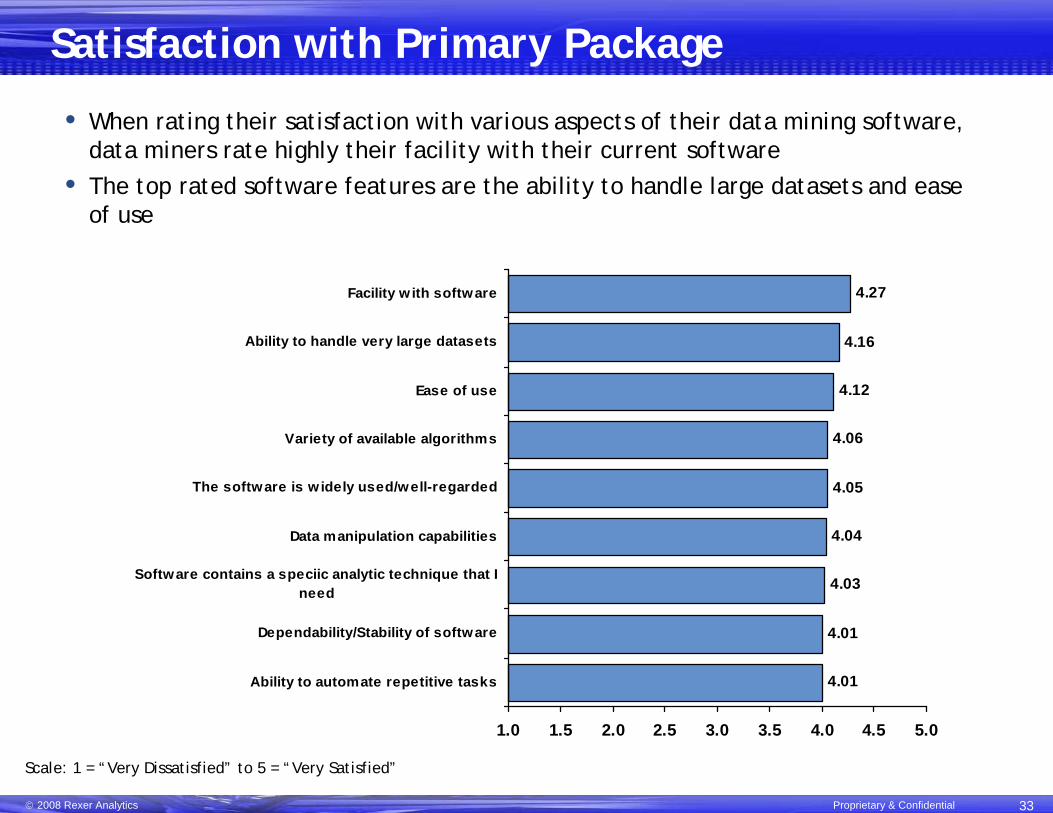
4.01
4.01
4.03
4.04
4.05
4.06
4.12
4.16
4.27
1.0 1.5 2.0 2.5 3.0 3.5 4.0 4.5 5.0
Ability to automate repetitive tasks
Dependability/Stability of software
Software contains a speciic analytic technique that Ineed
Data manipulation capabilities
The software is w idely used/well-regarded
Variety of available algorithms
Ease of use
Ability to handle very large datasets
Facility w ith software
Satisfaction with Primary Package
• When rating their satisfaction with various aspects of their data mining software, data miners rate highly their facility with their current software
• The top rated software features are the ability to handle large datasets and ease of use
Scale: 1 = “Very Dissatisfied” to 5 = “Very Satisfied”
© 2008 Rexer Analytics Proprietary & Confidential 34
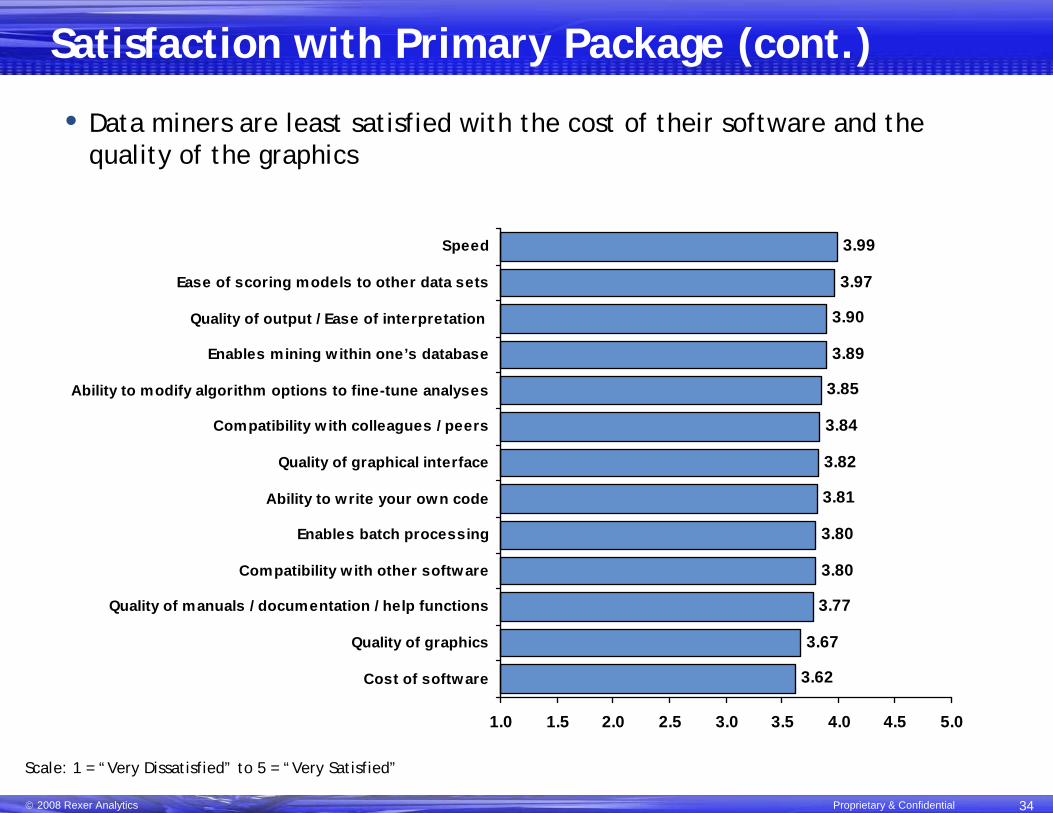
3.62
3.67
3.77
3.81
3.82
3.84
3.85
3.89
3.97
3.99
3.80
3.80
3.90
1.0 1.5 2.0 2.5 3.0 3.5 4.0 4.5 5.0
Cost of software
Quality of graphics
Quality of manuals / documentation / help functions
Compatibility w ith other software
Enables batch processing
Ability to write your own code
Quality of graphical interface
Compatibility w ith colleagues / peers
Ability to modify algorithm options to fine-tune analyses
Enables mining w ithin one’s database
Quality of output / Ease of interpretation
Ease of scoring models to other data sets
Speed
Satisfaction with Primary Package (cont.)
• Data miners are least satisfied with the cost of their software and the quality of the graphics
Scale: 1 = “Very Dissatisfied” to 5 = “Very Satisfied”
© 2008 Rexer Analytics Proprietary & Confidential
Other Findings
© 2008 Rexer Analytics Proprietary & Confidential 36
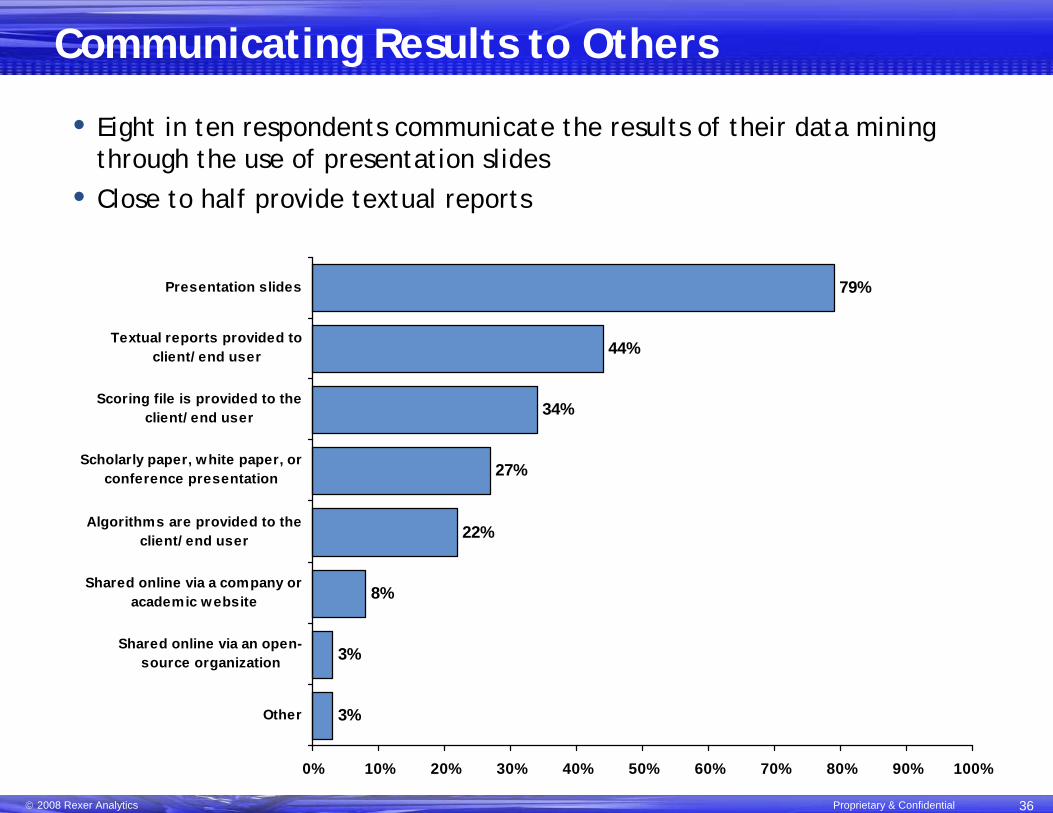
3%
3%
8%
22%
27%
34%
44%
79%
0% 10% 20% 30% 40% 50% 60% 70% 80% 90% 100%
Other
Shared online via an open-source organization
Shared online via a company oracademic website
Algorithms are provided to theclient/ end user
Scholarly paper, white paper, orconference presentation
Scoring file is provided to theclient/ end user
Textual reports provided toclient/ end user
Presentation slides
Communicating Results to Others
• Eight in ten respondents communicate the results of their data mining through the use of presentation slides
• Close to half provide textual reports
© 2008 Rexer Analytics Proprietary & Confidential 37
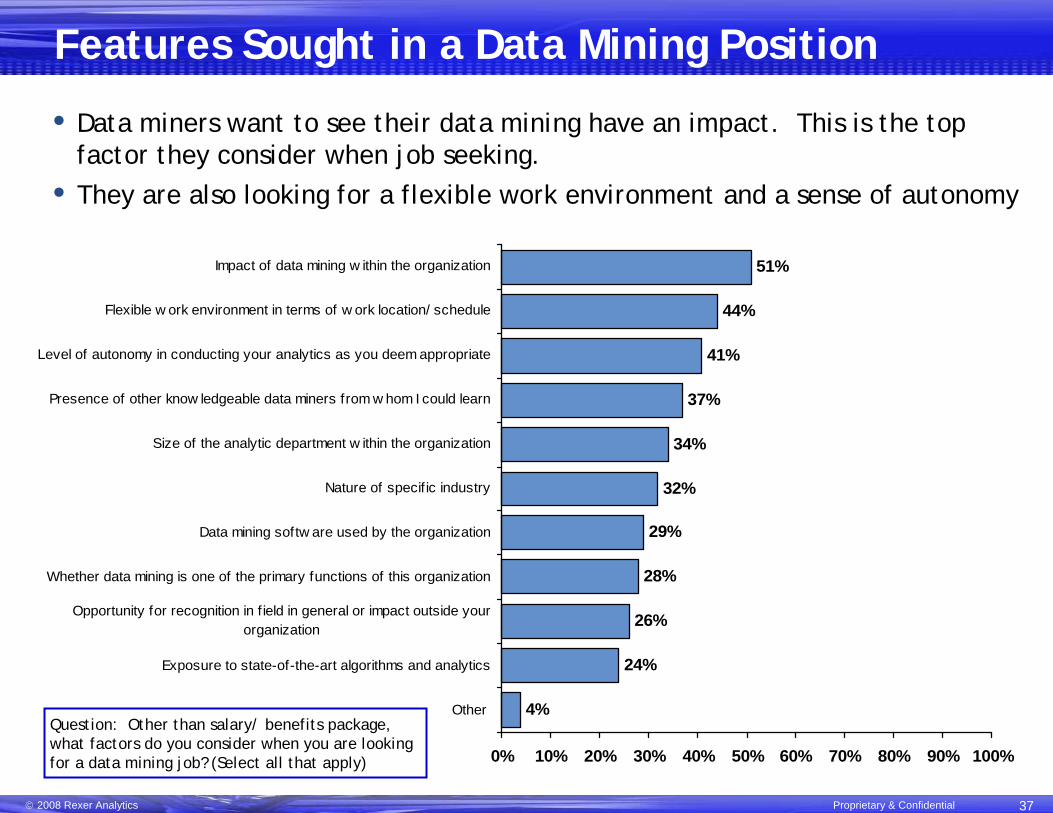
4%
24%
26%
28%
29%
32%
34%
37%
41%
44%
51%
0% 10% 20% 30% 40% 50% 60% 70% 80% 90% 100%
Other
Exposure to state-of-the-art algorithms and analytics
Opportunity for recognition in f ield in general or impact outside yourorganization
Whether data mining is one of the primary functions of this organization
Data mining softw are used by the organization
Nature of specif ic industry
Size of the analytic department w ithin the organization
Presence of other know ledgeable data miners from w hom I could learn
Level of autonomy in conducting your analytics as you deem appropriate
Flexible w ork environment in terms of w ork location/ schedule
Impact of data mining w ithin the organization
Features Sought in a Data Mining Position
• Data miners want to see their data mining have an impact. This is the top factor they consider when job seeking.
• They are also looking for a flexible work environment and a sense of autonomy
Question: Other than salary/ benefits package, what factors do you consider when you are looking for a data mining job? (Select all that apply)
© 2008 Rexer Analytics Proprietary & Confidential 38
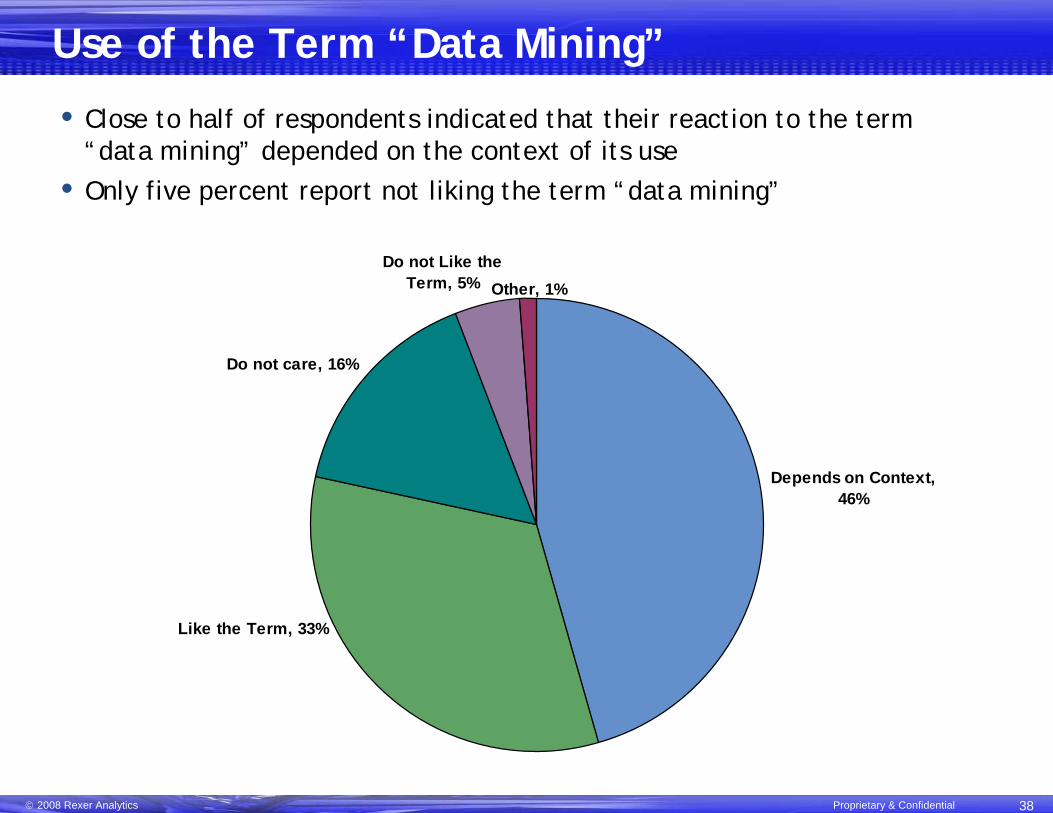
Use of the Term “Data Mining”
Depends on Context, 46%
Other, 1%Do not Like the
Term, 5%
Do not care, 16%
Like the Term, 33%
• Close to half of respondents indicated that their reaction to the term “data mining” depended on the context of its use
• Only five percent report not liking the term “data mining”
© 2008 Rexer Analytics Proprietary & Confidential 39
Karl Rexer, PhD [email protected] 617-233-8185
Rexer Analytics 30 Vine Street Winchester, MA 01890 USA
www.RexerAnalytics.com
For more information contact: