Embed Size (px)
Citation preview
1 www.ricemidstream.com
Rice Midstream Partners2016 MLPA Investor ConferenceJune 2, 2016
2 www.ricemidstream.com
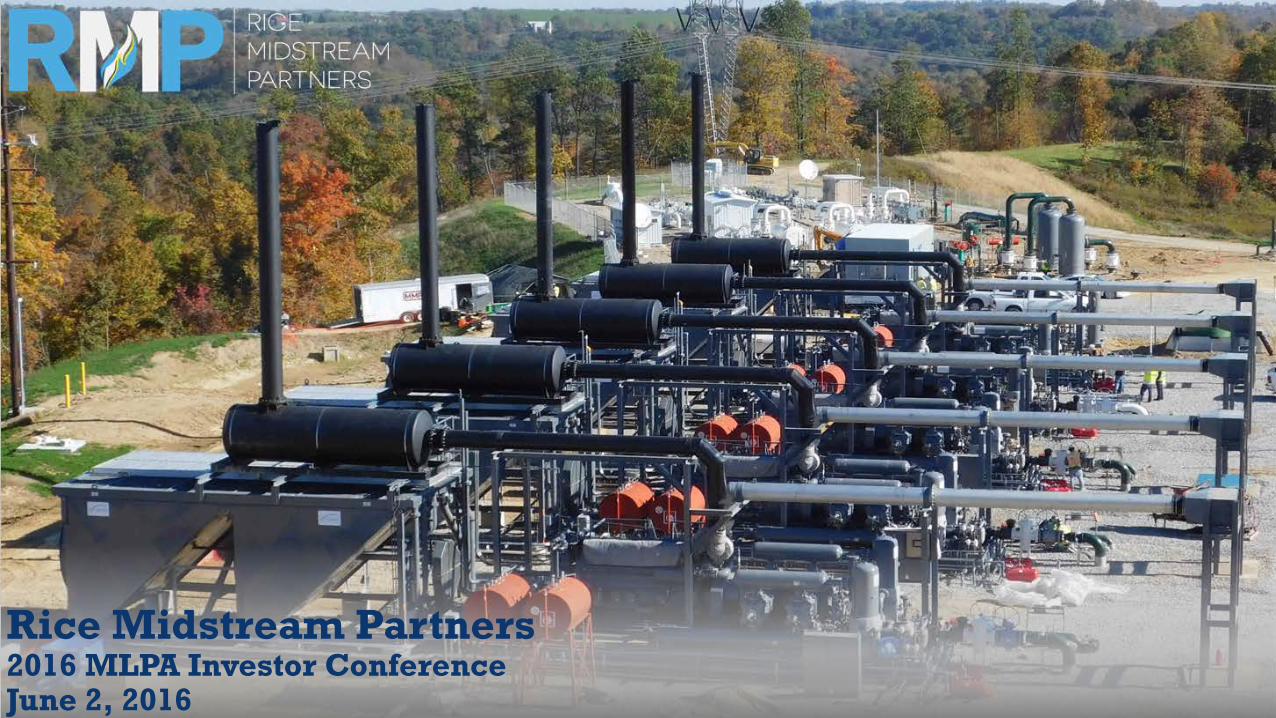
Recent Company Updates
RMP Throughput Guidance Slide 6
Leverage and Liquidity Slide 9
3 www.ricemidstream.com
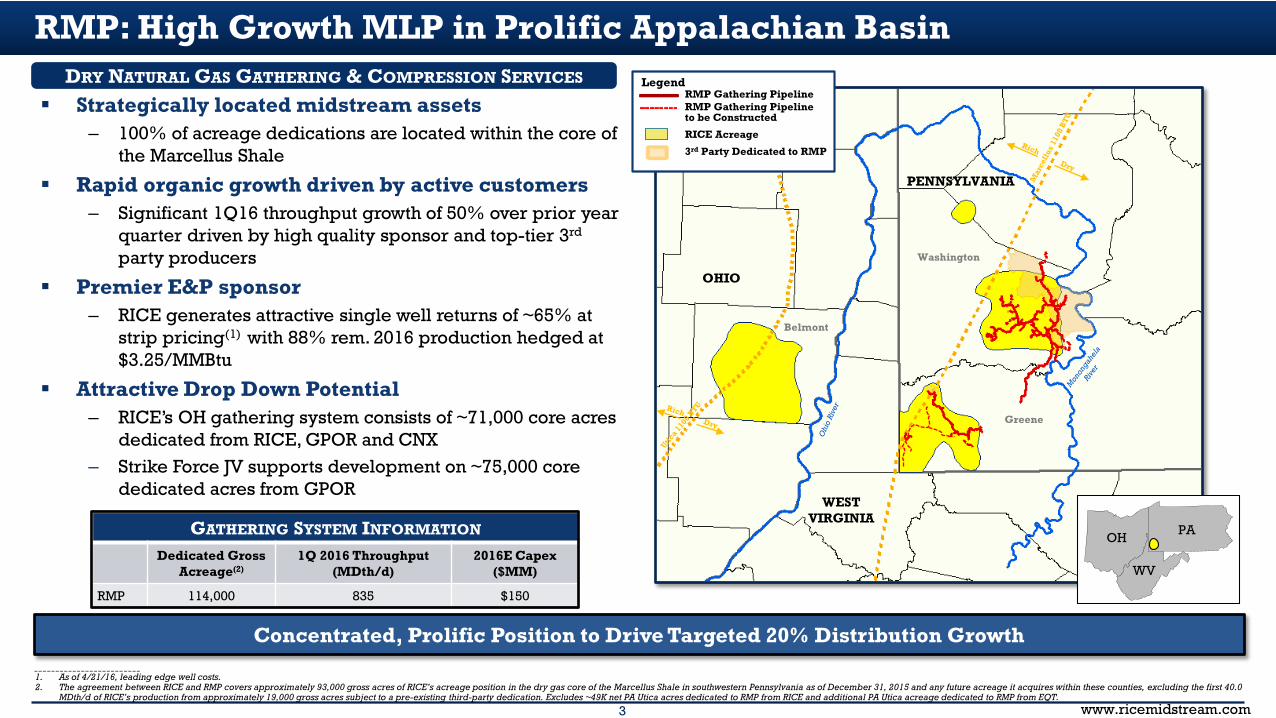
RMP: High Growth MLP in Prolific Appalachian Basin
GATHERING SYSTEM INFORMATION
Dedicated GrossAcreage(2)
1Q 2016 Throughput (MDth/d)
2016E Capex ($MM)
RMP 114,000 835 $150
Concentrated, Prolific Position to Drive Targeted 20% Distribution Growth
DRY NATURAL GAS GATHERING & COMPRESSION SERVICES
WEST VIRGINIA
OH PA
WV
Greene
Washington
PENNSYLVANIA
Belmont
WEST VIRGINIA
Beaver
Brooke
Legend
RMP Gathering Pipeline to be Constructed
RICE Acreage
RMP Gathering Pipeline
3rd Party Dedicated to RMP
OHIO
_________________________1. As of 4/21/16, leading edge well costs.2. The agreement between RICE and RMP covers approximately 93,000 gross acres of RICE’s acreage position in the dry gas core of the Marcellus Shale in southwestern Pennsylvania as of December 31, 2015 and any future acreage it acquires within these counties, excluding the first 40.0
MDth/d of RICE’s production from approximately 19,000 gross acres subject to a pre-existing third-party dedication. Excludes ~49K net PA Utica acres dedicated to RMP from RICE and additional PA Utica acreage dedicated to RMP from EQT.
Strategically located midstream assets– 100% of acreage dedications are located within the core of
the Marcellus Shale
Rapid organic growth driven by active customers– Significant 1Q16 throughput growth of 50% over prior year
quarter driven by high quality sponsor and top-tier 3rd
party producers
Premier E&P sponsor– RICE generates attractive single well returns of ~65% at
strip pricing(1) with 88% rem. 2016 production hedged at $3.25/MMBtu
Attractive Drop Down Potential– RICE’s OH gathering system consists of ~71,000 core acres
dedicated from RICE, GPOR and CNX– Strike Force JV supports development on ~75,000 core
dedicated acres from GPOR
4 www.ricemidstream.com
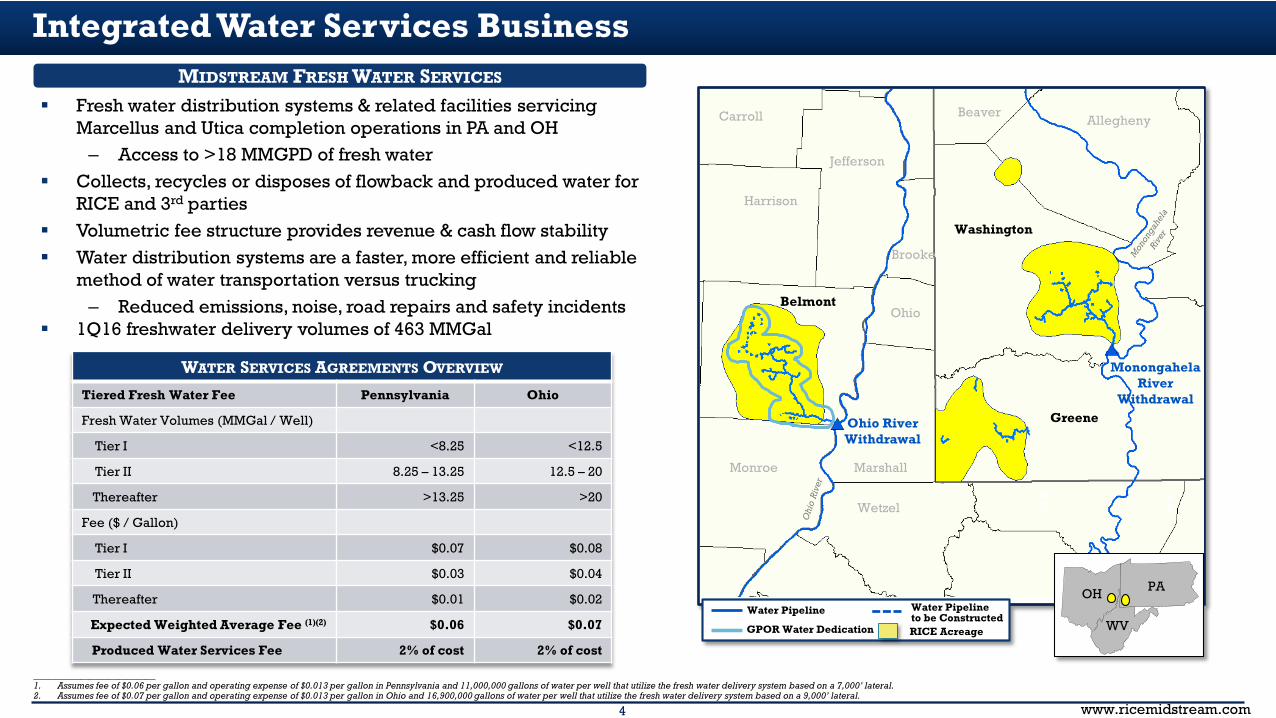
__________________________1. Assumes fee of $0.06 per gallon and operating expense of $0.013 per gallon in Pennsylvania and 11,000,000 gallons of water per well that utilize the fresh water delivery system based on a 7,000’ lateral.2. Assumes fee of $0.07 per gallon and operating expense of $0.013 per gallon in Ohio and 16,900,000 gallons of water per well that utilize the fresh water delivery system based on a 9,000’ lateral.
Integrated Water Services BusinessMIDSTREAM FRESH WATER SERVICES
Water Pipeline Water Pipeline to be ConstructedRICE Acreage
WetzelPA
OH
Greene
Washington
Monroe Marshall
Harrison
Jefferson
Ohio
Brooke
BeaverAlleghenyCarroll
Belmont
Monongahela River
Withdrawal
Ohio RiverWithdrawal
OH PA
WVGPOR Water Dedication
WATER SERVICES AGREEMENTS OVERVIEW
Tiered Fresh Water Fee Pennsylvania Ohio
Fresh Water Volumes (MMGal / Well)
Tier I <8.25 <12.5
Tier II 8.25 – 13.25 12.5 – 20
Thereafter >13.25 >20
Fee ($ / Gallon)
Tier I $0.07 $0.08
Tier II $0.03 $0.04
Thereafter $0.01 $0.02
Expected Weighted Average Fee (1)(2) $0.06 $0.07
Produced Water Services Fee 2% of cost 2% of cost
Fresh water distribution systems & related facilities servicing Marcellus and Utica completion operations in PA and OH
– Access to >18 MMGPD of fresh water Collects, recycles or disposes of flowback and produced water for
RICE and 3rd parties Volumetric fee structure provides revenue & cash flow stability Water distribution systems are a faster, more efficient and reliable
method of water transportation versus trucking– Reduced emissions, noise, road repairs and safety incidents
1Q16 freshwater delivery volumes of 463 MMGal
5 www.ricemidstream.com
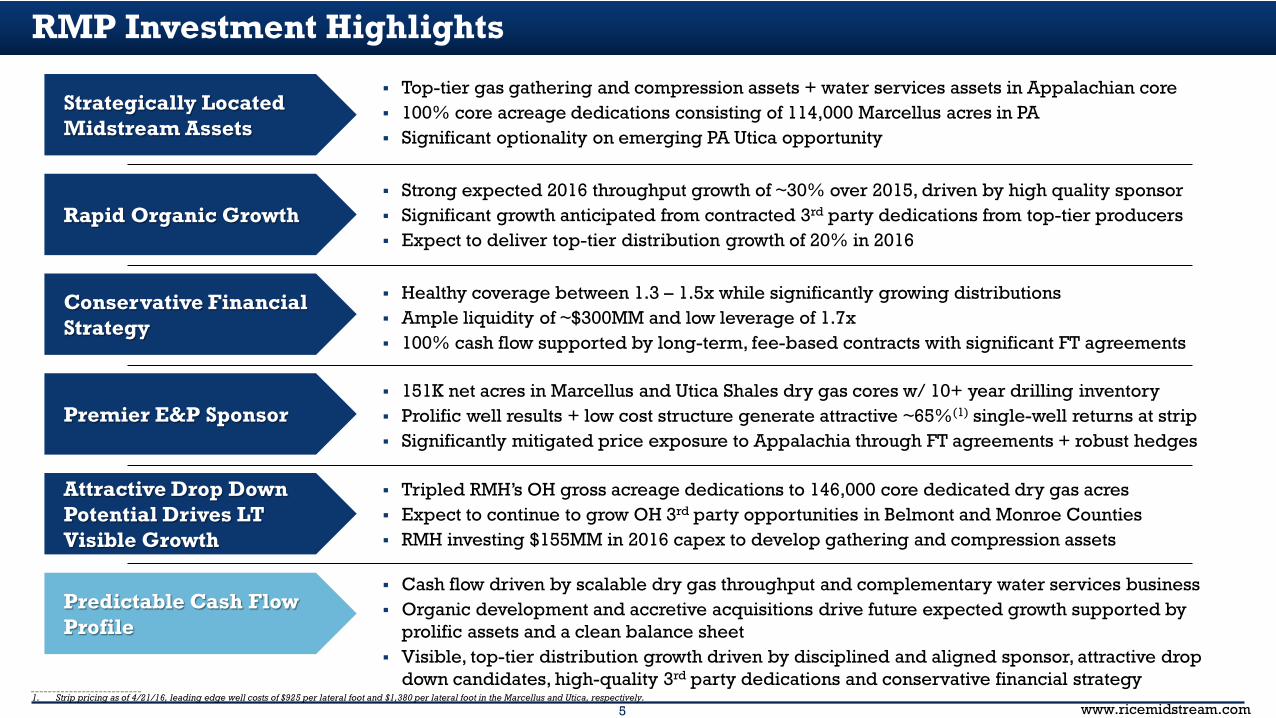
RMP Investment Highlights
Top-tier gas gathering and compression assets + water services assets in Appalachian core 100% core acreage dedications consisting of 114,000 Marcellus acres in PA Significant optionality on emerging PA Utica opportunity
Strong expected 2016 throughput growth of ~30% over 2015, driven by high quality sponsor Significant growth anticipated from contracted 3rd party dedications from top-tier producers Expect to deliver top-tier distribution growth of 20% in 2016
Tripled RMH’s OH gross acreage dedications to 146,000 core dedicated dry gas acres Expect to continue to grow OH 3rd party opportunities in Belmont and Monroe Counties RMH investing $155MM in 2016 capex to develop gathering and compression assets
Cash flow driven by scalable dry gas throughput and complementary water services business Organic development and accretive acquisitions drive future expected growth supported by
prolific assets and a clean balance sheet Visible, top-tier distribution growth driven by disciplined and aligned sponsor, attractive drop
down candidates, high-quality 3rd party dedications and conservative financial strategy__________________________1. Strip pricing as of 4/21/16, leading edge well costs of $925 per lateral foot and $1,380 per lateral foot in the Marcellus and Utica, respectively.
Strategically Located Midstream Assets
Rapid Organic Growth
Premier E&P Sponsor
Attractive Drop Down Potential Drives LT Visible Growth
Predictable Cash Flow Profile
Conservative Financial Strategy
Healthy coverage between 1.3 – 1.5x while significantly growing distributions Ample liquidity of ~$300MM and low leverage of 1.7x 100% cash flow supported by long-term, fee-based contracts with significant FT agreements
151K net acres in Marcellus and Utica Shales dry gas cores w/ 10+ year drilling inventory Prolific well results + low cost structure generate attractive ~65%(1) single-well returns at strip Significantly mitigated price exposure to Appalachia through FT agreements + robust hedges
6 www.ricemidstream.com
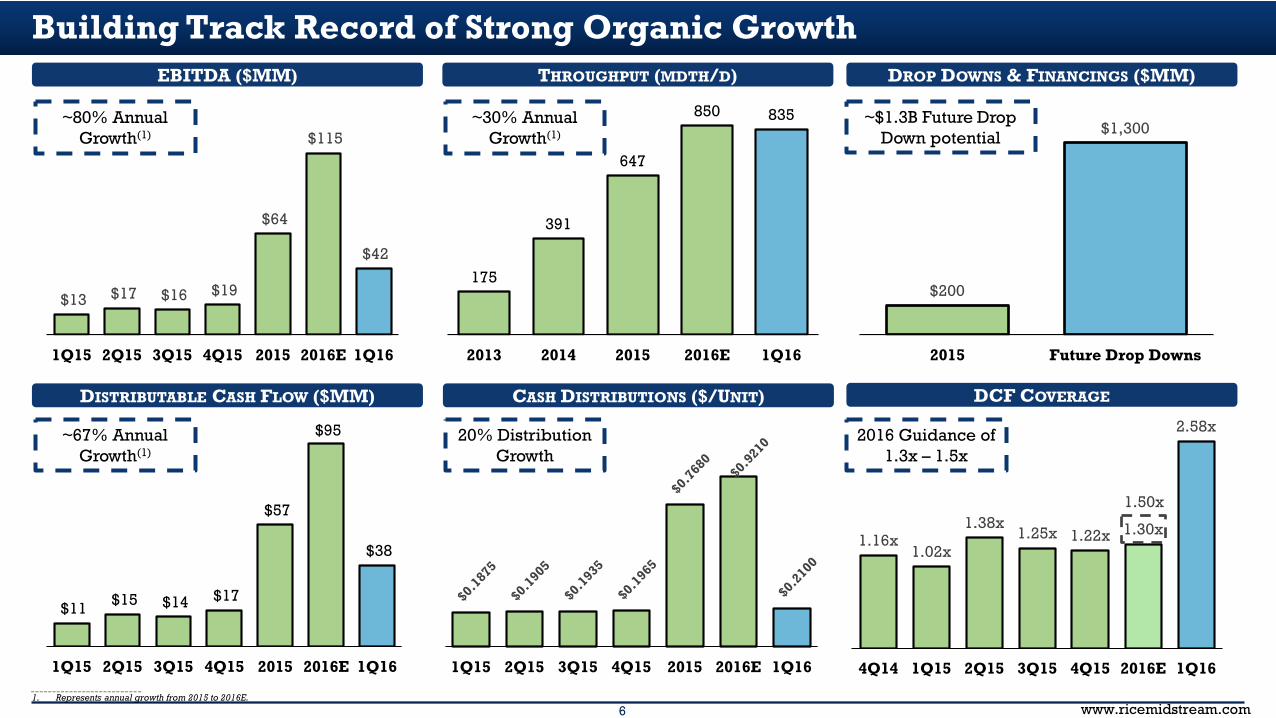
$11 $15 $14 $17
$57
$95
$38
1Q15 2Q15 3Q15 4Q15 2015 2016E 1Q16 1Q15 2Q15 3Q15 4Q15 2015 2016E 1Q16
$200
$1,300
2015 Future Drop Downs
175
391
647
850 835
2013 2014 2015 2016E 1Q16
$13 $17 $16 $19
$64
$115
$42
1Q15 2Q15 3Q15 4Q15 2015 2016E 1Q16
Building Track Record of Strong Organic Growth
CASH DISTRIBUTIONS ($/UNIT)
EBITDA ($MM) THROUGHPUT (MDTH/D)
DISTRIBUTABLE CASH FLOW ($MM)
DROP DOWNS & FINANCINGS ($MM)
DCF COVERAGE
20% Distribution Growth
~67% Annual Growth(1)
~80% Annual Growth(1)
~30% Annual Growth(1)
~$1.3B Future Drop Down potential
1.16x 1.02x
1.38x 1.25x 1.22x 1.30x
2.58x
4Q14 1Q15 2Q15 3Q15 4Q15 2016E 1Q16
2016 Guidance of 1.3x – 1.5x
1.50x
__________________________1. Represents annual growth from 2015 to 2016E.
7 www.ricemidstream.com
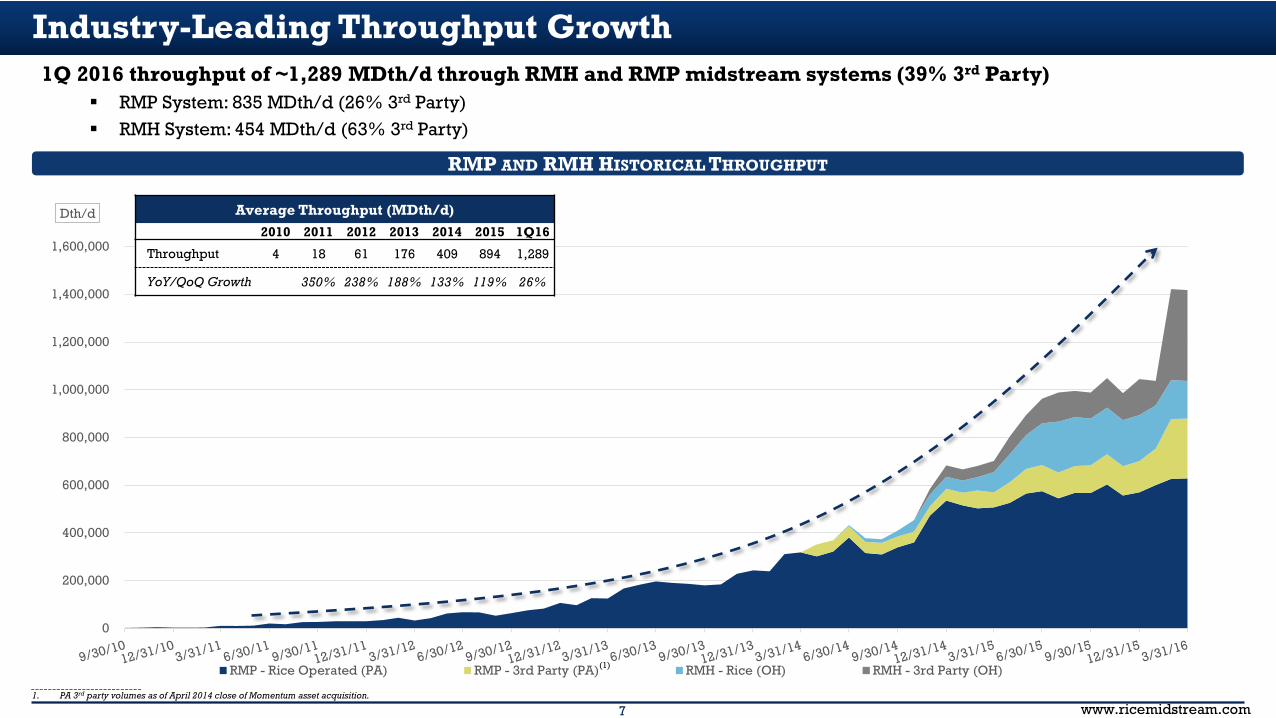
Industry-Leading Throughput Growth1Q 2016 throughput of ~1,289 MDth/d through RMH and RMP midstream systems (39% 3rd Party)
RMP System: 835 MDth/d (26% 3rd Party) RMH System: 454 MDth/d (63% 3rd Party)
0
200,000
400,000
600,000
800,000
1,000,000
1,200,000
1,400,000
1,600,000
Dth/d
RMP - Rice Operated (PA) RMP - 3rd Party (PA) RMH - Rice (OH) RMH - 3rd Party (OH)
Average Throughput (MDth/d)2010 2011 2012 2013 2014 2015 1Q16
Throughput 4 18 61 176 409 894 1,289
YoY/QoQ Growth 350% 238% 188% 133% 119% 26%
(1)
__________________________1. PA 3rd party volumes as of April 2014 close of Momentum asset acquisition.
RMP AND RMH HISTORICAL THROUGHPUT
8 www.ricemidstream.com
RMP 3rd Party Dedications from Top Operators in the Basin
RMP’s Assets are Strategically Positioned to Capture 3rd Party Growth__________________________1. Calculated based on weighted average historic throughput.
OVERVIEW
WEST VIRGINIA
OH PA
WV
Greene
Washington
PENNSYLVANIA
Belmont
WEST VIRGINIA
Beaver
Brooke
Legend
RMP Gathering Pipeline to be Constructed
RICE Acreage
RMP Gathering Pipeline
3rd Party Dedicated to RMP
RMP Water PipelineRMP Water Pipeline to be ConstructedRMP Water Interconnects
GPOR Water Dedication
OHIO
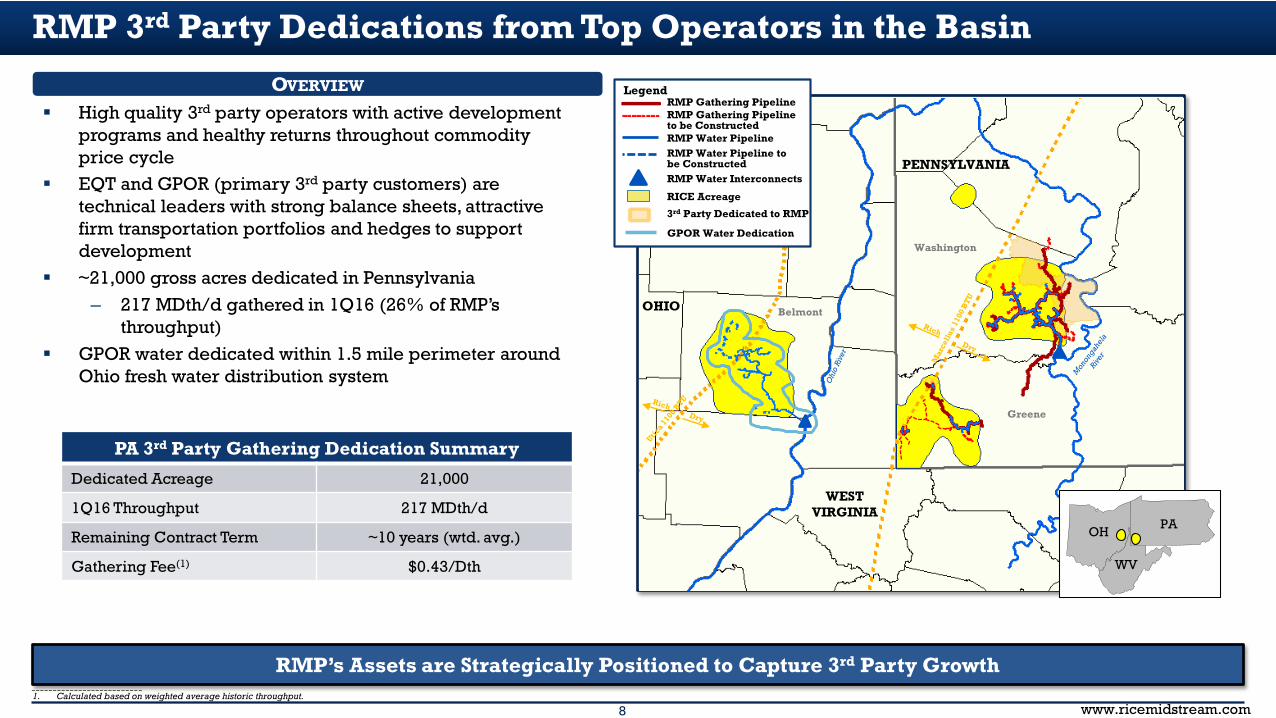
High quality 3rd party operators with active development programs and healthy returns throughout commodity price cycle
EQT and GPOR (primary 3rd party customers) are technical leaders with strong balance sheets, attractive firm transportation portfolios and hedges to support development
~21,000 gross acres dedicated in Pennsylvania– 217 MDth/d gathered in 1Q16 (26% of RMP’s
throughput) GPOR water dedicated within 1.5 mile perimeter around
Ohio fresh water distribution system
PA 3rd Party Gathering Dedication Summary
Dedicated Acreage 21,000
1Q16 Throughput 217 MDth/d
Remaining Contract Term ~10 years (wtd. avg.)
Gathering Fee(1) $0.43/Dth
9 www.ricemidstream.com
$30 $70
$858
$291 $290
$540
–
$118
–
$126
–
$435
$321 $360
$1,398
–
$500
$1,000
$1,500 Remaining 2016 CapEx
Available Credit Facility
1Q16 Cash & Rem. 2016E CFO
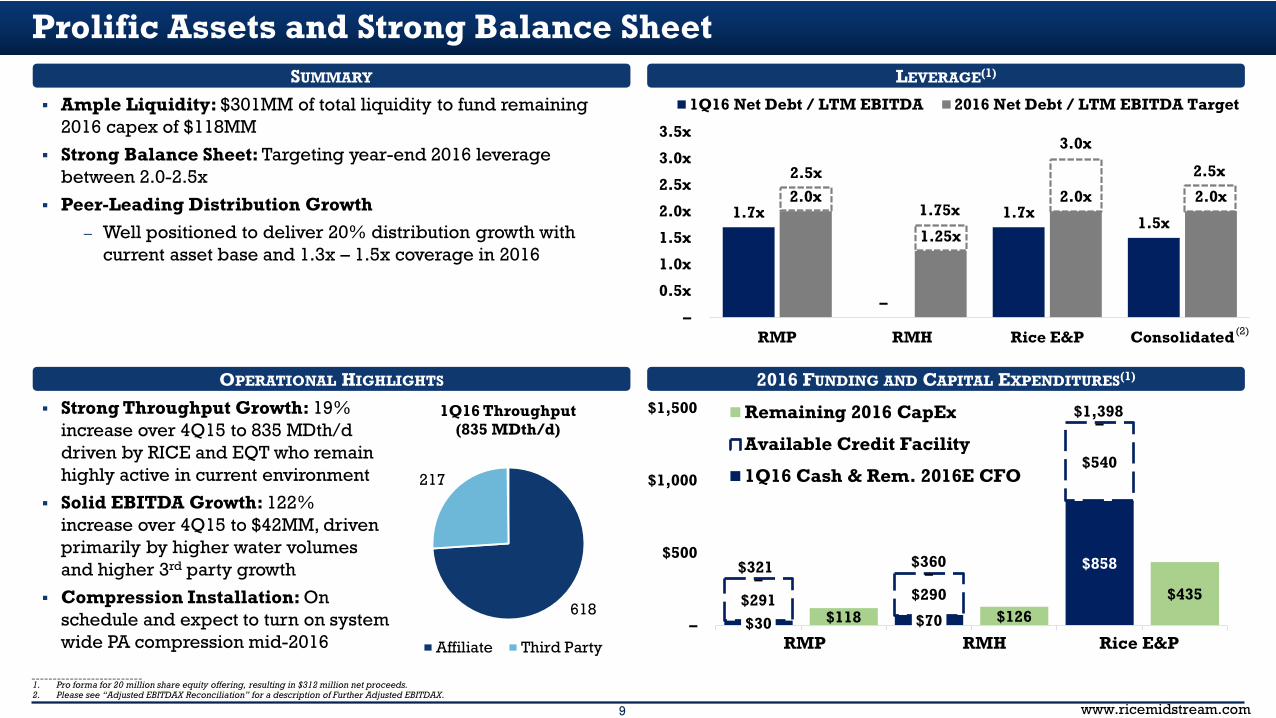
Prolific Assets and Strong Balance Sheet SUMMARY
2016 FUNDING AND CAPITAL EXPENDITURES(1)
Ample Liquidity: $301MM of total liquidity to fund remaining 2016 capex of $118MM
Strong Balance Sheet: Targeting year-end 2016 leverage between 2.0-2.5x
Peer-Leading Distribution Growth– Well positioned to deliver 20% distribution growth with
current asset base and 1.3x – 1.5x coverage in 2016
Rice E&PRMHRMP
LEVERAGE(1)
OPERATIONAL HIGHLIGHTS
Strong Throughput Growth: 19% increase over 4Q15 to 835 MDth/d driven by RICE and EQT who remain highly active in current environment
Solid EBITDA Growth: 122% increase over 4Q15 to $42MM, driven primarily by higher water volumes and higher 3rd party growth
Compression Installation: On schedule and expect to turn on system wide PA compression mid-2016
618
217
1Q16 Throughput(835 MDth/d)
Affiliate Third Party
__________________________1. Pro forma for 20 million share equity offering, resulting in $312 million net proceeds.2. Please see “Adjusted EBITDAX Reconciliation” for a description of Further Adjusted EBITDAX.
1.7x
–
1.7x 1.5x
2.0x
1.25x
2.0x 2.0x
–
0.5x
1.0x
1.5x
2.0x
2.5x
3.0x
3.5x
RMP RMH Rice E&P Consolidated
1Q16 Net Debt / LTM EBITDA 2016 Net Debt / LTM EBITDA Target
(2)
1.75x
3.0x
2.5x2.5x
10 www.ricemidstream.com
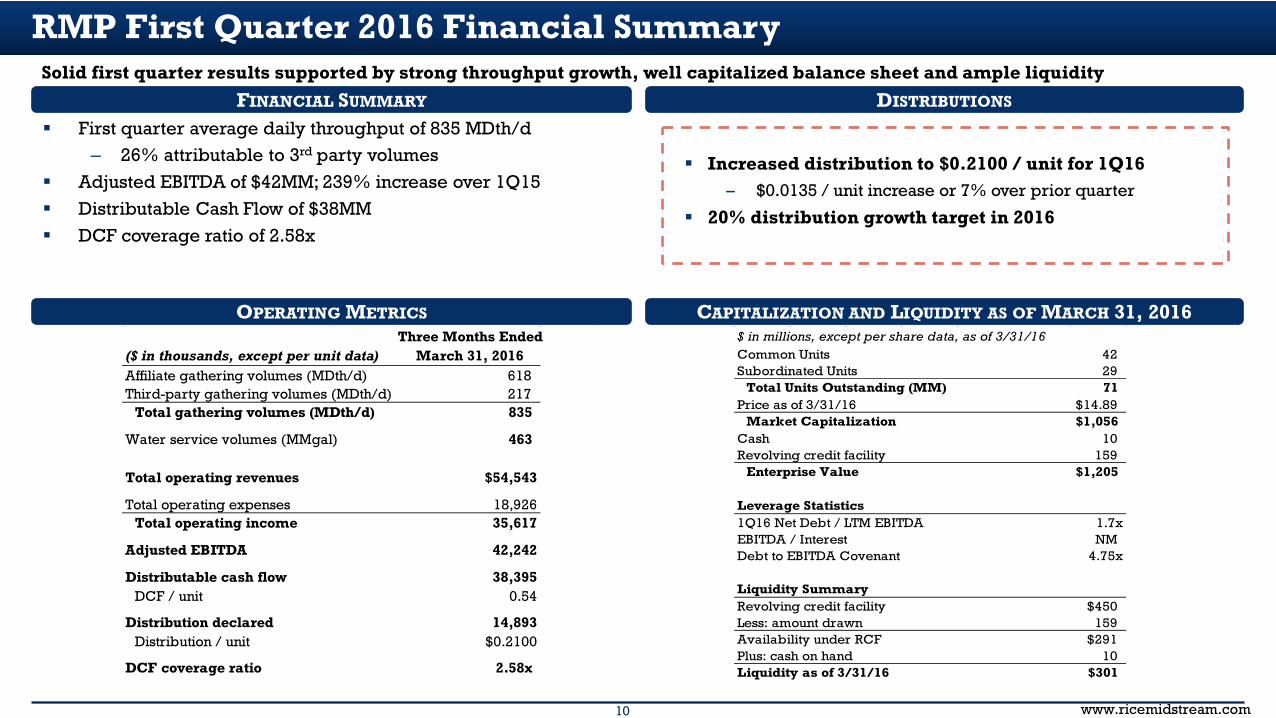
First quarter average daily throughput of 835 MDth/d– 26% attributable to 3rd party volumes
Adjusted EBITDA of $42MM; 239% increase over 1Q15 Distributable Cash Flow of $38MM DCF coverage ratio of 2.58x
$ in millions, except per share data, as of 3/31/16Common Units 42 Subordinated Units 29
Total Units Outstanding (MM) 71 Price as of 3/31/16 $14.89
Market Capitalization $1,056Cash 10 Revolving credit facility 159
Enterprise Value $1,205
Leverage Statistics1Q16 Net Debt / LTM EBITDA 1.7xEBITDA / Interest NMDebt to EBITDA Covenant 4.75x
Liquidity SummaryRevolving credit facility $450Less: amount drawn 159 Availability under RCF $291Plus: cash on hand 10 Liquidity as of 3/31/16 $301
FINANCIAL SUMMARY
RMP First Quarter 2016 Financial SummarySolid first quarter results supported by strong throughput growth, well capitalized balance sheet and ample liquidity
Three Months Ended($ in thousands, except per unit data) March 31, 2016Affiliate gathering volumes (MDth/d) 618 Third-party gathering volumes (MDth/d) 217
Total gathering volumes (MDth/d) 835
Water service volumes (MMgal) 463
Total operating revenues $54,543
Total operating expenses 18,926Total operating income 35,617
Adjusted EBITDA 42,242
Distributable cash flow 38,395DCF / unit 0.54
Distribution declared 14,893Distribution / unit $0.2100
DCF coverage ratio 2.58x
Increased distribution to $0.2100 / unit for 1Q16– $0.0135 / unit increase or 7% over prior quarter
20% distribution growth target in 2016
DISTRIBUTIONS
OPERATING METRICS CAPITALIZATION AND LIQUIDITY AS OF MARCH 31, 2016
11 www.ricemidstream.com
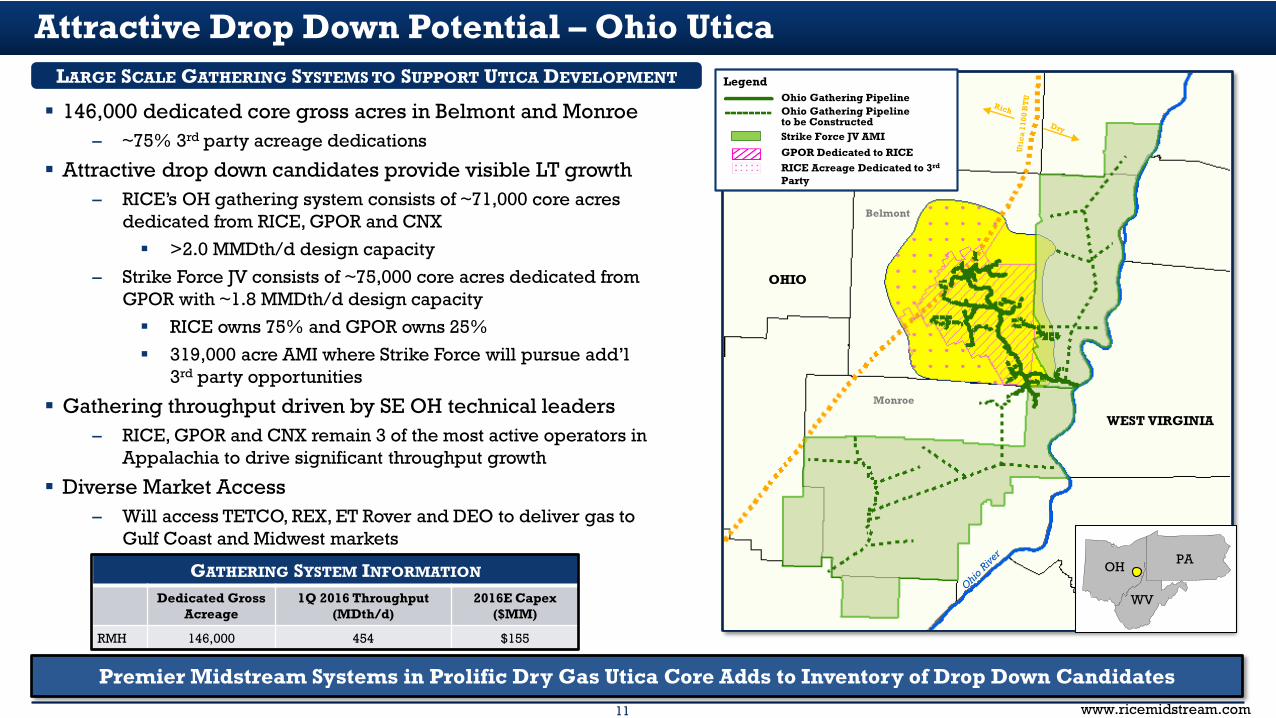
Attractive Drop Down Potential – Ohio Utica
Premier Midstream Systems in Prolific Dry Gas Utica Core Adds to Inventory of Drop Down Candidates
Belmont
Monroe
OHIO
WEST VIRGINIA
OH PA
WV
LegendOhio Gathering Pipeline Ohio Gathering Pipeline to be Constructed
GPOR Dedicated to RICERICE Acreage Dedicated to 3rd
Party
Strike Force JV AMI
146,000 dedicated core gross acres in Belmont and Monroe– ~75% 3rd party acreage dedications
Attractive drop down candidates provide visible LT growth– RICE’s OH gathering system consists of ~71,000 core acres
dedicated from RICE, GPOR and CNX
>2.0 MMDth/d design capacity
– Strike Force JV consists of ~75,000 core acres dedicated from GPOR with ~1.8 MMDth/d design capacity
RICE owns 75% and GPOR owns 25%
319,000 acre AMI where Strike Force will pursue add’l3rd party opportunities
Gathering throughput driven by SE OH technical leaders– RICE, GPOR and CNX remain 3 of the most active operators in
Appalachia to drive significant throughput growth
Diverse Market Access– Will access TETCO, REX, ET Rover and DEO to deliver gas to
Gulf Coast and Midwest markets
LARGE SCALE GATHERING SYSTEMS TO SUPPORT UTICA DEVELOPMENT
GATHERING SYSTEM INFORMATION
Dedicated GrossAcreage
1Q 2016 Throughput (MDth/d)
2016E Capex ($MM)
RMH 146,000 454 $155
12 www.ricemidstream.com
Core Midstream Footprint and Prolific Organic Growth– 114,000 acres(1) dedicated from the most active operators in SW Appalachia; a 33% increase since IPO in Dec. 2014– Strong 2016 expected throughput growth of over 30% driven by high quality, active sponsor – Significant growth expected from contracted 3rd party dedications from top-tier producers
Financial Strength – Clean Balance Sheet and Ample Liquidity– 1Q16 liquidity of $301MM to fund remaining 2016 budget of $118MM– Low leverage of 1.7x in 1Q16 and expect to exit 2016 between 2.0 - 2.5x– Well positioned to deliver 20% distribution growth with current asset base while maintaining 1.3x - 1.5x coverage in 2016
Premier E&P Sponsorship with RICE– Top-tier well results generate single-well returns of approximately 65% at strip pricing(2)
– Healthy balance sheet with 1.7x 1Q16 E&P leverage and ample liquidity of $1.5B to fund remaining 2016 capex (excl. RMP)(3)
– Robust hedges representing 88% remaining 2016 production at a weighted-average HHub price of $3.25/MMBtu– Concentrated core dry gas position + multi-well pad drilling = minimal RMP capex to meaningfully increase gathering throughput
and water delivery volumes
Attractive Drop Down Potential– Strong 2016 expected RMH throughput growth of ~120% and EBITDA growth of ~115% (excl. water services)– ROFO on RICE’s OH gas gathering system – 146,000 dedicated core dry gas acres– Strike Force midstream JV with GPOR including ~75,000 Utica acreage dedication from GPOR – RMH entered into gas gathering agreement with CNX to support their dry gas Utica development on ~13,000 acres in Monroe
County, OH
RMP Well Positioned to Navigate Environment
__________________________1. Excludes ~49K net PA Utica acres dedicated to RMP from RICE and additional PA Utica acreage dedicated to RMP from EQT. Excluding the first 40 MDth/d of RICE’s production from approximately 19,000 gross acres subject to a pre-existing third-party dedication. 2. As of April 21, 2016, leading edge well costs.3. Pro forma for 20 million share equity offering, resulting in $312 million net proceeds.
13 www.ricemidstream.com
RICE Overview
14 www.ricemidstream.com
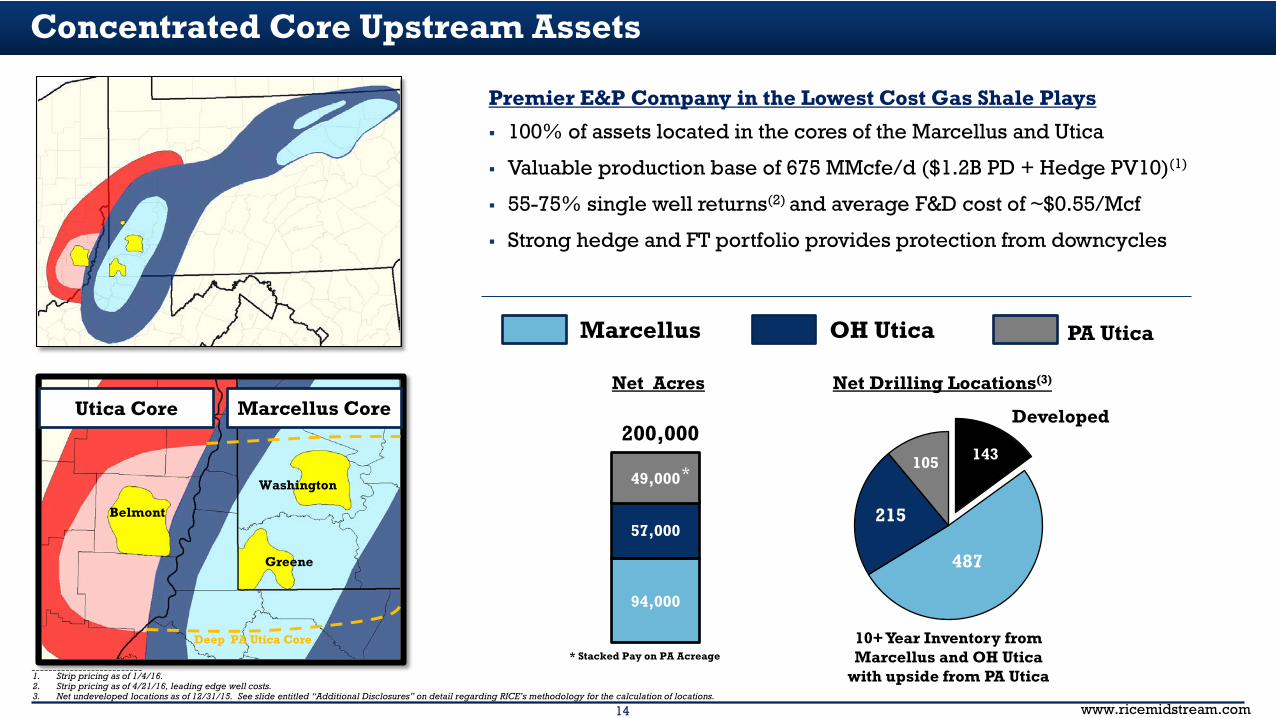
Concentrated Core Upstream Assets
__________________________1. Strip pricing as of 1/4/16.2. Strip pricing as of 4/21/16, leading edge well costs.3. Net undeveloped locations as of 12/31/15. See slide entitled “Additional Disclosures” on detail regarding RICE’s methodology for the calculation of locations.
94,000
57,000
Net AcresUtica Core Marcellus Core
200,000
Marcellus OH Utica
Washington
Greene
Belmont
PA Utica
Deep PA Utica Core
Premier E&P Company in the Lowest Cost Gas Shale Plays
100% of assets located in the cores of the Marcellus and Utica
Valuable production base of 675 MMcfe/d ($1.2B PD + Hedge PV10)(1)
55-75% single well returns(2) and average F&D cost of ~$0.55/Mcf
Strong hedge and FT portfolio provides protection from downcycles
Net Drilling Locations(3)
10+ Year Inventory from Marcellus and OH Utica
with upside from PA Utica
487
215
105 143
Developed
* Stacked Pay on PA Acreage
49,000*
15 www.ricemidstream.com
647 850 835
247
550 454
175
401
894
1,400 1,289
2013 2014 2015 2016E 1Q16RMP RMH
126 274
552 720 675
2013 2014 2015 2016E 1Q16
$0.43 $0.31 $0.26 $0.21
$0.55 $0.38 $0.36 $0.39
$0.38
$0.38 $0.38 $0.40
$0.44
$0.43 $0.34 $0.23
$1.80
$1.50 $1.34
$1.23
2013 2014 2015 1Q16LOE and Taxes FT Gathering G&A
21 36 37
27
9
–
7 12 27
–
21
43 49
54
9
2013 2014 2015 2016E 1Q16PA OH
$2,588
$1,715 $1,450 $1,380
2014 2015 2016E LeadingEdge
$1,507
$1,269 $1,218 $1,150
$925
2013 2014 2015 2016E LeadingEdge
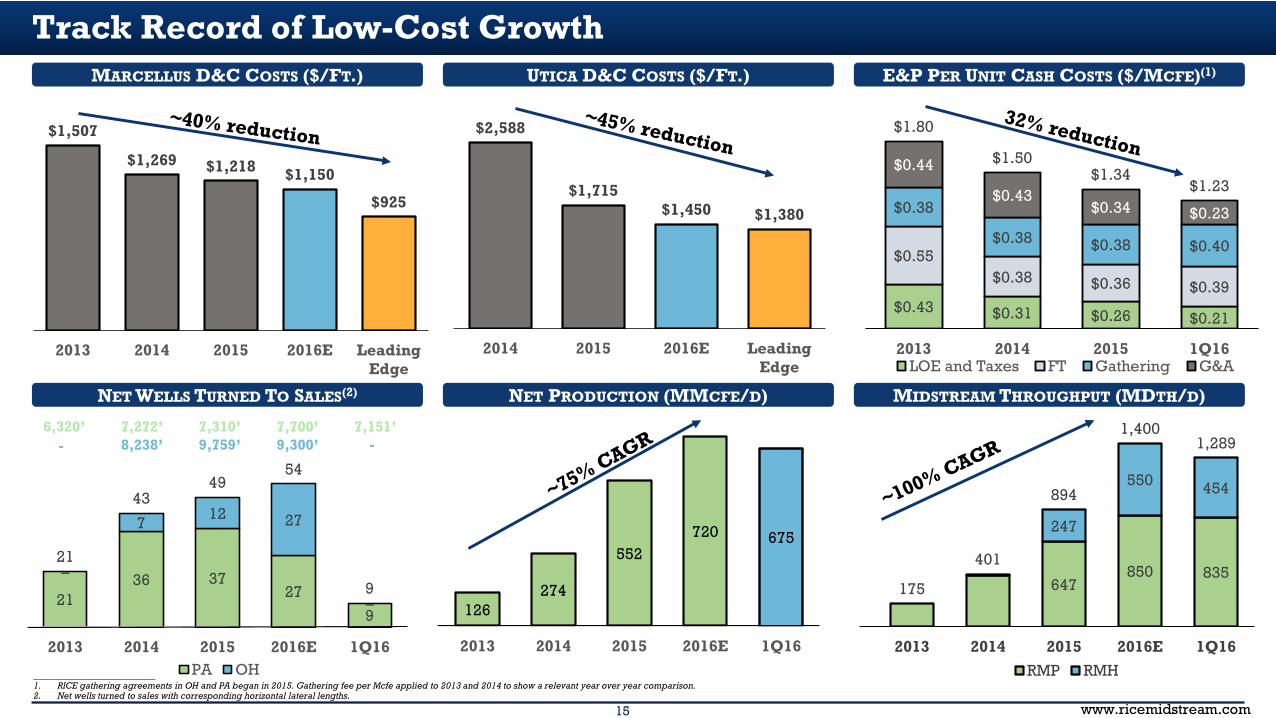
Track Record of Low-Cost GrowthE&P PER UNIT CASH COSTS ($/MCFE)(1)UTICA D&C COSTS ($/FT.)MARCELLUS D&C COSTS ($/FT.)
MIDSTREAM THROUGHPUT (MDTH/D)NET PRODUCTION (MMCFE/D)NET WELLS TURNED TO SALES(2)
__________________________1. RICE gathering agreements in OH and PA began in 2015. Gathering fee per Mcfe applied to 2013 and 2014 to show a relevant year over year comparison.2. Net wells turned to sales with corresponding horizontal lateral lengths.
6,320’ 7,272’ 7,310’ 7,700’ 7,151’8,238’ 9,759’ 9,300’- -
16 www.ricemidstream.com
$858
$70 $30
$540
$290 $291 $435 $126 $118
$1,398
$360 $321
–
$500
$1,000
$1,500 Remaining 2016 CapEx
Available Credit Facility
1Q16 Cash & Rem. 2016E CFO
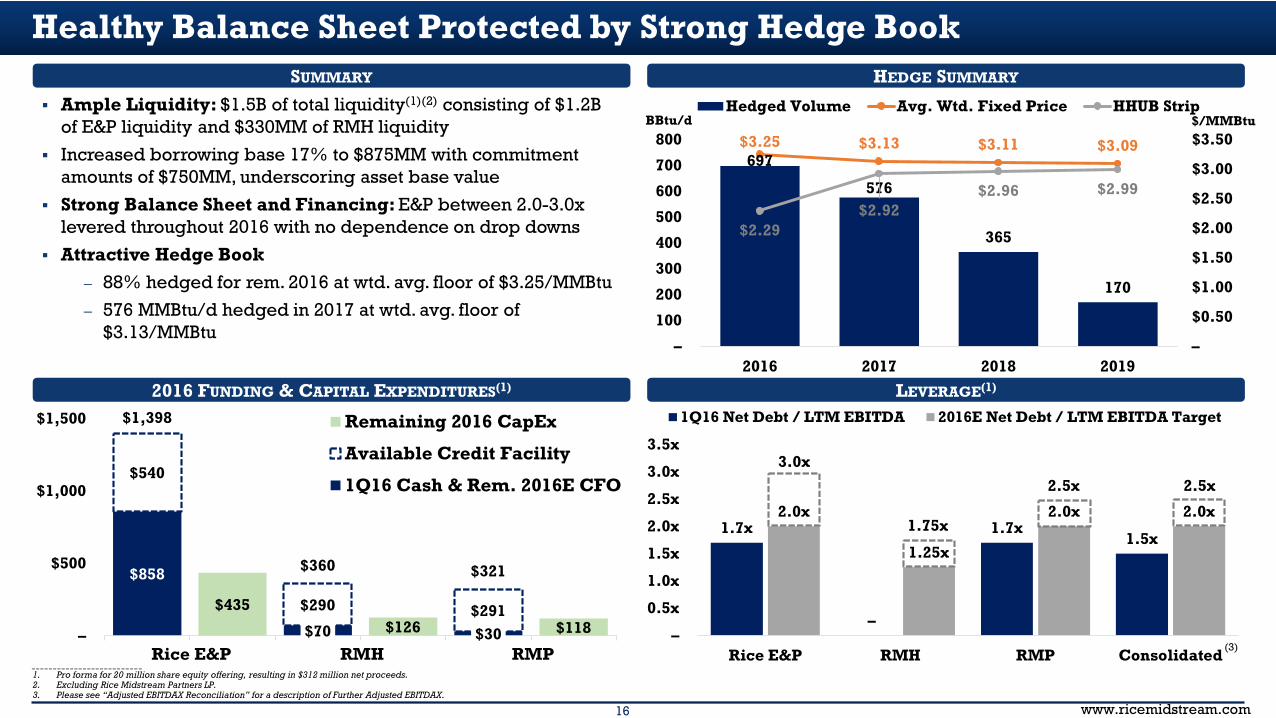
Healthy Balance Sheet Protected by Strong Hedge BookSUMMARY
2016 FUNDING & CAPITAL EXPENDITURES(1)
Ample Liquidity: $1.5B of total liquidity(1)(2) consisting of $1.2B of E&P liquidity and $330MM of RMH liquidity
Increased borrowing base 17% to $875MM with commitment amounts of $750MM, underscoring asset base value
Strong Balance Sheet and Financing: E&P between 2.0-3.0x levered throughout 2016 with no dependence on drop downs
Attractive Hedge Book– 88% hedged for rem. 2016 at wtd. avg. floor of $3.25/MMBtu
– 576 MMBtu/d hedged in 2017 at wtd. avg. floor of $3.13/MMBtu
__________________________1. Pro forma for 20 million share equity offering, resulting in $312 million net proceeds. 2. Excluding Rice Midstream Partners LP.3. Please see “Adjusted EBITDAX Reconciliation” for a description of Further Adjusted EBITDAX.
Rice E&P RMH RMP
HEDGE SUMMARY
LEVERAGE(1)
BBtu/d $/MMBtu
1.7x
–
1.7x 1.5x
2.0x
1.25x
2.0x 2.0x
–
0.5x
1.0x
1.5x
2.0x
2.5x
3.0x
3.5x
Rice E&P RMH RMP Consolidated
1Q16 Net Debt / LTM EBITDA 2016E Net Debt / LTM EBITDA Target
697
576
365
170
$3.25 $3.13 $3.11 $3.09
$2.29 $2.92
$2.96 $2.99
–
$0.50
$1.00
$1.50
$2.00
$2.50
$3.00
$3.50
–
100
200
300
400
500
600
700
800
2016 2017 2018 2019
Hedged Volume Avg. Wtd. Fixed Price HHUB Strip
(3)
1.75x
3.0x2.5x 2.5x
17 www.ricemidstream.com
25%
47%
77%
114%
23%
49%
83%
124%
–
25%
50%
75%
100%
125%
150%
$2.50 $3.00 $3.50 $4.00Marcellus Utica
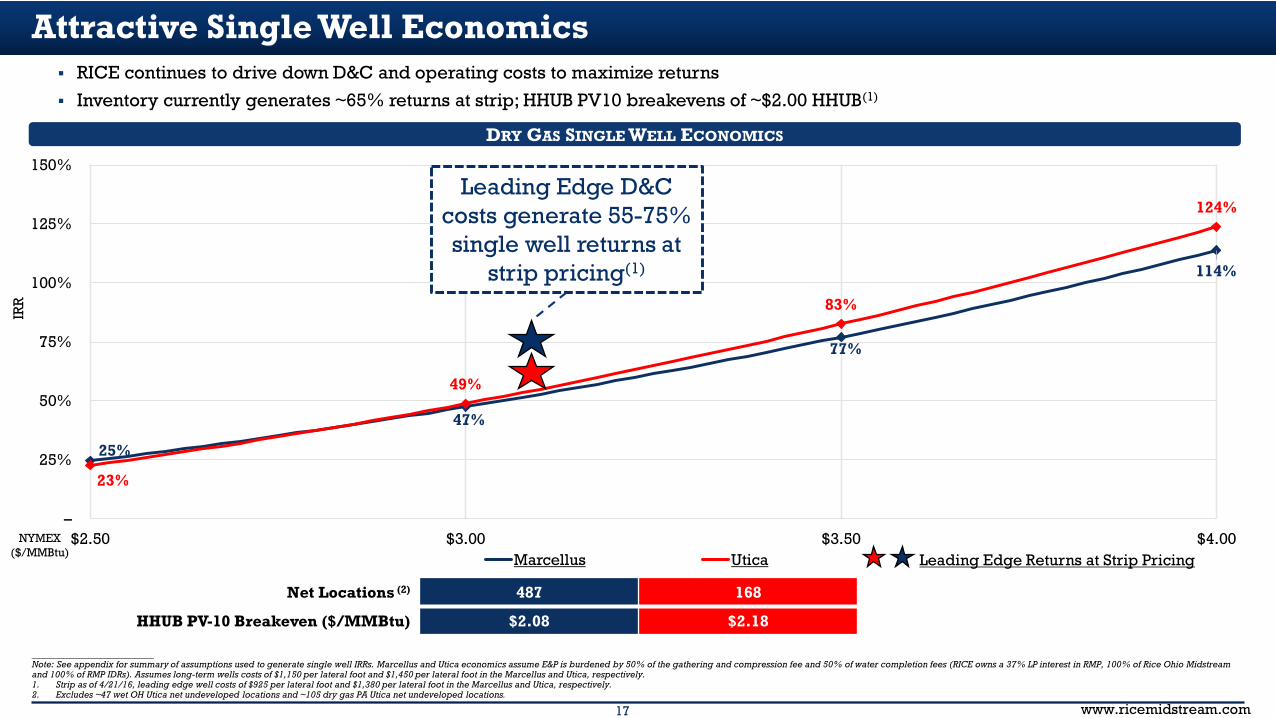
Attractive Single Well Economics
Net Locations (2) 487 168
HHUB PV-10 Breakeven ($/MMBtu) $2.08 $2.18
DRY GAS SINGLE WELL ECONOMICS
RICE continues to drive down D&C and operating costs to maximize returns
Inventory currently generates ~65% returns at strip; HHUB PV10 breakevens of ~$2.00 HHUB(1)
__________________________Note: See appendix for summary of assumptions used to generate single well IRRs. Marcellus and Utica economics assume E&P is burdened by 50% of the gathering and compression fee and 50% of water completion fees (RICE owns a 37% LP interest in RMP, 100% of Rice Ohio Midstream and 100% of RMP IDRs). Assumes long-term wells costs of $1,150 per lateral foot and $1,450 per lateral foot in the Marcellus and Utica, respectively.1. Strip as of 4/21/16, leading edge well costs of $925 per lateral foot and $1,380 per lateral foot in the Marcellus and Utica, respectively.2. Excludes ~47 wet OH Utica net undeveloped locations and ~105 dry gas PA Utica net undeveloped locations.
NYMEX ($/MMBtu)
IRR
Leading Edge D&C costs generate 55-75% single well returns at
strip pricing(1)
Leading Edge Returns at Strip Pricing
18 www.ricemidstream.com
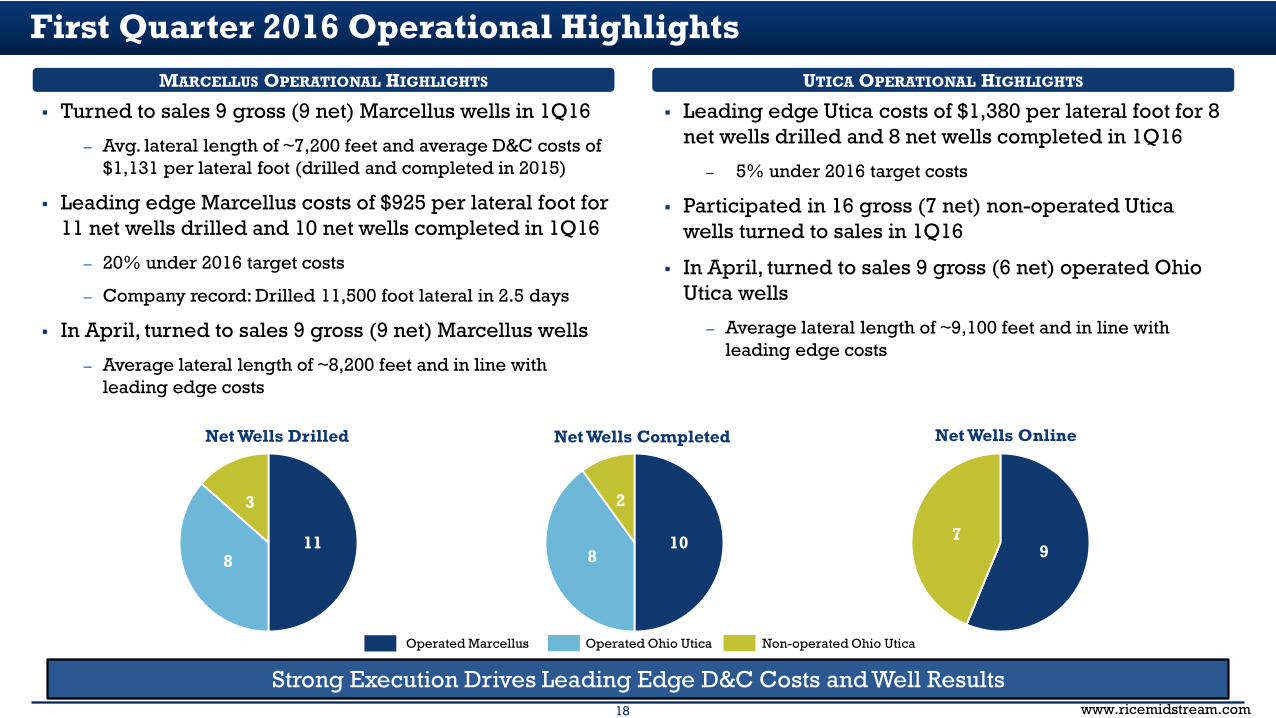
Turned to sales 9 gross (9 net) Marcellus wells in 1Q16
– Avg. lateral length of ~7,200 feet and average D&C costs of $1,131 per lateral foot (drilled and completed in 2015)
Leading edge Marcellus costs of $925 per lateral foot for 11 net wells drilled and 10 net wells completed in 1Q16
– 20% under 2016 target costs
– Company record: Drilled 11,500 foot lateral in 2.5 days
In April, turned to sales 9 gross (9 net) Marcellus wells
– Average lateral length of ~8,200 feet and in line with leading edge costs
108
2
Net Wells Completed
First Quarter 2016 Operational Highlights
97
Net Wells Online
Operated Marcellus Operated Ohio Utica Non-operated Ohio Utica
MARCELLUS OPERATIONAL HIGHLIGHTS
118
3
Net Wells Drilled
UTICA OPERATIONAL HIGHLIGHTS
Leading edge Utica costs of $1,380 per lateral foot for 8 net wells drilled and 8 net wells completed in 1Q16
– 5% under 2016 target costs
Participated in 16 gross (7 net) non-operated Utica wells turned to sales in 1Q16
In April, turned to sales 9 gross (6 net) operated Ohio Utica wells
– Average lateral length of ~9,100 feet and in line with leading edge costs
Strong Execution Drives Leading Edge D&C Costs and Well Results
19 www.ricemidstream.com
Three Months Ended
Total net production (MMcfe/d) 675 % Gas 99%% Operated 88%% Marcellus 70%
Actual ($MM) $ / McfeNYMEX Henry Hub price ($/MMBtu) $2.09
Average basis impact ($/MMBtu) ($0.21)Firm transportation fuel & variables ($/MMBtu) ($0.14)Btu uplift (MMBtu/Mcf) $0.09
Pre-hedge realized price ($/Mcf) $1.83Realized hedging gain ($/Mcf) $1.05
Post-hedge realized price ($/Mcf) $2.88
Total operating revenues $140 $2.28Realized hedging gain $64 $1.05
Total operating revenues and hedging gain $204 $3.33
Lease operating $11 $0.18Gathering, compression and transportation $28 $0.46Production taxes and impact fees $2 $0.03General and administrative $20 $0.33Depletion, depreciation and amortization $79 $1.29
Adjusted EBITDAX $109Further Adjusted EBITDAX(1) $151
March 31, 2016
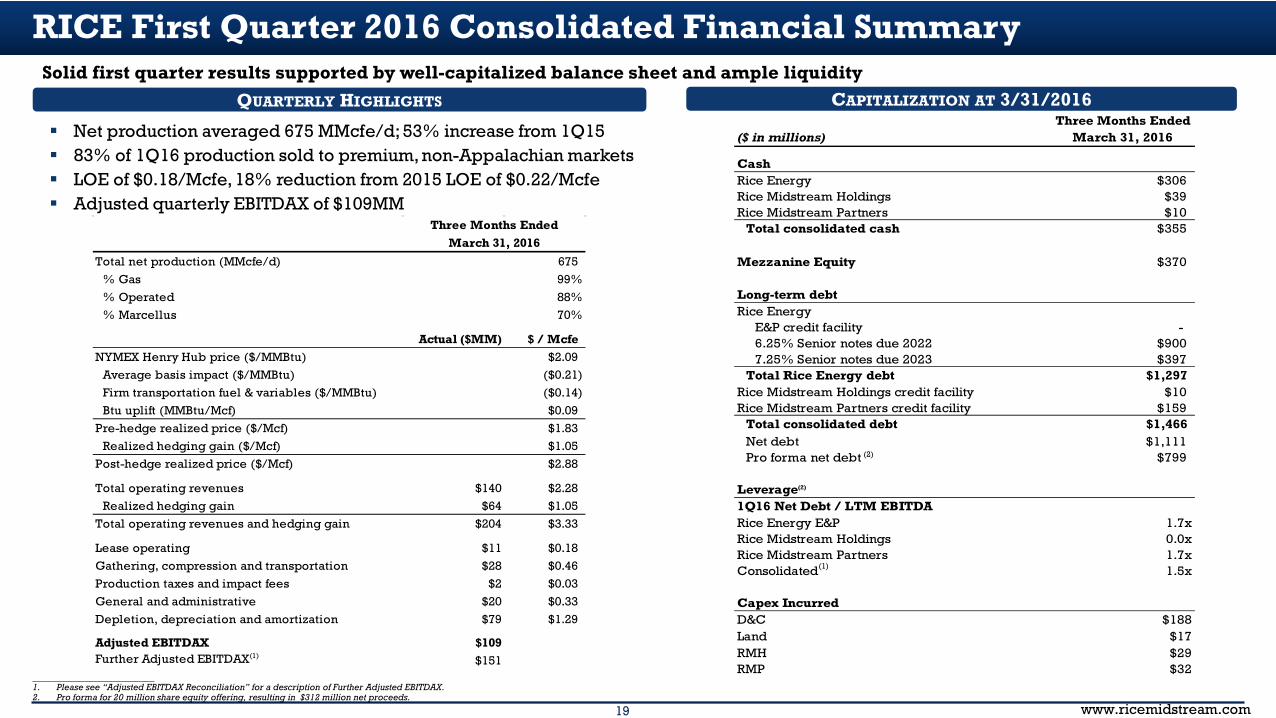
Net production averaged 675 MMcfe/d; 53% increase from 1Q15 83% of 1Q16 production sold to premium, non-Appalachian markets LOE of $0.18/Mcfe, 18% reduction from 2015 LOE of $0.22/Mcfe Adjusted quarterly EBITDAX of $109MM
RICE First Quarter 2016 Consolidated Financial Summary Solid first quarter results supported by well-capitalized balance sheet and ample liquidity
Three Months Ended($ in millions) March 31, 2016
CashRice Energy $306Rice Midstream Holdings $39Rice Midstream Partners $10
Total consolidated cash $355
Mezzanine Equity $370
Long-term debtRice Energy
E&P credit facility -6.25% Senior notes due 2022 $9007.25% Senior notes due 2023 $397
Total Rice Energy debt $1,297Rice Midstream Holdings credit facility $10Rice Midstream Partners credit facility $159
Total consolidated debt $1,466Net debt $1,111Pro forma net debt $799
Leverage(2)
1Q16 Net Debt / LTM EBITDARice Energy E&P 1.7xRice Midstream Holdings 0.0xRice Midstream Partners 1.7xConsolidated 1.5x
Capex IncurredD&C $188Land $17RMH $29RMP $32
QUARTERLY HIGHLIGHTS
__________________________1. Please see “Adjusted EBITDAX Reconciliation” for a description of Further Adjusted EBITDAX.2. Pro forma for 20 million share equity offering, resulting in $312 million net proceeds.
CAPITALIZATION AT 3/31/2016
(2)
(1)
20 www.ricemidstream.com
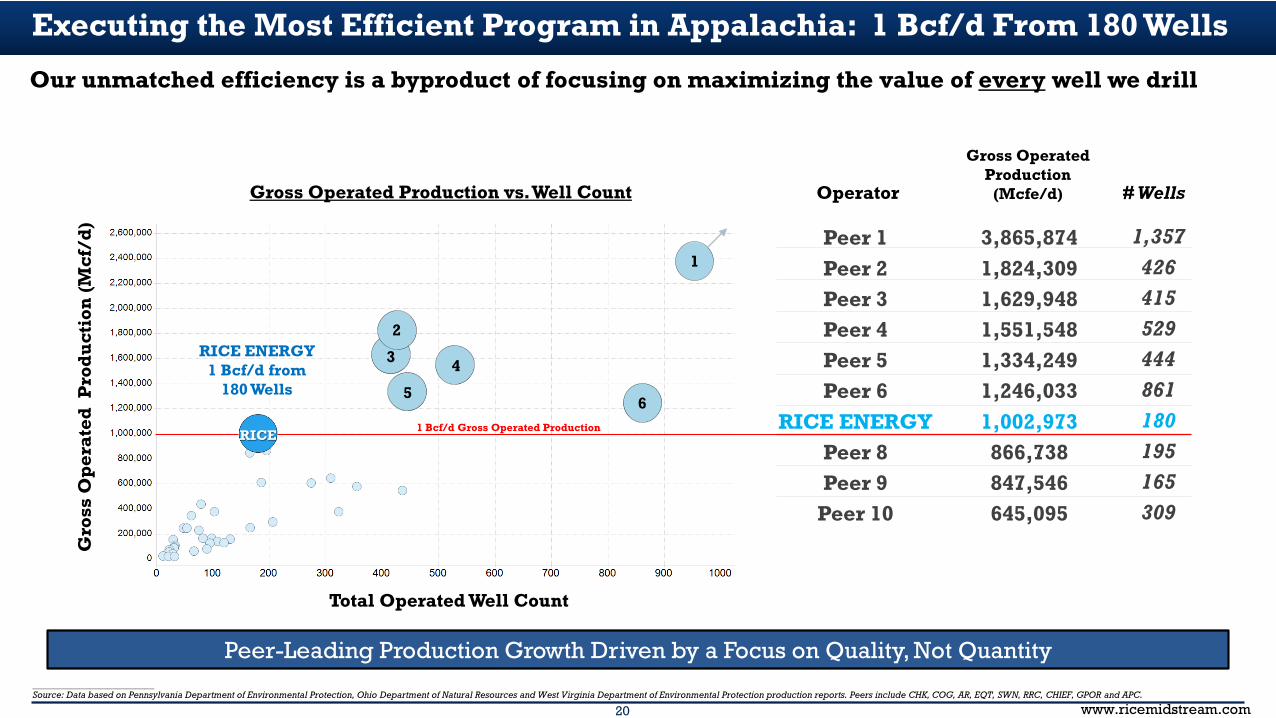
Executing the Most Efficient Program in Appalachia: 1 Bcf/d From 180 Wells
Peer-Leading Production Growth Driven by a Focus on Quality, Not Quantity__________________________Source: Data based on Pennsylvania Department of Environmental Protection, Ohio Department of Natural Resources and West Virginia Department of Environmental Protection production reports. Peers include CHK, COG, AR, EQT, SWN, RRC, CHIEF, GPOR and APC.
Gross Operated Production vs. Well Count
Gro
ss O
per
ated
Pro
du
ctio
n (M
cf/d
)
Total Operated Well Count
1
6
RICE
1 Bcf/d Gross Operated Production
2
3 4
5
RICE
RICE ENERGY1 Bcf/d from
180 Wells
Peer 1Peer 2Peer 3Peer 4Peer 5Peer 6
RICE ENERGYPeer 8Peer 9
Peer 10
Operator
Gross Operated Production
(Mcfe/d) # Wells
3,865,8741,824,3091,629,9481,551,5481,334,2491,246,0331,002,973866,738847,546645,095
1,357426415529444861180195165309
Our unmatched efficiency is a byproduct of focusing on maximizing the value of every well we drill
21 www.ricemidstream.com
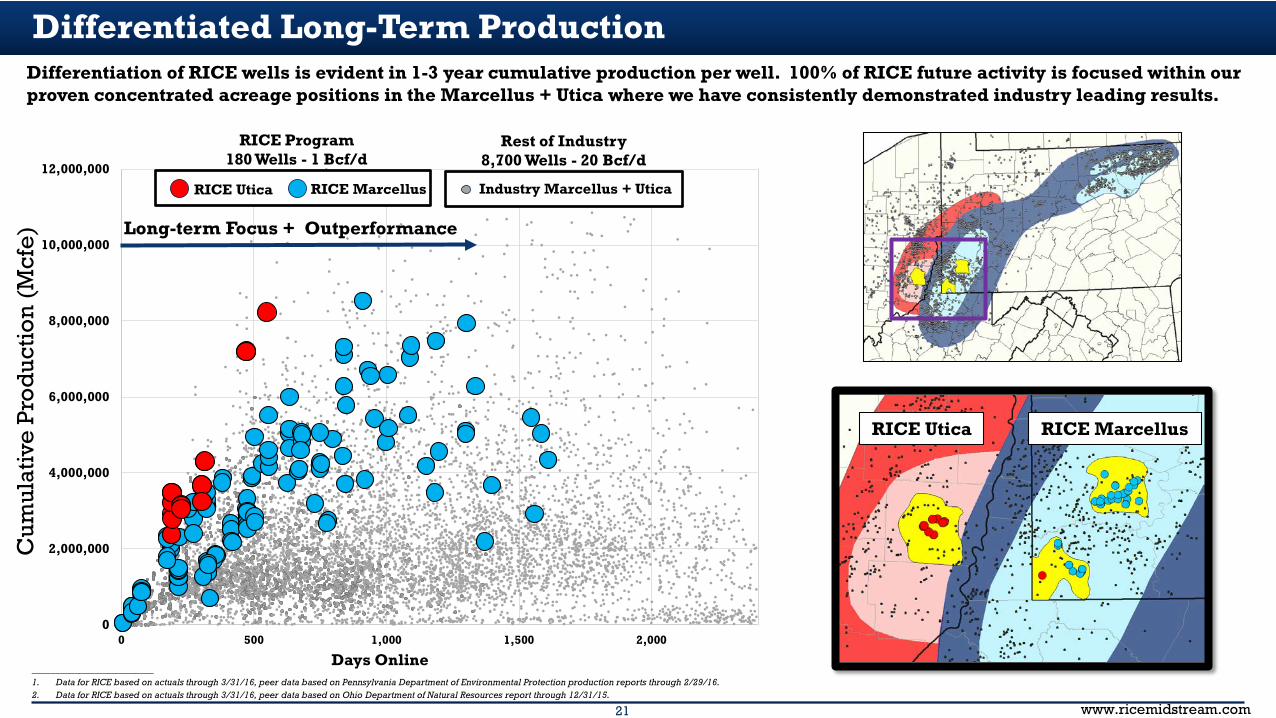
Differentiated Long-Term Production
__________________________1. Data for RICE based on actuals through 3/31/16, peer data based on Pennsylvania Department of Environmental Protection production reports through 2/29/16.2. Data for RICE based on actuals through 3/31/16, peer data based on Ohio Department of Natural Resources report through 12/31/15.
RICE MarcellusRICE Utica
Differentiation of RICE wells is evident in 1-3 year cumulative production per well. 100% of RICE future activity is focused within our proven concentrated acreage positions in the Marcellus + Utica where we have consistently demonstrated industry leading results.
0
2,000,000
4,000,000
6,000,000
8,000,000
10,000,000
12,000,000
0 500 1,000 1,500 2,000
Cum
ulat
ive
Prod
uctio
n (M
cfe)
Days Online
RICE Utica RICE Marcellus Industry Marcellus + Utica
RICE Program180 Wells - 1 Bcf/d
Rest of Industry8,700 Wells - 20 Bcf/d
Long-term Focus + Outperformance
22 www.ricemidstream.com
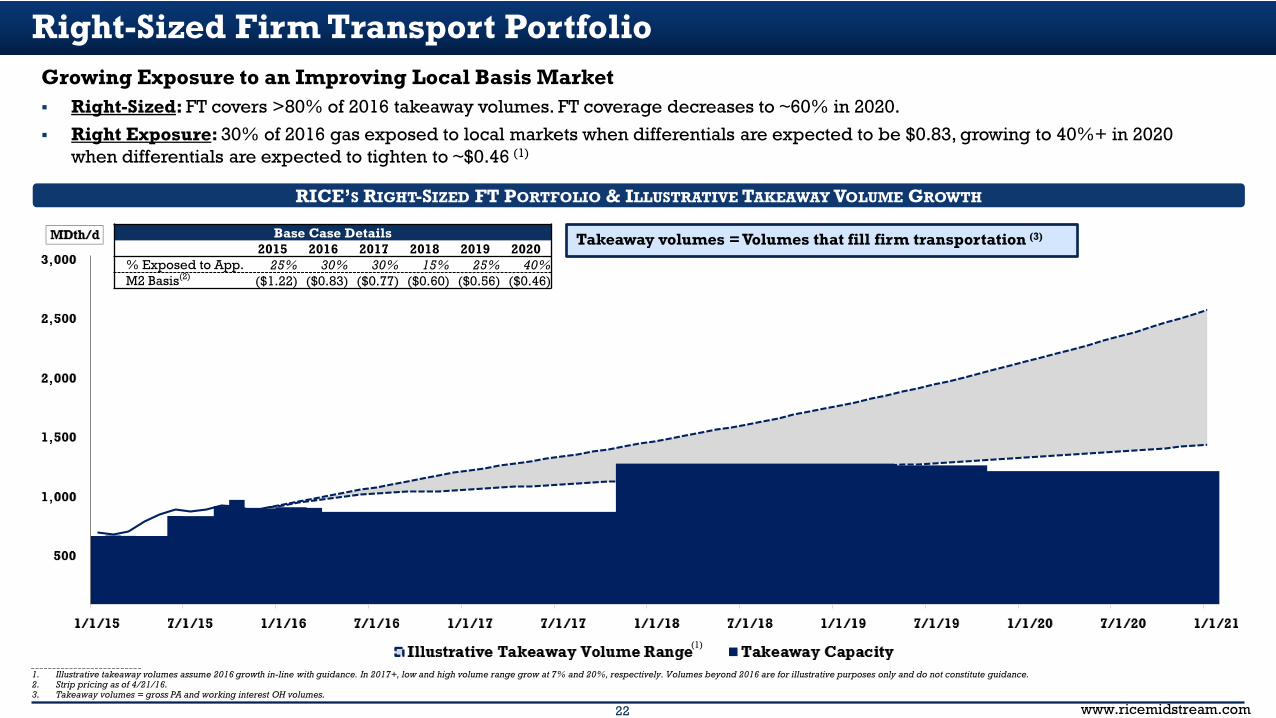
Right-Sized Firm Transport PortfolioGrowing Exposure to an Improving Local Basis Market Right-Sized: FT covers >80% of 2016 takeaway volumes. FT coverage decreases to ~60% in 2020.
Right Exposure: 30% of 2016 gas exposed to local markets when differentials are expected to be $0.83, growing to 40%+ in 2020 when differentials are expected to tighten to ~$0.46 (1)
RICE’S RIGHT-SIZED FT PORTFOLIO & ILLUSTRATIVE TAKEAWAY VOLUME GROWTH
–
500
1,000
1,500
2,000
2,500
3,000
1/1/15 7/1/15 1/1/16 7/1/16 1/1/17 7/1/17 1/1/18 7/1/18 1/1/19 7/1/19 1/1/20 7/1/20 1/1/21
$ / MMbtuMdth/d
Illustrative Takeaway Volume Range Takeaway Capacity
Base Case Details2015 2016 2017 2018 2019 2020
% Exposed to App. 25% 30% 30% 15% 25% 40% M2 Basis(2) ($1.22) ($0.83) ($0.77) ($0.60) ($0.56) ($0.46)
Takeaway volumes = Volumes that fill firm transportation (3)
__________________________1. Illustrative takeaway volumes assume 2016 growth in-line with guidance. In 2017+, low and high volume range grow at 7% and 20%, respectively. Volumes beyond 2016 are for illustrative purposes only and do not constitute guidance.2. Strip pricing as of 4/21/16.3. Takeaway volumes = gross PA and working interest OH volumes.
(1)(1)
23 www.ricemidstream.com
Appendix
24 www.ricemidstream.com
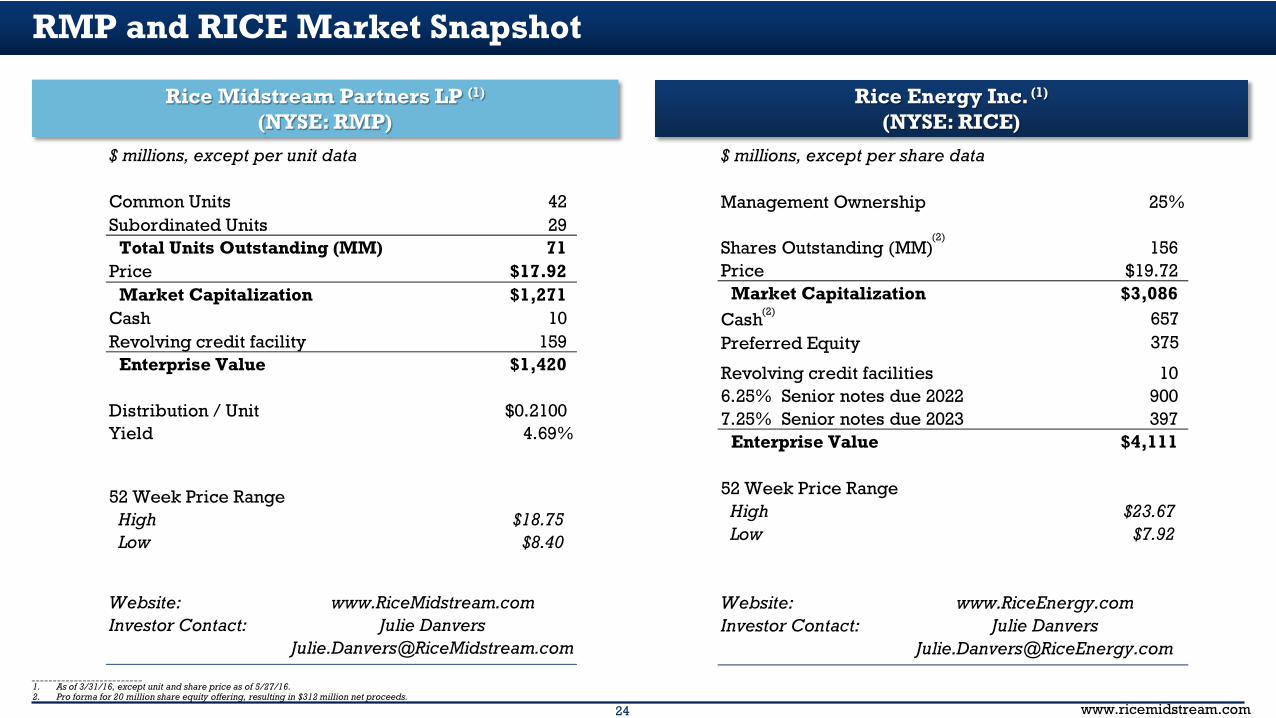
$ millions, except per share data
Management Ownership 25%
Shares Outstanding (MM) 156Price $19.72
Market Capitalization $3,086Cash 657 Preferred Equity 375
Revolving credit facilities 106.25% Senior notes due 2022 9007.25% Senior notes due 2023 397
Enterprise Value $4,111
52 Week Price RangeHigh $23.67Low $7.92
Website: www.RiceEnergy.comInvestor Contact: Julie Danvers
$ millions, except per unit data
Common Units 42 Subordinated Units 29
Total Units Outstanding (MM) 71 Price $17.92
Market Capitalization $1,271Cash 10Revolving credit facility 159
Enterprise Value $1,420
Distribution / Unit $0.2100Yield 4.69%
52 Week Price RangeHigh $18.75Low $8.40
Website: www.RiceMidstream.comInvestor Contact:
[email protected] Danvers
RMP and RICE Market Snapshot
Rice Energy Inc.(1)
(NYSE: RICE)
__________________________1. As of 3/31/16, except unit and share price as of 5/27/16.2. Pro forma for 20 million share equity offering, resulting in $312 million net proceeds.
(2)
(2)
Rice Midstream Partners LP (1)
(NYSE: RMP)
25 www.ricemidstream.com
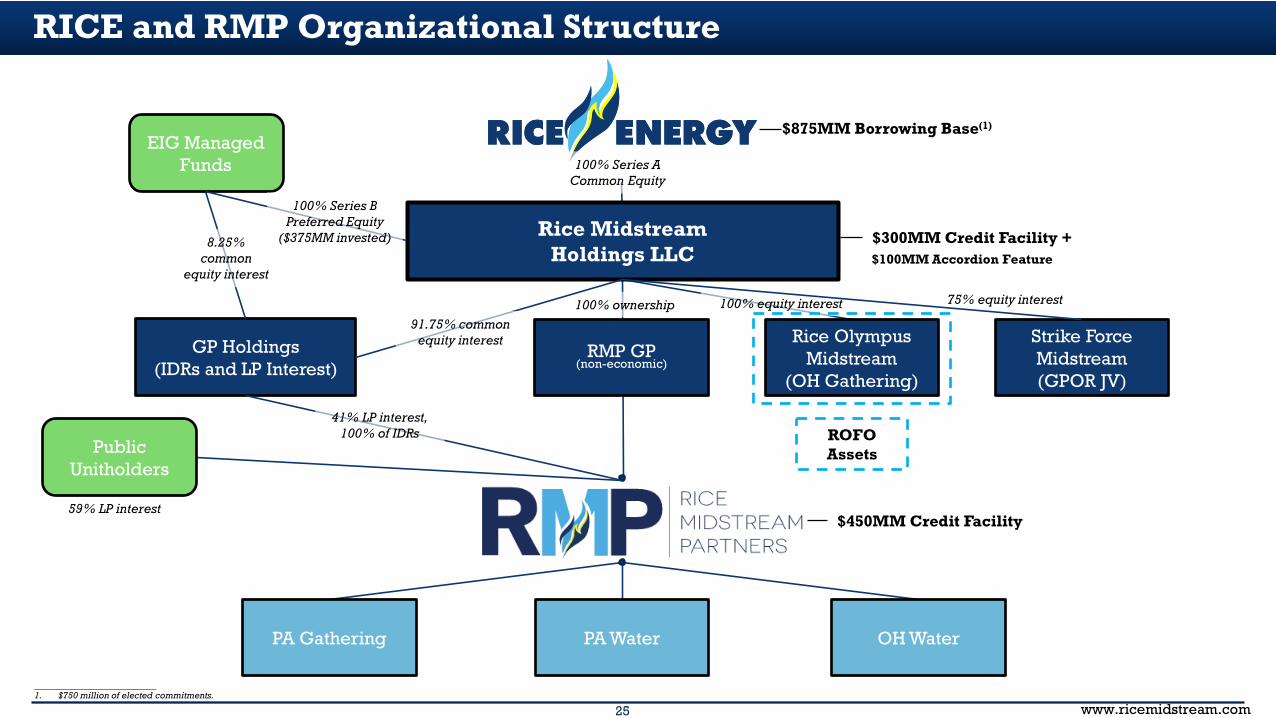
RICE and RMP Organizational Structure
DE
PA Water
Rice Olympus Midstream
(OH Gathering)
59% LP interest
Rice Midstream Holdings LLC
Public Unitholders
Strike Force Midstream (GPOR JV)
ROFOAssets
OH WaterPA Gathering
$300MM Credit Facility +
$450MM Credit Facility
$875MM Borrowing Base(1)
$100MM Accordion Feature
EIG Managed Funds
GP Holdings(IDRs and LP Interest)
8.25% common
equity interest
100% Series B Preferred Equity
($375MM invested)
75% equity interest
100% Series A Common Equity
41% LP interest, 100% of IDRs
RMP GP(non-economic)
100% equity interest100% ownership91.75% common
equity interest
__________________________1. $750 million of elected commitments.
26 www.ricemidstream.com
$425
$1,260 $470
$830
–
$500
$895
$2,590
–
$500
$1,000
$1,500
$2,000
$2,500
$3,000
2016E 2018E
RMH Current and Future Value
OH Midstream LP Units IDRs
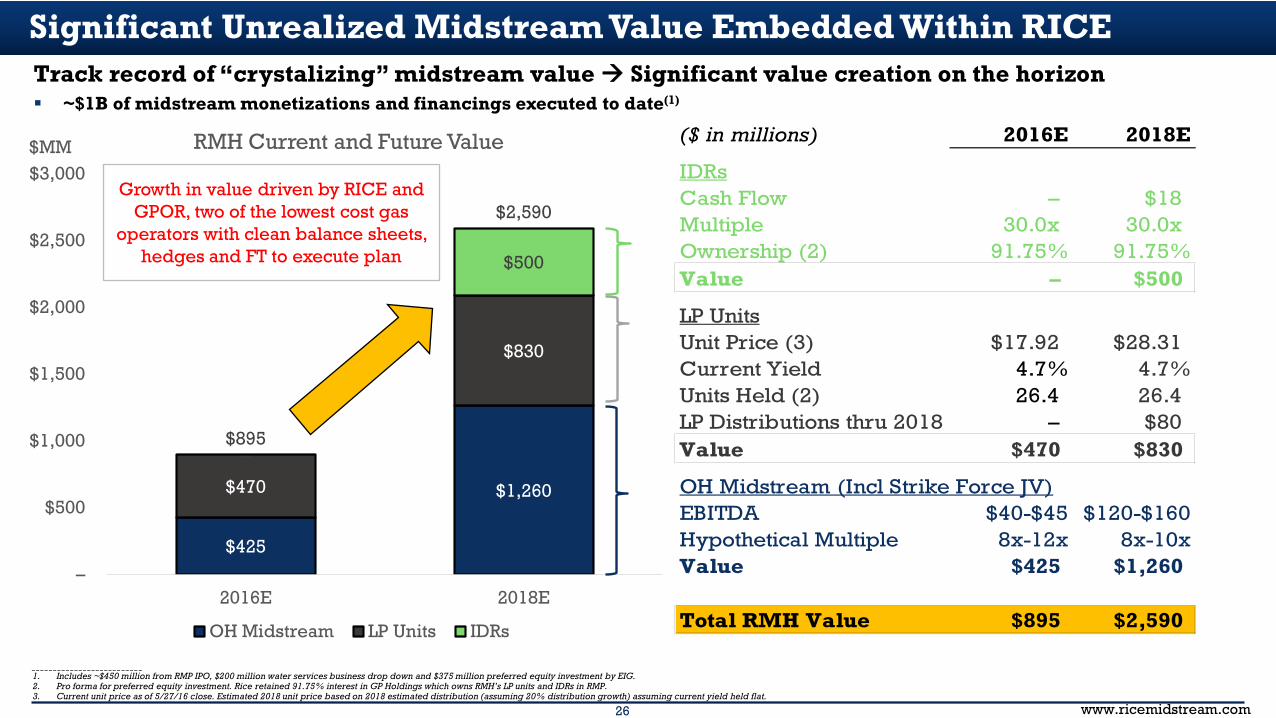
Significant Unrealized Midstream Value Embedded Within RICE
__________________________1. Includes ~$450 million from RMP IPO, $200 million water services business drop down and $375 million preferred equity investment by EIG.2. Pro forma for preferred equity investment. Rice retained 91.75% interest in GP Holdings which owns RMH’s LP units and IDRs in RMP.3. Current unit price as of 5/27/16 close. Estimated 2018 unit price based on 2018 estimated distribution (assuming 20% distribution growth) assuming current yield held flat.
Track record of “crystalizing” midstream value Significant value creation on the horizon ~$1B of midstream monetizations and financings executed to date(1)
Growth in value driven by RICE and GPOR, two of the lowest cost gas
operators with clean balance sheets, hedges and FT to execute plan
$MM($ in millions) 2016E 2018E
IDRsCash Flow – $18Multiple 30.0x 30.0xOwnership (2) 91.75% 91.75%Value – $500
LP UnitsUnit Price (3) $17.92 $28.31Current Yield 4.7% 4.7%Units Held (2) 26.4 26.4LP Distributions thru 2018 – $80Value $470 $830
OH Midstream (Incl Strike Force JV)EBITDA $40-$45 $120-$160Hypothetical Multiple 8x-12x 8x-10xValue $425 $1,260
Total RMH Value $895 $2,590
27 www.ricemidstream.com
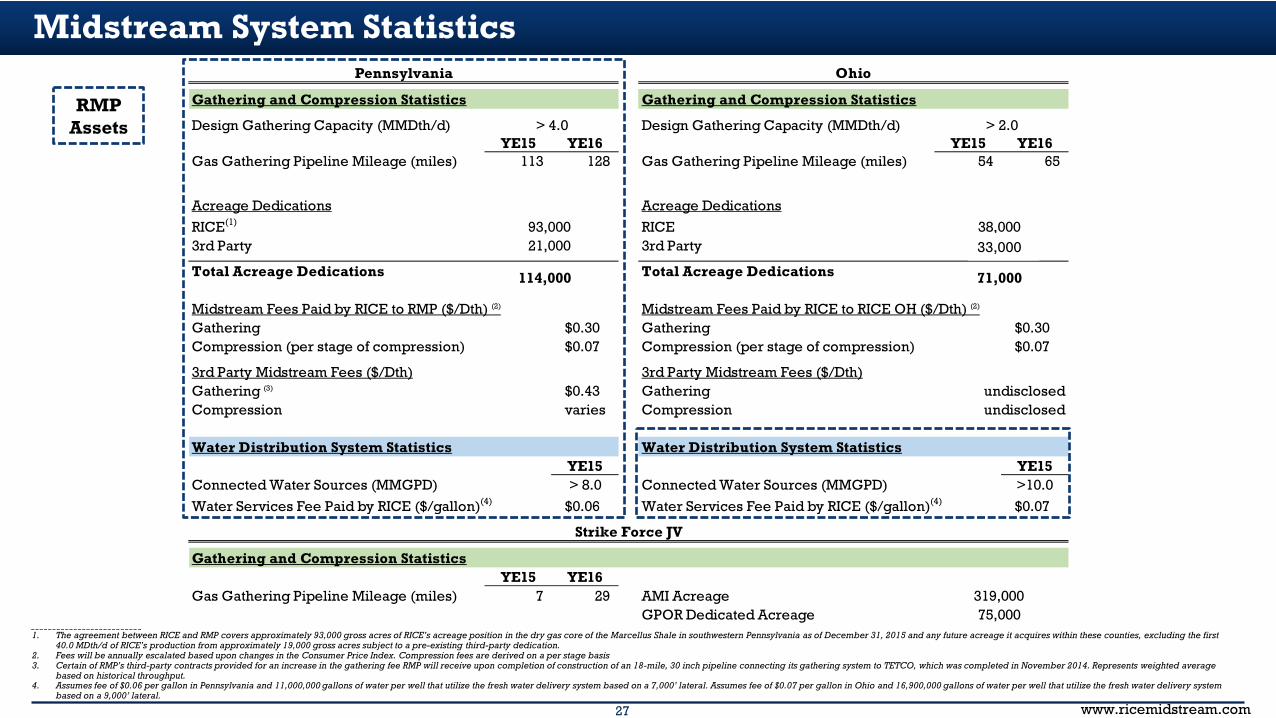
Pennsylvania Ohio
Gathering and Compression Statistics Gathering and Compression Statistics
Design Gathering Capacity (MMDth/d) > 4.0 Design Gathering Capacity (MMDth/d) > 2.0YE15 YE16 YE15 YE16
Gas Gathering Pipeline Mileage (miles) 113 128 Gas Gathering Pipeline Mileage (miles) 54 65
Acreage Dedications Acreage DedicationsRICE(1) 93,000 RICE 38,0003rd Party 21,000 3rd Party 20,000
Total Acreage Dedications 114,000 Total Acreage Dedications 58,000
Midstream Fees Paid by RICE to RMP ($/Dth) (2) Midstream Fees Paid by RICE to RICE OH ($/Dth) (2)
Gathering $0.30 Gathering $0.30Compression (per stage of compression) $0.07 Compression (per stage of compression) $0.07
3rd Party Midstream Fees ($/Dth) 3rd Party Midstream Fees ($/Dth)Gathering (3) $0.43 Gathering undisclosedCompression varies Compression undisclosed
Water Distribution System Statistics Water Distribution System StatisticsYE15 YE15
Connected Water Sources (MMGPD) > 8.0 Connected Water Sources (MMGPD) >10.0Water Services Fee Paid by RICE ($/gallon)(4) $0.06 Water Services Fee Paid by RICE ($/gallon)(4) $0.07
Strike Force JV
Gathering and Compression StatisticsYE15 YE16
Gas Gathering Pipeline Mileage (miles) 7 29 AMI Acreage 319,000GPOR Dedicated Acreage 75,000
Midstream System Statistics
__________________________1. The agreement between RICE and RMP covers approximately 93,000 gross acres of RICE’s acreage position in the dry gas core of the Marcellus Shale in southwestern Pennsylvania as of December 31, 2015 and any future acreage it acquires within these counties, excluding the first
40.0 MDth/d of RICE’s production from approximately 19,000 gross acres subject to a pre-existing third-party dedication.2. Fees will be annually escalated based upon changes in the Consumer Price Index. Compression fees are derived on a per stage basis3. Certain of RMP’s third-party contracts provided for an increase in the gathering fee RMP will receive upon completion of construction of an 18-mile, 30 inch pipeline connecting its gathering system to TETCO, which was completed in November 2014. Represents weighted average
based on historical throughput.4. Assumes fee of $0.06 per gallon in Pennsylvania and 11,000,000 gallons of water per well that utilize the fresh water delivery system based on a 7,000’ lateral. Assumes fee of $0.07 per gallon in Ohio and 16,900,000 gallons of water per well that utilize the fresh water delivery system
based on a 9,000’ lateral.
RMP Assets
33,000
71,000114,000
28 www.ricemidstream.com
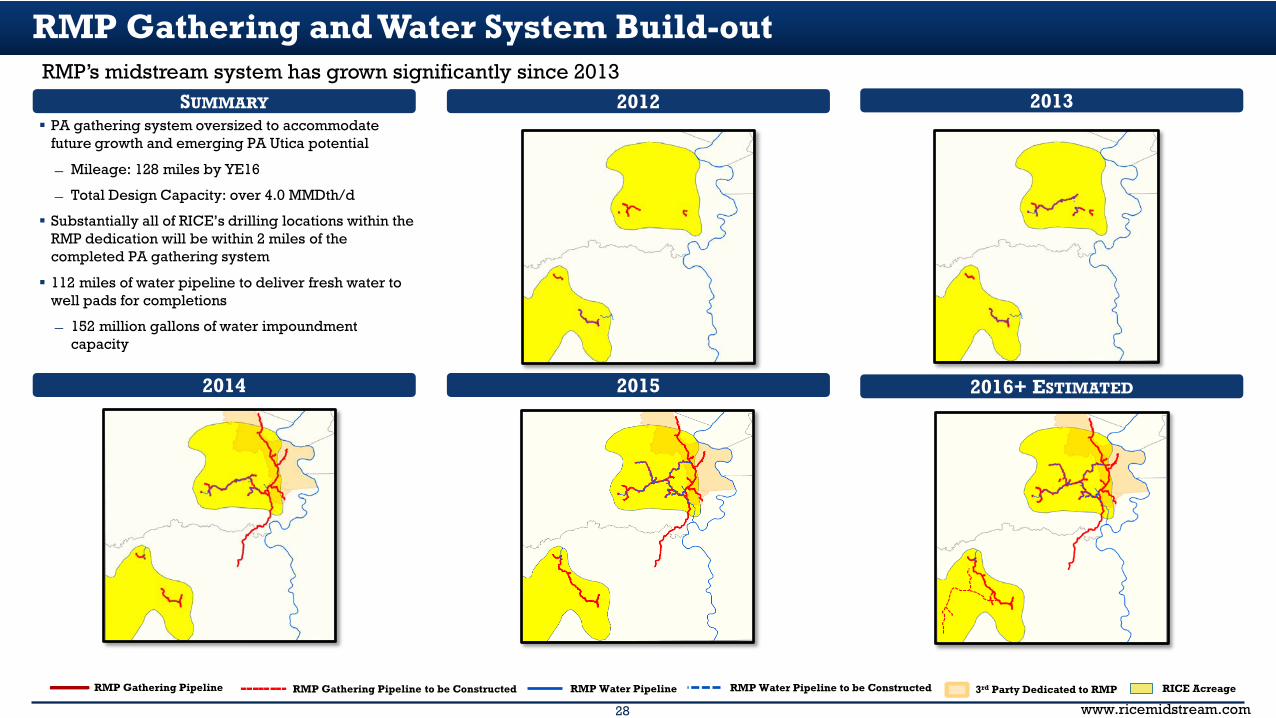
RMP Gathering and Water System Build-out
PA gathering system oversized to accommodate future growth and emerging PA Utica potential
Mileage: 128 miles by YE16
Total Design Capacity: over 4.0 MMDth/d
Substantially all of RICE’s drilling locations within the RMP dedication will be within 2 miles of the completed PA gathering system
112 miles of water pipeline to deliver fresh water to well pads for completions
152 million gallons of water impoundment capacity
SUMMARY
RMP’s midstream system has grown significantly since 20132013
2014 2015
RMP Gathering Pipeline RMP Gathering Pipeline to be Constructed RMP Water Pipeline RMP Water Pipeline to be Constructed RICE Acreage
2012
3rd Party Dedicated to RMP
2016+ ESTIMATED
29 www.ricemidstream.com
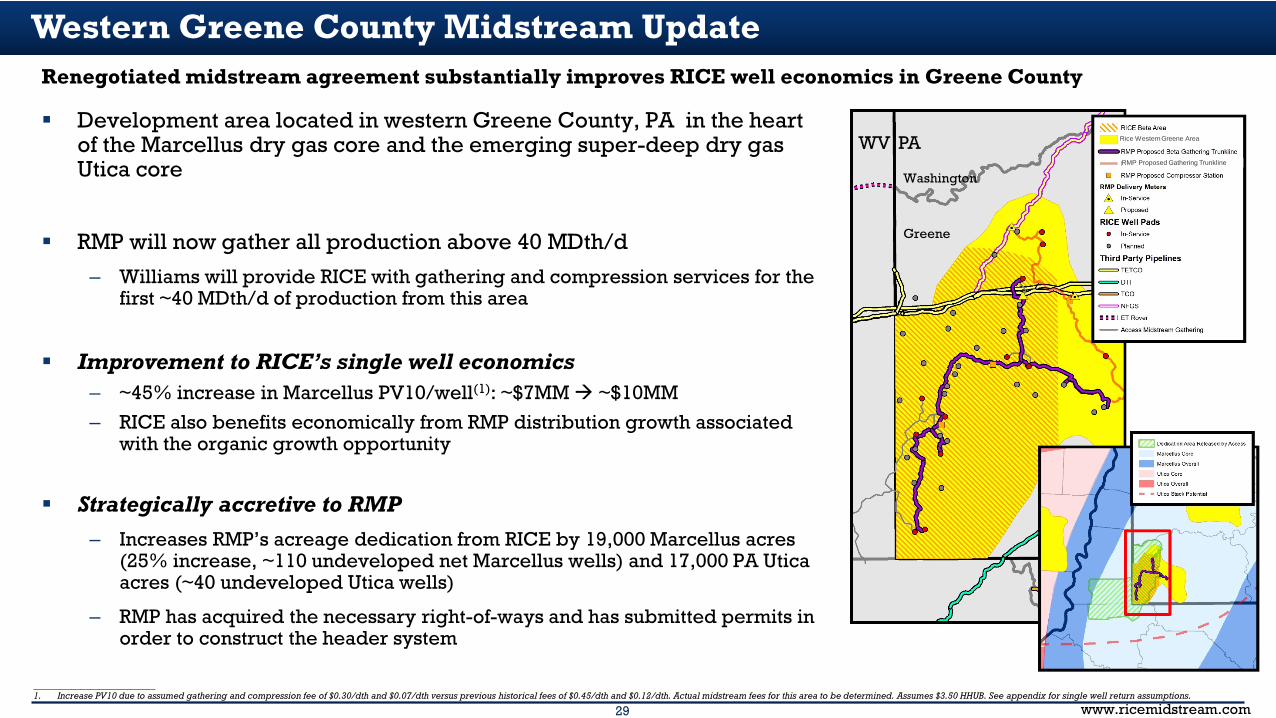
Western Greene County Midstream Update
Development area located in western Greene County, PA in the heart of the Marcellus dry gas core and the emerging super-deep dry gas Utica core
RMP will now gather all production above 40 MDth/d
– Williams will provide RICE with gathering and compression services for the first ~40 MDth/d of production from this area
Improvement to RICE’s single well economics– ~45% increase in Marcellus PV10/well(1): ~$7MM ~$10MM– RICE also benefits economically from RMP distribution growth associated
with the organic growth opportunity
Strategically accretive to RMP– Increases RMP’s acreage dedication from RICE by 19,000 Marcellus acres
(25% increase, ~110 undeveloped net Marcellus wells) and 17,000 PA Utica acres (~40 undeveloped Utica wells)
– RMP has acquired the necessary right-of-ways and has submitted permits in order to construct the header system
Renegotiated midstream agreement substantially improves RICE well economics in Greene County
__________________________1. Increase PV10 due to assumed gathering and compression fee of $0.30/dth and $0.07/dth versus previous historical fees of $0.45/dth and $0.12/dth. Actual midstream fees for this area to be determined. Assumes $3.50 HHUB. See appendix for single well return assumptions.
PAWV
Washington
Greene
Rice Western Greene Area
RMP Proposed Gathering Trunkline
30 www.ricemidstream.com
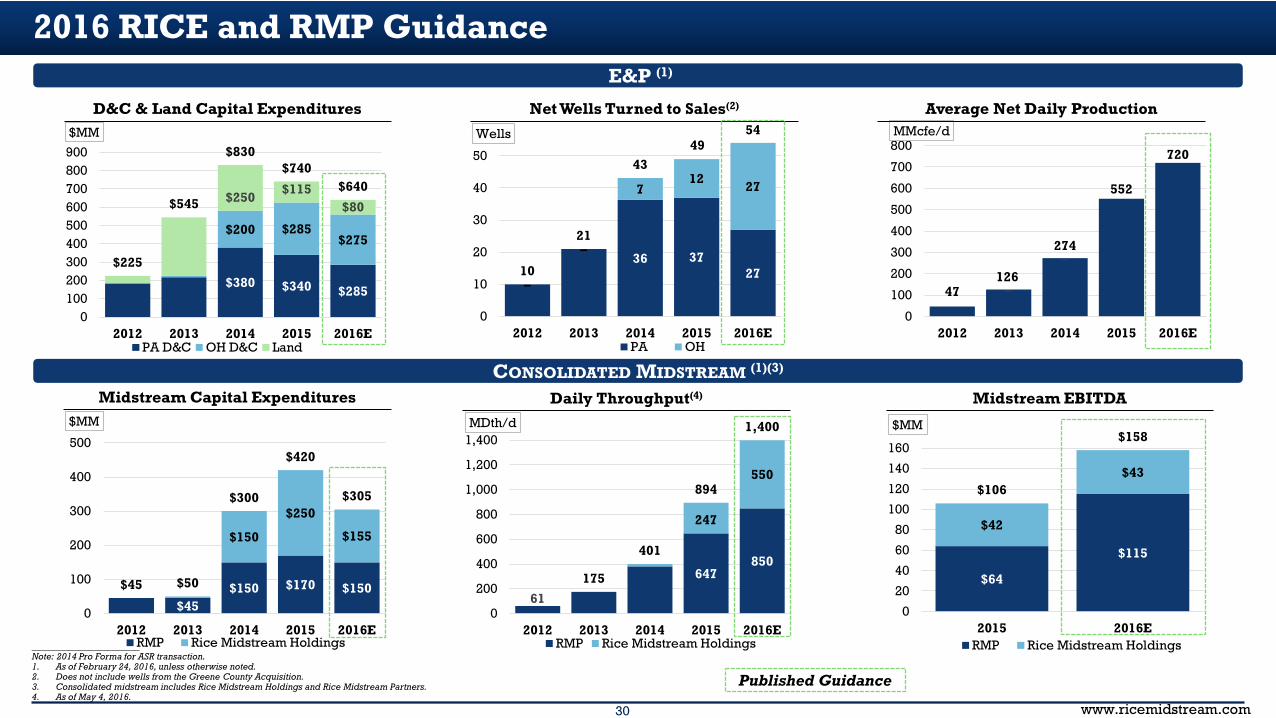
$380 $340 $285
$200 $285 $275
$250 $115
$80
$225
$545
$830 $740
$640
0100200300400500600700800900
2012 2013 2014 2015 2016E
$MM
PA D&C OH D&C Land
36 37 27
–
–
7 12 27
10
21
43 49
54
0
10
20
30
40
50
2012 2013 2014 2015 2016E
Wells
PA OH
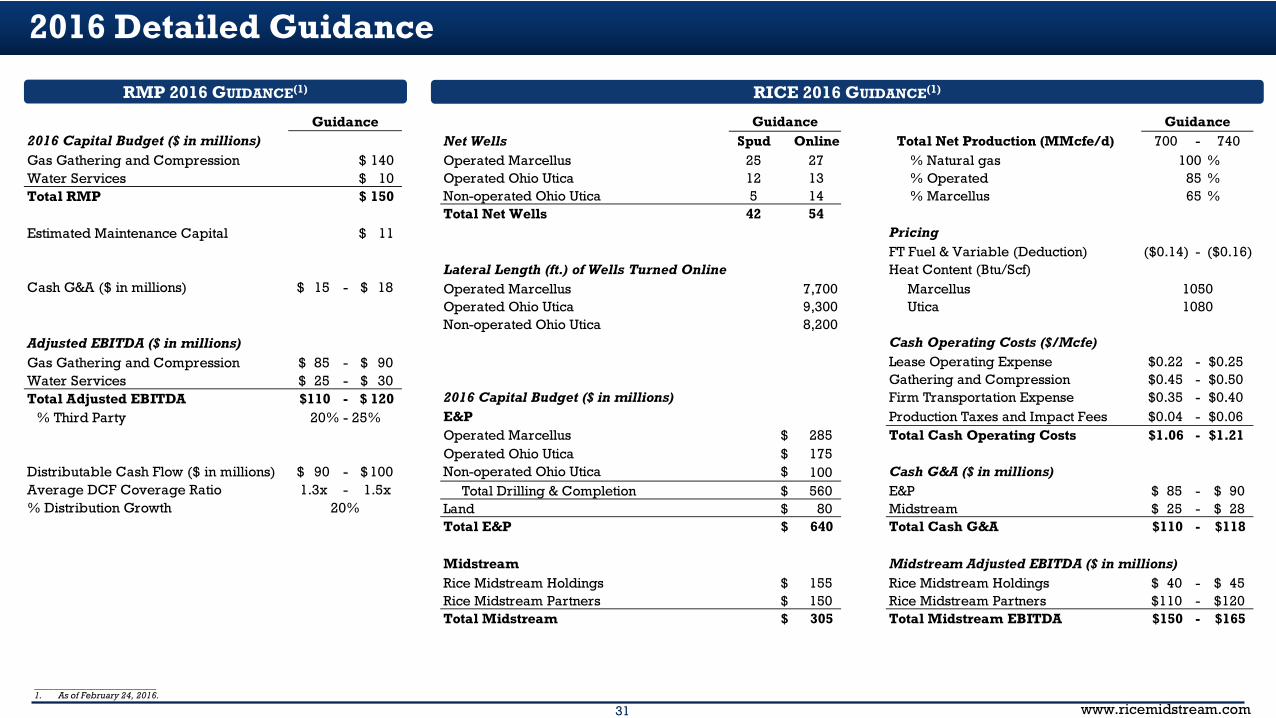
2016 RICE and RMP Guidance
_______________________Note: 2014 Pro Forma for ASR transaction.1. As of February 24, 2016, unless otherwise noted.2. Does not include wells from the Greene County Acquisition.3. Consolidated midstream includes Rice Midstream Holdings and Rice Midstream Partners.4. As of May 4, 2016.
47 126
274
552
720
–
–
0
100
200
300
400
500
600
700
800
2012 2013 2014 2015 2016E
MMcfe/d
Average Net Daily ProductionNet Wells Turned to Sales(2)
Midstream Capital Expenditures Daily Throughput(4) Midstream EBITDA
$45$150 $170 $150
$150
$250
$155
$45 $50
$300
$420
$305
0
100
200
300
400
500
2012 2013 2014 2015 2016E
$MM
RMP Rice Midstream Holdings
61
647 850
247
550
175
401
894
1,400
0
200
400
600
800
1,000
1,200
1,400
2012 2013 2014 2015 2016E
MDth/d
RMP Rice Midstream Holdings
$64
$115
$42
$43 $106
$158
0
20
40
60
80
100
120
140
160
2015 2016E
$MM
RMP Rice Midstream Holdings
Published Guidance
D&C & Land Capital Expenditures
E&P (1)
CONSOLIDATED MIDSTREAM (1)(3)
31 www.ricemidstream.com
2016 Detailed Guidance
RICE 2016 GUIDANCE(1)
__________________________1. As of February 24, 2016.
RMP 2016 GUIDANCE(1)
GuidanceNet Wells Spud Online Total Net Production (MMcfe/d) 700 - 740Operated Marcellus 25 27 % Natural gas %Operated Ohio Utica 12 13 % Operated %Non-operated Ohio Utica 5 14 % Marcellus %Total Net Wells 42 54
Pricing FT Fuel & Variable (Deduction) ($0.14) - ($0.16)
Lateral Length (ft.) of Wells Turned Online Heat Content (Btu/Scf)Operated Marcellus 7,700 MarcellusOperated Ohio Utica 9,300 UticaNon-operated Ohio Utica 8,200
Cash Operating Costs ($/Mcfe)Lease Operating Expense $0.22 - $0.25Gathering and Compression $0.45 - $0.50
2016 Capital Budget ($ in millions) Firm Transportation Expense $0.35 - $0.40E&P Production Taxes and Impact Fees $0.04 - $0.06Operated Marcellus $ 285 Total Cash Operating Costs $1.06 - $1.21Operated Ohio Utica $ 175 Non-operated Ohio Utica $ 100 Cash G&A ($ in millions)
Total Drilling & Completion $ 560 E&P 85$ - 90$ Land $ 80 Midstream 25$ - 28$ Total E&P $ 640 Total Cash G&A 110$ - 118$
Midstream Midstream Adjusted EBITDA ($ in millions)Rice Midstream Holdings $ 155 Rice Midstream Holdings 40$ - 45$ Rice Midstream Partners $ 150 Rice Midstream Partners 110$ - 120$ Total Midstream $ 305 Total Midstream EBITDA 150$ - 165$
Guidance
1050
10085
1080
65
2016 Capital Budget ($ in millions)Gas Gathering and Compression $ 140 Water Services $ 10 Total RMP $ 150
Estimated Maintenance Capital $ 11
Cash G&A ($ in millions) 15$ - 18$
Adjusted EBITDA ($ in millions)Gas Gathering and Compression 85$ - 90$ Water Services 25$ - 30$ Total Adjusted EBITDA 110$ - 120$
% Third Party
Distributable Cash Flow ($ in millions) 90$ - 100$ Average DCF Coverage Ratio 1.3x - 1.5x% Distribution Growth
Guidance
20% - 25%
20%
32 www.ricemidstream.com
–
2.0
4.0
6.0
8.0
10.0
12.0
– 0.5 1.0 1.5 2.0 2.5 3.0 3.5 4.0 4.5
MM
cf/d
Years
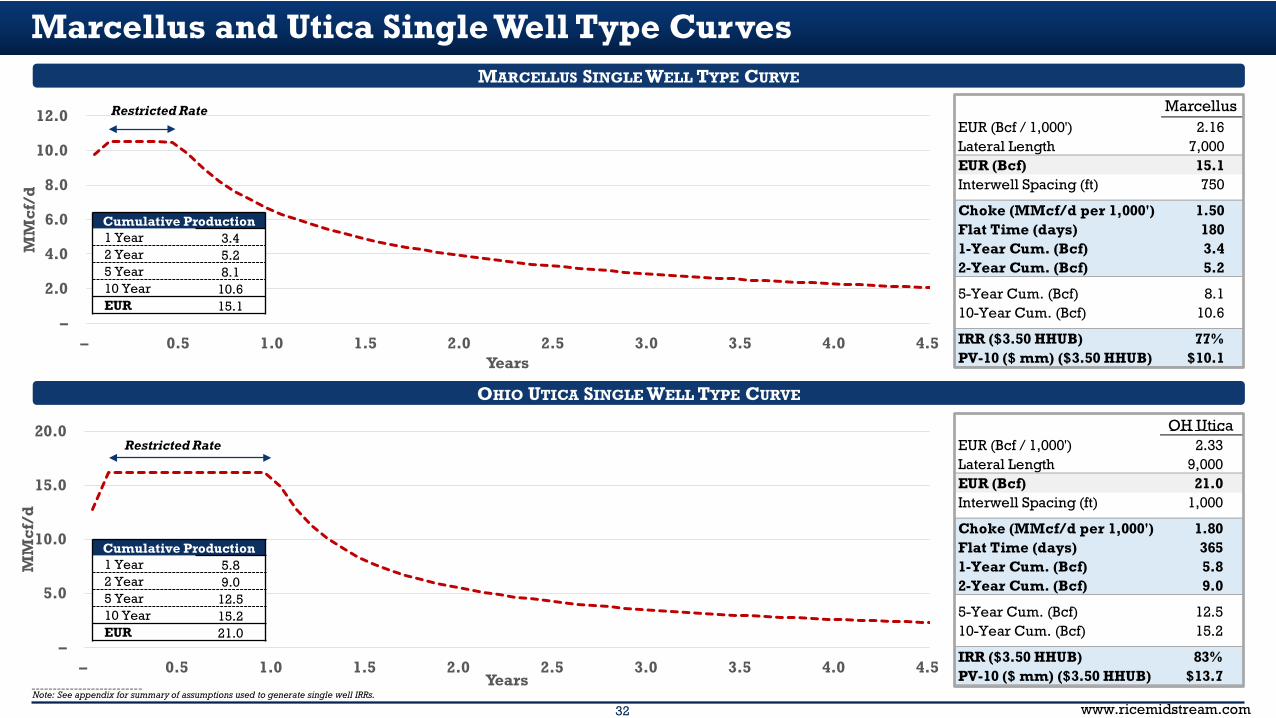
Marcellus and Utica Single Well Type Curves
__________________________Note: See appendix for summary of assumptions used to generate single well IRRs.
Restricted Rate
MARCELLUS SINGLE WELL TYPE CURVE
Cumulative Production1 Year 3.4 2 Year 5.2 5 Year 8.1 10 Year 10.6 EUR 15.1
–
5.0
10.0
15.0
20.0
– 0.5 1.0 1.5 2.0 2.5 3.0 3.5 4.0 4.5
MM
cf/d
Years
Restricted Rate
OHIO UTICA SINGLE WELL TYPE CURVE
Cumulative Production1 Year 5.8 2 Year 9.0 5 Year 12.5 10 Year 15.2 EUR 21.0
EUR (Bcf / 1,000') 2.16Lateral Length 7,000EUR (Bcf) 15.1Interwell Spacing (ft) 750
Choke (MMcf/d per 1,000') 1.50Flat Time (days) 1801-Year Cum. (Bcf) 3.42-Year Cum. (Bcf) 5.2
5-Year Cum. (Bcf) 8.110-Year Cum. (Bcf) 10.6
IRR ($3.50 HHUB) 77%PV-10 ($ mm) ($3.50 HHUB) $10.1
Marcellus
Current EUR (Bcf / 1,000') 2.33Lateral Length 9,000EUR (Bcf) 21.0Interwell Spacing (ft) 1,000
Choke (MMcf/d per 1,000') 1.80Flat Time (days) 3651-Year Cum. (Bcf) 5.82-Year Cum. (Bcf) 9.0
5-Year Cum. (Bcf) 12.510-Year Cum. (Bcf) 15.2
IRR ($3.50 HHUB) 83%PV-10 ($ mm) ($3.50 HHUB) $13.7
OH Utica
33 www.ricemidstream.com
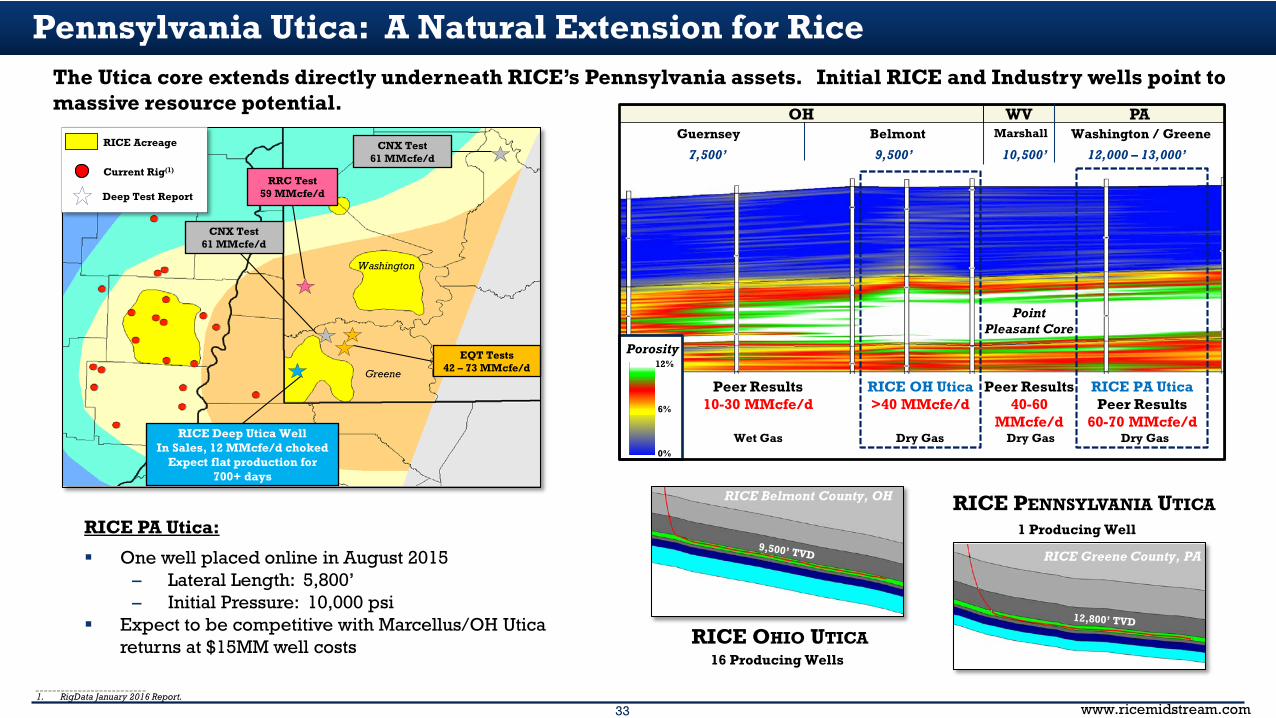
Pennsylvania Utica: A Natural Extension for Rice
RICE OH Utica>40 MMcfe/d
RICE PA Utica Peer Results
60-70 MMcfe/d
Peer Results10-30 MMcfe/d
Point Pleasant Core
__________________________1. RigData January 2016 Report.
RICE OHIO UTICA
RICE PENNSYLVANIA UTICA
16 Producing Wells
1 Producing Well
RICE Belmont County, OH
RICE Greene County, PA
10,500’ 12,000 – 13,000’9,500’7,500’
OH WVGuernsey Belmont Marshall Washington / Greene
PA
The Utica core extends directly underneath RICE’s Pennsylvania assets. Initial RICE and Industry wells point to massive resource potential.
Peer Results40-60
MMcfe/dWet Gas Dry Gas Dry Gas Dry GasRICE Deep Utica Well
In Sales, 12 MMcfe/d chokedExpect flat production for
700+ days
EQT Tests42 – 73 MMcfe/d
RRC Test59 MMcfe/d
CNX Test61 MMcfe/d
RICE Acreage
Current Rig(1)
Deep Test Report
Porosity
6%
12%
0%
CNX Test61 MMcfe/d
Washington
Greene
RICE PA Utica:
One well placed online in August 2015– Lateral Length: 5,800’– Initial Pressure: 10,000 psi
Expect to be competitive with Marcellus/OH Utica returns at $15MM well costs
34 www.ricemidstream.com
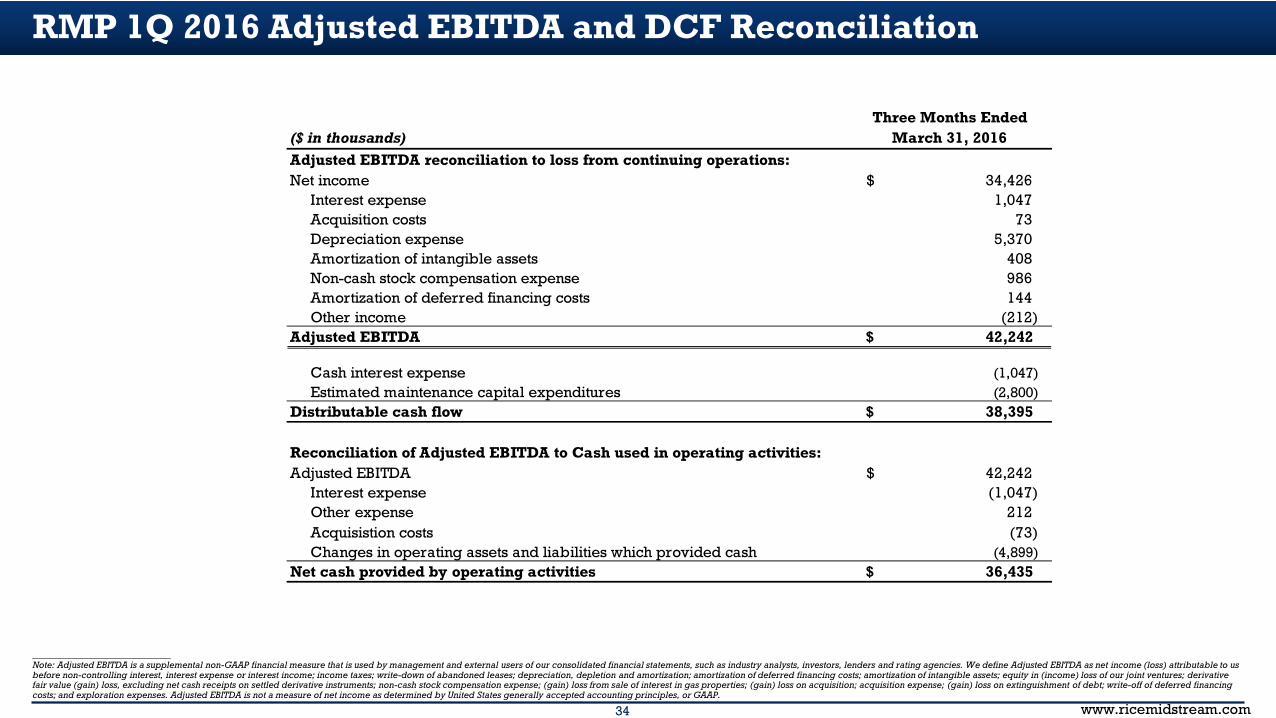
RMP 1Q 2016 Adjusted EBITDA and DCF Reconciliation
__________________________Note: Adjusted EBITDA is a supplemental non-GAAP financial measure that is used by management and external users of our consolidated financial statements, such as industry analysts, investors, lenders and rating agencies. We define Adjusted EBITDA as net income (loss) attributable to us before non-controlling interest, interest expense or interest income; income taxes; write-down of abandoned leases; depreciation, depletion and amortization; amortization of deferred financing costs; amortization of intangible assets; equity in (income) loss of our joint ventures; derivative fair value (gain) loss, excluding net cash receipts on settled derivative instruments; non-cash stock compensation expense; (gain) loss from sale of interest in gas properties; (gain) loss on acquisition; acquisition expense; (gain) loss on extinguishment of debt; write-off of deferred financing costs; and exploration expenses. Adjusted EBITDA is not a measure of net income as determined by United States generally accepted accounting principles, or GAAP.
Three Months Ended($ in thousands) March 31, 2016Adjusted EBITDA reconciliation to loss from continuing operations:Net income 34,426$
Interest expense 1,047Acquisition costs 73Depreciation expense 5,370Amortization of intangible assets 408Non-cash stock compensation expense 986Amortization of deferred financing costs 144Other income (212)
Adjusted EBITDA 42,242$
Cash interest expense (1,047) Estimated maintenance capital expenditures (2,800)
Distributable cash flow 38,395$
Reconciliation of Adjusted EBITDA to Cash used in operating activities:Adjusted EBITDA 42,242$
Interest expense (1,047) Other expense 212 Acquisistion costs (73) Changes in operating assets and liabilities which provided cash (4,899)
Net cash provided by operating activities 36,435$
35 www.ricemidstream.com
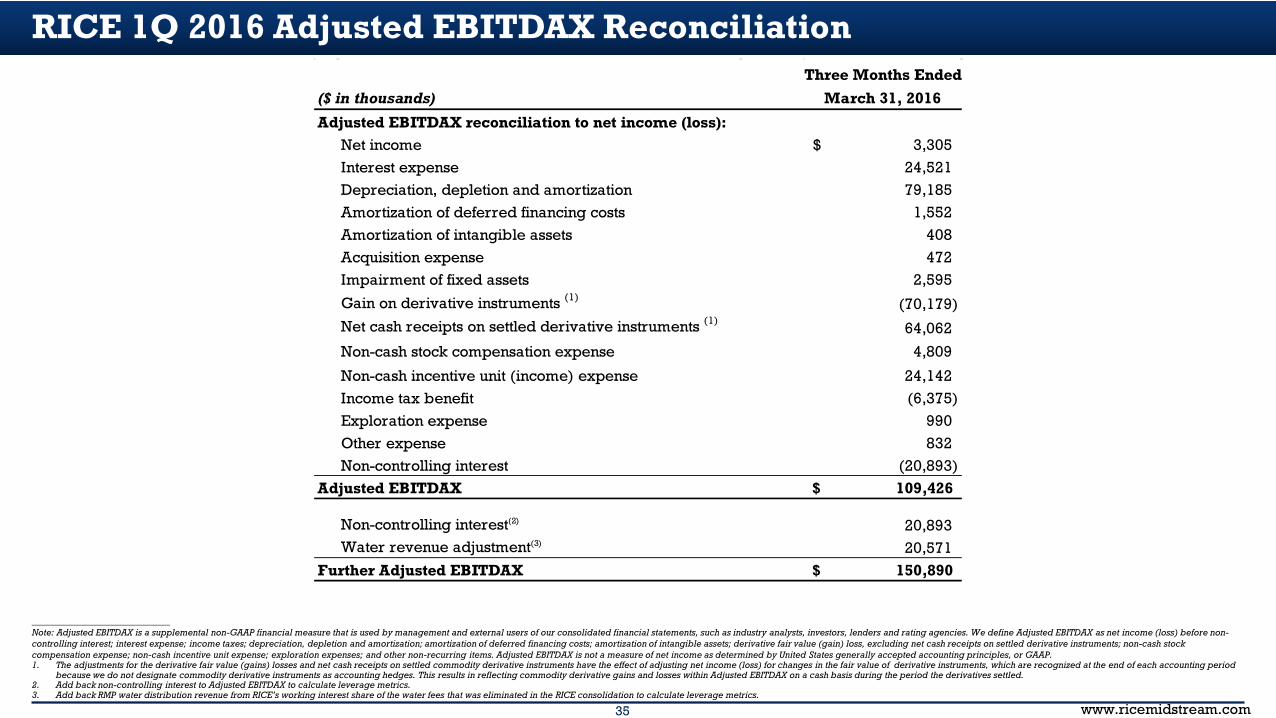
RICE 1Q 2016 Adjusted EBITDAX Reconciliation
__________________________Note: Adjusted EBITDAX is a supplemental non-GAAP financial measure that is used by management and external users of our consolidated financial statements, such as industry analysts, investors, lenders and rating agencies. We define Adjusted EBITDAX as net income (loss) before non-controlling interest; interest expense; income taxes; depreciation, depletion and amortization; amortization of deferred financing costs; amortization of intangible assets; derivative fair value (gain) loss, excluding net cash receipts on settled derivative instruments; non-cash stock compensation expense; non-cash incentive unit expense; exploration expenses; and other non-recurring items. Adjusted EBITDAX is not a measure of net income as determined by United States generally accepted accounting principles, or GAAP.1. The adjustments for the derivative fair value (gains) losses and net cash receipts on settled commodity derivative instruments have the effect of adjusting net income (loss) for changes in the fair value of derivative instruments, which are recognized at the end of each accounting period
because we do not designate commodity derivative instruments as accounting hedges. This results in reflecting commodity derivative gains and losses within Adjusted EBITDAX on a cash basis during the period the derivatives settled.2. Add back non-controlling interest to Adjusted EBITDAX to calculate leverage metrics.3. Add back RMP water distribution revenue from RICE’s working interest share of the water fees that was eliminated in the RICE consolidation to calculate leverage metrics.
Three Months Ended($ in thousands) March 31, 2016
Adjusted EBITDAX reconciliation to net income (loss):Net income 3,305$ Interest expense 24,521Depreciation, depletion and amortization 79,185Amortization of deferred financing costs 1,552Amortization of intangible assets 408Acquisition expense 472Impairment of fixed assets 2,595
Gain on derivative instruments (1) (70,179)Net cash receipts on settled derivative instruments (1)
64,062
Non-cash stock compensation expense 4,809
Non-cash incentive unit (income) expense 24,142Income tax benefit (6,375)Exploration expense 990Other expense 832Non-controlling interest (20,893)
Adjusted EBITDAX 109,426$
Non-controlling interest(2) 20,893Water revenue adjustment(3) 20,571
Further Adjusted EBITDAX 150,890$
36 www.ricemidstream.com
Disclaimer
FORWARD-LOOKING STATEMENTSThis presentation and the oral statements made in connection therewith may contain “forward looking statements” within the meaning of the securities laws. All statements, other than statements of historical fact, regarding Rice Midstream’s strategy, future operations, financial position, estimated revenues and income/losses, projected costs, prospects, plans and objectives of management are forward-looking statements. These statements often include the words “could,” “may,” “assume,” “forecast,” “position,” “predict,” “strategy,” “expect,” “intend,” “plan,” “estimate,” “anticipate,” “believe,” “project,” “budget,” “potential,” or “continue,” and similar expressions are intended to identify forward-looking statements, although not all forward-looking statements contain such identifying words. Without limiting the generality of the foregoing, forward-looking statements contained in this presentation specifically include expectations of plans, strategies, objectives, anticipated financial and operating results of Rice Midstream. These forward-looking statements are based on Rice Midstream's current expectations and assumptions about future events and are based on currently available information as to the outcome and timing of future events. Rice Midstream assumes no obligation to and does not intend to update any forward looking statements included herein. You are cautioned not to place undue reliance on any forward-looking statements. Rice Midstream cautions you that these forward-looking statements are subject to all of the risks and uncertainties, most of which are difficult to predict and many of which are beyond their control, incident to our gathering and compression and water services business. These risks include, but are not limited to, commodity price volatility; environmental risks; regulatory changes; the uncertainty inherent in projecting throughput volumes, cash flow and access to capital; the timing of development expenditures of RICE and our other customers; and the other risks described under “Risk Factors” in Rice Midstream’s most recent Form 10-K, Form 10-Q and other filings with the Securities and Exchange Commission. Should one or more of these risks or uncertainties occur, or should underlying assumptions prove incorrect, Rice Midstream’s actual results and plans could differ materially from those expressed in any forward-looking statements.This presentation has been prepared by Rice Midstream and includes market data and other statistical information from sources believed by Rice Midstream to be reliable, including independent industry publications, government publications or other published independent sources. Some data are also based on Rice Midstream’s good faith estimates, which are derived from its review of internal sources as well as the independent sources described above. Although Rice Midstream believes these sources are reliable, it has not independently verified the information and cannot guarantee its accuracy and completeness.
37 www.ricemidstream.com
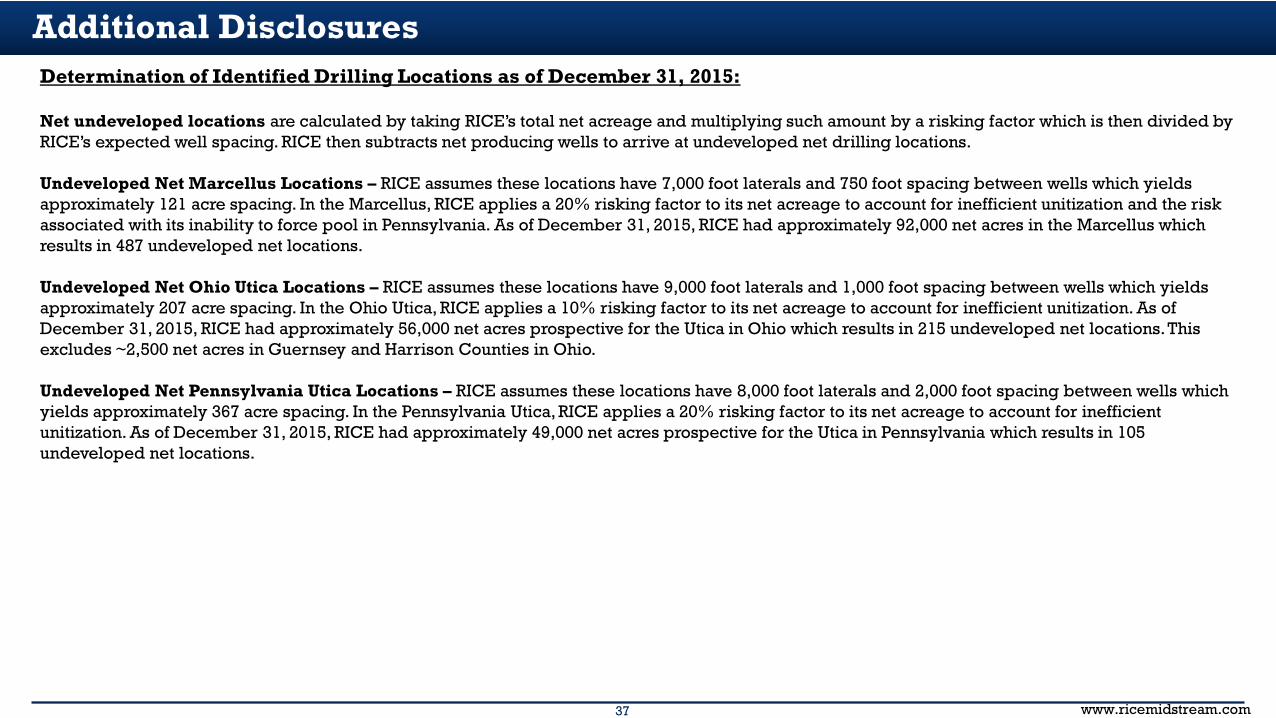
Determination of Identified Drilling Locations as of December 31, 2015:
Net undeveloped locations are calculated by taking RICE’s total net acreage and multiplying such amount by a risking factor which is then divided by RICE’s expected well spacing. RICE then subtracts net producing wells to arrive at undeveloped net drilling locations.
Undeveloped Net Marcellus Locations – RICE assumes these locations have 7,000 foot laterals and 750 foot spacing between wells which yields approximately 121 acre spacing. In the Marcellus, RICE applies a 20% risking factor to its net acreage to account for inefficient unitization and the risk associated with its inability to force pool in Pennsylvania. As of December 31, 2015, RICE had approximately 92,000 net acres in the Marcellus which results in 487 undeveloped net locations.
Undeveloped Net Ohio Utica Locations – RICE assumes these locations have 9,000 foot laterals and 1,000 foot spacing between wells which yields approximately 207 acre spacing. In the Ohio Utica, RICE applies a 10% risking factor to its net acreage to account for inefficient unitization. As of December 31, 2015, RICE had approximately 56,000 net acres prospective for the Utica in Ohio which results in 215 undeveloped net locations. This excludes ~2,500 net acres in Guernsey and Harrison Counties in Ohio.
Undeveloped Net Pennsylvania Utica Locations – RICE assumes these locations have 8,000 foot laterals and 2,000 foot spacing between wells which yields approximately 367 acre spacing. In the Pennsylvania Utica, RICE applies a 20% risking factor to its net acreage to account for inefficient unitization. As of December 31, 2015, RICE had approximately 49,000 net acres prospective for the Utica in Pennsylvania which results in 105 undeveloped net locations.
Additional Disclosures